Clock Diagram
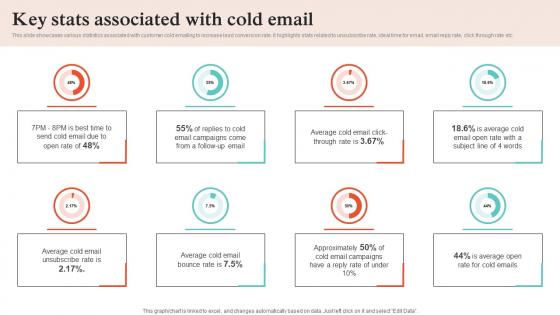
Virtual Sales Strategies Key Stats Associated With Cold Email Strategy SS V
This slide showcases various statistics associated with customer cold emailing to increase lead conversion rate. It highlights stats related to unsubscribe rate, ideal time for email, email reply rate, click through rate etc. Slidegeeks has constructed Virtual Sales Strategies Key Stats Associated With Cold Email Strategy SS V after conducting extensive research and examination. These presentation templates are constantly being generated and modified based on user preferences and critiques from editors. Here, you will find the most attractive templates for a range of purposes while taking into account ratings and remarks from users regarding the content. This is an excellent jumping-off point to explore our content and will give new users an insight into our top-notch PowerPoint Templates. This slide showcases various statistics associated with customer cold emailing to increase lead conversion rate. It highlights stats related to unsubscribe rate, ideal time for email, email reply rate, click through rate etc.
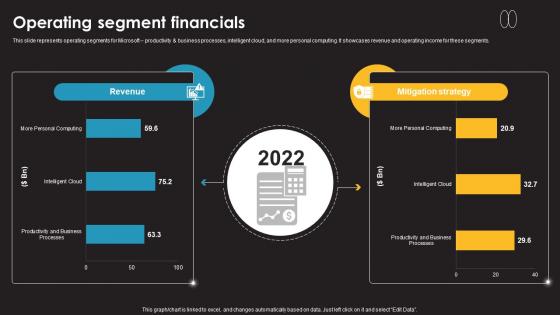
Operating Segment Financials Information Technology Services Provider Company Profile CP SS V
This slide represents operating segments for Microsoft productivity and business processes, intelligent cloud, and more personal computing. It showcases revenue and operating income for these segments.Formulating a presentation can take up a lot of effort and time, so the content and message should always be the primary focus. The visuals of the PowerPoint can enhance the presenters message, so our Operating Segment Financials Information Technology Services Provider Company Profile CP SS V was created to help save time. Instead of worrying about the design, the presenter can concentrate on the message while our designers work on creating the ideal templates for whatever situation is needed. Slidegeeks has experts for everything from amazing designs to valuable content, we have put everything into Operating Segment Financials Information Technology Services Provider Company Profile CP SS V. This slide represents operating segments for Microsoft productivity and business processes, intelligent cloud, and more personal computing. It showcases revenue and operating income for these segments.
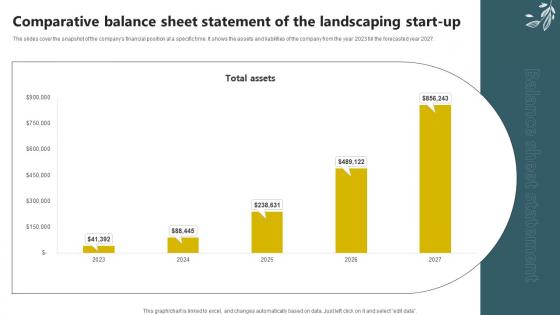
Sample Trugreen Business Plan Comparative Balance Sheet Statement Of The Landscaping BP SS V
The slides cover the snapshot of the companys financial position at a specific time. It shows the assets and liabilities of the company from the year 2023 till the forecasted year 2027. Want to ace your presentation in front of a live audience Our Sample Trugreen Business Plan Comparative Balance Sheet Statement Of The Landscaping BP SS V can help you do that by engaging all the users towards you. Slidegeeks experts have put their efforts and expertise into creating these impeccable powerpoint presentations so that you can communicate your ideas clearly. Moreover, all the templates are customizable, and easy-to-edit and downloadable. Use these for both personal and commercial use. The slides cover the snapshot of the companys financial position at a specific time. It shows the assets and liabilities of the company from the year 2023 till the forecasted year 2027.
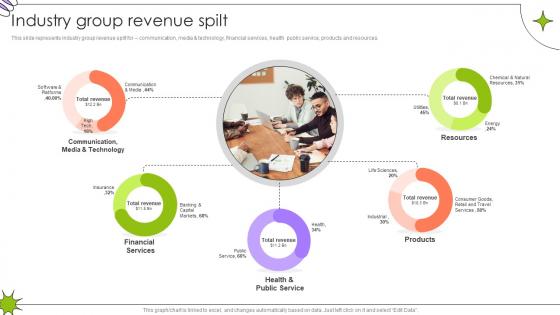
Industry Group Revenue Spilt Global Innovation And Business Solutions Company Profile CP SS V
This slide represents industry group revenue spilt for communication, media and technology, financial services, health public service, products and resources.Formulating a presentation can take up a lot of effort and time, so the content and message should always be the primary focus. The visuals of the PowerPoint can enhance the presenters message, so our Industry Group Revenue Spilt Global Innovation And Business Solutions Company Profile CP SS V was created to help save time. Instead of worrying about the design, the presenter can concentrate on the message while our designers work on creating the ideal templates for whatever situation is needed. Slidegeeks has experts for everything from amazing designs to valuable content, we have put everything into Industry Group Revenue Spilt Global Innovation And Business Solutions Company Profile CP SS V. This slide represents industry group revenue spilt for communication, media and technology, financial services, health public service, products and resources.
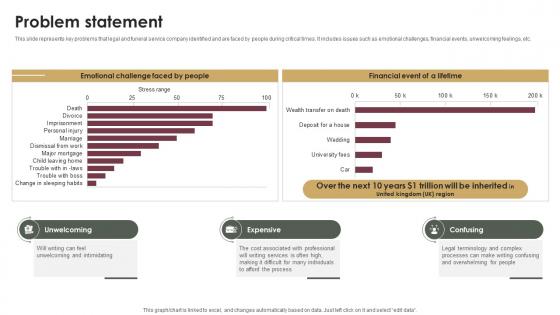
Problem Statement Probate Assistance Solutions Company Investor Funding Elevator Pitch Deck
This slide represents key problems that legal and funeral service company identified and are faced by people during critical times. It includes issues such as emotional challenges, financial events, unwelcoming feelings, etc.Make sure to capture your audiences attention in your business displays with our gratis customizable Problem Statement Probate Assistance Solutions Company Investor Funding Elevator Pitch Deck. These are great for business strategies, office conferences, capital raising or task suggestions. If you desire to acquire more customers for your tech business and ensure they stay satisfied, create your own sales presentation with these plain slides. This slide represents key problems that legal and funeral service company identified and are faced by people during critical times. It includes issues such as emotional challenges, financial events, unwelcoming feelings, etc.
Cryptocurrency Portfolio Tracking Dashboard Summary Cryptocurrency Management With Blockchain
This slide represents the cryptocurrency performance indicators for the individual. The key components include invested money, profit and loss, rate of investment ROI, current valuation of money, etc.Formulating a presentation can take up a lot of effort and time, so the content and message should always be the primary focus. The visuals of the PowerPoint can enhance the presenters message, so our Cryptocurrency Portfolio Tracking Dashboard Summary Cryptocurrency Management With Blockchain was created to help save time. Instead of worrying about the design, the presenter can concentrate on the message while our designers work on creating the ideal templates for whatever situation is needed. Slidegeeks has experts for everything from amazing designs to valuable content, we have put everything into Cryptocurrency Portfolio Tracking Dashboard Summary Cryptocurrency Management With Blockchain. This slide represents the cryptocurrency performance indicators for the individual. The key components include invested money, profit and loss, rate of investment ROI, current valuation of money, etc.
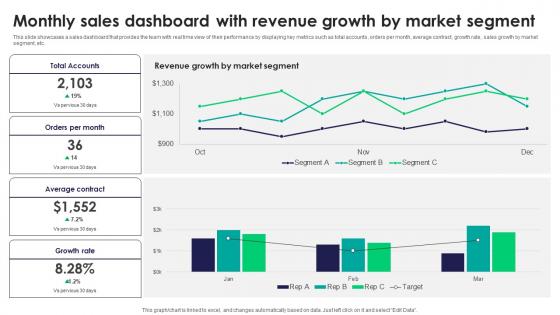
Monthly Sales Dashboard With Revenue Growth By Tactics For Improving Field Sales Team SA SS V
This slide showcases a sales dashboard that provides the team with real time view of their performance by displaying key metrics such as total accounts, orders per month, average contract, growth rate, sales growth by market segment, etc. The Monthly Sales Dashboard With Revenue Growth By Tactics For Improving Field Sales Team SA SS V is a compilation of the most recent design trends as a series of slides. It is suitable for any subject or industry presentation, containing attractive visuals and photo spots for businesses to clearly express their messages. This template contains a variety of slides for the user to input data, such as structures to contrast two elements, bullet points, and slides for written information. Slidegeeks is prepared to create an impression. This slide showcases a sales dashboard that provides the team with real time view of their performance by displaying key metrics such as total accounts, orders per month, average contract, growth rate, sales growth by market segment, etc.
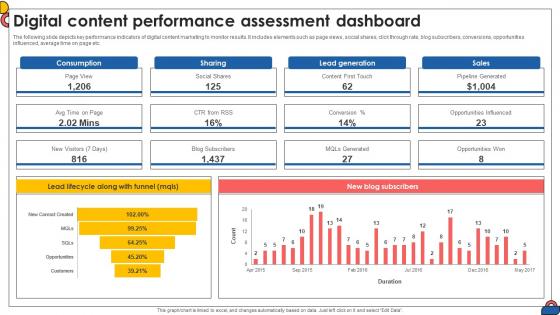
Digital Content Performance Assessment Dashboard Comprehensive Guide To Implement Strategy SS V
The following slide depicts key performance indicators of digital content marketing to monitor results. It includes elements such as page views, social shares, click through rate, blog subscribers, conversions, opportunities influenced, average time on page etc.If your project calls for a presentation, then Slidegeeks is your go-to partner because we have professionally designed, easy-to-edit templates that are perfect for any presentation. After downloading, you can easily edit Digital Content Performance Assessment Dashboard Comprehensive Guide To Implement Strategy SS V and make the changes accordingly. You can rearrange slides or fill them with different images. Check out all the handy templates The following slide depicts key performance indicators of digital content marketing to monitor results. It includes elements such as page views, social shares, click through rate, blog subscribers, conversions, opportunities influenced, average time on page etc.
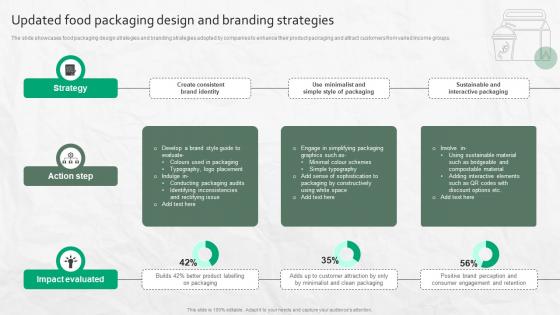
Updated Food Packaging Design And Branding Strategies
The slide showcases food packaging design strategies and branding strategies adopted by companies to enhance their product packaging and attract customers from varied income groups.Formulating a presentation can take up a lot of effort and time, so the content and message should always be the primary focus. The visuals of the PowerPoint can enhance the presenters message, so our Updated Food Packaging Design And Branding Strategies was created to help save time. Instead of worrying about the design, the presenter can concentrate on the message while our designers work on creating the ideal templates for whatever situation is needed. Slidegeeks has experts for everything from amazing designs to valuable content, we have put everything into Updated Food Packaging Design And Branding Strategies. The slide showcases food packaging design strategies and branding strategies adopted by companies to enhance their product packaging and attract customers from varied income groups.
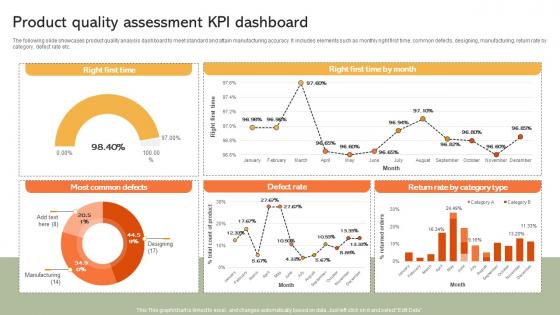
Product Quality Assessment KPI Dashboard Implementing Manufacturing Strategy SS V
The following slide showcases product quality analysis dashboard to meet standard and attain manufacturing accuracy. It includes elements such as monthly right first time, common defects, designing, manufacturing, return rate by category, defect rate etc. Take your projects to the next level with our ultimate collection of Product Quality Assessment KPI Dashboard Implementing Manufacturing Strategy SS V. Slidegeeks has designed a range of layouts that are perfect for representing task or activity duration, keeping track of all your deadlines at a glance. Tailor these designs to your exact needs and give them a truly corporate look with your own brand colors they will make your projects stand out from the rest The following slide showcases product quality analysis dashboard to meet standard and attain manufacturing accuracy. It includes elements such as monthly right first time, common defects, designing, manufacturing, return rate by category, defect rate etc.
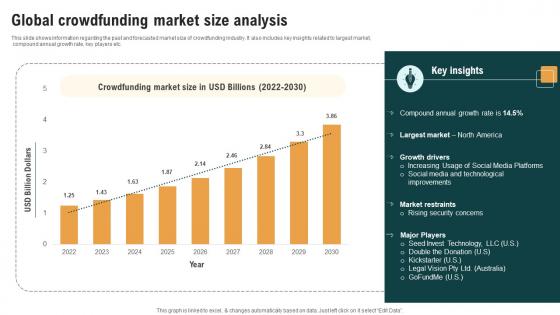
Global Crowdfunding Market Size Analysis Real Estate Crowdfunding To Unlock Fin SS V
Formulating a presentation can take up a lot of effort and time, so the content and message should always be the primary focus. The visuals of the PowerPoint can enhance the presenters message, so our Global Crowdfunding Market Size Analysis Real Estate Crowdfunding To Unlock Fin SS V was created to help save time. Instead of worrying about the design, the presenter can concentrate on the message while our designers work on creating the ideal templates for whatever situation is needed. Slidegeeks has experts for everything from amazing designs to valuable content, we have put everything into Global Crowdfunding Market Size Analysis Real Estate Crowdfunding To Unlock Fin SS V This slide shows information regarding the past and forecasted market size of crowdfunding industry. It also includes key insights related to largest market, compound annual growth rate, key players etc.
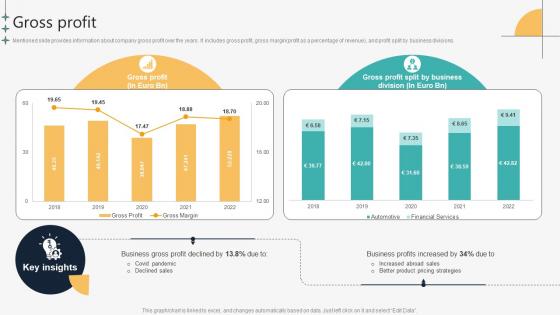
Gross Profit Automotive Manufacturing Company Profile CP SS V
Mentioned slide provides information about company gross profit over the years. It includes gross profit, gross margin profit as a percentage of revenue , and profit split by business divisions.Formulating a presentation can take up a lot of effort and time, so the content and message should always be the primary focus. The visuals of the PowerPoint can enhance the presenters message, so our Gross Profit Automotive Manufacturing Company Profile CP SS V was created to help save time. Instead of worrying about the design, the presenter can concentrate on the message while our designers work on creating the ideal templates for whatever situation is needed. Slidegeeks has experts for everything from amazing designs to valuable content, we have put everything into Gross Profit Automotive Manufacturing Company Profile CP SS V. Mentioned slide provides information about company gross profit over the years. It includes gross profit, gross marginandprofit as a percentage of revenueand, and profit split by business divisions.
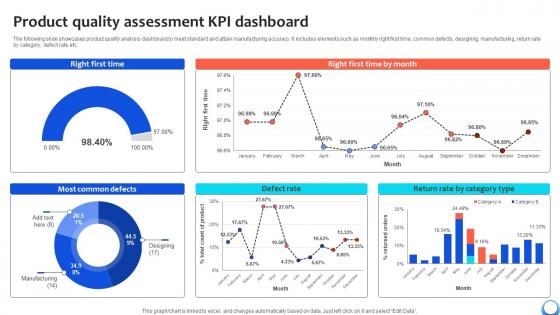
Product Quality Assessment KPI Dashboard Automating Production Process Strategy SS V
The following slide showcases product quality analysis dashboard to meet standard and attain manufacturing accuracy. It includes elements such as monthly right first time, common defects, designing, manufacturing, return rate by category, defect rate etc. Take your projects to the next level with our ultimate collection of Product Quality Assessment KPI Dashboard Automating Production Process Strategy SS V. Slidegeeks has designed a range of layouts that are perfect for representing task or activity duration, keeping track of all your deadlines at a glance. Tailor these designs to your exact needs and give them a truly corporate look with your own brand colors they will make your projects stand out from the rest The following slide showcases product quality analysis dashboard to meet standard and attain manufacturing accuracy. It includes elements such as monthly right first time, common defects, designing, manufacturing, return rate by category, defect rate etc.
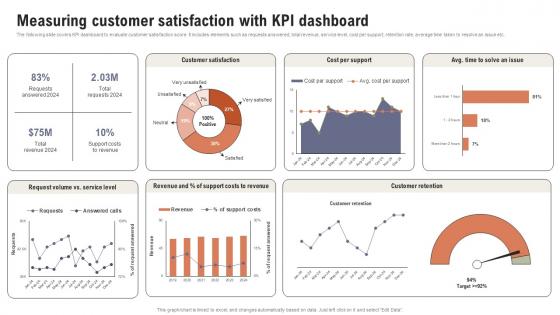
Measuring Customer Satisfaction With KPI Boosting Customer Retention Rate With Live Chat
The following slide covers KPI dashboard to evaluate customer satisfaction score. It includes elements such as requests answered, total revenue, service level, cost per support, retention rate, average time taken to resolve an issue etc. This modern and well-arranged Measuring Customer Satisfaction With KPI Boosting Customer Retention Rate With Live Chat provides lots of creative possibilities. It is very simple to customize and edit with the Powerpoint Software. Just drag and drop your pictures into the shapes. All facets of this template can be edited with Powerpoint, no extra software is necessary. Add your own material, put your images in the places assigned for them, adjust the colors, and then you can show your slides to the world, with an animated slide included. The following slide covers KPI dashboard to evaluate customer satisfaction score. It includes elements such as requests answered, total revenue, service level, cost per support, retention rate, average time taken to resolve an issue etc.
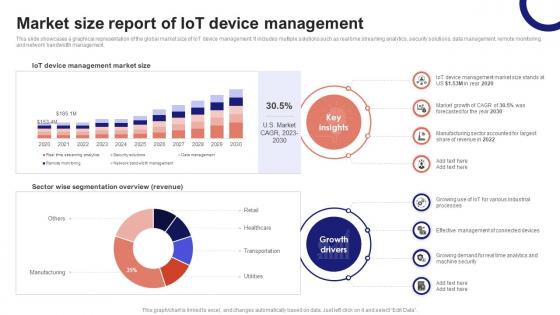
IoT Device Management Fundamentals Market Size Report Of IoT Device Management IoT Ss V
This slide showcases a graphical representation of the global market size of IoT device management. It includes multiple solutions such as real time streaming analytics, security solutions, data management, remote monitoring, and network bandwidth management. Slidegeeks has constructed IoT Device Management Fundamentals Market Size Report Of IoT Device Management IoT SS V after conducting extensive research and examination. These presentation templates are constantly being generated and modified based on user preferences and critiques from editors. Here, you will find the most attractive templates for a range of purposes while taking into account ratings and remarks from users regarding the content. This is an excellent jumping-off point to explore our content and will give new users an insight into our top-notch PowerPoint Templates. This slide showcases a graphical representation of the global market size of IoT device management. It includes multiple solutions such as real time streaming analytics, security solutions, data management, remote monitoring, and network bandwidth management.

Hr Recruitment Dashboard Showcasing Open Positions By Analysing Hr Data For Effective Decision Making
This slide showcases a dashboard that helps organizations track and monitor the hiring process. It includes total applicants, shortlisted candidates, hired candidates, rejected candidates, time to hire, cost to hire, etc. The Hr Recruitment Dashboard Showcasing Open Positions By Analysing Hr Data For Effective Decision Making is a compilation of the most recent design trends as a series of slides. It is suitable for any subject or industry presentation, containing attractive visuals and photo spots for businesses to clearly express their messages. This template contains a variety of slides for the user to input data, such as structures to contrast two elements, bullet points, and slides for written information. Slidegeeks is prepared to create an impression. This slide showcases a dashboard that helps organizations track and monitor the hiring process. It includes total applicants, shortlisted candidates, hired candidates, rejected candidates, time to hire, cost to hire, etc.

Monthly Sales Dashboard With Revenue Efficient Sales Territory Management To Build SA SS V
This slide showcases a sales dashboard that provides the team with real time view of their performance by displaying key metrics such as total accounts, orders per month, average contract, growth rate, sales growth by market segment, etc. The Monthly Sales Dashboard With Revenue Efficient Sales Territory Management To Build SA SS V is a compilation of the most recent design trends as a series of slides. It is suitable for any subject or industry presentation, containing attractive visuals and photo spots for businesses to clearly express their messages. This template contains a variety of slides for the user to input data, such as structures to contrast two elements, bullet points, and slides for written information. Slidegeeks is prepared to create an impression. This slide showcases a sales dashboard that provides the team with real time view of their performance by displaying key metrics such as total accounts, orders per month, average contract, growth rate, sales growth by market segment, etc.
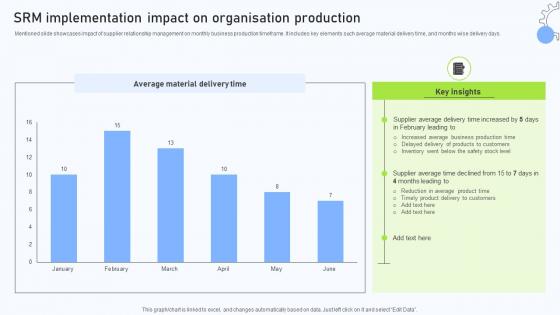
Relationship Management Automation SRM Implementation Impact On Organisation Production
Mentioned slide showcases impact of supplier relationship management on monthly business production timeframe. It includes key elements such average material delivery time, and months wise delivery days. From laying roadmaps to briefing everything in detail, our templates are perfect for you. You can set the stage with your presentation slides. All you have to do is download these easy-to-edit and customizable templates. Relationship Management Automation SRM Implementation Impact On Organisation Production will help you deliver an outstanding performance that everyone would remember and praise you for. Do download this presentation today. Mentioned slide showcases impact of supplier relationship management on monthly business production timeframe. It includes key elements such average material delivery time, and months wise delivery days.
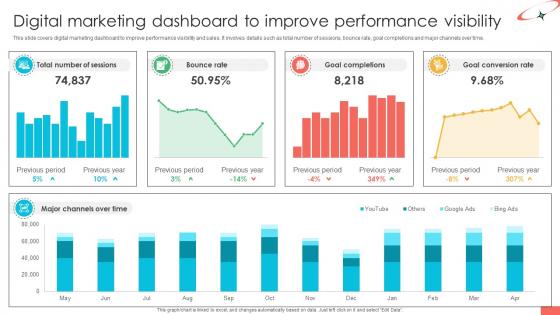
Marketing Strategies For Effective Digital Marketing Dashboard To Improve
This slide covers digital marketing dashboard to improve performance visibility and sales. It involves details such as total number of sessions, bounce rate, goal completions and major channels over time. Do you have an important presentation coming up Are you looking for something that will make your presentation stand out from the rest Look no further than Marketing Strategies For Effective Digital Marketing Dashboard To Improve. With our professional designs, you can trust that your presentation will pop and make delivering it a smooth process. And with Slidegeeks, you can trust that your presentation will be unique and memorable. So why wait Grab Marketing Strategies For Effective Digital Marketing Dashboard To Improve today and make your presentation stand out from the rest This slide covers digital marketing dashboard to improve performance visibility and sales. It involves details such as total number of sessions, bounce rate, goal completions and major channels over time.
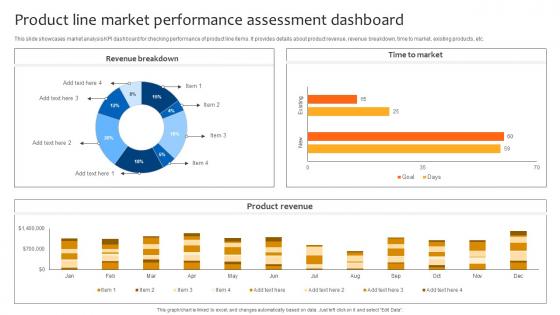
Deploying Strategies For Business Product Line Market Performance Assessment Dashboard Strategy SS V
This slide showcases market analysis KPI dashboard for checking performance of product line items. It provides details about product revenue, revenue breakdown, time to market, existing products, etc. Take your projects to the next level with our ultimate collection of Deploying Strategies For Business Product Line Market Performance Assessment Dashboard Strategy SS V. Slidegeeks has designed a range of layouts that are perfect for representing task or activity duration, keeping track of all your deadlines at a glance. Tailor these designs to your exact needs and give them a truly corporate look with your own brand colors they will make your projects stand out from the rest This slide showcases market analysis KPI dashboard for checking performance of product line items. It provides details about product revenue, revenue breakdown, time to market, existing products, etc.
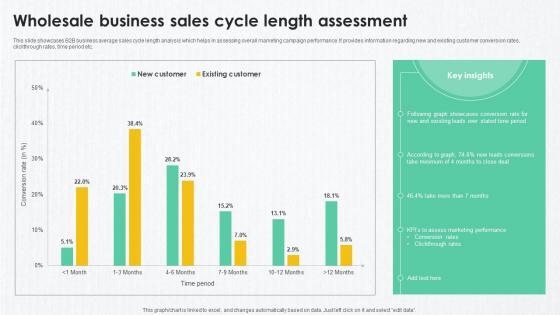
B2B Marketing Techniques Wholesale Business Sales Cycle Length Assessment
This slide showcases B2B business average sales cycle length analysis which helps in assessing overall marketing campaign performance. It provides information regarding new and existing customer conversion rates, clickthrough rates, time period etc. Slidegeeks is here to make your presentations a breeze with B2B Marketing Techniques Wholesale Business Sales Cycle Length Assessment With our easy-to-use and customizable templates, you can focus on delivering your ideas rather than worrying about formatting. With a variety of designs to choose from, you are sure to find one that suits your needs. And with animations and unique photos, illustrations, and fonts, you can make your presentation pop. So whether you are giving a sales pitch or presenting to the board, make sure to check out Slidegeeks first This slide showcases B2B business average sales cycle length analysis which helps in assessing overall marketing campaign performance. It provides information regarding new and existing customer conversion rates, clickthrough rates, time period etc.
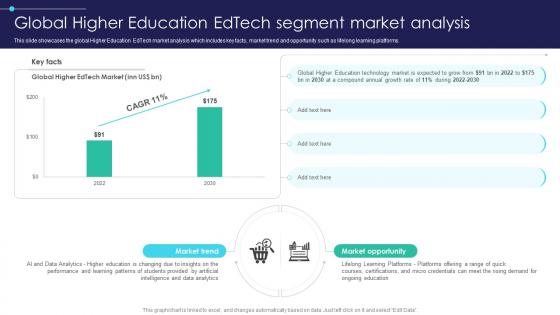
Global Digital Education Global Higher Education Edtech Segment Market Analysis IR SS V
This slide showcases the global Higher Education EdTech market analysis which includes key facts, market trend and opportunity such as lifelong learning platforms. Formulating a presentation can take up a lot of effort and time, so the content and message should always be the primary focus. The visuals of the PowerPoint can enhance the presenters message, so our Global Digital Education Global Higher Education Edtech Segment Market Analysis IR SS V was created to help save time. Instead of worrying about the design, the presenter can concentrate on the message while our designers work on creating the ideal templates for whatever situation is needed. Slidegeeks has experts for everything from amazing designs to valuable content, we have put everything into Global Digital Education Global Higher Education Edtech Segment Market Analysis IR SS V. This slide showcases the global Higher Education EdTech market analysis which includes key facts, market trend and opportunity such as lifelong learning platforms.
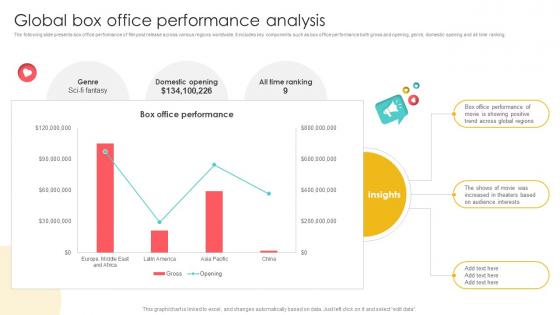
Marketing Channels For Movie Global Box Office Performance Analysis Strategy SS V
The following slide presents box office performance of film post release across various regions worldwide. It includes key components such as box office performance both gross and opening, genre, domestic opening and all time ranking. This Marketing Channels For Movie Global Box Office Performance Analysis Strategy SS V is perfect for any presentation, be it in front of clients or colleagues. It is a versatile and stylish solution for organizing your meetings. The Marketing Channels For Movie Global Box Office Performance Analysis Strategy SS V features a modern design for your presentation meetings. The adjustable and customizable slides provide unlimited possibilities for acing up your presentation. Slidegeeks has done all the homework before launching the product for you. So, do not wait, grab the presentation templates today The following slide presents box office performance of film post release across various regions worldwide. It includes key components such as box office performance both gross and opening, genre, domestic opening and all time ranking.
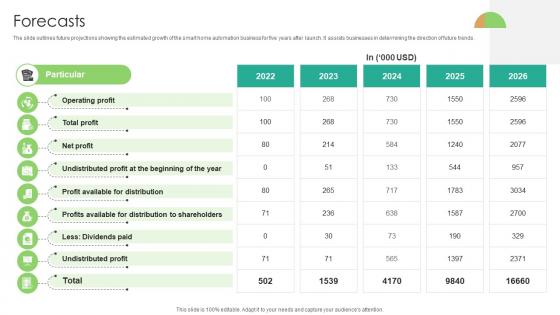
Forecasts Domotics Go To Market Strategy GTM SS V
The slide outlines future projections showing the estimated growth of the cleantech business for three years after launch. It assists businesses in determining the direction of future trends.Formulating a presentation can take up a lot of effort and time, so the content and message should always be the primary focus. The visuals of the PowerPoint can enhance the presenters message, so our Forecasts Domotics Go To Market Strategy GTM SS V was created to help save time. Instead of worrying about the design, the presenter can concentrate on the message while our designers work on creating the ideal templates for whatever situation is needed. Slidegeeks has experts for everything from amazing designs to valuable content, we have put everything into Forecasts Domotics Go To Market Strategy GTM SS V. The slide outlines future projections showing the estimated growth of the cleantech business for three years after launch. It assists businesses in determining the direction of future trends.

Lawn Care Services Business Plan Comparative Balance Sheet Statement Of The Lawn Mowing Start BP SS V
The slides provide a picture of the business financial situation at a particular point in time. It displays the company assets and liabilities along with depreciation schedule of office furniture and computer. Get a simple yet stunning designed Lawn Care Services Business Plan Comparative Balance Sheet Statement Of The Lawn Mowing Start BP SS V. It is the best one to establish the tone in your meetings. It is an excellent way to make your presentations highly effective. So, download this PPT today from Slidegeeks and see the positive impacts. Our easy-to-edit Lawn Care Services Business Plan Comparative Balance Sheet Statement Of The Lawn Mowing Start BP SS V can be your go-to option for all upcoming conferences and meetings. So, what are you waiting for Grab this template today. The slides provide a picture of the business financial situation at a particular point in time. It displays the company assets and liabilities along with depreciation schedule of office furniture and computer.
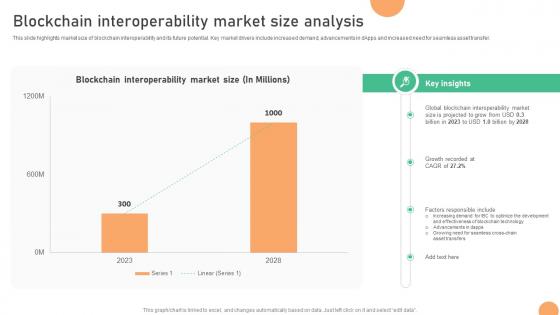
Seamless Integration The Power Interoperability Market Size Analysis BCT SS V
This slide highlights market size of blockchain interoperability and its future potential. Key market drivers include increased demand, advancements in dApps and increased need for seamless asset transfer. Formulating a presentation can take up a lot of effort and time, so the content and message should always be the primary focus. The visuals of the PowerPoint can enhance the presenters message, so our Seamless Integration The Power Interoperability Market Size Analysis BCT SS V was created to help save time. Instead of worrying about the design, the presenter can concentrate on the message while our designers work on creating the ideal templates for whatever situation is needed. Slidegeeks has experts for everything from amazing designs to valuable content, we have put everything into Seamless Integration The Power Interoperability Market Size Analysis BCT SS V. This slide highlights market size of blockchain interoperability and its future potential. Key market drivers include increased demand, advancements in dApps and increased need for seamless asset transfer.
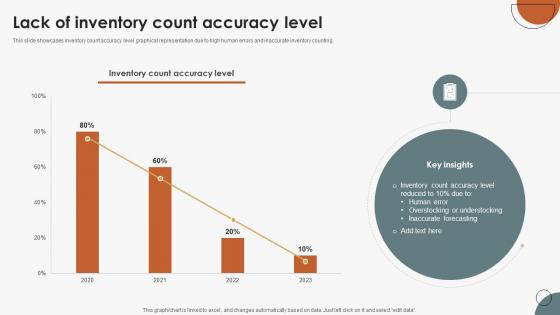
Boosting Efficiency In Inventory Lack Of Inventory Count Accuracy Level
This slide showcases inventory count accuracy level graphical representation due to high human errors and inaccurate inventory counting. Formulating a presentation can take up a lot of effort and time, so the content and message should always be the primary focus. The visuals of the PowerPoint can enhance the presenters message, so our Boosting Efficiency In Inventory Lack Of Inventory Count Accuracy Level was created to help save time. Instead of worrying about the design, the presenter can concentrate on the message while our designers work on creating the ideal templates for whatever situation is needed. Slidegeeks has experts for everything from amazing designs to valuable content, we have put everything into Boosting Efficiency In Inventory Lack Of Inventory Count Accuracy Level. This slide showcases inventory count accuracy level graphical representation due to high human errors and inaccurate inventory counting.
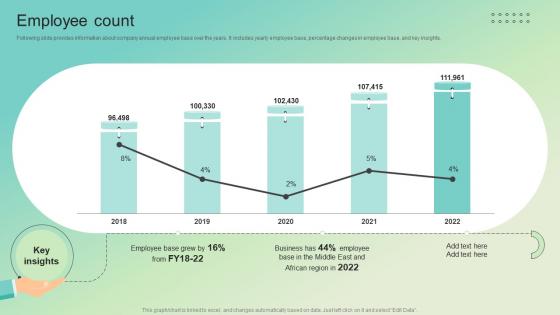
Employee Count Enterprise Software Solution Providing Company Profile CP SS V
Following slide provides information about company annual employee base over the years. It includes yearly employee base, percentage changes in employee base, and key insights.Formulating a presentation can take up a lot of effort and time, so the content and message should always be the primary focus. The visuals of the PowerPoint can enhance the presenters message, so our Employee Count Enterprise Software Solution Providing Company Profile CP SS V was created to help save time. Instead of worrying about the design, the presenter can concentrate on the message while our designers work on creating the ideal templates for whatever situation is needed. Slidegeeks has experts for everything from amazing designs to valuable content, we have put everything into Employee Count Enterprise Software Solution Providing Company Profile CP SS V. Following slide provides information about company annual employee base over the years. It includes yearly employee base, percentage changes in employee base, and key insights.
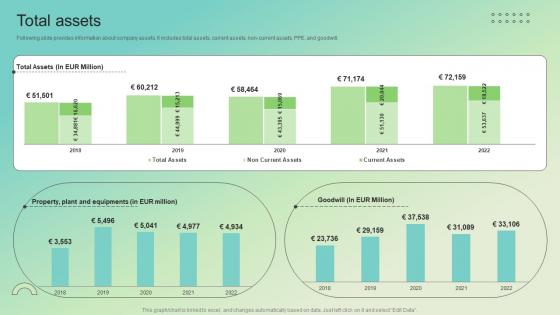
Total Assets Enterprise Software Solution Providing Company Profile CP SS V
Following slide provides information about company assets. It includes total assets, current assets, non-current assets, PPE, and goodwill.Formulating a presentation can take up a lot of effort and time, so the content and message should always be the primary focus. The visuals of the PowerPoint can enhance the presenters message, so our Total Assets Enterprise Software Solution Providing Company Profile CP SS V was created to help save time. Instead of worrying about the design, the presenter can concentrate on the message while our designers work on creating the ideal templates for whatever situation is needed. Slidegeeks has experts for everything from amazing designs to valuable content, we have put everything into Total Assets Enterprise Software Solution Providing Company Profile CP SS V. Following slide provides information about company assets. It includes total assets, current assets, non-current assets, PPE, and goodwill.
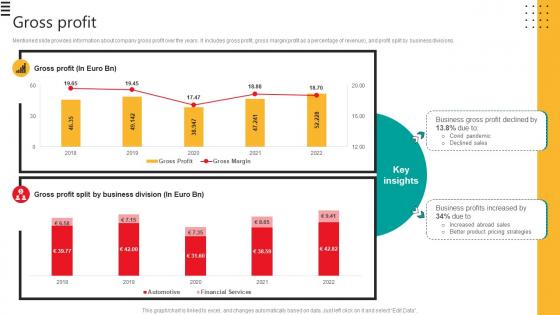
Gross Profit Automobile Development Company Profile CP SS V
Mentioned slide provides information about company gross profit over the years. It includes gross profit, gross marginprofit as a percentage of revenue, and profit split by business divisions.Formulating a presentation can take up a lot of effort and time, so the content and message should always be the primary focus. The visuals of the PowerPoint can enhance the presenters message, so our Gross Profit Automobile Development Company Profile CP SS V was created to help save time. Instead of worrying about the design, the presenter can concentrate on the message while our designers work on creating the ideal templates for whatever situation is needed. Slidegeeks has experts for everything from amazing designs to valuable content, we have put everything into Gross Profit Automobile Development Company Profile CP SS V. Mentioned slide provides information about company gross profit over the years. It includes gross profit, gross marginprofit as a percentage of revenue, and profit split by business divisions.
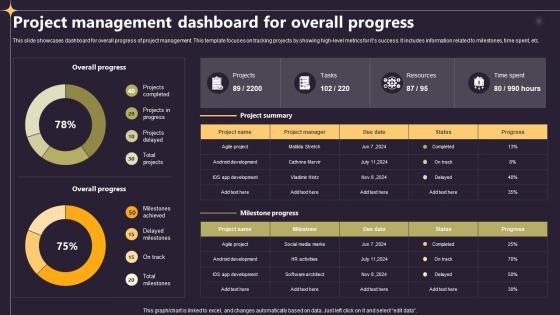
Closing A Project By Fulfilling Project Management Dashboard For Overall Progress PM SS V
This slide showcases dashboard for overall progress of project management. This template focuses on tracking projects by showing high-level metrics for its success. It includes information related to milestones, time spent, etc. This modern and well-arranged Closing A Project By Fulfilling Overview Of Planning Project In An Organisation PM SS V provides lots of creative possibilities. It is very simple to customize and edit with the Powerpoint Software. Just drag and drop your pictures into the shapes. All facets of this template can be edited with Powerpoint, no extra software is necessary. Add your own material, put your images in the places assigned for them, adjust the colors, and then you can show your slides to the world, with an animated slide included. This slide showcases dashboard for overall progress of project management. This template focuses on tracking projects by showing high-level metrics for its success. It includes information related to milestones, time spent, etc.
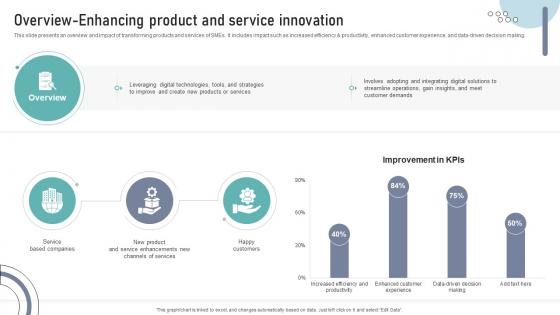
Overview Enhancing Product And Service Innovation DT SS V
This slide presents an overview and impact of transforming products and services of SMEs. It includes impact such as increased efficiency and productivity, enhanced customer experience, and data-driven decision making.Formulating a presentation can take up a lot of effort and time, so the content and message should always be the primary focus. The visuals of the PowerPoint can enhance the presenters message, so our Overview Enhancing Product And Service Innovation DT SS V was created to help save time. Instead of worrying about the design, the presenter can concentrate on the message while our designers work on creating the ideal templates for whatever situation is needed. Slidegeeks has experts for everything from amazing designs to valuable content, we have put everything into Overview Enhancing Product And Service Innovation DT SS V. This slide presents an overview and impact of transforming products and services of SMEs. It includes impact such as increased efficiency and productivity, enhanced customer experience, and data-driven decision making.
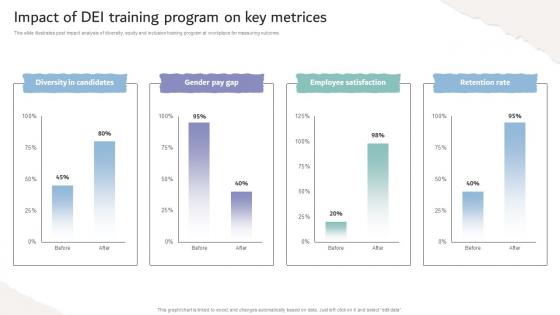
Inclusive Workplace Training Program Impact Of Dei Training Program On Key Metrices DTE SS V
This slide illustrates post impact analysis of diversity, equity and inclusion training program at workplace for measuring outcome. Formulating a presentation can take up a lot of effort and time, so the content and message should always be the primary focus. The visuals of the PowerPoint can enhance the presenters message, so our Inclusive Workplace Training Program Impact Of Dei Training Program On Key Metrices DTE SS V was created to help save time. Instead of worrying about the design, the presenter can concentrate on the message while our designers work on creating the ideal templates for whatever situation is needed. Slidegeeks has experts for everything from amazing designs to valuable content, we have put everything into Inclusive Workplace Training Program Impact Of Dei Training Program On Key Metrices DTE SS V. This slide illustrates post impact analysis of diversity, equity and inclusion training program at workplace for measuring outcome.
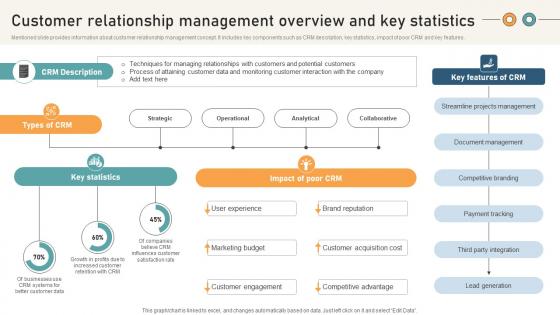
Comprehensive Guide For Website Customer Relationship Management Overview And Key
Mentioned slide provides information about customer relationship management concept. It includes key components such as CRM description, key statistics, impact of poor CRM and key features. Formulating a presentation can take up a lot of effort and time, so the content and message should always be the primary focus. The visuals of the PowerPoint can enhance the presenters message, so our Comprehensive Guide For Website Customer Relationship Management Overview And Key was created to help save time. Instead of worrying about the design, the presenter can concentrate on the message while our designers work on creating the ideal templates for whatever situation is needed. Slidegeeks has experts for everything from amazing designs to valuable content, we have put everything into Comprehensive Guide For Website Customer Relationship Management Overview And Key Mentioned slide provides information about customer relationship management concept. It includes key components such as CRM description, key statistics, impact of poor CRM and key features.
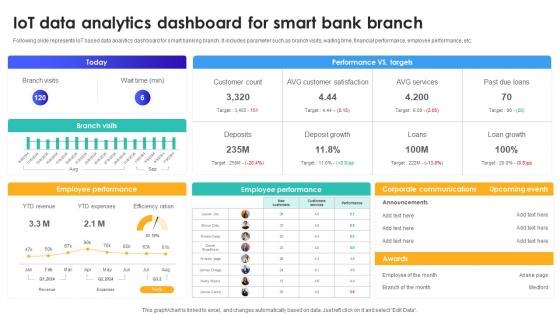
IoT Data Analytics Dashboard For Smart Bank Branch IoT In Banking For Digital Future IoT SS V
Following slide represents IoT based data analytics dashboard for smart banking branch. It includes parameter such as branch visits, waiting time, financial performance, employee performance, etc. Do you have an important presentation coming up Are you looking for something that will make your presentation stand out from the rest Look no further than IoT Data Analytics Dashboard For Smart Bank Branch IoT In Banking For Digital Future IoT SS V. With our professional designs, you can trust that your presentation will pop and make delivering it a smooth process. And with Slidegeeks, you can trust that your presentation will be unique and memorable. So why wait Grab IoT Data Analytics Dashboard For Smart Bank Branch IoT In Banking For Digital Future IoT SS V today and make your presentation stand out from the rest Following slide represents IoT based data analytics dashboard for smart banking branch. It includes parameter such as branch visits, waiting time, financial performance, employee performance, etc.
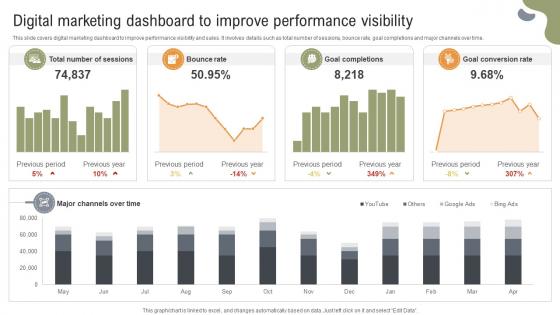
Implementing Strategies To Enhance Digital Marketing Dashboard To Improve Performance
This slide covers digital marketing dashboard to improve performance visibility and sales. It involves details such as total number of sessions, bounce rate, goal completions and major channels over time. Do you have an important presentation coming up Are you looking for something that will make your presentation stand out from the rest Look no further than Implementing Strategies To Enhance Digital Marketing Dashboard To Improve Performance. With our professional designs, you can trust that your presentation will pop and make delivering it a smooth process. And with Slidegeeks, you can trust that your presentation will be unique and memorable. So why wait Grab Implementing Strategies To Enhance Digital Marketing Dashboard To Improve Performance today and make your presentation stand out from the rest This slide covers digital marketing dashboard to improve performance visibility and sales. It involves details such as total number of sessions, bounce rate, goal completions and major channels over time.
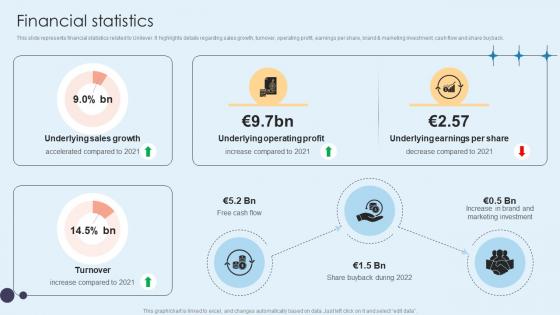
Financial Statistics Home Care Solutions Company Profile CP SS V
This slide represents financial statistics related to Unilever. It highlights details regarding sales growth, turnover, operating profit, earnings per share, brand and marketing investment, cash flow and share buyback.Formulating a presentation can take up a lot of effort and time, so the content and message should always be the primary focus. The visuals of the PowerPoint can enhance the presenters message, so our Financial Statistics Home Care Solutions Company Profile CP SS V was created to help save time. Instead of worrying about the design, the presenter can concentrate on the message while our designers work on creating the ideal templates for whatever situation is needed. Slidegeeks has experts for everything from amazing designs to valuable content, we have put everything into Financial Statistics Home Care Solutions Company Profile CP SS V. This slide represents financial statistics related to Unilever. It highlights details regarding sales growth, turnover, operating profit, earnings per share, brand and marketing investment, cash flow and share buyback.

Brand Extension Techniques KPI Dashboard To Track Product Performance Strategy SS V
This slide represents KPI dashboard for measuring product performance. It covers total activities, new customers, events, net promoter score. Formulating a presentation can take up a lot of effort and time, so the content and message should always be the primary focus. The visuals of the PowerPoint can enhance the presenters message, so our Brand Extension Techniques KPI Dashboard To Track Product Performance Strategy SS V was created to help save time. Instead of worrying about the design, the presenter can concentrate on the message while our designers work on creating the ideal templates for whatever situation is needed. Slidegeeks has experts for everything from amazing designs to valuable content, we have put everything into Brand Extension Techniques KPI Dashboard To Track Product Performance Strategy SS V This slide represents KPI dashboard for measuring product performance. It covers total activities, new customers, events, net promoter score.
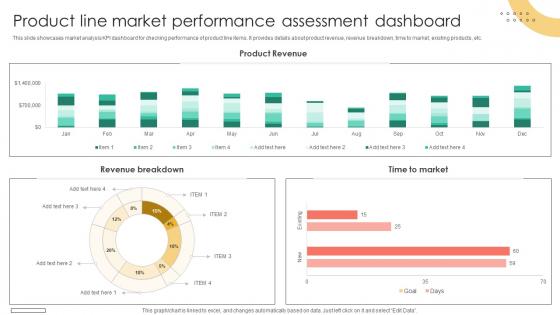
Brand Extension Techniques Product Line Market Performance Assessment Dashboard Strategy SS V
This slide showcases market analysis KPI dashboard for checking performance of product line items. It provides details about product revenue, revenue breakdown, time to market, existing products, etc. This Brand Extension Techniques Product Line Market Performance Assessment Dashboard Strategy SS V from Slidegeeks makes it easy to present information on your topic with precision. It provides customization options, so you can make changes to the colors, design, graphics, or any other component to create a unique layout. It is also available for immediate download, so you can begin using it right away. Slidegeeks has done good research to ensure that you have everything you need to make your presentation stand out. Make a name out there for a brilliant performance. This slide showcases market analysis KPI dashboard for checking performance of product line items. It provides details about product revenue, revenue breakdown, time to market, existing products, etc.

Increasing Employee Turnover Expenses Over Implementing Personnel Downsizing Initiative
This slide shows increasing employee turnover rates due to increase in project management conflicts in the organization over the four quarters in a year Formulating a presentation can take up a lot of effort and time, so the content and message should always be the primary focus. The visuals of the PowerPoint can enhance the presenters message, so our Increasing Employee Turnover Expenses Over Implementing Personnel Downsizing Initiative was created to help save time. Instead of worrying about the design, the presenter can concentrate on the message while our designers work on creating the ideal templates for whatever situation is needed. Slidegeeks has experts for everything from amazing designs to valuable content, we have put everything into Increasing Employee Turnover Expenses Over Implementing Personnel Downsizing Initiative This slide shows increasing employee turnover rates due to increase in project management conflicts in the organization over the four quarters in a year

Workforce Competency Enhancement Impact Of Cloud Training On Organization Performance DTE SS V
This slide illustrate impact of cloud training on organization performance such as decrease in project delays, high conversion rate etc. Formulating a presentation can take up a lot of effort and time, so the content and message should always be the primary focus. The visuals of the PowerPoint can enhance the presenters message, so our Workforce Competency Enhancement Impact Of Cloud Training On Organization Performance DTE SS V was created to help save time. Instead of worrying about the design, the presenter can concentrate on the message while our designers work on creating the ideal templates for whatever situation is needed. Slidegeeks has experts for everything from amazing designs to valuable content, we have put everything into Workforce Competency Enhancement Impact Of Cloud Training On Organization Performance DTE SS V This slide illustrate impact of cloud training on organization performance such as decrease in project delays, high conversion rate etc.
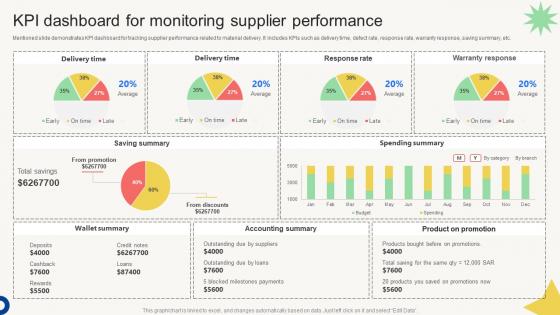
Vendor Management Audit KPI Dashboard For Monitoring Supplier Performance
Mentioned slide demonstrates KPI dashboard for tracking supplier performance related to material delivery. It includes KPIs such as delivery time, defect rate, response rate, warranty response, saving summary, etc. This modern and well-arranged Vendor Management Audit KPI Dashboard For Monitoring Supplier Performance provides lots of creative possibilities. It is very simple to customize and edit with the Powerpoint Software. Just drag and drop your pictures into the shapes. All facets of this template can be edited with Powerpoint, no extra software is necessary. Add your own material, put your images in the places assigned for them, adjust the colors, and then you can show your slides to the world, with an animated slide included. Mentioned slide demonstrates KPI dashboard for tracking supplier performance related to material delivery. It includes KPIs such as delivery time, defect rate, response rate, warranty response, saving summary, etc.
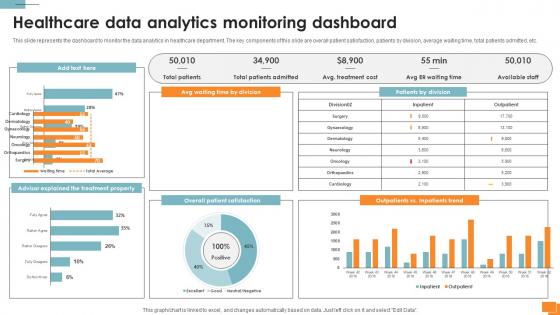
Statistical Tools For Evidence Healthcare Data Analytics Monitoring Dashboard
This slide represents the dashboard to monitor the data analytics in healthcare department. The key components of this slide are overall patient satisfaction, patients by division, average waiting time, total patients admitted, etc. Welcome to our selection of the Statistical Tools For Evidence Healthcare Data Analytics Monitoring Dashboard. These are designed to help you showcase your creativity and bring your sphere to life. Planning and Innovation are essential for any business that is just starting out. This collection contains the designs that you need for your everyday presentations. All of our PowerPoints are 100Percent editable, so you can customize them to suit your needs. This multi-purpose template can be used in various situations. Grab these presentation templates today. This slide represents the dashboard to monitor the data analytics in healthcare department. The key components of this slide are overall patient satisfaction, patients by division, average waiting time, total patients admitted, etc.
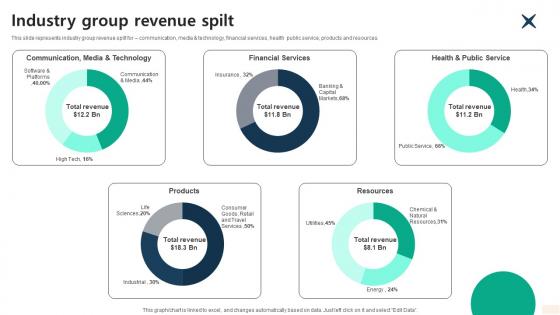
Industry Group Revenue Spilt Global Consulting And Technology Services Company Profile CP SS V
This slide represents industry group revenue spilt for communication, media and technology, financial services, health public service, products and resources.Formulating a presentation can take up a lot of effort and time, so the content and message should always be the primary focus. The visuals of the PowerPoint can enhance the presenters message, so our Industry Group Revenue Spilt Global Consulting And Technology Services Company Profile CP SS V was created to help save time. Instead of worrying about the design, the presenter can concentrate on the message while our designers work on creating the ideal templates for whatever situation is needed. Slidegeeks has experts for everything from amazing designs to valuable content, we have put everything into Industry Group Revenue Spilt Global Consulting And Technology Services Company Profile CP SS V. This slide represents industry group revenue spilt for communication, media and technology, financial services, health public service, products and resources.
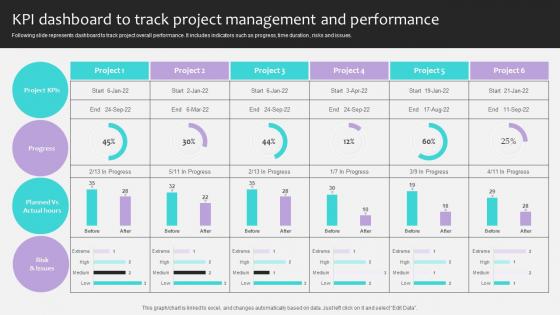
Project Stakeholders Management KPI Dashboard To Track Project Management Ppt Presentation
Following slide represents dashboard to track project overall performance. It includes indicators such as progress, time duration , risks and issues. Slidegeeks has constructed Project Stakeholders Management KPI Dashboard To Track Project Management Ppt Presentation after conducting extensive research and examination. These presentation templates are constantly being generated and modified based on user preferences and critiques from editors. Here, you will find the most attractive templates for a range of purposes while taking into account ratings and remarks from users regarding the content. This is an excellent jumping-off point to explore our content and will give new users an insight into our top-notch PowerPoint Templates. Following slide represents dashboard to track project overall performance. It includes indicators such as progress, time duration , risks and issues.
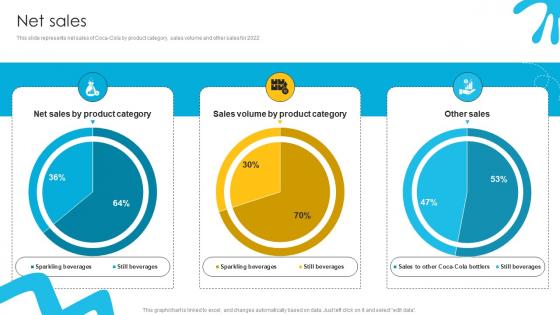
Net Sales Liquid Refreshment Manufacturer Company Profile Ppt Slides CP SS V
This slide represents net sales of Coca-Cola by product category, sales volume and other sales for 2022Formulating a presentation can take up a lot of effort and time, so the content and message should always be the primary focus. The visuals of the PowerPoint can enhance the presenters message, so our Net Sales Liquid Refreshment Manufacturer Company Profile Ppt Slides CP SS V was created to help save time. Instead of worrying about the design, the presenter can concentrate on the message while our designers work on creating the ideal templates for whatever situation is needed. Slidegeeks has experts for everything from amazing designs to valuable content, we have put everything into Net Sales Liquid Refreshment Manufacturer Company Profile Ppt Slides CP SS V. This slide represents net sales of Coca-Cola by product category, sales volume and other sales for 2022
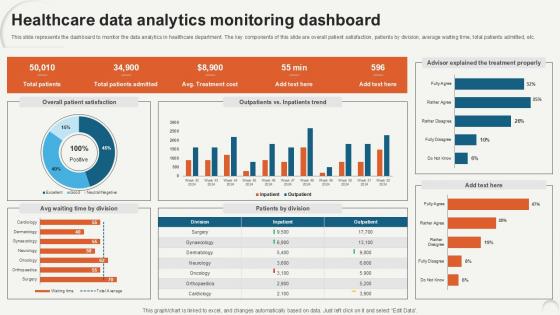
Healthcare Data Analytics Monitoring Data Analytics For Informed Decision Ppt PowerPoint
This slide represents the dashboard to monitor the data analytics in healthcare department. The key components of this slide are overall patient satisfaction, patients by division, average waiting time, total patients admitted, etc. Make sure to capture your audiences attention in your business displays with our gratis customizable Healthcare Data Analytics Monitoring Data Analytics For Informed Decision Ppt PowerPoint. These are great for business strategies, office conferences, capital raising or task suggestions. If you desire to acquire more customers for your tech business and ensure they stay satisfied, create your own sales presentation with these plain slides. This slide represents the dashboard to monitor the data analytics in healthcare department. The key components of this slide are overall patient satisfaction, patients by division, average waiting time, total patients admitted, etc.
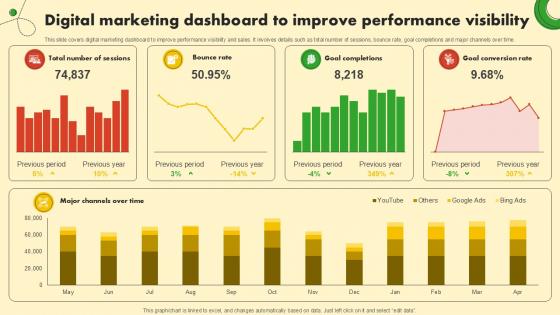
Digital Marketing Dashboard To Food And Grocery Retail Ppt Slide
This slide covers digital marketing dashboard to improve performance visibility and sales. It involves details such as total number of sessions, bounce rate, goal completions and major channels over time. Do you have an important presentation coming up Are you looking for something that will make your presentation stand out from the rest Look no further than Digital Marketing Dashboard To Food And Grocery Retail Ppt Slide. With our professional designs, you can trust that your presentation will pop and make delivering it a smooth process. And with Slidegeeks, you can trust that your presentation will be unique and memorable. So why wait Grab Digital Marketing Dashboard To Food And Grocery Retail Ppt Slide today and make your presentation stand out from the rest This slide covers digital marketing dashboard to improve performance visibility and sales. It involves details such as total number of sessions, bounce rate, goal completions and major channels over time.

Impact Of Portfolio Expansion Of Returns And Cost Investment Fund PPT Example
Mentioned slide includes information about key performance indicators to evaluate portfolio potential.It includes key elements such as return on investment and transaction cost. Formulating a presentation can take up a lot of effort and time, so the content and message should always be the primary focus. The visuals of the PowerPoint can enhance the presenters message, so our Impact Of Portfolio Expansion Of Returns And Cost Investment Fund PPT Example was created to help save time. Instead of worrying about the design, the presenter can concentrate on the message while our designers work on creating the ideal templates for whatever situation is needed. Slidegeeks has experts for everything from amazing designs to valuable content, we have put everything into Impact Of Portfolio Expansion Of Returns And Cost Investment Fund PPT Example Mentioned slide includes information about key performance indicators to evaluate portfolio potential.It includes key elements such as return on investment and transaction cost.
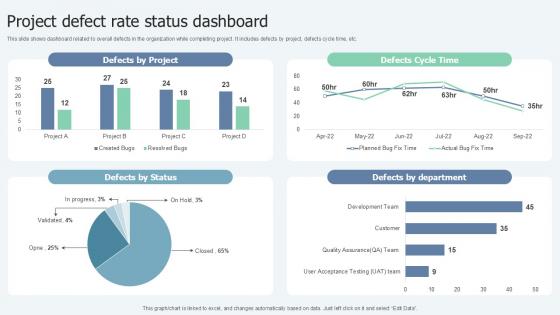
Project Defect Rate Status Dashboard Lean Six Sigma In Manufacturing Ppt Sample
This slide shows dashboard related to overall defects in the organization while completing project. It includes defects by project, defects cycle time, etc. Slidegeeks is here to make your presentations a breeze with Project Defect Rate Status Dashboard Lean Six Sigma In Manufacturing Ppt Sample With our easy-to-use and customizable templates, you can focus on delivering your ideas rather than worrying about formatting. With a variety of designs to choose from, you are sure to find one that suits your needs. And with animations and unique photos, illustrations, and fonts, you can make your presentation pop. So whether you are giving a sales pitch or presenting to the board, make sure to check out Slidegeeks first This slide shows dashboard related to overall defects in the organization while completing project. It includes defects by project, defects cycle time, etc.
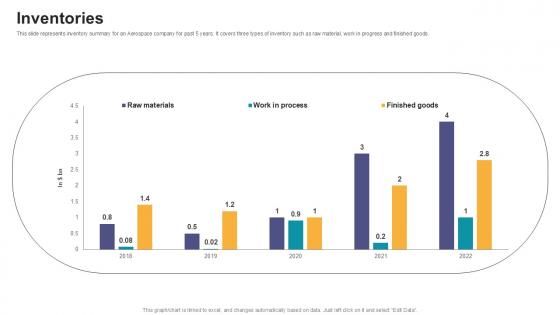
Inventories Digital Marketings Strategies PPT PowerPoint CP SS V
This slide represents inventory summary for an Aerospace company for past 5 years. It covers three types of inventory such as raw material, work in progress and finished goods. Formulating a presentation can take up a lot of effort and time, so the content and message should always be the primary focus. The visuals of the PowerPoint can enhance the presenters message, so our Inventories Digital Marketings Strategies PPT PowerPoint CP SS V was created to help save time. Instead of worrying about the design, the presenter can concentrate on the message while our designers work on creating the ideal templates for whatever situation is needed. Slidegeeks has experts for everything from amazing designs to valuable content, we have put everything into Inventories Digital Marketings Strategies PPT PowerPoint CP SS V This slide represents inventory summary for an Aerospace company for past 5 years. It covers three types of inventory such as raw material, work in progress and finished goods.
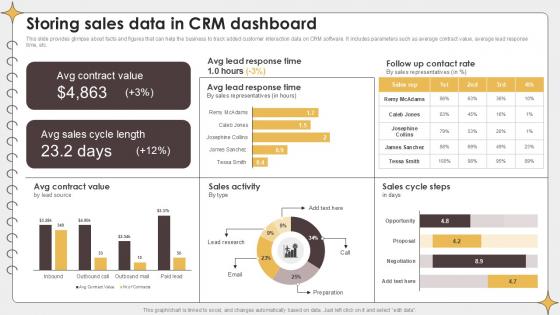
Storing Sales Data In CRM Dashboard Planning Outreach Campaigns PPT Slide
This slide provides glimpse about facts and figures that can help the business to track added customer interaction data on CRM software. It includes parameters such as average contract value, average lead response time, etc. This Storing Sales Data In CRM Dashboard Planning Outreach Campaigns PPT Slide is perfect for any presentation, be it in front of clients or colleagues. It is a versatile and stylish solution for organizing your meetings. The Storing Sales Data In CRM Dashboard Planning Outreach Campaigns PPT Slide features a modern design for your presentation meetings. The adjustable and customizable slides provide unlimited possibilities for acing up your presentation. Slidegeeks has done all the homework before launching the product for you. So, do not wait, grab the presentation templates today This slide provides glimpse about facts and figures that can help the business to track added customer interaction data on CRM software. It includes parameters such as average contract value, average lead response time, etc.
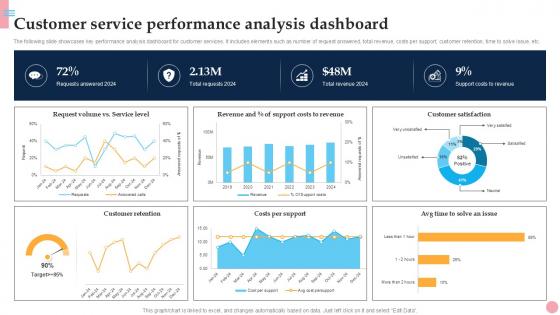
Customer Service Performance How To Improve Company PPT Sample Strategy SS V
The following slide showcases key performance analysis dashboard for customer services. It includes elements such as number of request answered, total revenue, costs per support, customer retention, time to solve issue, etc. Slidegeeks is here to make your presentations a breeze with Customer Service Performance How To Improve Company PPT Sample Strategy SS V With our easy-to-use and customizable templates, you can focus on delivering your ideas rather than worrying about formatting. With a variety of designs to choose from, you are sure to find one that suits your needs. And with animations and unique photos, illustrations, and fonts, you can make your presentation pop. So whether you are giving a sales pitch or presenting to the board, make sure to check out Slidegeeks first The following slide showcases key performance analysis dashboard for customer services. It includes elements such as number of request answered, total revenue, costs per support, customer retention, time to solve issue, etc.

Measuring Customer Satisfaction Improving Customer Retention PPT Template
The following slide covers KPI dashboard to evaluate customer satisfaction score. It includes elements such as requests answered, total revenue, service level, cost per support, retention rate, average time taken to resolve an issue etc. This modern and well-arranged Measuring Customer Satisfaction Improving Customer Retention PPT Template provides lots of creative possibilities. It is very simple to customize and edit with the Powerpoint Software. Just drag and drop your pictures into the shapes. All facets of this template can be edited with Powerpoint, no extra software is necessary. Add your own material, put your images in the places assigned for them, adjust the colors, and then you can show your slides to the world, with an animated slide included. The following slide covers KPI dashboard to evaluate customer satisfaction score. It includes elements such as requests answered, total revenue, service level, cost per support, retention rate, average time taken to resolve an issue etc.

Human Resource Sickness And Absenteeism Monthly Report PPT PowerPoint SS
This slide represents the monthly sickness and absenteeism report prepared by the human resource department of the organization. It includes details related to the lost time, days total head count, cost of absences, sickness etc. Take your projects to the next level with our ultimate collection of Human Resource Sickness And Absenteeism Monthly Report PPT PowerPoint SS. Slidegeeks has designed a range of layouts that are perfect for representing task or activity duration, keeping track of all your deadlines at a glance. Tailor these designs to your exact needs and give them a truly corporate look with your own brand colors they will make your projects stand out from the rest This slide represents the monthly sickness and absenteeism report prepared by the human resource department of the organization. It includes details related to the lost time, days total head count, cost of absences, sickness etc.
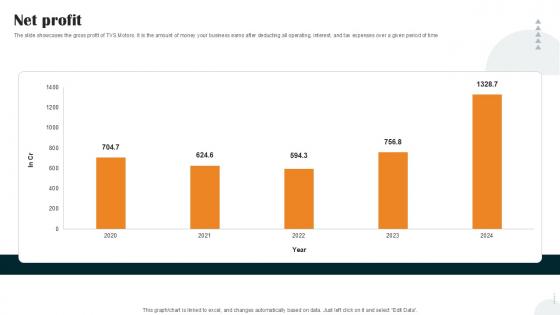
Net Profit Vehicle Manufacturer Company Profile PPT Slide CP SS V
The slide showcases the gross profit of TVS Motors. It is the amount of money your business earns after deducting all operating, interest, and tax expenses over a given period of time. This Net Profit Vehicle Manufacturer Company Profile PPT Slide CP SS V is perfect for any presentation, be it in front of clients or colleagues. It is a versatile and stylish solution for organizing your meetings. The Net Profit Vehicle Manufacturer Company Profile PPT Slide CP SS V features a modern design for your presentation meetings. The adjustable and customizable slides provide unlimited possibilities for acing up your presentation. Slidegeeks has done all the homework before launching the product for you. So, do not wait, grab the presentation templates today The slide showcases the gross profit of TVS Motors. It is the amount of money your business earns after deducting all operating, interest, and tax expenses over a given period of time

Monthly Business Sales Performance Report PPT PowerPoint SS
Formulating a presentation can take up a lot of effort and time, so the content and message should always be the primary focus. The visuals of the PowerPoint can enhance the presenters message, so our Monthly Business Sales Performance Report PPT PowerPoint SS was created to help save time. Instead of worrying about the design, the presenter can concentrate on the message while our designers work on creating the ideal templates for whatever situation is needed. Slidegeeks has experts for everything from amazing designs to valuable content, we have put everything into Monthly Business Sales Performance Report PPT PowerPoint SS. Our Monthly Business Sales Performance Report PPT PowerPoint SS are topically designed to provide an attractive backdrop to any subject. Use them to look like a presentation pro.
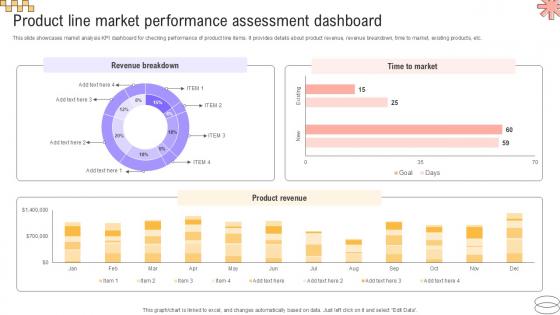
Product Line Market Performance Implementing Geographic Extension PPT Slide Strategy SS V
This slide showcases market analysis KPI dashboard for checking performance of product line items. It provides details about product revenue, revenue breakdown, time to market, existing products, etc. Take your projects to the next level with our ultimate collection of Product Line Market Performance Implementing Geographic Extension PPT Slide Strategy SS V. Slidegeeks has designed a range of layouts that are perfect for representing task or activity duration, keeping track of all your deadlines at a glance. Tailor these designs to your exact needs and give them a truly corporate look with your own brand colors they will make your projects stand out from the rest This slide showcases market analysis KPI dashboard for checking performance of product line items. It provides details about product revenue, revenue breakdown, time to market, existing products, etc.
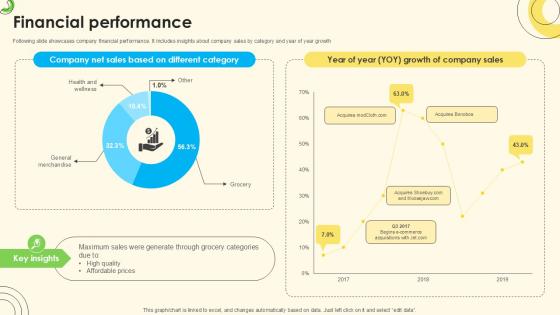
Financial Performance Sales Pitch Deck For Online Retail Ppt Slide
Following slide showcases company financial performance. It includes insights about company sales by category and year of year growth Formulating a presentation can take up a lot of effort and time, so the content and message should always be the primary focus. The visuals of the PowerPoint can enhance the presenters message, so our Financial Performance Sales Pitch Deck For Online Retail Ppt Slide was created to help save time. Instead of worrying about the design, the presenter can concentrate on the message while our designers work on creating the ideal templates for whatever situation is needed. Slidegeeks has experts for everything from amazing designs to valuable content, we have put everything into Financial Performance Sales Pitch Deck For Online Retail Ppt Slide Following slide showcases company financial performance. It includes insights about company sales by category and year of year growth
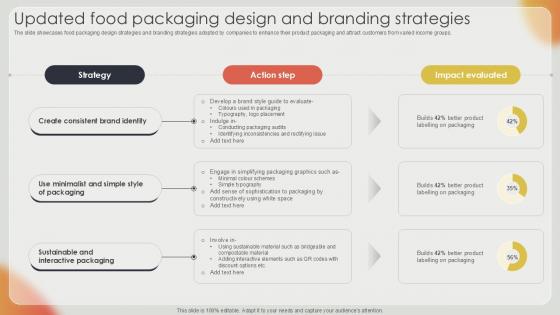
Updated Food Packaging Design Effective Strategies For Strengthening Food Ppt Presentation
The slide showcases food packaging design strategies and branding strategies adopted by companies to enhance their product packaging and attract customers from varied income groups. Formulating a presentation can take up a lot of effort and time, so the content and message should always be the primary focus. The visuals of the PowerPoint can enhance the presenters message, so our Updated Food Packaging Design Effective Strategies For Strengthening Food Ppt Presentation was created to help save time. Instead of worrying about the design, the presenter can concentrate on the message while our designers work on creating the ideal templates for whatever situation is needed. Slidegeeks has experts for everything from amazing designs to valuable content, we have put everything into Updated Food Packaging Design Effective Strategies For Strengthening Food Ppt Presentation The slide showcases food packaging design strategies and branding strategies adopted by companies to enhance their product packaging and attract customers from varied income groups.


 Continue with Email

 Home
Home


