Clock Diagram
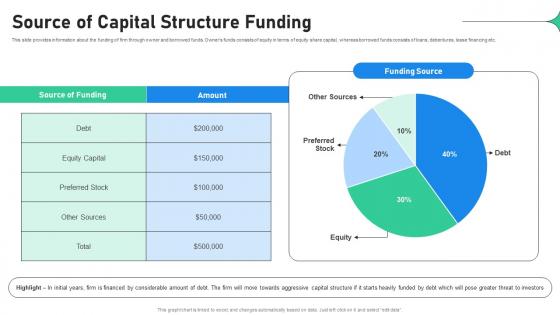
Source Of Capital Structure Funding Increasing Profitability Through Better Product
This slide provides information about the funding of firm through owner and borrowed funds. Owners funds consists of equity in terms of equity share capital, whereas borrowed funds consists of loans, debentures, lease financing etc. Coming up with a presentation necessitates that the majority of the effort goes into the content and the message you intend to convey. The visuals of a PowerPoint presentation can only be effective if it supplements and supports the story that is being told. Keeping this in mind our experts created Source Of Capital Structure Funding Increasing Profitability Through Better Product to reduce the time that goes into designing the presentation. This way, you can concentrate on the message while our designers take care of providing you with the right template for the situation. This slide provides information about the funding of firm through owner and borrowed funds. Owners funds consists of equity in terms of equity share capital, whereas borrowed funds consists of loans, debentures, lease financing etc.
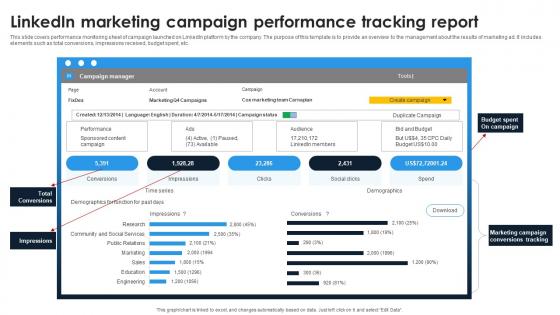
A22 Linkedin Content Strategies Linkedin Marketing Campaign Performance MKT SS V
This slide covers performance monitoring sheet of campaign launched on LinkedIn platform by the company. The purpose of this template is to provide an overview to the management about the results of marketing ad. It includes elements such as total conversions, impressions received, budget spent, etc. Boost your pitch with our creative A22 Linkedin Content Strategies Linkedin Marketing Campaign Performance MKT SS V. Deliver an awe-inspiring pitch that will mesmerize everyone. Using these presentation templates you will surely catch everyones attention. You can browse the ppts collection on our website. We have researchers who are experts at creating the right content for the templates. So you do not have to invest time in any additional work. Just grab the template now and use them. This slide covers performance monitoring sheet of campaign launched on LinkedIn platform by the company. The purpose of this template is to provide an overview to the management about the results of marketing ad. It includes elements such as total conversions, impressions received, budget spent, etc.
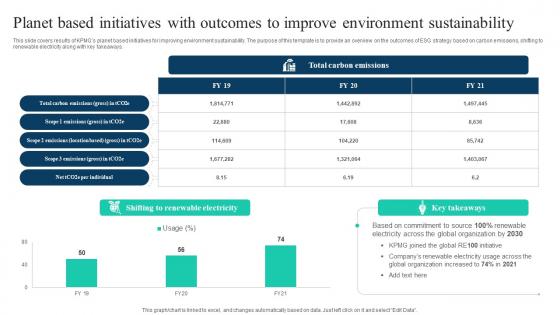
The Ultimate Guide To KPMG Planet Based Initiatives With Outcomes To Improve Strategy SS V
This slide covers results of KPMGs planet based initiatives for improving environment sustainability. The purpose of this template is to provide an overview on the outcomes of ESG strategy based on carbon emissions, shifting to renewable electricity along with key takeaways. Create an editable The Ultimate Guide To KPMG Planet Based Initiatives With Outcomes To Improve Strategy SS V that communicates your idea and engages your audience. Whether you are presenting a business or an educational presentation, pre-designed presentation templates help save time. The Ultimate Guide To KPMG Planet Based Initiatives With Outcomes To Improve Strategy SS V is highly customizable and very easy to edit, covering many different styles from creative to business presentations. Slidegeeks has creative team members who have crafted amazing templates. So, go and get them without any delay. This slide covers results of KPMGs planet based initiatives for improving environment sustainability. The purpose of this template is to provide an overview on the outcomes of ESG strategy based on carbon emissions, shifting to renewable electricity along with key takeaways.
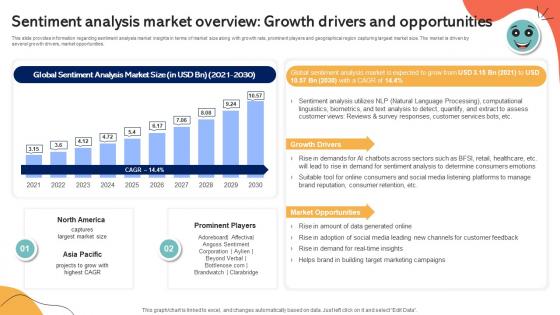
Sentiment Analysis Market Overview Growth Drivers Emotionally Intelligent Insights Leveraging AI SS V
This slide provides information regarding sentiment analysis market insights in terms of market size along with growth rate, prominent players and geographical region capturing largest market size. The market is driven by several growth drivers, market opportunities. Find highly impressive Sentiment Analysis Market Overview Growth Drivers Emotionally Intelligent Insights Leveraging AI SS V on Slidegeeks to deliver a meaningful presentation. You can save an ample amount of time using these presentation templates. No need to worry to prepare everything from scratch because Slidegeeks experts have already done a huge research and work for you. You need to download Sentiment Analysis Market Overview Growth Drivers Emotionally Intelligent Insights Leveraging AI SS V for your upcoming presentation. All the presentation templates are 100 percent editable and you can change the color and personalize the content accordingly. Download now This slide provides information regarding sentiment analysis market insights in terms of market size along with growth rate, prominent players and geographical region capturing largest market size. The market is driven by several growth drivers, market opportunities.
Global Landfill Management Challenges Faced By Cities IOT Applications In Smart Waste IoT SS V
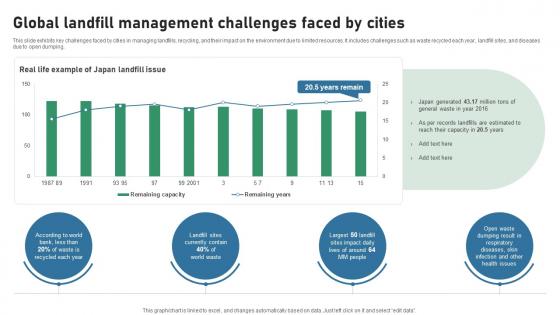
This slide exhibits key challenges faced by cities in managing landfills, recycling, and their impact on the environment due to limited resources. It includes challenges such as waste recycled each year, landfill sites, and diseases due to open dumping. Find highly impressive Global Landfill Management Challenges Faced By Cities IOT Applications In Smart Waste IoT SS V on Slidegeeks to deliver a meaningful presentation. You can save an ample amount of time using these presentation templates. No need to worry to prepare everything from scratch because Slidegeeks experts have already done a huge research and work for you. You need to download Global Landfill Management Challenges Faced By Cities IOT Applications In Smart Waste IoT SS V for your upcoming presentation. All the presentation templates are 100 percent editable and you can change the color and personalize the content accordingly. Download now This slide exhibits key challenges faced by cities in managing landfills, recycling, and their impact on the environment due to limited resources. It includes challenges such as waste recycled each year, landfill sites, and diseases due to open dumping.
Weekly KPI Dashboard To Manage Waste Bins And Vehicles IOT Applications In Smart Waste IoT SS V
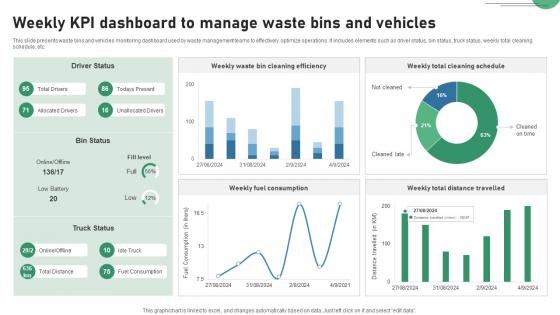
This slide presents waste bins and vehicles monitoring dashboard used by waste management teams to effectively optimize operations. It includes elements such as driver status, bin status, truck status, weekly total cleaning schedule, etc. Find highly impressive Weekly KPI Dashboard To Manage Waste Bins And Vehicles IOT Applications In Smart Waste IoT SS V on Slidegeeks to deliver a meaningful presentation. You can save an ample amount of time using these presentation templates. No need to worry to prepare everything from scratch because Slidegeeks experts have already done a huge research and work for you. You need to download Weekly KPI Dashboard To Manage Waste Bins And Vehicles IOT Applications In Smart Waste IoT SS V for your upcoming presentation. All the presentation templates are 100 percent editable and you can change the color and personalize the content accordingly. Download now. This slide presents waste bins and vehicles monitoring dashboard used by waste management teams to effectively optimize operations. It includes elements such as driver status, bin status, truck status, weekly total cleaning schedule, etc.

Market Analysis Of Enterprise Resource Planning Solutions Erp And Digital Transformation For Maximizing DT SS V
This slide presents the market size growth analysis of enterprise resource planning solutions with compound annual growth rate. It also mentions key factors behind growth such as increasing adoption of innovation, real-time analytics, and growing need for supplier-relationship management and customer relationship management.This modern and well-arranged Market Analysis Of Enterprise Resource Planning Solutions Erp And Digital Transformation For Maximizing DT SS V provides lots of creative possibilities. It is very simple to customize and edit with the Powerpoint Software. Just drag and drop your pictures into the shapes. All facets of this template can be edited with Powerpoint, no extra software is necessary. Add your own material, put your images in the places assigned for them, adjust the colors, and then you can show your slides to the world, with an animated slide included. This slide presents the market size growth analysis of enterprise resource planning solutions with compound annual growth rate. It also mentions key factors behind growth such as increasing adoption of innovation, real-time analytics, and growing need for supplier-relationship management and customer relationship management.
Dashboard To Evaluate Crowdfunding Campaign Crowdfunding Strategies To Raise Funds Fin SS V
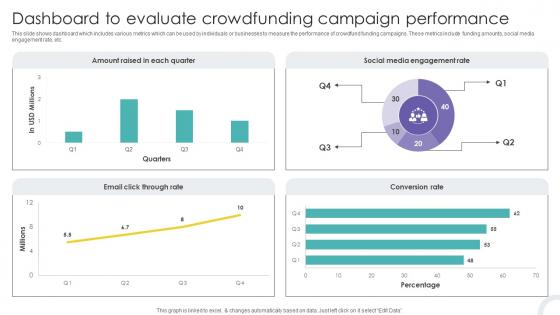
This slide shows dashboard which includes various metrics which can be used by individuals or businesses to measure the performance of crowdfund funding campaigns. These metrics include funding amounts, social media engagement rate, etc. Find highly impressive Dashboard To Evaluate Crowdfunding Campaign Crowdfunding Strategies To Raise Funds Fin SS V on Slidegeeks to deliver a meaningful presentation. You can save an ample amount of time using these presentation templates. No need to worry to prepare everything from scratch because Slidegeeks experts have already done a huge research and work for you. You need to download Dashboard To Evaluate Crowdfunding Campaign Crowdfunding Strategies To Raise Funds Fin SS V for your upcoming presentation. All the presentation templates are 100 percent editable and you can change the color and personalize the content accordingly. Download now This slide shows dashboard which includes various metrics which can be used by individuals or businesses to measure the performance of crowdfund funding campaigns. These metrics include funding amounts, social media engagement rate, etc.
Top Trends In Social Media Analytics Cracking The Code Of Social Media
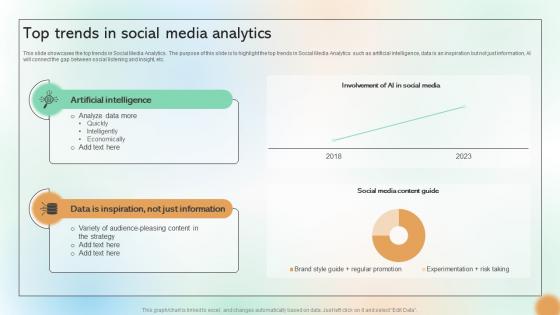
This slide showcases the top trends in Social Media Analytics. The purpose of this slide is to highlight the top trends in Social Media Analytics such as artificial intelligence, data is an inspiration but not just information, AI will connect the gap between social listening and insight, etc. Present like a pro with Top Trends In Social Media Analytics Cracking The Code Of Social Media. Create beautiful presentations together with your team, using our easy-to-use presentation slides. Share your ideas in real-time and make changes on the fly by downloading our templates. So whether you are in the office, on the go, or in a remote location, you can stay in sync with your team and present your ideas with This slide showcases the top trends in Social Media Analytics. The purpose of this slide is to highlight the top trends in Social Media Analytics such as artificial intelligence, data is an inspiration but not just information, AI will connect the gap between social listening and insight, etc.
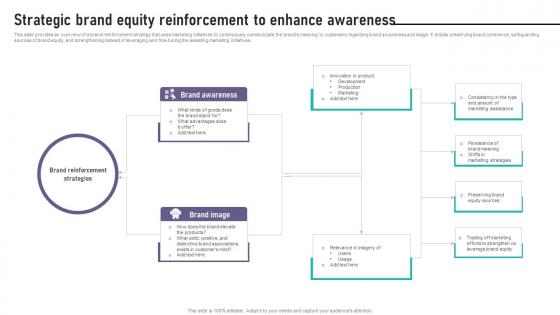
Brand Equity Management To Raise Strategic Brand Equity Reinforcement To Enhance
This slide provides an overview of a brand reinforcement strategy that uses marketing initiatives to continuously communicate the brands meaning to customers regarding brand awareness and image. It entails preserving brand coherence, safeguarding sources of brand equity, and strengthening instead of leveraging and fine-tuning the assisting marketing initiatives. Present like a pro with Brand Equity Management To Raise Strategic Brand Equity Reinforcement To Enhance. Create beautiful presentations together with your team, using our easy-to-use presentation slides. Share your ideas in real-time and make changes on the fly by downloading our templates. So whether you are in the office, on the go, or in a remote location, you can stay in sync with your team and present your ideas with confidence. With Slidegeeks presentation got a whole lot easier. Grab these presentations today. This slide provides an overview of a brand reinforcement strategy that uses marketing initiatives to continuously communicate the brands meaning to customers regarding brand awareness and image. It entails preserving brand coherence, safeguarding sources of brand equity, and strengthening instead of leveraging and fine-tuning the assisting marketing initiatives.
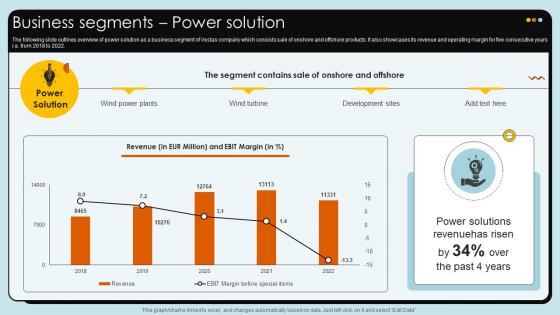
Business Segments Power Solution Wind Turbines Manufacturer Company Profile CP SS V
The following slide outlines overview of power solution as a business segment of Vestas company which consists sale of onshore and offshore products. It also showcases its revenue and operating margin for five consecutive years i.e. from 2018 to 2022.Create an editable Business Segments Power Solution Wind Turbines Manufacturer Company Profile CP SS V that communicates your idea and engages your audience. Whether you are presenting a business or an educational presentation, pre-designed presentation templates help save time. Business Segments Power Solution Wind Turbines Manufacturer Company Profile CP SS V is highly customizable and very easy to edit, covering many different styles from creative to business presentations. Slidegeeks has creative team members who have crafted amazing templates. So, go and get them without any delay. The following slide outlines overview of power solution as a business segment of Vestas company which consists sale of onshore and offshore products. It also showcases its revenue and operating margin for five consecutive years i.e. from 2018 to 2022.
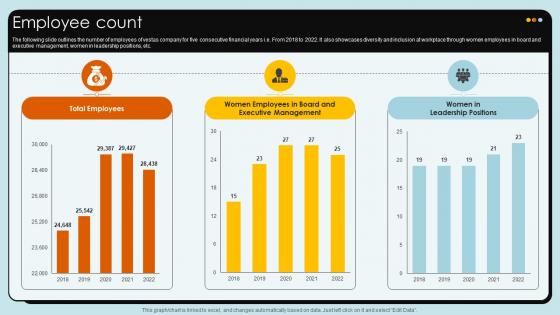
Employee Count Wind Turbines Manufacturer Company Profile CP SS V
The following slide outlines the number of employees of vestas company for five consecutive financial years i.e. From 2018 to 2022. It also showcases diversity and inclusion at workplace through women employees in board and executive management, women in leadership positions, etc.Present like a pro with Employee Count Wind Turbines Manufacturer Company Profile CP SS V. Create beautiful presentations together with your team, using our easy-to-use presentation slides. Share your ideas in real-time and make changes on the fly by downloading our templates. So whether you are in the office, on the go, or in a remote location, you can stay in sync with your team and present your ideas with confidence. With Slidegeeks presentation got a whole lot easier. Grab these presentations today. The following slide outlines the number of employees of vestas company for five consecutive financial years i.e. From 2018 to 2022. It also showcases diversity and inclusion at workplace through women employees in board and executive management, women in leadership positions, etc.
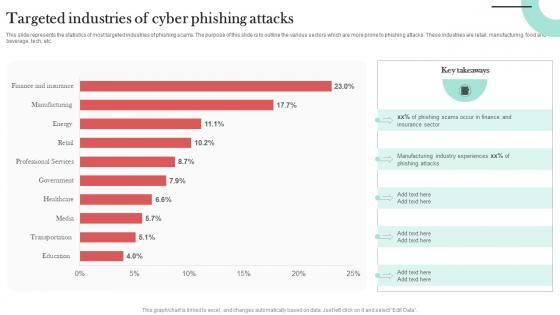
Targeted Industries Of Cyber Phishing Man In The Middle Phishing IT
This slide represents the statistics of most targeted industries of phishing scams. The purpose of this slide is to outline the various sectors which are more prone to phishing attacks. These industries are retail, manufacturing, food and beverage, tech, etc. Coming up with a presentation necessitates that the majority of the effort goes into the content and the message you intend to convey. The visuals of a PowerPoint presentation can only be effective if it supplements and supports the story that is being told. Keeping this in mind our experts created Targeted Industries Of Cyber Phishing Man In The Middle Phishing IT to reduce the time that goes into designing the presentation. This way, you can concentrate on the message while our designers take care of providing you with the right template for the situation. This slide represents the statistics of most targeted industries of phishing scams. The purpose of this slide is to outline the various sectors which are more prone to phishing attacks. These industries are retail, manufacturing, food and beverage, tech, etc.
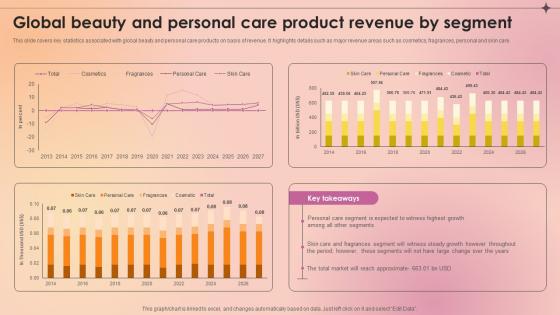
Global Beauty And Personal Care Product Revenue By Segment Makeup And Skincare Market IR SS V
This slide covers key statistics associated with global beauty and personal care products on basis of revenue. It highlights details such as major revenue areas such as cosmetics, fragrances, personal and skin care. Find highly impressive Global Beauty And Personal Care Product Revenue By Segment Makeup And Skincare Market IR SS V on Slidegeeks to deliver a meaningful presentation. You can save an ample amount of time using these presentation templates. No need to worry to prepare everything from scratch because Slidegeeks experts have already done a huge research and work for you. You need to download Global Beauty And Personal Care Product Revenue By Segment Makeup And Skincare Market IR SS V for your upcoming presentation. All the presentation templates are 100 percent editable and you can change the color and personalize the content accordingly. Download now This slide covers key statistics associated with global beauty and personal care products on basis of revenue. It highlights details such as major revenue areas such as cosmetics, fragrances, personal and skin care.

North America Beauty And Personal Care Industry Makeup And Skincare Market IR SS V
This slide presents the North American market size of beauty and personal care products. It highlights key market players, major product segment, import value of beauty and personal care products, millennials and gen Z beauty and personal care products preferences. Coming up with a presentation necessitates that the majority of the effort goes into the content and the message you intend to convey. The visuals of a PowerPoint presentation can only be effective if it supplements and supports the story that is being told. Keeping this in mind our experts created North America Beauty And Personal Care Industry Makeup And Skincare Market IR SS V to reduce the time that goes into designing the presentation. This way, you can concentrate on the message while our designers take care of providing you with the right template for the situation. This slide presents the North American market size of beauty and personal care products. It highlights key market players, major product segment, import value of beauty and personal care products, millennials and gen Z beauty and personal care products preferences.

Revenue Streams Task Management System Investor Funding Elevator Pitch Deck
This slide covers various sources of revenue for the company. The purpose of this template is to provide an overview of stakeholders, investors, or potential partners with a comprehensive understanding of revenue sources such as indirect sources, product subscription, licensing content to third parties, etc. Coming up with a presentation necessitates that the majority of the effort goes into the content and the message you intend to convey. The visuals of a PowerPoint presentation can only be effective if it supplements and supports the story that is being told. Keeping this in mind our experts created Revenue Streams Task Management System Investor Funding Elevator Pitch Deck to reduce the time that goes into designing the presentation. This way, you can concentrate on the message while our designers take care of providing you with the right template for the situation. This slide covers various sources of revenue for the company. The purpose of this template is to provide an overview of stakeholders, investors, or potential partners with a comprehensive understanding of revenue sources such as indirect sources, product subscription, licensing content to third parties, etc.

Create A Restaurant Marketing Organizational Structure Of Restaurant
The following slide showcases the divisional structure of the restaurant marketing team. The key stakeholders mentioned in the slide are the marketing president, secretary, product manager, advertising director, public relations PR manager, market research director, promotion director, and creative services. Coming up with a presentation necessitates that the majority of the effort goes into the content and the message you intend to convey. The visuals of a PowerPoint presentation can only be effective if it supplements and supports the story that is being told. Keeping this in mind our experts created Create A Restaurant Marketing Organizational Structure Of Restaurant to reduce the time that goes into designing the presentation. This way, you can concentrate on the message while our designers take care of providing you with the right template for the situation. The following slide showcases the divisional structure of the restaurant marketing team. The key stakeholders mentioned in the slide are the marketing president, secretary, product manager, advertising director, public relations PR manager, market research director, promotion director, and creative services.
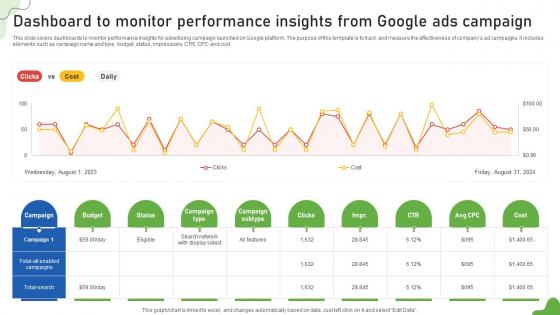
Google Ads Categories Dashboard To Monitor Performance Insights From Google Ads MKT SS V
This slide covers dashboards to monitor performance insights for advertising campaign launched on Google platform. The purpose of this template is to track and measure the effectiveness of companys ad campaigns. It includes elements such as campaign name and type, budget, status, impressions, CTR, CPC and cost. The best PPT templates are a great way to save time, energy, and resources. Slidegeeks have 100 percent editable powerpoint slides making them incredibly versatile. With these quality presentation templates, you can create a captivating and memorable presentation by combining visually appealing slides and effectively communicating your message. Download Google Ads Categories Dashboard To Monitor Performance Insights From Google Ads MKT SS V from Slidegeeks and deliver a wonderful presentation. This slide covers dashboards to monitor performance insights for advertising campaign launched on Google platform. The purpose of this template is to track and measure the effectiveness of companys ad campaigns. It includes elements such as campaign name and type, budget, status, impressions, CTR, CPC and cost.
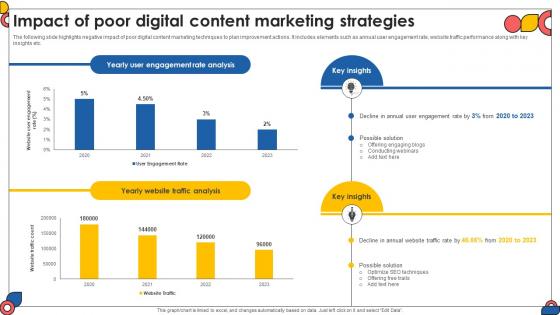
Impact Of Poor Digital Content Marketing Strategies Comprehensive Guide To Implement Strategy SS V
The following slide highlights negative impact of poor digital content marketing techniques to plan improvement actions. It includes elements such as annual user engagement rate, website traffic performance along with key insights etc. Coming up with a presentation necessitates that the majority of the effort goes into the content and the message you intend to convey. The visuals of a PowerPoint presentation can only be effective if it supplements and supports the story that is being told. Keeping this in mind our experts created Impact Of Poor Digital Content Marketing Strategies Comprehensive Guide To Implement Strategy SS V to reduce the time that goes into designing the presentation. This way, you can concentrate on the message while our designers take care of providing you with the right template for the situation. The following slide highlights negative impact of poor digital content marketing techniques to plan improvement actions. It includes elements such as annual user engagement rate, website traffic performance along with key insights etc.
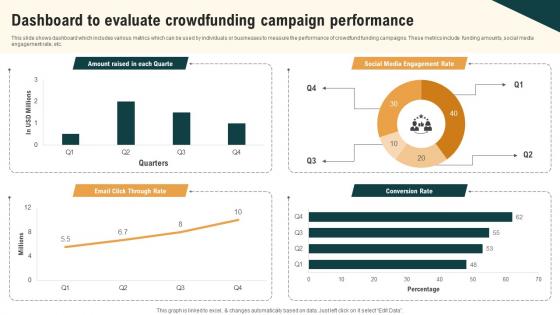
Dashboard To Evaluate Crowdfunding Campaign Real Estate Crowdfunding To Unlock Fin SS V
This slide shows dashboard which includes various metrics which can be used by individuals or businesses to measure the performance of crowdfund funding campaigns. These metrics include funding amounts, social media engagement rate, etc. Find highly impressive Dashboard To Evaluate Crowdfunding Campaign Real Estate Crowdfunding To Unlock Fin SS V on Slidegeeks to deliver a meaningful presentation. You can save an ample amount of time using these presentation templates. No need to worry to prepare everything from scratch because Slidegeeks experts have already done a huge research and work for you. You need to download Dashboard To Evaluate Crowdfunding Campaign Real Estate Crowdfunding To Unlock Fin SS V for your upcoming presentation. All the presentation templates are 100 percent editable and you can change the color and personalize the content accordingly. Download now This slide shows dashboard which includes various metrics which can be used by individuals or businesses to measure the performance of crowdfund funding campaigns. These metrics include funding amounts, social media engagement rate, etc.
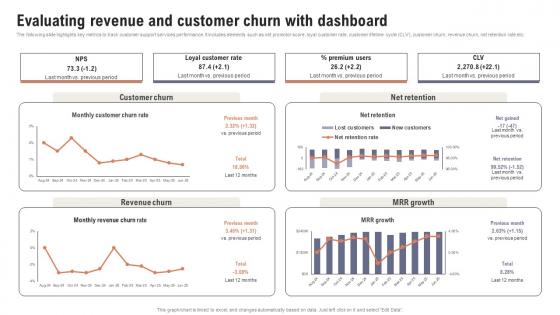
Evaluating Revenue And Customer Churn Boosting Customer Retention Rate With Live Chat
The following slide highlights key metrics to track customer support services performance. It includes elements such as net promotor score, loyal customer rate, customer lifetime cycle CLV, customer churn, revenue churn, net retention rate etc. Find highly impressive Evaluating Revenue And Customer Churn Boosting Customer Retention Rate With Live Chat on Slidegeeks to deliver a meaningful presentation. You can save an ample amount of time using these presentation templates. No need to worry to prepare everything from scratch because Slidegeeks experts have already done a huge research and work for you. You need to download Evaluating Revenue And Customer Churn Boosting Customer Retention Rate With Live Chat for your upcoming presentation. All the presentation templates are 100 percent editable and you can change the color and personalize the content accordingly. Download now The following slide highlights key metrics to track customer support services performance. It includes elements such as net promotor score, loyal customer rate, customer lifetime cycle CLV, customer churn, revenue churn, net retention rate etc.
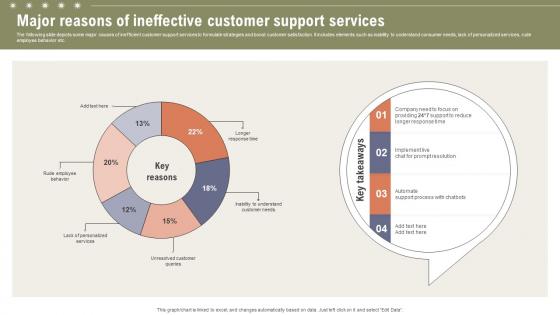
Major Reasons Of Ineffective Customer Support Boosting Customer Retention Rate With Live Chat
The following slide depicts some major causes of inefficient customer support services to formulate strategies and boost customer satisfaction. It includes elements such as inability to understand consumer needs, lack of personalized services, rude employee behavior etc. Coming up with a presentation necessitates that the majority of the effort goes into the content and the message you intend to convey. The visuals of a PowerPoint presentation can only be effective if it supplements and supports the story that is being told. Keeping this in mind our experts created Major Reasons Of Ineffective Customer Support Boosting Customer Retention Rate With Live Chat to reduce the time that goes into designing the presentation. This way, you can concentrate on the message while our designers take care of providing you with the right template for the situation. The following slide depicts some major causes of inefficient customer support services to formulate strategies and boost customer satisfaction. It includes elements such as inability to understand consumer needs, lack of personalized services, rude employee behavior etc.
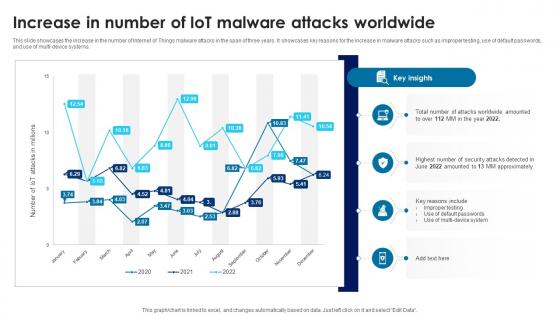
Building Trust With IoT Security Increase In Number Of IoT Malware Attacks Worldwide IoT SS V
This slide showcases the increase in the number of Internet of Things malware attacks in the span of three years. It showcases key reasons for the increase in malware attacks such as improper testing, use of default passwords, and use of multi-device systems. Coming up with a presentation necessitates that the majority of the effort goes into the content and the message you intend to convey. The visuals of a PowerPoint presentation can only be effective if it supplements and supports the story that is being told. Keeping this in mind our experts created Building Trust With IoT Security Increase In Number Of IoT Malware Attacks Worldwide IoT SS V to reduce the time that goes into designing the presentation. This way, you can concentrate on the message while our designers take care of providing you with the right template for the situation. This slide showcases the increase in the number of Internet of Things malware attacks in the span of three years. It showcases key reasons for the increase in malware attacks such as improper testing, use of default passwords, and use of multi-device systems.
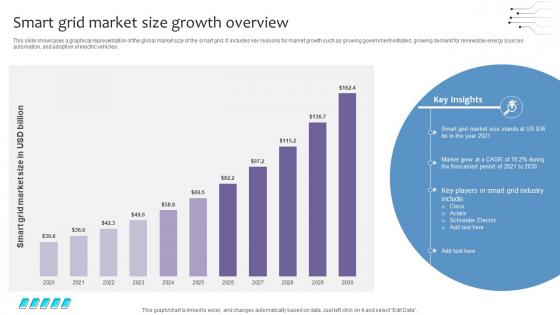
Empowering The Future Smart Grid Market Size Growth Overview IoT SS V
This slide showcases a graphical representation of the global market size of the smart grid. It Includes key reasons for market growth such as growing government-initiated, growing demand for renewable energy sources automation, and adoption of electric vehicles. Coming up with a presentation necessitates that the majority of the effort goes into the content and the message you intend to convey. The visuals of a PowerPoint presentation can only be effective if it supplements and supports the story that is being told. Keeping this in mind our experts created Empowering The Future Smart Grid Market Size Growth Overview IoT SS V to reduce the time that goes into designing the presentation. This way, you can concentrate on the message while our designers take care of providing you with the right template for the situation. This slide showcases a graphical representation of the global market size of the smart grid. It Includes key reasons for market growth such as growing government-initiated, growing demand for renewable energy sources automation, and adoption of electric vehicles.

Post Digitalization Analysing The Impact On Retail Optimizing Retail Operations With Digital DT SS V
This slide help analyses the improving performance of key performance indicators of retail companies after successful digitalization. It includes online sales growth, cart abandonment rate, customer complaints, inventory inaccuracy, time-to-market, supply chain efficiency, foot traffic, and marketing ROI.This Post Digitalization Analysing The Impact On Retail Optimizing Retail Operations With Digital DT SS V is perfect for any presentation, be it in front of clients or colleagues. It is a versatile and stylish solution for organizing your meetings. The Post Digitalization Analysing The Impact On Retail Optimizing Retail Operations With Digital DT SS V features a modern design for your presentation meetings. The adjustable and customizable slides provide unlimited possibilities for acing up your presentation. Slidegeeks has done all the homework before launching the product for you. So, do not wait, grab the presentation templates today This slide help analyses the improving performance of key performance indicators of retail companies after successful digitalization. It includes online sales growth, cart abandonment rate, customer complaints, inventory inaccuracy, time-to-market, supply chain efficiency, foot traffic, and marketing ROI.
Global Landfill Management Challenges Faced By Various Cities Implementation Of E Waste Guidelines
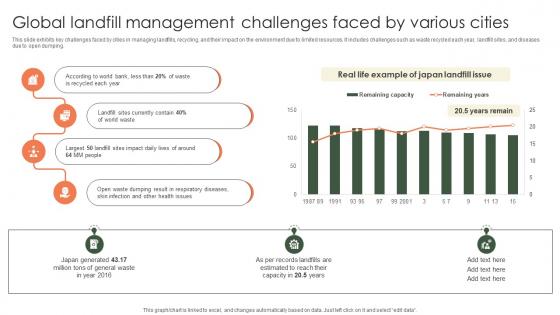
This slide exhibits key challenges faced by cities in managing landfills, recycling, and their impact on the environment due to limited resources. It includes challenges such as waste recycled each year, landfill sites, and diseases due to open dumping. Find highly impressive Global Landfill Management Challenges Faced By Various Cities Implementation Of E Waste Guidelines on Slidegeeks to deliver a meaningful presentation. You can save an ample amount of time using these presentation templates. No need to worry to prepare everything from scratch because Slidegeeks experts have already done a huge research and work for you. You need to download Global Landfill Management Challenges Faced By Various Cities Implementation Of E Waste Guidelines for your upcoming presentation. All the presentation templates are 100 percent editable and you can change the color and personalize the content accordingly. Download now This slide exhibits key challenges faced by cities in managing landfills, recycling, and their impact on the environment due to limited resources. It includes challenges such as waste recycled each year, landfill sites, and diseases due to open dumping.
Digital Marketing Strategies Increased Cart Abandonment And Churn Rate Due To Lack SA SS V
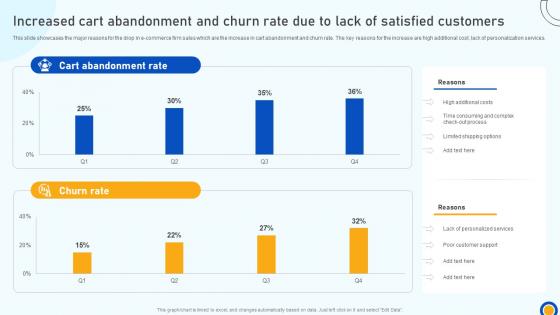
This slide showcases the major reasons for the drop in e-commerce firm sales which are the increase in cart abandonment and churn rate. The key reasons for the increase are high additional cost, lack of personalization services. Coming up with a presentation necessitates that the majority of the effort goes into the content and the message you intend to convey. The visuals of a PowerPoint presentation can only be effective if it supplements and supports the story that is being told. Keeping this in mind our experts created Digital Marketing Strategies Increased Cart Abandonment And Churn Rate Due To Lack SA SS V to reduce the time that goes into designing the presentation. This way, you can concentrate on the message while our designers take care of providing you with the right template for the situation. This slide showcases the major reasons for the drop in e-commerce firm sales which are the increase in cart abandonment and churn rate. The key reasons for the increase are high additional cost, lack of personalization services.

Unlocking Potential IoTs Application Analysis Of Internet Of Things IoT Industry Market Report IoT SS V
This slide highlights the synopsis of the IoT market report to get an idea of the industry growth. It covers the IoT market driver, CAGR, market size, key players of the IoT industry, and market potential of the IoT industry. Present like a pro with Unlocking Potential IoTs Application Analysis Of Internet Of Things IoT Industry Market Report IoT SS V. Create beautiful presentations together with your team, using our easy-to-use presentation slides. Share your ideas in real-time and make changes on the fly by downloading our templates. So whether you are in the office, on the go, or in a remote location, you can stay in sync with your team and present your ideas with confidence. With Slidegeeks presentation got a whole lot easier. Grab these presentations today. This slide highlights the synopsis of the IoT market report to get an idea of the industry growth. It covers the IoT market driver, CAGR, market size, key players of the IoT industry, and market potential of the IoT industry.
IoT Solutions For Oil Global Market Size Of IoT In Oil And Gas Industry IoT SS V
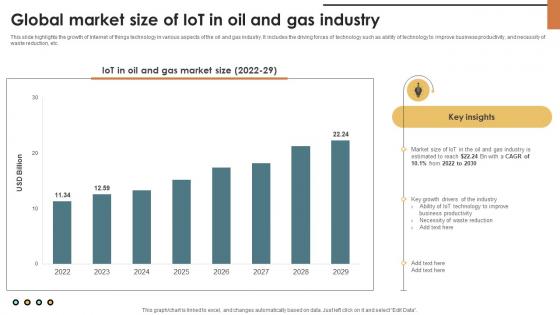
This slide highlights the growth of Internet of things technology in various aspects of the oil and gas industry. It includes the driving forces of technology such as ability of technology to improve business productivity, and necessity of waste reduction, etc. Find highly impressive IoT Solutions For Oil Global Market Size Of IoT In Oil And Gas Industry IoT SS V on Slidegeeks to deliver a meaningful presentation. You can save an ample amount of time using these presentation templates. No need to worry to prepare everything from scratch because Slidegeeks experts have already done a huge research and work for you. You need to download IoT Solutions For Oil Global Market Size Of IoT In Oil And Gas Industry IoT SS V for your upcoming presentation. All the presentation templates are 100 percent editable and you can change the color and personalize the content accordingly. Download now This slide highlights the growth of Internet of things technology in various aspects of the oil and gas industry. It includes the driving forces of technology such as ability of technology to improve business productivity, and necessity of waste reduction, etc.
Customizing The Salon Experience Analyzing Global Market Share Of Multiple Salon Services Strategy SS V
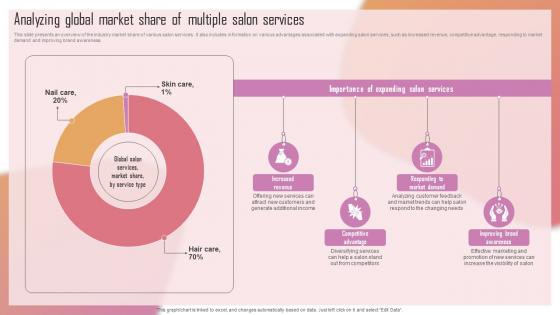
This slide presents an overview of the industry market share of various salon services . It also includes information on various advantages associated with expanding salon services, such as increased revenue, competitive advantage, responding to market demand and improving brand awareness. Create an editable Customizing The Salon Experience Adjusting Pricing Of Products And Services Strategy SS V that communicates your idea and engages your audience. Whether you are presenting a business or an educational presentation, pre-designed presentation templates help save time. Customizing The Salon Experience Adjusting Pricing Of Products And Services Strategy SS V is highly customizable and very easy to edit, covering many different styles from creative to business presentations. Slidegeeks has creative team members who have crafted amazing templates. So, go and get them without any delay. This slide presents an overview of the industry market share of various salon services . It also includes information on various advantages associated with expanding salon services, such as increased revenue, competitive advantage, responding to market demand and improving brand awareness.
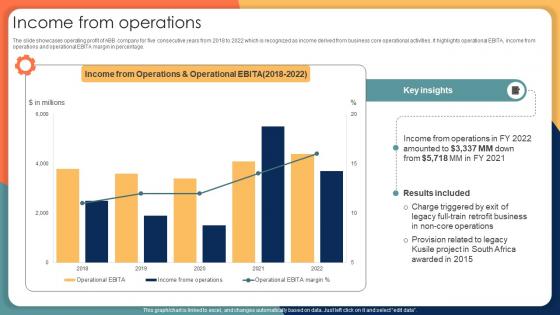
Income From Operations Engineering Solution Provider Company Profile CP SS V
The slide showcases operating profit of ABB company for five consecutive years from 2018 to 2022 which is recognized as income derived from business core operational activities. It highlights operational EBITA, income from operations and operational EBITA margin in percentage. Coming up with a presentation necessitates that the majority of the effort goes into the content and the message you intend to convey. The visuals of a PowerPoint presentation can only be effective if it supplements and supports the story that is being told. Keeping this in mind our experts created Income From Operations Engineering Solution Provider Company Profile CP SS V to reduce the time that goes into designing the presentation. This way, you can concentrate on the message while our designers take care of providing you with the right template for the situation. The slide showcases operating profit of ABB company for five consecutive years from 2018 to 2022 which is recognized as income derived from business core operational activities. It highlights operational EBITA, income from operations and operational EBITA margin in percentage.

Marketing Channels For Movie Social Media Engagement Rate And Performance Analysis Strategy SS V
This slide highlights response score of various social media platforms showing impact of marketing campaign to promote film. It showcases key elements such as reach, impressions, click through rate, shares, likes, comments, mentions, follower growth, cost per click and cost per thousand impressions. Find highly impressive Marketing Channels For Movie Social Media Engagement Rate And Performance Analysis Strategy SS V on Slidegeeks to deliver a meaningful presentation. You can save an ample amount of time using these presentation templates. No need to worry to prepare everything from scratch because Slidegeeks experts have already done a huge research and work for you. You need to download Marketing Channels For Movie Social Media Engagement Rate And Performance Analysis Strategy SS V for your upcoming presentation. All the presentation templates are 100 percent editable and you can change the color and personalize the content accordingly. Download now This slide highlights response score of various social media platforms showing impact of marketing campaign to promote film. It showcases key elements such as reach, impressions, click through rate, shares, likes, comments, mentions, follower growth, cost per click and cost per thousand impressions.
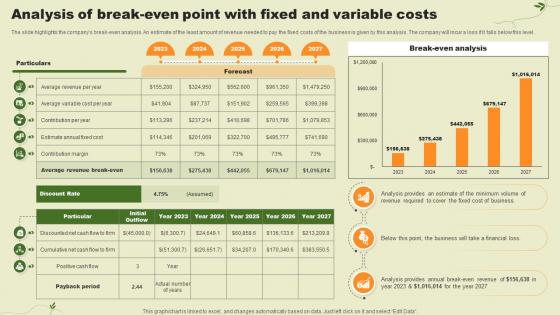
Lawn Care Services Business Plan Analysis Of Break Even Point With Fixed And Variable Costs BP SS V
The slide highlights the companys break-even analysis. An estimate of the least amount of revenue needed to pay the fixed costs of the business is given by this analysis. The company will incur a loss if it falls below this level. Create an editable Lawn Care Services Business Plan Analysis Of Break Even Point With Fixed And Variable Costs BP SS V that communicates your idea and engages your audience. Whether you are presenting a business or an educational presentation, pre-designed presentation templates help save time. Lawn Care Services Business Plan Analysis Of Break Even Point With Fixed And Variable Costs BP SS V is highly customizable and very easy to edit, covering many different styles from creative to business presentations. Slidegeeks has creative team members who have crafted amazing templates. So, go and get them without any delay. The slide highlights the companys break-even analysis. An estimate of the least amount of revenue needed to pay the fixed costs of the business is given by this analysis. The company will incur a loss if it falls below this level.
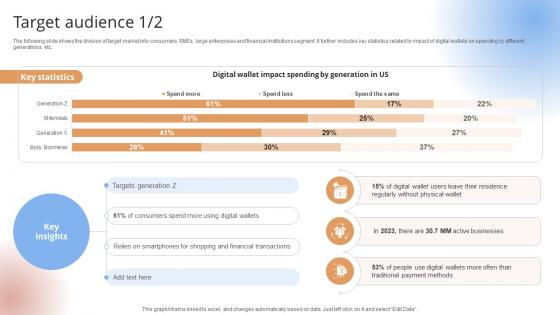
Target Audience Payment Gateway Provider Startup GTM Strategy GTM SS V
The following slide shows the division of target market into consumers, SMEs, large enterprises and financial institutions segment. It further includes key statistics related to impact of digital wallets on spending by different generations, etc.The following slide shows the division of target market into consumers, SMEs, large enterprises and financial institutions segment. It further includes key statistics related to impact of digital wallets on spending by different generations, etc.The best PPT templates are a great way to save time, energy, and resources. Slidegeeks have 100 percent editable powerpoint slides making them incredibly versatile. With these quality presentation templates, you can create a captivating and memorable presentation by combining visually appealing slides and effectively communicating your message. Download Target Audience Payment Gateway Provider Startup GTM Strategy GTM SS V from Slidegeeks and deliver a wonderful presentation. The following slide shows the division of target market into consumers, SMEs, large enterprises and financial institutions segment. It further includes key statistics related to impact of digital wallets on spending by different generations, etc.

Overview Cybersecurity And Data Protection In Digital Transformation DT SS V
This slide presents an overview into the landscape of cybersecurity and data protection with its advantages. It also presents a survey analysis on share of SMEs that have implemented essential and basic IT security initiatives.Find highly impressive Overview Cybersecurity And Data Protection In Digital Transformation DT SS V on Slidegeeks to deliver a meaningful presentation. You can save an ample amount of time using these presentation templates. No need to worry to prepare everything from scratch because Slidegeeks experts have already done a huge research and work for you. You need to download Overview Cybersecurity And Data Protection In Digital Transformation DT SS V for your upcoming presentation. All the presentation templates are 100 percent editable and you can change the color and personalize the content accordingly. Download now This slide presents an overview into the landscape of cybersecurity and data protection with its advantages. It also presents a survey analysis on share of SMEs that have implemented essential and basic IT security initiatives.
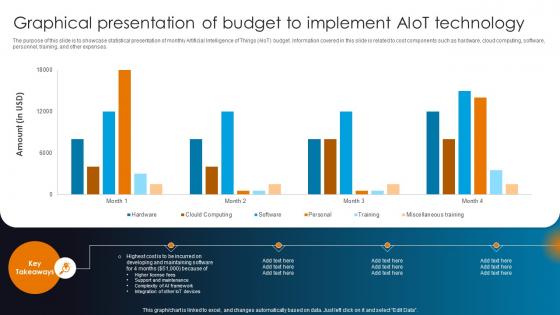
Integrating AI With IoT Graphical Presentation Of Budget To Implement AIoT Technology IoT SS V
The purpose of this slide is to showcase statistical presentation of monthly Artificial Intelligence of Things AIoT budget. Information covered in this slide is related to cost components such as hardware, cloud computing, software, personnel, training, and other expenses. Coming up with a presentation necessitates that the majority of the effort goes into the content and the message you intend to convey. The visuals of a PowerPoint presentation can only be effective if it supplements and supports the story that is being told. Keeping this in mind our experts created Integrating AI With IoT Graphical Presentation Of Budget To Implement AIoT Technology IoT SS V to reduce the time that goes into designing the presentation. This way, you can concentrate on the message while our designers take care of providing you with the right template for the situation. The purpose of this slide is to showcase statistical presentation of monthly Artificial Intelligence of Things AIoT budget. Information covered in this slide is related to cost components such as hardware, cloud computing, software, personnel, training, and other expenses.
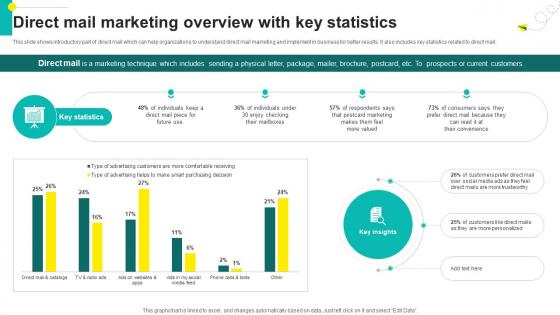
One On One Advertising Direct Mail Marketing Overview With Key Statistics Strategy SS V
This slide shows introductory part of direct mail which can help organizations to understand direct mail marketing and implement in business for better results. It also includes key statistics related to direct mail. Find highly impressive One On One Advertising Direct Mail Marketing Overview With Key Statistics Strategy SS V on Slidegeeks to deliver a meaningful presentation. You can save an ample amount of time using these presentation templates. No need to worry to prepare everything from scratch because Slidegeeks experts have already done a huge research and work for you. You need to download One On One Advertising Direct Mail Marketing Overview With Key Statistics Strategy SS V for your upcoming presentation. All the presentation templates are 100 percent editable and you can change the color and personalize the content accordingly. Download now This slide shows introductory part of direct mail which can help organizations to understand direct mail marketing and implement in business for better results. It also includes key statistics related to direct mail.
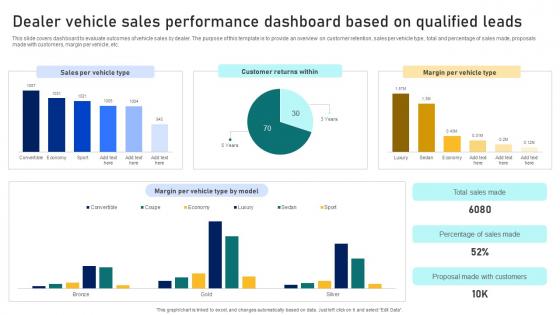
Guide To Building A Successful Dealer Vehicle Sales Performance Dashboard Based On Qualified Strategy SS V
This slide covers dashboard to evaluate outcomes of vehicle sales by dealer. The purpose of this template is to provide an overview on customer retention, sales per vehicle type, total and percentage of sales made, proposals made with customers, margin per vehicle, etc. Present like a pro with Guide To Building A Successful Dealer Vehicle Sales Performance Dashboard Based On Qualified Strategy SS V. Create beautiful presentations together with your team, using our easy-to-use presentation slides. Share your ideas in real-time and make changes on the fly by downloading our templates. So whether you are in the office, on the go, or in a remote location, you can stay in sync with your team and present your ideas with confidence. With Slidegeeks presentation got a whole lot easier. Grab these presentations today. This slide covers dashboard to evaluate outcomes of vehicle sales by dealer. The purpose of this template is to provide an overview on customer retention, sales per vehicle type, total and percentage of sales made, proposals made with customers, margin per vehicle, etc.
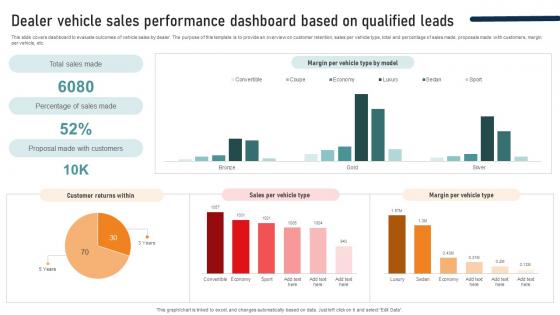
Ultimate Guide To Developing Dealer Vehicle Sales Performance Dashboard Based On Qualified Strategy SS V
This slide covers dashboard to evaluate outcomes of vehicle sales by dealer. The purpose of this template is to provide an overview on customer retention, sales per vehicle type, total and percentage of sales made, proposals made with customers, margin per vehicle, etc. Present like a pro with Ultimate Guide To Developing Dealer Vehicle Sales Performance Dashboard Based On Qualified Strategy SS V. Create beautiful presentations together with your team, using our easy-to-use presentation slides. Share your ideas in real-time and make changes on the fly by downloading our templates. So whether you are in the office, on the go, or in a remote location, you can stay in sync with your team and present your ideas with confidence. With Slidegeeks presentation got a whole lot easier. Grab these presentations today. This slide covers dashboard to evaluate outcomes of vehicle sales by dealer. The purpose of this template is to provide an overview on customer retention, sales per vehicle type, total and percentage of sales made, proposals made with customers, margin per vehicle, etc.
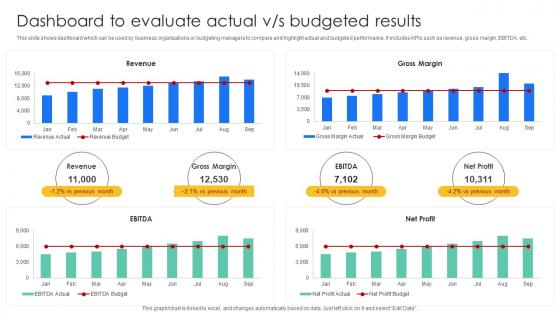
Dashboard To Evaluate Actual Vs Budgeted Results Effective And Efficient Tools To Develop Fin SS V
This slide shows dashboard which can be used by business organizations or budgeting managers to compare and highlight actual and budgeted performance. It includes KPIs such as revenue, gross margin, EBITDA, etc. Find highly impressive Dashboard To Evaluate Actual Vs Budgeted Results Effective And Efficient Tools To Develop Fin SS V on Slidegeeks to deliver a meaningful presentation. You can save an ample amount of time using these presentation templates. No need to worry to prepare everything from scratch because Slidegeeks experts have already done a huge research and work for you. You need to download Dashboard To Evaluate Actual Vs Budgeted Results Effective And Efficient Tools To Develop Fin SS V for your upcoming presentation. All the presentation templates are 100 percent editable and you can change the color and personalize the content accordingly. Download now This slide shows dashboard which can be used by business organizations or budgeting managers to compare and highlight actual and budgeted performance. It includes KPIs such as revenue, gross margin, EBITDA, etc.
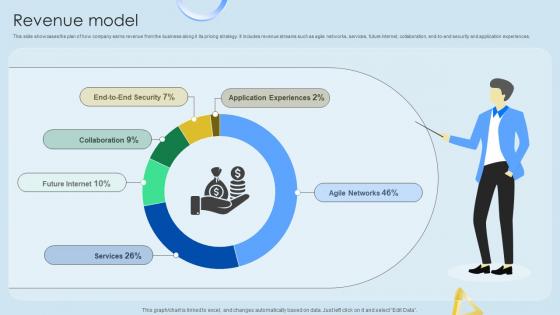
Revenue Model Cloud Networking Service Provider Business Model BMC SS V
This slide showcases the plan of how company earns revenue from the business along it its pricing strategy. It includes revenue streams such as agile networks, services, future internet, collaboration, end-to-end security and application experiences. Find highly impressive Revenue Model Cloud Networking Service Provider Business Model BMC SS V on Slidegeeks to deliver a meaningful presentation. You can save an ample amount of time using these presentation templates. No need to worry to prepare everything from scratch because Slidegeeks experts have already done a huge research and work for you. You need to download Revenue Model Cloud Networking Service Provider Business Model BMC SS V for your upcoming presentation. All the presentation templates are 100 percent editable and you can change the color and personalize the content accordingly. Download now This slide showcases the plan of how company earns revenue from the business along it its pricing strategy. It includes revenue streams such as agile networks, services, future internet, collaboration, end-to-end security and application experiences.
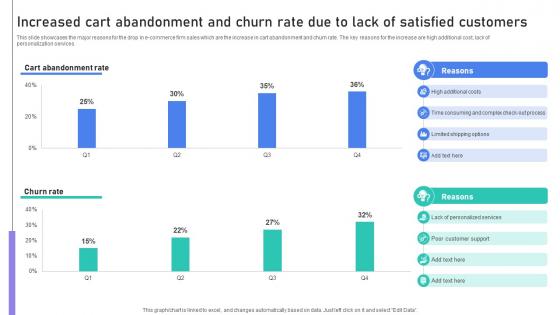
Building Stronger Customer Increased Cart Abandonment And Churn Rate Due To Lack SA SS V
This slide showcases the major reasons for the drop in e-commerce firm sales which are the increase in cart abandonment and churn rate. The key reasons for the increase are high additional cost, lack of personalization services. Coming up with a presentation necessitates that the majority of the effort goes into the content and the message you intend to convey. The visuals of a PowerPoint presentation can only be effective if it supplements and supports the story that is being told. Keeping this in mind our experts created Building Stronger Customer Increased Cart Abandonment And Churn Rate Due To Lack SA SS V to reduce the time that goes into designing the presentation. This way, you can concentrate on the message while our designers take care of providing you with the right template for the situation. This slide showcases the major reasons for the drop in e-commerce firm sales which are the increase in cart abandonment and churn rate. The key reasons for the increase are high additional cost, lack of personalization services.
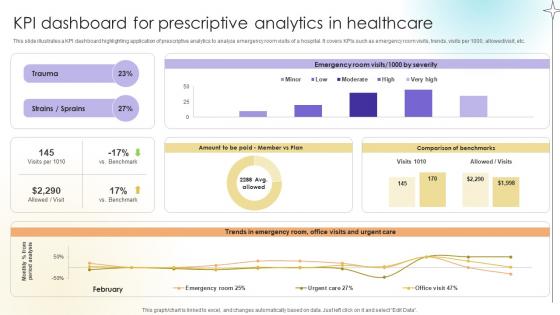
KPI Dashboard For Prescriptive Analytics In Healthcare Data Analytics SS V
This slide illustrates a KPI dashboard highlighting application of prescriptive analytics to analyze emergency room visits of a hospital. It covers KPIs such as emergency room visits, trends, visits per 1000, allowed or visit, etc. Find highly impressive KPI Dashboard For Prescriptive Analytics In Healthcare Data Analytics SS V on Slidegeeks to deliver a meaningful presentation. You can save an ample amount of time using these presentation templates. No need to worry to prepare everything from scratch because Slidegeeks experts have already done a huge research and work for you. You need to download KPI Dashboard For Prescriptive Analytics In Healthcare Data Analytics SS V for your upcoming presentation. All the presentation templates are 100 percent editable and you can change the color and personalize the content accordingly. Download now This slide illustrates a KPI dashboard highlighting application of prescriptive analytics to analyze emergency room visits of a hospital. It covers KPIs such as emergency room visits, trends, visits per 1000, allowed or visit, etc.
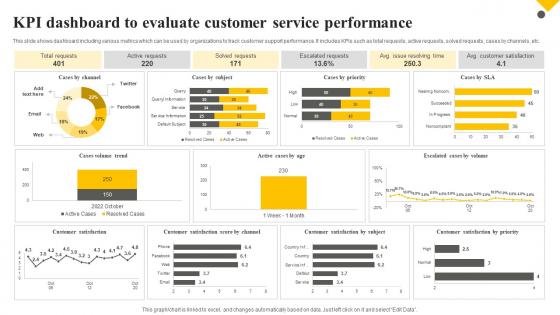
Client Support Plan To Increase Customer Kpi Dashboard To Evaluate Customer Service Performance Strategy SS V
This slide shows dashboard including various metrics which can be used by organizations to track customer support performance. It includes KPIs such as total requests, active requests, solved requests, cases by channels, etc. Find highly impressive Client Support Plan To Increase Customer Kpi Dashboard To Evaluate Customer Service Performance Strategy SS V on Slidegeeks to deliver a meaningful presentation. You can save an ample amount of time using these presentation templates. No need to worry to prepare everything from scratch because Slidegeeks experts have already done a huge research and work for you. You need to download Client Support Plan To Increase Customer Kpi Dashboard To Evaluate Customer Service Performance Strategy SS V for your upcoming presentation. All the presentation templates are 100 percent editable and you can change the color and personalize the content accordingly. Download now This slide shows dashboard including various metrics which can be used by organizations to track customer support performance. It includes KPIs such as total requests, active requests, solved requests, cases by channels, etc.
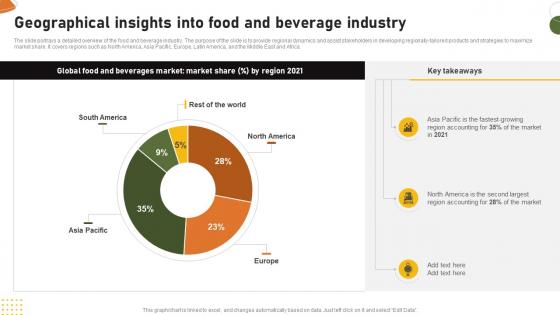
Food And Drink Industry Report Geographical Insights Into Food And Beverage Industry IR SS V
The slide portrays a detailed overview of the food and beverage industry. The purpose of the slide is to provide regional dynamics and assist stakeholders in developing regionally-tailored products and strategies to maximize market share. It covers regions such as North America, Asia Pacific, Europe, Latin America, and the Middle East and Africa. Find highly impressive Food And Drink Industry Report Geographical Insights Into Food And Beverage Industry IR SS V on Slidegeeks to deliver a meaningful presentation. You can save an ample amount of time using these presentation templates. No need to worry to prepare everything from scratch because Slidegeeks experts have already done a huge research and work for you. You need to download Food And Drink Industry Report Geographical Insights Into Food And Beverage Industry IR SS V for your upcoming presentation. All the presentation templates are 100 percent editable and you can change the color and personalize the content accordingly. Download now The slide portrays a detailed overview of the food and beverage industry. The purpose of the slide is to provide regional dynamics and assist stakeholders in developing regionally-tailored products and strategies to maximize market share. It covers regions such as North America, Asia Pacific, Europe, Latin America, and the Middle East and Africa.

ASIA Pacific Medical Device Market Outlook Surgical Devices Ppt Example IR SS V
The slide represents overview of Asia Pacific medical device industry. The purpose of the slide is to provide comprehensive analysis and forecast, offering insights into market trends, growth opportunities, and key factors influencing the sectors trajectory. It cover countries such as India and China. Create an editable ASIA Pacific Medical Device Market Outlook Surgical Devices Ppt Example IR SS V that communicates your idea and engages your audience. Whether you are presenting a business or an educational presentation, pre-designed presentation templates help save time. ASIA Pacific Medical Device Market Outlook Surgical Devices Ppt Example IR SS V is highly customizable and very easy to edit, covering many different styles from creative to business presentations. Slidegeeks has creative team members who have crafted amazing templates. So, go and get them without any delay. The slide represents overview of Asia Pacific medical device industry. The purpose of the slide is to provide comprehensive analysis and forecast, offering insights into market trends, growth opportunities, and key factors influencing the sectors trajectory. It cover countries such as India and China.
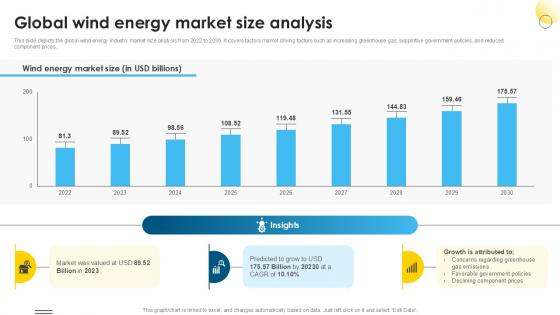
Global Wind Energy Market Size Global Wind Power Market PPT Slide IR SS V
This slide depicts the global wind energy industry market size analysis from 2022 to 2030. It covers factors market driving factors such as increasing greenhouse gas, supportive government policies, and reduced component prices. Find highly impressive Global Wind Energy Market Size Global Wind Power Market PPT Slide IR SS V on Slidegeeks to deliver a meaningful presentation. You can save an ample amount of time using these presentation templates. No need to worry to prepare everything from scratch because Slidegeeks experts have already done a huge research and work for you. You need to download Global Wind Energy Market Size Global Wind Power Market PPT Slide IR SS V for your upcoming presentation. All the presentation templates are 100 percent editable and you can change the color and personalize the content accordingly. Download now This slide depicts the global wind energy industry market size analysis from 2022 to 2030. It covers factors market driving factors such as increasing greenhouse gas, supportive government policies, and reduced component prices.

Major Reasons Of Ineffective Improving Customer Retention PPT Slide
The following slide depicts some major causes of inefficient customer support services to formulate strategies and boost customer satisfaction. It includes elements such as inability to understand consumer needs, lack of personalized services, rude employee behavior etc. Coming up with a presentation necessitates that the majority of the effort goes into the content and the message you intend to convey. The visuals of a PowerPoint presentation can only be effective if it supplements and supports the story that is being told. Keeping this in mind our experts created Major Reasons Of Ineffective Improving Customer Retention PPT Slide to reduce the time that goes into designing the presentation. This way, you can concentrate on the message while our designers take care of providing you with the right template for the situation. The following slide depicts some major causes of inefficient customer support services to formulate strategies and boost customer satisfaction. It includes elements such as inability to understand consumer needs, lack of personalized services, rude employee behavior etc.
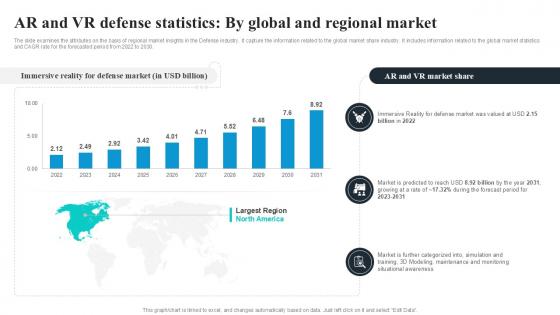
AR And VR Defense Statistics By Global Security Industry PPT Slide IR SS V
The slide examines the attributes on the basis of regional market insights in the Defense industry. It capture the information related to the global market share industry. It includes information related to the global market statistics and CAGR rate for the forecasted period from 2022 to 2030. Create an editable AR And VR Defense Statistics By Global Security Industry PPT Slide IR SS V that communicates your idea and engages your audience. Whether you are presenting a business or an educational presentation, pre-designed presentation templates help save time. AR And VR Defense Statistics By Global Security Industry PPT Slide IR SS V is highly customizable and very easy to edit, covering many different styles from creative to business presentations. Slidegeeks has creative team members who have crafted amazing templates. So, go and get them without any delay. The slide examines the attributes on the basis of regional market insights in the Defense industry. It capture the information related to the global market share industry. It includes information related to the global market statistics and CAGR rate for the forecasted period from 2022 to 2030.
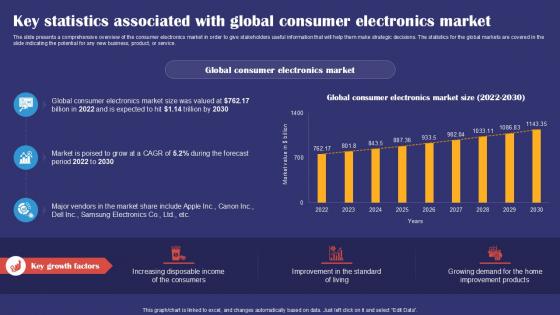
Key Statistics Associated With Global Consumer Electronics Smartphones Industry Report PPT PowerPoint IR SS V
The slide presents a comprehensive overview of the consumer electronics market in order to give stakeholders useful information that will help them make strategic decisions. The statistics for the global markets are covered in the slide indicating the potential for any new business, product, or service. Find highly impressive Key Statistics Associated With Global Consumer Electronics Smartphones Industry Report PPT PowerPoint IR SS V on Slidegeeks to deliver a meaningful presentation. You can save an ample amount of time using these presentation templates. No need to worry to prepare everything from scratch because Slidegeeks experts have already done a huge research and work for you. You need to download Key Statistics Associated With Global Consumer Electronics Smartphones Industry Report PPT PowerPoint IR SS V for your upcoming presentation. All the presentation templates are 100 percent editable and you can change the color and personalize the content accordingly. Download now The slide presents a comprehensive overview of the consumer electronics market in order to give stakeholders useful information that will help them make strategic decisions. The statistics for the global markets are covered in the slide indicating the potential for any new business, product, or service.
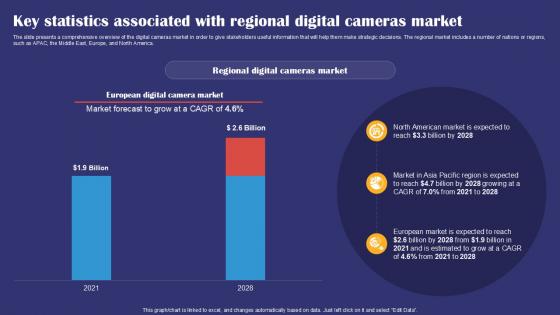
Key Statistics Associated With Regional Digital Cameras Smartphones Industry Report PPT Example IR SS V
The slide presents a comprehensive overview of the digital cameras market in order to give stakeholders useful information that will help them make strategic decisions. The regional market includes a number of nations or regions, such as APAC, the Middle East, Europe, and North America. Coming up with a presentation necessitates that the majority of the effort goes into the content and the message you intend to convey. The visuals of a PowerPoint presentation can only be effective if it supplements and supports the story that is being told. Keeping this in mind our experts created Key Statistics Associated With Regional Digital Cameras Smartphones Industry Report PPT Example IR SS V to reduce the time that goes into designing the presentation. This way, you can concentrate on the message while our designers take care of providing you with the right template for the situation. The slide presents a comprehensive overview of the digital cameras market in order to give stakeholders useful information that will help them make strategic decisions. The regional market includes a number of nations or regions, such as APAC, the Middle East, Europe, and North America.
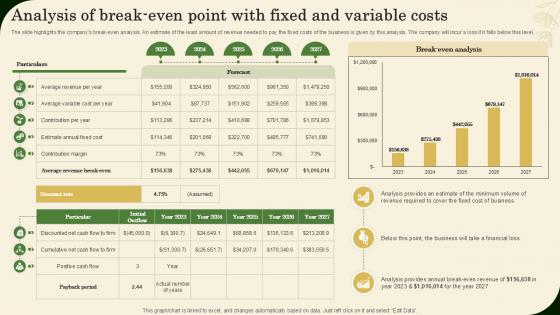
Analysis Of Break Even Point With Fixed And Variable Costs Landscaping Business Plan Ppt Sample BP SS V
The slide highlights the companys break-even analysis. An estimate of the least amount of revenue needed to pay the fixed costs of the business is given by this analysis. The company will incur a loss if it falls below this level. Boost your pitch with our creative Analysis Of Break Even Point With Fixed And Variable Costs Landscaping Business Plan Ppt Sample BP SS V Deliver an awe-inspiring pitch that will mesmerize everyone. Using these presentation templates you will surely catch everyones attention. You can browse the ppts collection on our website. We have researchers who are experts at creating the right content for the templates. So you do not have to invest time in any additional work. Just grab the template now and use them. The slide highlights the companys break-even analysis. An estimate of the least amount of revenue needed to pay the fixed costs of the business is given by this analysis. The company will incur a loss if it falls below this level.

Analysis Of Ecommerce Sales In Power BI Ppt Slide SS
This slide showcases dashboard for customer segmentation analysis. This template aims to provide opportunities to focus on more customers for selling cosmetics products and can be used to predict business growth. It helps business organization to enhance revenue from sales by focusing on the profit margins. Create an editable Analysis Of Ecommerce Sales In Power BI Ppt Slide SS that communicates your idea and engages your audience. Whether you are presenting a business or an educational presentation, pre-designed presentation templates help save time. Analysis Of Ecommerce Sales In Power BI Ppt Slide SS is highly customizable and very easy to edit, covering many different styles from creative to business presentations. Slidegeeks has creative team members who have crafted amazing templates. So, go and get them without any delay. This slide showcases dashboard for customer segmentation analysis. This template aims to provide opportunities to focus on more customers for selling cosmetics products and can be used to predict business growth. It helps business organization to enhance revenue from sales by focusing on the profit margins.
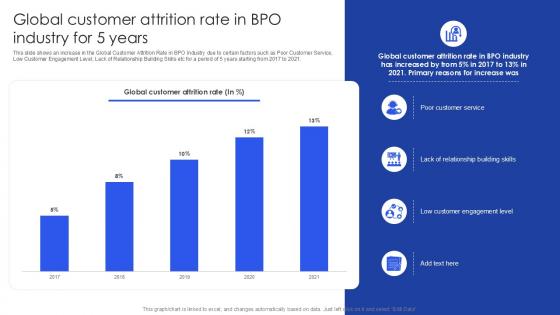
Global Customer Attrition Rate In BPO Industry For 5 Years PPT PowerPoint SS
This slide shows an increase in the Global Customer Attrition Rate in BPO Industry due to certain factors such as Poor Customer Service, Low Customer Engagement Level, Lack of Relationship Building Skills etc for a period of 5 years starting from 2017 to 2021. Find highly impressive Global Customer Attrition Rate In BPO Industry For 5 Years PPT PowerPoint SS on Slidegeeks to deliver a meaningful presentation. You can save an ample amount of time using these presentation templates. No need to worry to prepare everything from scratch because Slidegeeks experts have already done a huge research and work for you. You need to download Global Customer Attrition Rate In BPO Industry For 5 Years PPT PowerPoint SS for your upcoming presentation. All the presentation templates are 100 percent editable and you can change the color and personalize the content accordingly. Download now This slide shows an increase in the Global Customer Attrition Rate in BPO Industry due to certain factors such as Poor Customer Service, Low Customer Engagement Level, Lack of Relationship Building Skills etc for a period of 5 years starting from 2017 to 2021.
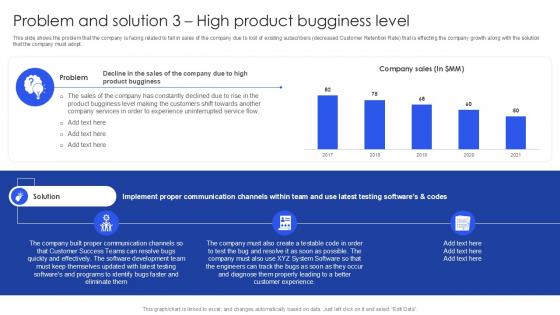
Problem And Solution 3 High Product Bugginess Level PPT Example SS
This slide shows the problem that the company is facing related to fall in sales of the company due to lost of existing subscribers decreased Customer Retention Rate that is effecting the company growth along with the solution that the company must adopt. Coming up with a presentation necessitates that the majority of the effort goes into the content and the message you intend to convey. The visuals of a PowerPoint presentation can only be effective if it supplements and supports the story that is being told. Keeping this in mind our experts created Problem And Solution 3 High Product Bugginess Level PPT Example SS to reduce the time that goes into designing the presentation. This way, you can concentrate on the message while our designers take care of providing you with the right template for the situation. This slide shows the problem that the company is facing related to fall in sales of the company due to lost of existing subscribers decreased Customer Retention Rate that is effecting the company growth along with the solution that the company must adopt.
Drip Email Marketing Campaign Management Dashboard PPT Presentation MKT SS V
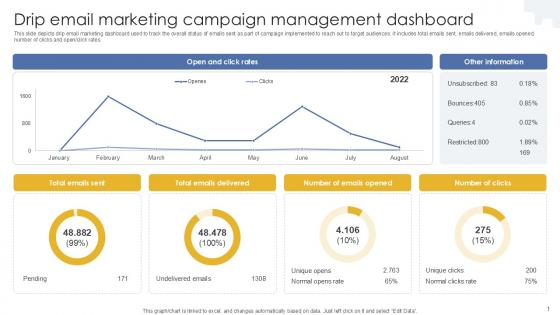
This slide depicts drip email marketing dashboard used to track the overall status of emails sent as part of campaign implemented to reach out to target audiences. It includes total emails sent, emails delivered, emails opened, number of clicks and open click rates. Present like a pro with Drip Email Marketing Campaign Management Dashboard PPT Presentation MKT SS V. Create beautiful presentations together with your team, using our easy-to-use presentation slides. Share your ideas in real-time and make changes on the fly by downloading our templates. So whether you are in the office, on the go, or in a remote location, you can stay in sync with your team and present your ideas with confidence. With Slidegeeks presentation got a whole lot easier. Grab these presentations today. This slide depicts drip email marketing dashboard used to track the overall status of emails sent as part of campaign implemented to reach out to target audiences. It includes total emails sent, emails delivered, emails opened, number of clicks and open click rates.
Global Landfill Management Step By Step Guide For Electronic Ppt PowerPoint
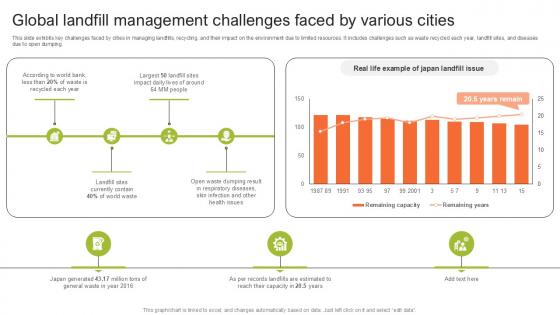
This slide exhibits key challenges faced by cities in managing landfills, recycling, and their impact on the environment due to limited resources. It includes challenges such as waste recycled each year, landfill sites, and diseases due to open dumping. Find highly impressive Global Landfill Management Step By Step Guide For Electronic Ppt PowerPoint on Slidegeeks to deliver a meaningful presentation. You can save an ample amount of time using these presentation templates. No need to worry to prepare everything from scratch because Slidegeeks experts have already done a huge research and work for you. You need to download Global Landfill Management Step By Step Guide For Electronic Ppt PowerPoint for your upcoming presentation. All the presentation templates are 100 percent editable and you can change the color and personalize the content accordingly. Download now This slide exhibits key challenges faced by cities in managing landfills, recycling, and their impact on the environment due to limited resources. It includes challenges such as waste recycled each year, landfill sites, and diseases due to open dumping.

Major Reasons Of Ineffective Enhancing Customer Experience Ppt Sample
The following slide depicts some major causes of inefficient customer support services to formulate strategies and boost customer satisfaction. It includes elements such as inability to understand consumer needs, lack of personalized services, rude employee behavior etc. Coming up with a presentation necessitates that the majority of the effort goes into the content and the message you intend to convey. The visuals of a PowerPoint presentation can only be effective if it supplements and supports the story that is being told. Keeping this in mind our experts created Major Reasons Of Ineffective Enhancing Customer Experience Ppt Sample to reduce the time that goes into designing the presentation. This way, you can concentrate on the message while our designers take care of providing you with the right template for the situation. The following slide depicts some major causes of inefficient customer support services to formulate strategies and boost customer satisfaction. It includes elements such as inability to understand consumer needs, lack of personalized services, rude employee behavior etc.
Social Media Engagement Rate And Strategic Plan To Increase Film Ppt Powerpoint Strategy SS V
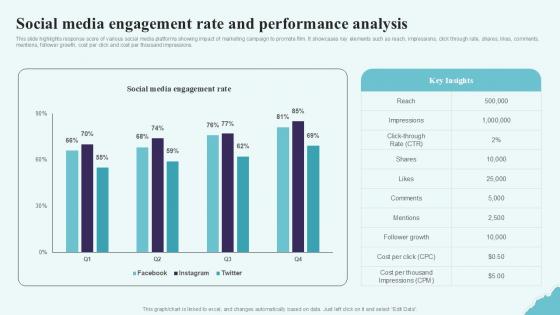
This slide highlights response score of various social media platforms showing impact of marketing campaign to promote film. It showcases key elements such as reach, impressions, click through rate, shares, likes, comments, mentions, follower growth, cost per click and cost per thousand impressions. Find highly impressive Social Media Engagement Rate And Strategic Plan To Increase Film Ppt Powerpoint Strategy SS V on Slidegeeks to deliver a meaningful presentation. You can save an ample amount of time using these presentation templates. No need to worry to prepare everything from scratch because Slidegeeks experts have already done a huge research and work for you. You need to download Social Media Engagement Rate And Strategic Plan To Increase Film Ppt Powerpoint Strategy SS V for your upcoming presentation. All the presentation templates are 100 percent editable and you can change the color and personalize the content accordingly. Download now This slide highlights response score of various social media platforms showing impact of marketing campaign to promote film. It showcases key elements such as reach, impressions, click through rate, shares, likes, comments, mentions, follower growth, cost per click and cost per thousand impressions.

Dashboard To Evaluate Top Performing Comprehensive Guide To Wholesale Ppt Presentation
This slide showcases dashboard which helps track sales representatives performance by assessing cold calling KPIs. it provides information regarding KPIs such as conversion rates, no. of items sold. No. of deals converted, value generated etc. Coming up with a presentation necessitates that the majority of the effort goes into the content and the message you intend to convey. The visuals of a PowerPoint presentation can only be effective if it supplements and supports the story that is being told. Keeping this in mind our experts created Dashboard To Evaluate Top Performing Comprehensive Guide To Wholesale Ppt Presentation to reduce the time that goes into designing the presentation. This way, you can concentrate on the message while our designers take care of providing you with the right template for the situation. This slide showcases dashboard which helps track sales representatives performance by assessing cold calling KPIs. it provides information regarding KPIs such as conversion rates, no. of items sold. No. of deals converted, value generated etc.


 Continue with Email

 Home
Home


