Clock Diagram
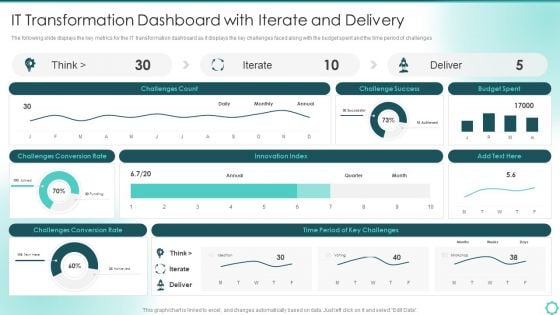
Digitalization Of Transportation Enterprise IT Transformation Dashboard With Iterate And Delivery Designs PDF
The following slide displays the key metrics for the IT transformation dashboard as it displays the key challenges faced along with the budget spent and the time period of challenges. Deliver and pitch your topic in the best possible manner with this Digitalization Of Transportation Enterprise IT Transformation Dashboard With Iterate And Delivery Designs PDF. Use them to share invaluable insights on Innovation Index, Budget Spent, Conversion Rate and impress your audience. This template can be altered and modified as per your expectations. So, grab it now.
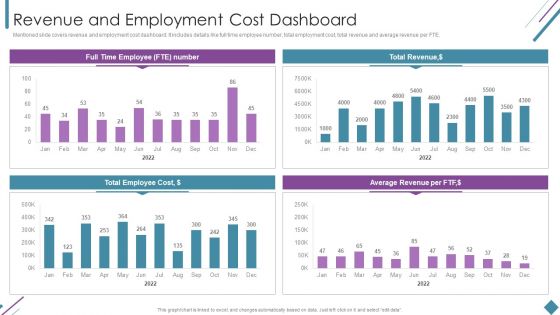
Metrics To Measure Business Performance Revenue And Employment Cost Dashboard Clipart PDF
Mentioned slide covers revenue and employment cost dashboard. It includes details like full time employee number, total employment cost, total revenue and average revenue per FTE. Deliver and pitch your topic in the best possible manner with this Metrics To Measure Business Performance Revenue And Employment Cost Dashboard Clipart PDF. Use them to share invaluable insights on Total Revenue, Average Revenue Per, Total Employee Cost and impress your audience. This template can be altered and modified as per your expectations. So, grab it now.
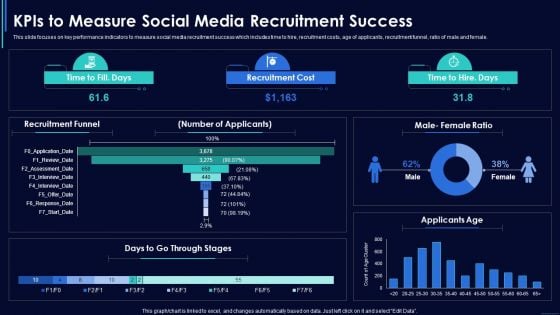
Social Media Hiring Strategic Procedure Kpis To Measure Social Media Recruitment Success Sample PDF
This slide focuses on key performance indicators to measure social media recruitment success which includes time to hire, recruitment costs, age of applicants, recruitment funnel, ratio of male and female. Deliver an awe inspiring pitch with this creative Social Media Hiring Strategic Procedure Kpis To Measure Social Media Recruitment Success Sample PDF bundle. Topics like Recruitment Funnel, Recruitment Cost, Female Ratio can be discussed with this completely editable template. It is available for immediate download depending on the needs and requirements of the user.
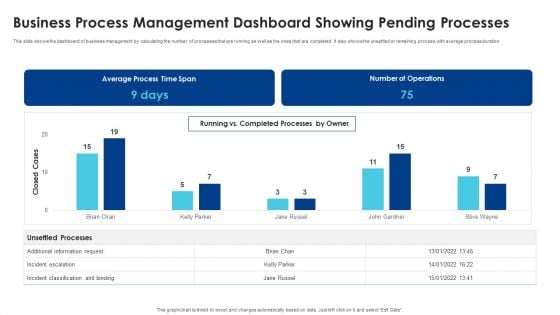
Business Process Management Dashboard Showing Pending Processes Graphics PDF
This slide shows the dashboard of business management by calculating the number of processes that are running as well as the ones that are completed. It also shows the unsettled or remaining process with average process duration. Showcasing this set of slides titled Business Process Management Dashboard Showing Pending Processes Graphics PDF. The topics addressed in these templates are Average Process, Time Span, Number Operations. All the content presented in this PPT design is completely editable. Download it and make adjustments in color, background, font etc. as per your unique business setting.
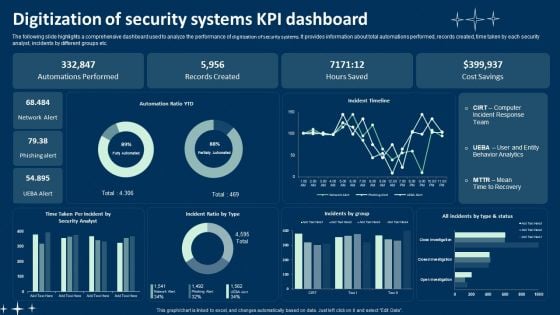
Digitization Of Security Systems KPI Dashboard Ppt Summary Portfolio PDF
The following slide highlights a comprehensive dashboard used to analyze the performance of digitization of security systems. It provides information about total automations performed, records created, time taken by each security analyst, incidents by different groups etc. Showcasing this set of slides titled Digitization Of Security Systems KPI Dashboard Ppt Summary Portfolio PDF. The topics addressed in these templates are Automations Performed, Records Created, Hours Saved. All the content presented in this PPT design is completely editable. Download it and make adjustments in color, background, font etc. as per your unique business setting.
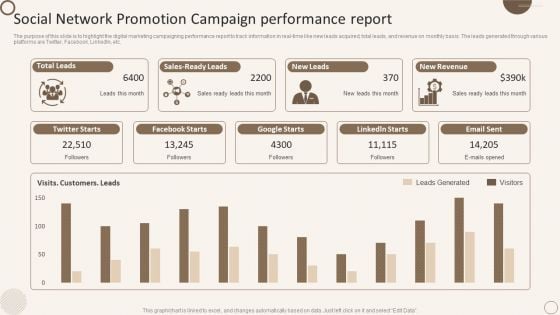
Social Network Promotion Campaign Performance Report Demonstration PDF
The purpose of this slide is to highlight the digital marketing campaigning performance report to track information in real-time like new leads acquired, total leads, and revenue on monthly basis. The leads generated through various platforms are Twitter, Facebook, LinkedIn, etc. Pitch your topic with ease and precision using this Social Network Promotion Campaign Performance Report Demonstration PDF. This layout presents information on Sales Ready Leads, New Leads, New Revenue. It is also available for immediate download and adjustment. So, changes can be made in the color, design, graphics or any other component to create a unique layout.
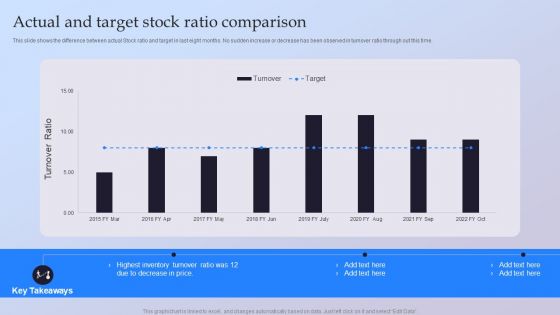
Actual And Target Stock Ratio Comparison Ppt Visual Aids Ideas PDF
This slide shows the difference between actual Stock ratio and target in last eight months. No sudden increase or decrease has been observed in turnover ratio through out this time. Showcasing this set of slides titled Actual And Target Stock Ratio Comparison Ppt Visual Aids Ideas PDF. The topics addressed in these templates are Turnover Ratio, Price, 2015 To 2022. All the content presented in this PPT design is completely editable. Download it and make adjustments in color, background, font etc. as per your unique business setting.
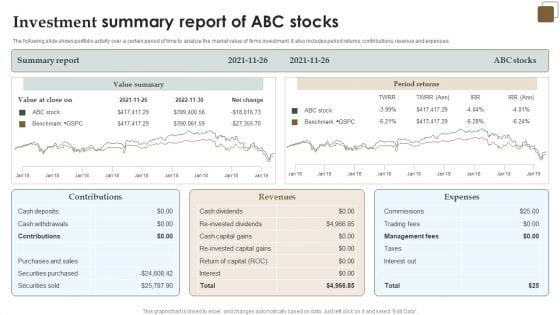
Investment Summary Report Of ABC Stocks Introduction PDF
The following slide shows portfolio activity over a certain period of time to analyze the market value of firms investment. It also includes period returns, contributions, revenue and expenses. Pitch your topic with ease and precision using this Investment Summary Report Of ABC Stocks Introduction PDF. This layout presents information on Summary Report, Value Summary, Revenues, Expenses. It is also available for immediate download and adjustment. So, changes can be made in the color, design, graphics or any other component to create a unique layout.
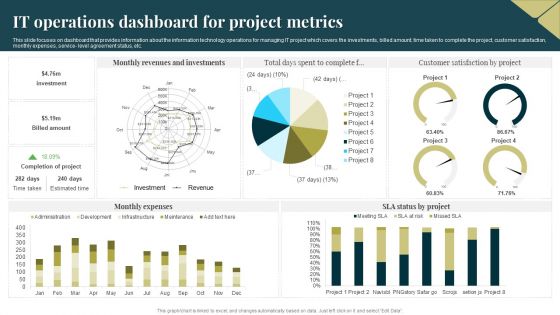
IT Operations Dashboard For Project Metrics Portrait PDF
This slide focuses on dashboard that provides information about the information technology operations for managing IT project which covers the investments, billed amount, time taken to complete the project, customer satisfaction, monthly expenses, service level agreement status, etc. Pitch your topic with ease and precision using this IT Operations Dashboard For Project Metrics Portrait PDF. This layout presents information on Revenues, Investments, Monthly Expenses. It is also available for immediate download and adjustment. So, changes can be made in the color, design, graphics or any other component to create a unique layout.
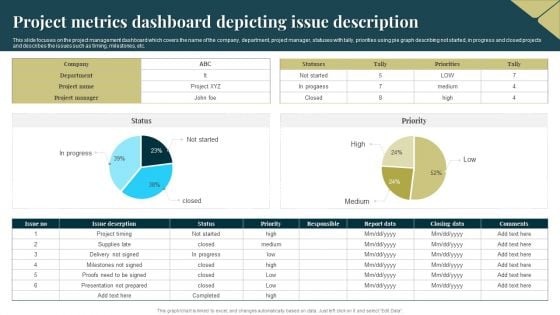
Project Metrics Dashboard Depicting Issue Description Rules PDF
This slide focuses on the project management dashboard which covers the name of the company, department, project manager, statuses with tally, priorities using pie graph describing not started, in progress and closed projects and describes the issues such as timing, milestones, etc. Showcasing this set of slides titled Project Metrics Dashboard Depicting Issue Description Rules PDF. The topics addressed in these templates are Project Metrics, Dashboard Depicting. All the content presented in this PPT design is completely editable. Download it and make adjustments in color, background, font etc. as per your unique business setting.
Project Metrics Dashboard Depicting Tracking System Inspiration PDF
This slide focuses on project management dashboard which covers the four spirit teams, iteration defects by priority with quarterly roadmap with legends such as high attention, low, none, normal and resolved immediately with time in iteration, etc. Pitch your topic with ease and precision using this Project Metrics Dashboard Depicting Tracking System Inspiration PDF. This layout presents information on Project Metrics, Dashboard Depicting, Tracking System. It is also available for immediate download and adjustment. So, changes can be made in the color, design, graphics or any other component to create a unique layout.
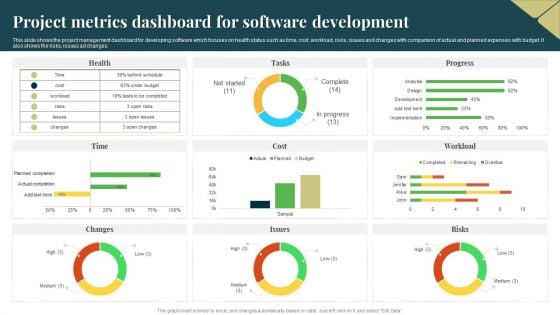
Project Metrics Dashboard For Software Development Designs PDF
This slide shows the project management dashboard for developing software which focuses on health status such as time, cost, workload, risks, issues and changes with comparison of actual and planned expenses with budget. It also shows the risks, issues ad changes. Pitch your topic with ease and precision using this Project Metrics Dashboard For Software Development Designs PDF. This layout presents information on Risks, Budget, Cost. It is also available for immediate download and adjustment. So, changes can be made in the color, design, graphics or any other component to create a unique layout.

Project Metrics Dashboard With Task Status Rules PDF
This slide shows the project management dashboard which shows the number of team members of managing project activities, estimated and actual time to complete the project task, hours taken by employees with achieved and open milestones and progress status. Pitch your topic with ease and precision using this Project Metrics Dashboard With Task Status Rules PDF. This layout presents information on Team Members, Employee. It is also available for immediate download and adjustment. So, changes can be made in the color, design, graphics or any other component to create a unique layout.
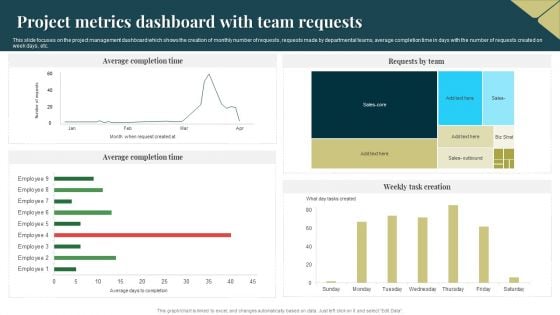
Project Metrics Dashboard With Team Requests Background PDF
This slide focuses on the project management dashboard which shows the creation of monthly number of requests, requests made by departmental teams, average completion time in days with the number of requests created on week days, etc. Pitch your topic with ease and precision using this Project Metrics Dashboard With Team Requests Background PDF. This layout presents information on Project Metrics Dashboard, Team Requests. It is also available for immediate download and adjustment. So, changes can be made in the color, design, graphics or any other component to create a unique layout.

Customer Grievance Call Handling Dashboard With Abandon Rate Introduction PDF
This slide showcases dashboard that can help organization to identify the resolution time and average abandon rate of customer grievance calls. Its key components are average answer speed, avg calls or minute and overall satisfaction score. Showcasing this set of slides titled Customer Grievance Call Handling Dashboard With Abandon Rate Introduction PDF. The topics addressed in these templates are Customer Grievance Call Handling, Dashboard With Abandon Rate. All the content presented in this PPT design is completely editable. Download it and make adjustments in color, background, font etc. as per your unique business setting.
Weekly Customer Grievance Tracking Dashboard Designs PDF
This slide showcases dashboard that can help organization to identify the open and overdue status of customer grievance . It can guide managers to resolve the complaints and issues within stipulated time for customer satisfaction. Pitch your topic with ease and precision using this Weekly Customer Grievance Tracking Dashboard Designs PDF. This layout presents information on Average, Traffic Analysis, Customer Satisfaction Ratings. It is also available for immediate download and adjustment. So, changes can be made in the color, design, graphics or any other component to create a unique layout.
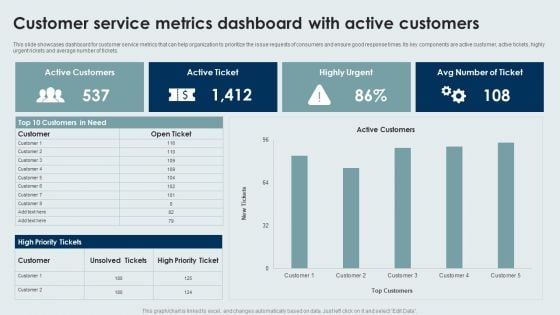
Customer Service Metrics Dashboard With Active Customers Ideas PDF
This slide showcases dashboard for customer service metrics that can help organization to prioritize the issue requests of consumers and ensure good response times. Its key components are active customer, active tickets, highly urgent rickets and average number of tickets. Showcasing this set of slides titled Customer Service Metrics Dashboard With Active Customers Ideas PDF. The topics addressed in these templates are Customer Service, Metrics Dashboard, Active Customers. All the content presented in this PPT design is completely editable. Download it and make adjustments in color, background, font etc. as per your unique business setting.
Insider Threat In Cyber Security Tracking Dashboard With User Details Portrait PDF
This slide shows user details tracked by insider threat dashboard. It provides information such as exposure events, file activity, archive, document, image, pdf, ppt, scripts, etc. Pitch your topic with ease and precision using this Insider Threat In Cyber Security Tracking Dashboard With User Details Portrait PDF. This layout presents information on Private Data, Exposure Events, User Activity, File Activity, Over Time. It is also available for immediate download and adjustment. So, changes can be made in the color, design, graphics or any other component to create a unique layout.
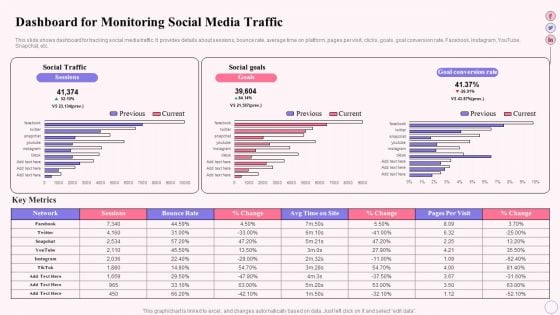
Integrating Social Media Tactics Dashboard For Monitoring Social Media Traffic Ideas PDF
This slide shows dashboard for tracking social media traffic. It provides details about sessions, bounce rate, average time on platform, pages per visit, clicks, goals, goal conversion rate, Facebook, Instagram, YouTube, Snapchat, etc. Deliver and pitch your topic in the best possible manner with this Integrating Social Media Tactics Dashboard For Monitoring Social Media Traffic Ideas PDF. Use them to share invaluable insights on Social Traffic, Social Goals, Goal Conversion Rate and impress your audience. This template can be altered and modified as per your expectations. So, grab it now.
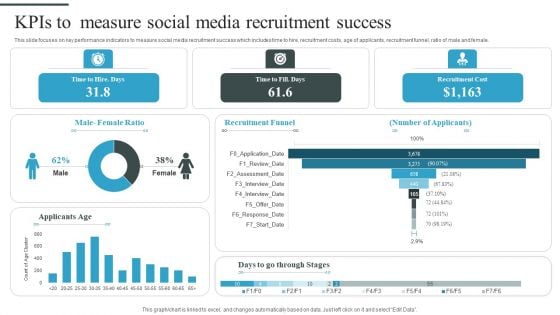
Tactical Process For Social Kpis To Measure Social Media Recruitment Success Demonstration PDF
This slide focuses on key performance indicators to measure social media recruitment success which includes time to hire, recruitment costs, age of applicants, recruitment funnel, ratio of male and female. Deliver an awe inspiring pitch with this creative Tactical Process For Social Kpis To Measure Social Media Recruitment Success Demonstration PDF bundle. Topics like Male Female Ratio, Recruitment Funnel, Number Applicants can be discussed with this completely editable template. It is available for immediate download depending on the needs and requirements of the user.
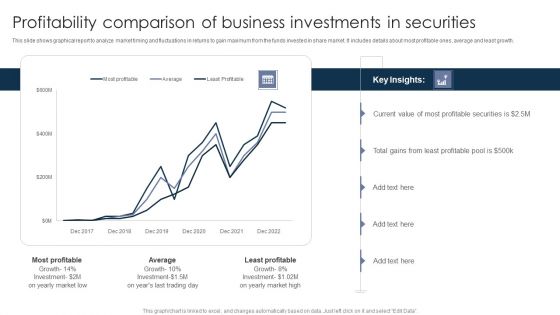
Profitability Comparison Of Business Investments In Securities Ppt PowerPoint Presentation Outline Deck PDF
This slide shows graphical report to analyze market timing and fluctuations in returns to gain maximum from the funds invested in share market. It includes details about most profitable ones, average and least growth. Pitch your topic with ease and precision using this Profitability Comparison Of Business Investments In Securities Ppt PowerPoint Presentation Outline Deck PDF. This layout presents information on Most Profitable, Least Profitable, Least Profitable. It is also available for immediate download and adjustment. So, changes can be made in the color, design, graphics or any other component to create a unique layout.
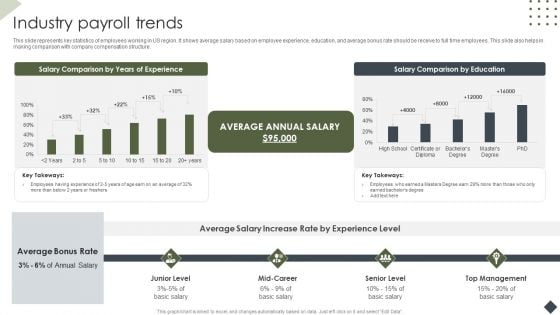
Income Assessment Document Industry Payroll Trends Ppt Pictures Deck PDF
This slide represents key statistics of employees working in US region. It shows average salary based on employee experience, education, and average bonus rate should be receive to full time employees. This slide also helps in making comparison with company compensation structure. Deliver and pitch your topic in the best possible manner with this Income Assessment Document Industry Payroll Trends Ppt Pictures Deck PDF. Use them to share invaluable insights on Salary Comparison, Years Experience, Average Annual Salary and impress your audience. This template can be altered and modified as per your expectations. So, grab it now.
Dashboard For Tracking Customer Service Team Performance Clipart PDF
This slide covers the KPI dashboard for analyzing the performance of client support department. It includes metrics such as first call resolution, unresolved calls, average response rate, the best day to call, average time to solve issues, etc. Deliver an awe inspiring pitch with this creative Dashboard For Tracking Customer Service Team Performance Clipart PDF bundle. Topics like Dashboard For Tracking Customer, Service Team Performance can be discussed with this completely editable template. It is available for immediate download depending on the needs and requirements of the user.
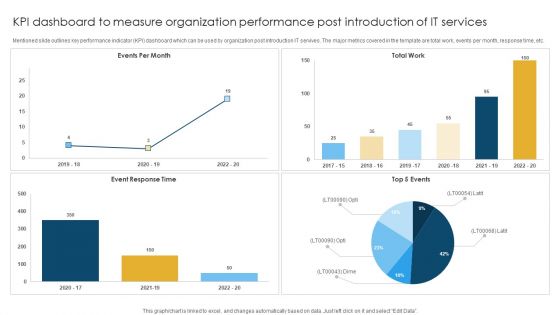
KPI Dashboard To Measure Organization Performance Post Introduction Of IT Services Rules PDF
Mentioned slide outlines key performance indicator KPI dashboard which can be used by organization post introduction IT servives. The major metrics covered in the template are total work, events per month, response time, etc. Showcasing this set of slides titled KPI Dashboard To Measure Organization Performance Post Introduction Of IT Services Rules PDF. The topics addressed in these templates are Event Response, Total Work, Events Per. All the content presented in this PPT design is completely editable. Download it and make adjustments in color, background, font etc. as per your unique business setting.
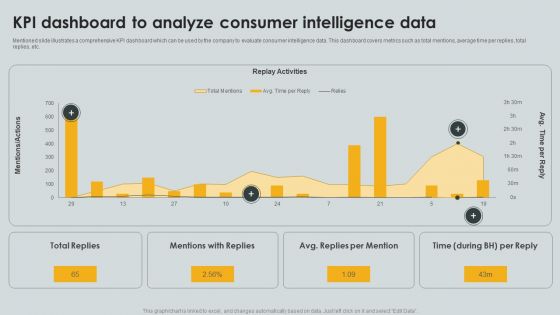
KPI Dashboard To Analyze Consumer Intelligence Data Ppt PowerPoint Presentation File Portfolio PDF
Mentioned slide illustrates a comprehensive KPI dashboard which can be used by the company to evaluate consumer intelligence data. This dashboard covers metrics such as total mentions, average time per replies, total replies, etc. Pitch your topic with ease and precision using this KPI Dashboard To Analyze Consumer Intelligence Data Ppt PowerPoint Presentation File Portfolio PDF. This layout presents information on Replay Activities, Total Replies, Mentions Replies. It is also available for immediate download and adjustment. So, changes can be made in the color, design, graphics or any other component to create a unique layout.
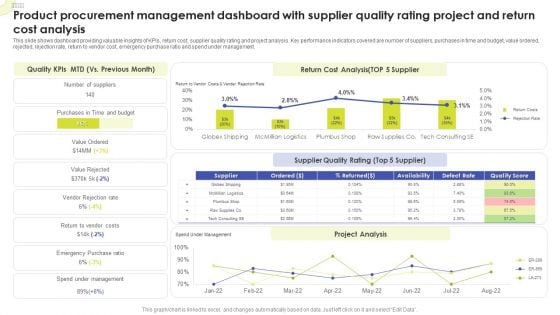
Product Procurement Management Dashboard With Supplier Quality Rating Project And Return Cost Analysis Sample PDF
This slide shows dashboard providing valuable insights of KPIs, return cost, supplier quality rating and project analysis. Key performance indicators covered are number of suppliers, purchases in time and budget, value ordered, rejected, rejection rate, return to vendor cost, emergency purchase ratio and spend under management. Pitch your topic with ease and precision using this Product Procurement Management Dashboard With Supplier Quality Rating Project And Return Cost Analysis Sample PDF. This layout presents information on Quality KPIs, Return Cost Analysis, Supplier Quality Rating. It is also available for immediate download and adjustment. So, changes can be made in the color, design, graphics or any other component to create a unique layout.
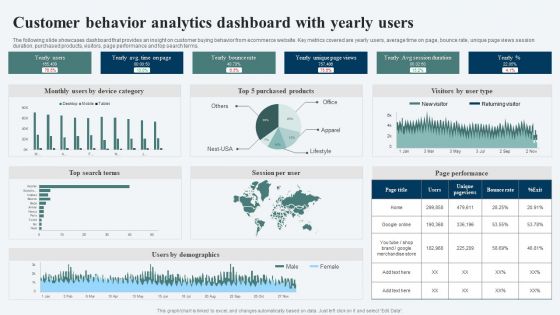
Customer Behavior Analytics Dashboard With Yearly Users Ppt Portfolio Ideas PDF
The following slide showcases dashboard that provides an insight on customer buying behavior from ecommerce website. Key metrics covered are yearly users, average time on page, bounce rate, unique page views session duration, purchased products, visitors, page performance and top search terms. Showcasing this set of slides titled Customer Behavior Analytics Dashboard With Yearly Users Ppt Portfolio Ideas PDF. The topics addressed in these templates are Yearly Users, Yearly Bounce Rate, Top Search Terms. All the content presented in this PPT design is completely editable. Download it and make adjustments in color, background, font etc. as per your unique business setting.
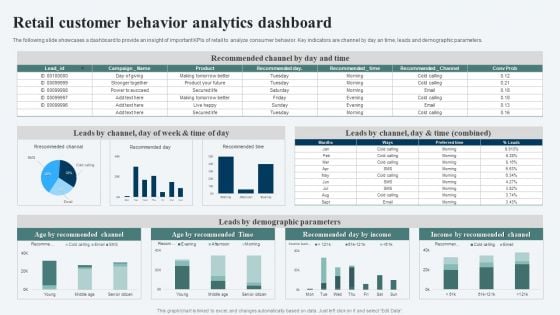
Retail Customer Behavior Analytics Dashboard Ppt Ideas Templates PDF
The following slide showcases a dashboard to provide an insight of important KPIs of retail to analyze consumer behavior. Key indicators are channel by day an time, leads and demographic parameters. Showcasing this set of slides titled Retail Customer Behavior Analytics Dashboard Ppt Ideas Templates PDF. The topics addressed in these templates are Recommended Channel, Leads Demographic Parameters, Income Recommended Channel. All the content presented in this PPT design is completely editable. Download it and make adjustments in color, background, font etc. as per your unique business setting.
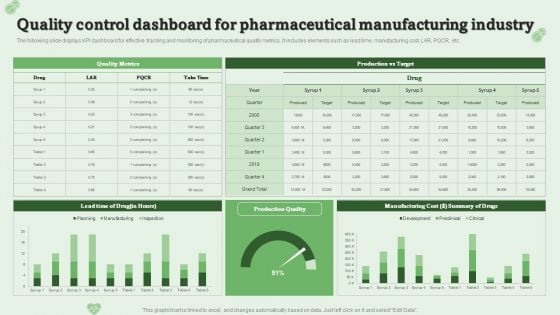
Quality Control Dashboard For Pharmaceutical Manufacturing Industry Ppt PowerPoint Presentation Model Layouts PDF
The following slide displays KPI dashboard for effective tracking and monitoring of pharmaceutical quality metrics. It includes elements such as lead time, manufacturing cost, LAR, PQCR, etc.Pitch your topic with ease and precision using this Quality Control Dashboard For Pharmaceutical Manufacturing Industry Ppt PowerPoint Presentation Model Layouts PDF. This layout presents information on Manufacturing Cost, Summary Drugs, Quality Metrics. It is also available for immediate download and adjustment. So, changes can be made in the color, design, graphics or any other component to create a unique layout.
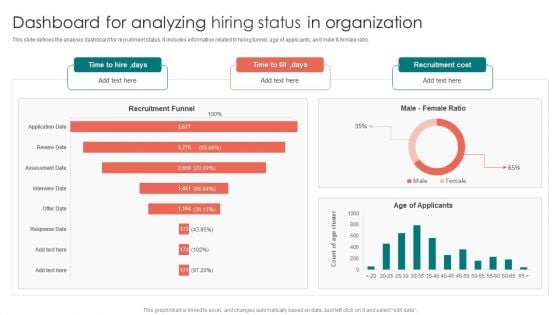
Dashboard For Analyzing Hiring Status In Organization Ppt PowerPoint Presentation Gallery Images PDF
This slide defines the analysis dashboard for recruitment status. It includes information related to hiring funnel, age of applicants, and male and female ratio. Pitch your topic with ease and precision using this Dashboard For Analyzing Hiring Status In Organization Ppt PowerPoint Presentation Gallery Images PDF. This layout presents information on Recruitment Funnel, Time To Hire, Age Applicants. It is also available for immediate download and adjustment. So, changes can be made in the color, design, graphics or any other component to create a unique layout.
Warehouse Automation Deployment Dashboard For Tracking Impact Of Warehouse House Infographics PDF
This slide covers the dashboard with after automation warehouse overview. It include KPIs such as autonomous robots status, robotic arms status, battery level, performance, time to return, etc. Deliver and pitch your topic in the best possible manner with this Warehouse Automation Deployment Dashboard For Tracking Impact Of Warehouse House Infographics PDF. Use them to share invaluable insights on Autonomous Robot, Systems Engineer, Warehouse Manager and impress your audience. This template can be altered and modified as per your expectations. So, grab it now.
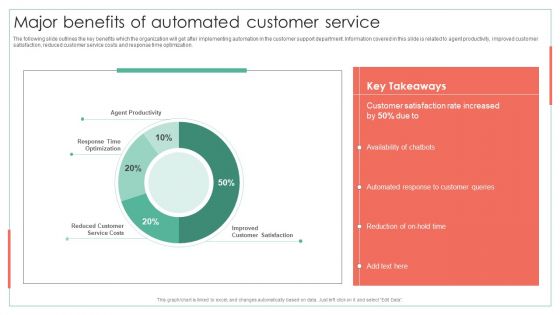
Major Benefits Of Automated Customer Service Achieving Operational Efficiency Graphics PDF
The following slide outlines the key benefits which the organization will get after implementing automation in the customer support department. Information covered in this slide is related to agent productivity, improved customer satisfaction, reduced customer service costs and response time optimization. Deliver an awe inspiring pitch with this creative Major Benefits Of Automated Customer Service Achieving Operational Efficiency Graphics PDF bundle. Topics like Customer Satisfaction, Automated Response, Customer Queries can be discussed with this completely editable template. It is available for immediate download depending on the needs and requirements of the user.
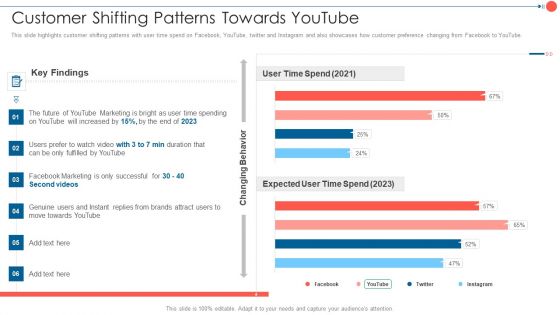
Youtube Advertising Techniques Customer Shifting Patterns Towards Youtube Professional PDF
This slide highlights customer shifting patterns with user time spend on Facebook, YouTube, twitter and Instagram and also showcases how customer preference changing from Facebook to YouTube. Deliver and pitch your topic in the best possible manner with this Youtube Advertising Techniques Customer Shifting Patterns Towards Youtube Professional PDF. Use them to share invaluable insights on Yearly Company Revenue, Monthly Product Sales, 2016 To 2021 and impress your audience. This template can be altered and modified as per your expectations. So, grab it now.
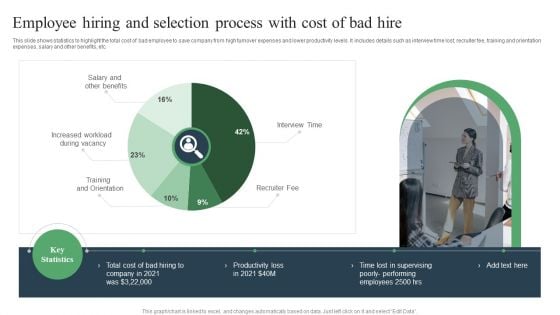
Employee Hiring And Selection Process With Cost Of Bad Hire Ppt PowerPoint Presentation Outline Skills PDF
This slide shows statistics to highlight the total cost of bad employee to save company from high turnover expenses and lower productivity levels. It includes details such as interview time lost, recruiter fee, training and orientation expenses, salary and other benefits, etc. Pitch your topic with ease and precision using this Employee Hiring And Selection Process With Cost Of Bad Hire Ppt PowerPoint Presentation Outline Skills PDF. This layout presents information on Employee Hiring, Selection Process, Candidate Screening. It is also available for immediate download and adjustment. So, changes can be made in the color, design, graphics or any other component to create a unique layout.
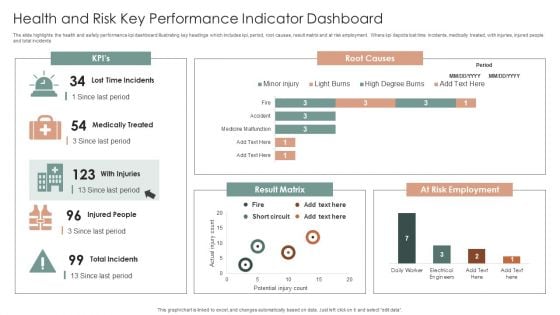
Health And Risk Key Performance Indicator Dashboard Ppt Layouts Graphics Design PDF
The slide highlights the health and safety performance kpi dashboard illustrating key headings which includes kpi, period, root causes, result matrix and at risk employment. Where kpi depicts lost time incidents, medically treated, with injuries, injured people and total incidents. Showcasing this set of slides titled Health And Risk Key Performance Indicator Dashboard Ppt Layouts Graphics Design PDF. The topics addressed in these templates are Root Causes, Result Matrix, At Risk Employment. All the content presented in this PPT design is completely editable. Download it and make adjustments in color, background, font etc. as per your unique business setting.

Patient Health And Risk Key Performance Indicator Dashboard Ppt Infographic Template Summary PDF
The following slide highlights the patient health and safety key performance indicator dashboard illustrating admission by department, admission by cost, patient satisfaction, total patients, operations cost, patient density, total staff, waiting time, treatment satisfaction and treatment confidence. Pitch your topic with ease and precision using this Patient Health And Risk Key Performance Indicator Dashboard Ppt Infographic Template Summary PDF. This layout presents information on Admission By Department, Admission Vs Cost, Patient Satisfaction. It is also available for immediate download and adjustment. So, changes can be made in the color, design, graphics or any other component to create a unique layout.
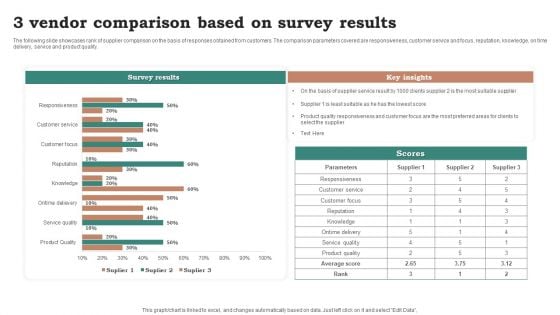
3 Vendor Comparison Based On Survey Results Ppt Ideas Graphic Tips PDF
The following slide showcases rank of supplier comparison on the basis of responses obtained from customers. The comparison parameters covered are responsiveness, customer service and focus, reputation, knowledge, on time delivery, service and product quality. Pitch your topic with ease and precision using this 3 Vendor Comparison Based On Survey Results Ppt Ideas Graphic Tips PDF. This layout presents information on Survey Results, Key Insights, Parameters. It is also available for immediate download and adjustment. So, changes can be made in the color, design, graphics or any other component to create a unique layout.
Consumer Journey Mapping Techniques Dashboard For Tracking Customer Service Team Performance Summary PDF
This slide covers the KPI dashboard for analyzing the performance of client support department. It includes metrics such as first call resolution, unresolved calls, average response rate, the best day to call, average time to solve issues, etc. Pitch your topic with ease and precision using this Consumer Journey Mapping Techniques Dashboard For Tracking Customer Service Team Performance Summary PDF. This layout presents information on Dashboard For Tracking Customer, Service Team Performance. It is also available for immediate download and adjustment. So, changes can be made in the color, design, graphics or any other component to create a unique layout.
Dashboard For Tracking Customer Service Team Performance Information PDF
This slide covers the KPI dashboard for analyzing the performance of client support department. It includes metrics such as first call resolution, unresolved calls, average response rate, the best day to call, average time to solve issues, etc. Deliver an awe inspiring pitch with this creative Dashboard For Tracking Customer Service Team Performance Information PDF bundle. Topics like Dashboard For Tracking Customer, Service Team Performance can be discussed with this completely editable template. It is available for immediate download depending on the needs and requirements of the user.

Deploying Automation In Decreasing Management Efficiency Status In The Company Designs PDF
This slide covers the current shipping and logistics management efficiency status in the company in terms of efficient and inefficient percentages.Create an editable Deploying Automation In Decreasing Management Efficiency Status In The Company Designs PDF that communicates your idea and engages your audience. Whether youre presenting a business or an educational presentation, pre designed presentation templates help save time.Deploying Automation In Decreasing Management Efficiency Status In The Company Designs PDF is highly customizable and very easy to edit, covering many different styles from creative to business presentations. Slidegeeks has creative team members who have crafted amazing templates. So, go and get them without any delay.
Shipping And Logistics Tracking Dashboard With Shipments And Fleet Status Elements PDF
This slide covers Key performance indicators to track the automation system of the company. This dashboard includes Logistics Efficiency Status, delivery time accuracy etc. Take your projects to the next level with our ultimate collection of Shipping And Logistics Tracking Dashboard With Shipments And Fleet Status Elements PDF. Slidegeeks has designed a range of layouts that are perfect for representing task or activity duration, keeping track of all your deadlines at a glance. Tailor these designs to your exact needs and give them a truly corporate look with your own brand colors they ll make your projects stand out from the rest.
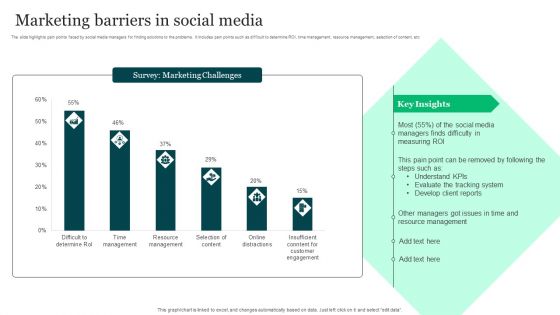
Marketing Barriers In Social Media Ppt Background PDF
This slide highlights pain points faced by social media managers for finding solutions to the problems. It includes pain points such as difficult to determine ROI, time management, resource management, selection of content, etc. Pitch your topic with ease and precision using this Marketing Barriers In Social Media Ppt Background PDF. This layout presents information on Marketing Challenges, Social Media Managers, Measuring ROI. It is also available for immediate download and adjustment. So, changes can be made in the color, design, graphics or any other component to create a unique layout.
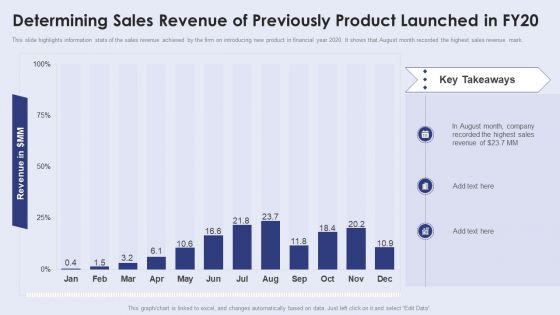
Determining Sales Revenue Of Previously Product Launched In Fy20 Rules PDF
This slide highlights information stats of the sales revenue achieved by the firm on introducing new product in financial year 2020. It shows that August month recorded the highest sales revenue mark. The best PPT templates are a great way to save time, energy, and resources. Slidegeeks have 100 percent editable powerpoint slides making them incredibly versatile. With these quality presentation templates, you can create a captivating and memorable presentation by combining visually appealing slides and effectively communicating your message. Download Determining Sales Revenue Of Previously Product Launched In Fy20 Rules PDF from Slidegeeks and deliver a wonderful presentation.
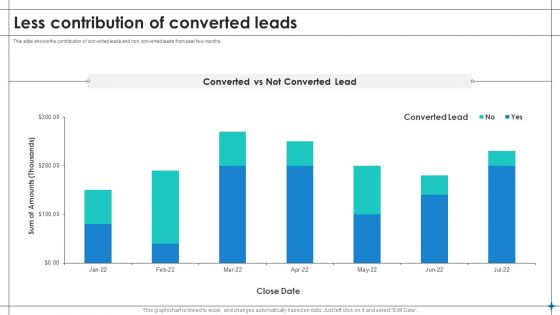
Increase Sales By Lead Generation Less Contribution Of Converted Leads Sample PDF
This slide shows the contribution of converted leads and non converted leads from past few months. Coming up with a presentation necessitates that the majority of the effort goes into the content and the message you intend to convey. The visuals of a PowerPoint presentation can only be effective if it supplements and supports the story that is being told. Keeping this in mind our experts created Increase Sales By Lead Generation Less Contribution Of Converted Leads Sample PDF to reduce the time that goes into designing the presentation. This way, you can concentrate on the message while our designers take care of providing you with the right template for the situation.
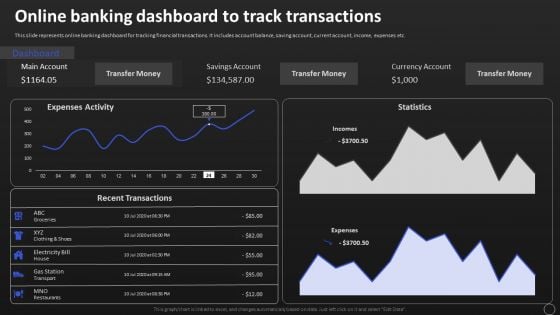
Net Banking Channel And Service Management Online Banking Dashboard To Track Transactions Professional PDF
This slide represents online banking dashboard for tracking financial transactions. It includes account balance, saving account, current account, income, expenses etc. Boost your pitch with our creative Net Banking Channel And Service Management Online Banking Dashboard To Track Transactions Professional PDF. Deliver an awe inspiring pitch that will mesmerize everyone. Using these presentation templates you will surely catch everyones attention. You can browse the ppts collection on our website. We have researchers who are experts at creating the right content for the templates. So you dont have to invest time in any additional work. Just grab the template now and use them.
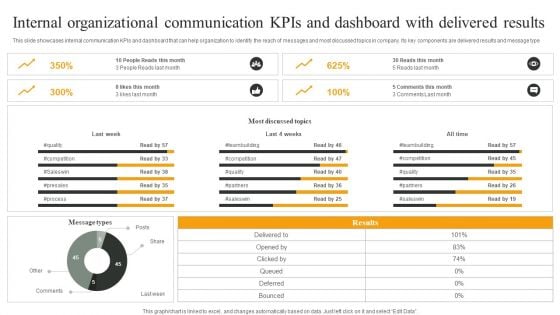
Internal Organizational Communication Kpis And Dashboard With Delivered Results Designs PDF
This slide showcases internal communication KPIs and dashboard that can help organization to identify the reach of messages and most discussed topics in company. Its key components are delivered results and message type. Showcasing this set of slides titled Internal Organizational Communication Kpis And Dashboard With Delivered Results Designs PDF. The topics addressed in these templates are Most Discussed Topics, All Time, Last Week. All the content presented in this PPT design is completely editable. Download it and make adjustments in color, background, font etc. as per your unique business setting.
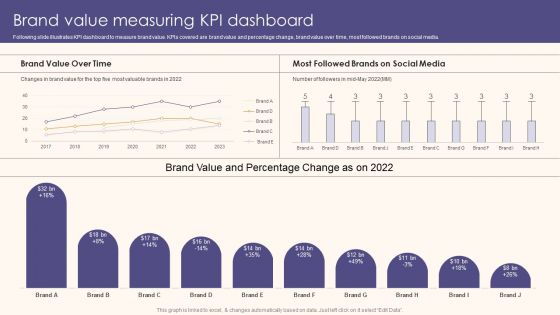
Brand Value Measuring KPI Dashboard Guide To Understand Evaluate And Enhance Brand Value Slides PDF
Following slide illustrates KPI dashboard to measure brand value. KPIs covered are brand value and percentage change, brand value over time, most followed brands on social media.Take your projects to the next level with our ultimate collection of Brand Value Measuring KPI Dashboard Guide To Understand Evaluate And Enhance Brand Value Slides PDF. Slidegeeks has designed a range of layouts that are perfect for representing task or activity duration, keeping track of all your deadlines at a glance. Tailor these designs to your exact needs and give them a truly corporate look with your own brand colors they all make your projects stand out from the rest
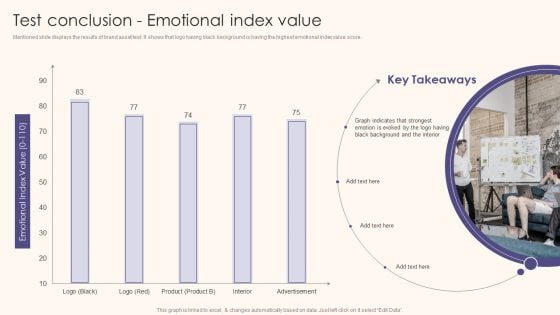
Test Conclusion Emotional Index Value Guide To Understand Evaluate And Enhance Brand Value Topics PDF
Present like a pro with Test Conclusion Emotional Index Value Guide To Understand Evaluate And Enhance Brand Value Topics PDF Create beautiful presentations together with your team, using our easy-to-use presentation slides. Share your ideas in real-time and make changes on the fly by downloading our templates. So whether you are in the office, on the go, or in a remote location, you can stay in sync with your team and present your ideas with confidence. With Slidegeeks presentation got a whole lot easier. Grab these presentations today.
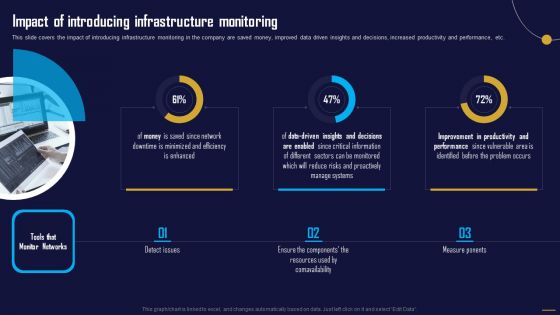
Impact Of Introducing Infrastructure Monitoring Information Tech System Maintenance Guidelines PDF
This slide covers the impact of introducing infrastructure monitoring in the company are saved money, improved data driven insights and decisions, increased productivity and performance, etc. Boost your pitch with our creative Impact Of Introducing Infrastructure Monitoring Information Tech System Maintenance Guidelines PDF. Deliver an awe-inspiring pitch that will mesmerize everyone. Using these presentation templates you will surely catch everyones attention. You can browse the ppts collection on our website. We have researchers who are experts at creating the right content for the templates. So you don not have to invest time in any additional work. Just grab the template now and use them.

Cyber Protection Incident And Privacy Analysis With KPI Dashboard Ideas PDF
The following slide highlights some kpas of cyber security incidents to evaluate and monitor threats. It includes elements such as open incidents, warnings by severity, average response time, warnings pending for inspection etc. Showcasing this set of slides titled Cyber Protection Incident And Privacy Analysis With KPI Dashboard Ideas PDF. The topics addressed in these templates are Cyber Protection Incident, Privacy Analysis, KPI Dashboard. All the content presented in this PPT design is completely editable. Download it and make adjustments in color, background, font etc. as per your unique business setting.
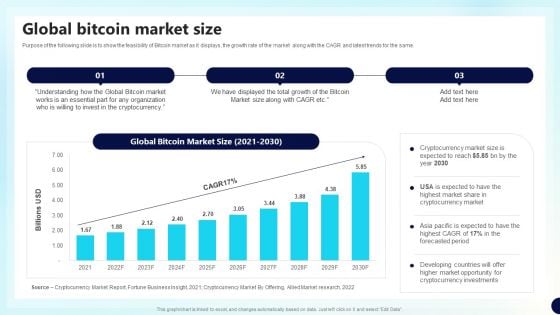
Global Bitcoin Market Size Decentralized Fund Investment Playbook Background PDF
Purpose of the following slide is to show the feasibility of Bitcoin market as it displays, the growth rate of the market along with the CAGR and latest trends for the same.Boost your pitch with our creative Global Bitcoin Market Size Decentralized Fund Investment Playbook Background PDF. Deliver an awe-inspiring pitch that will mesmerize everyone. Using these presentation templates you will surely catch everyones attention. You can browse the ppts collection on our website. We have researchers who are experts at creating the right content for the templates. So you don not have to invest time in any additional work. Just grab the template now and use them.
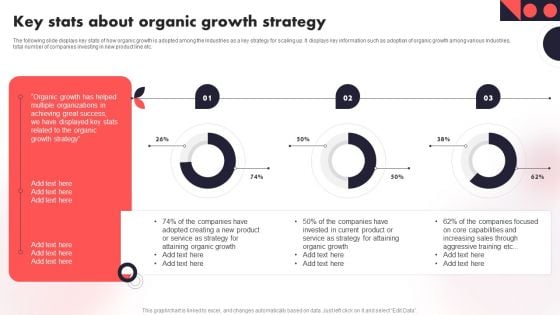
Key Stats About Organic Growth Strategy Year Over Year Business Success Playbook Sample PDF
The following slide displays key stats of how organic growth is adopted among the Industries as a key strategy for scaling up. It displays key information such as adoption of organic growth among various Industries, total number of companies investing in new product line etc. There are so many reasons you need a Key Stats About Organic Growth Strategy Year Over Year Business Success Playbook Sample PDF. The first reason is you can not spend time making everything from scratch, Thus, Slidegeeks has made presentation templates for you too. You can easily download these templates from our website easily.
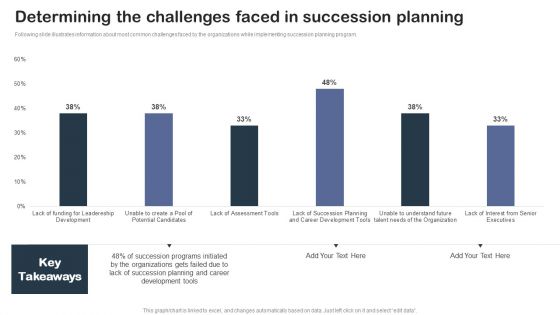
Staff Succession Planning And Development Determining The Challenges Faced Introduction PDF
Following slide illustrates information about most common challenges faced by the organizations while implementing succession planning program.Present like a pro with Staff Succession Planning And Development Determining The Challenges Faced Introduction PDF Create beautiful presentations together with your team, using our easy-to-use presentation slides. Share your ideas in real-time and make changes on the fly by downloading our templates. So whether you are in the office, on the go, or in a remote location, you can stay in sync with your team and present your ideas with confidence. With Slidegeeks presentation got a whole lot easier. Grab these presentations today.
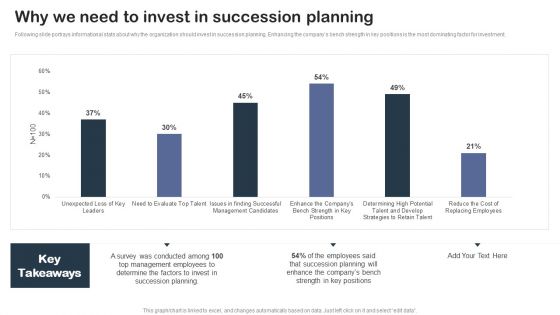
Staff Succession Planning And Development Strategy Why We Need To Invest Topics PDF
Following slide portrays informational stats about why the organization should invest in succession planning. Enhancing the companys bench strength in key positions is the most dominating factor for investment.Boost your pitch with our creative Staff Succession Planning And Development Strategy Why We Need To Invest Topics PDF. Deliver an awe-inspiring pitch that will mesmerize everyone. Using these presentation templates you will surely catch everyones attention. You can browse the ppts collection on our website. We have researchers who are experts at creating the right content for the templates. So you don not have to invest time in any additional work. Just grab the template now and use them.
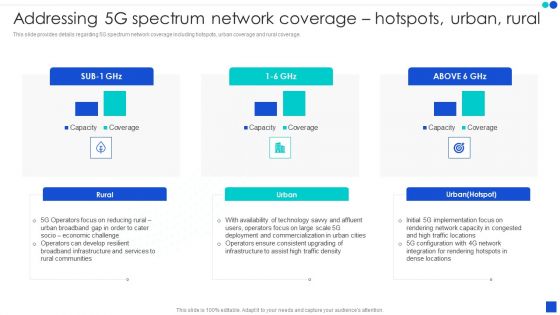
Addressing 5G Spectrum Network Coverage Hotspots Urban Rural Inspiration PDF
This slide provides details regarding 5G spectrum network coverage including hotspots, urban coverage and rural coverage. Create an editable Addressing 5G Spectrum Network Coverage Hotspots Urban Rural Inspiration PDF that communicates your idea and engages your audience. Whether you are presenting a business or an educational presentation, pre designed presentation templates help save time. Addressing 5G Spectrum Network Coverage Hotspots Urban Rural Inspiration PDF is highly customizable and very easy to edit, covering many different styles from creative to business presentations. Slidegeeks has creative team members who have crafted amazing templates. So, go and get them without any delay.
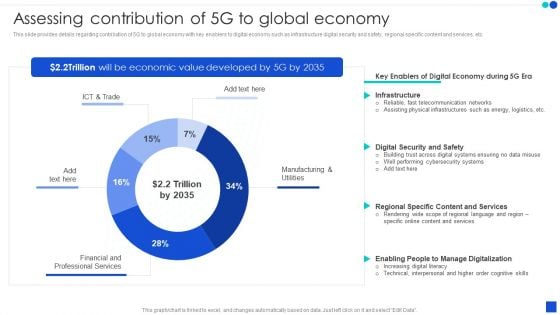
5G Technology Development For Digital Transformation Assessing Contribution Of 5G To Global Economy Graphics PDF
This slide provides details regarding contribution of 5G to global economy with key enablers to digital economy such as infrastructure digital security and safety, regional specific content and services, etc. Boost your pitch with our creative 5G Technology Development For Digital Transformation Assessing Contribution Of 5G To Global Economy Graphics PDF. Deliver an awe inspiring pitch that will mesmerize everyone. Using these presentation templates you will surely catch everyones attention. You can browse the ppts collection on our website. We have researchers who are experts at creating the right content for the templates. So you do not have to invest time in any additional work. Just grab the template now and use them.

5G Technology Development For Digital Transformation Determine Competitive Landscape Of 5G Clipart PDF
Create an editable 5G Technology Development For Digital Transformation Determine Competitive Landscape Of 5G Clipart PDF that communicates your idea and engages your audience. Whether you are presenting a business or an educational presentation, pre designed presentation templates help save time. 5G Technology Development For Digital Transformation Determine Competitive Landscape Of 5G Clipart PDF is highly customizable and very easy to edit, covering many different styles from creative to business presentations. Slidegeeks has creative team members who have crafted amazing templates. So, go and get them without any delay.
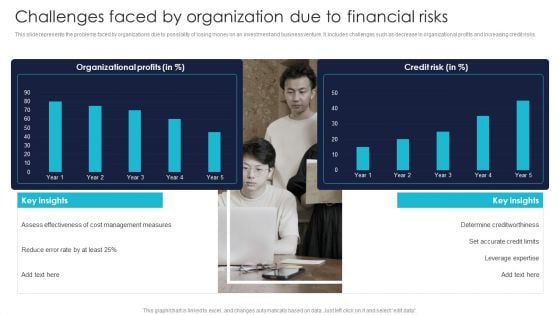
Challenges Faced By Organization Due To Financial Risks Pictures PDF
This slide represents the problems faced by organizations due to possibility of losing money on an investment and business venture. It includes challenges such as decrease in organizational profits and increasing credit risks. Boost your pitch with our creative Challenges Faced By Organization Due To Financial Risks Pictures PDF. Deliver an awe inspiring pitch that will mesmerize everyone. Using these presentation templates you will surely catch everyones attention. You can browse the ppts collection on our website. We have researchers who are experts at creating the right content for the templates. So you do not have to invest time in any additional work. Just grab the template now and use them.
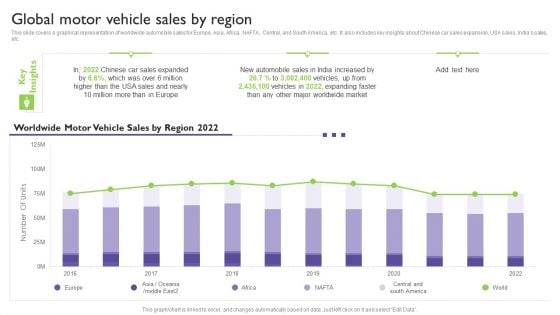
Global Automotive Industry Analysis Global Motor Vehicle Sales By Region Clipart PDF
This slide covers a graphical representation of worldwide automobile sales for Europe, Asia, Africa, NAFTA, Central, and South America, etc. It also includes key insights about Chinese car sales expansion, USA sales, Indias sales, etc. The best PPT templates are a great way to save time, energy, and resources. Slidegeeks have 100 percent editable powerpoint slides making them incredibly versatile. With these quality presentation templates, you can create a captivating and memorable presentation by combining visually appealing slides and effectively communicating your message. Download Global Automotive Industry Analysis Global Motor Vehicle Sales By Region Clipart PDF from Slidegeeks and deliver a wonderful presentation.
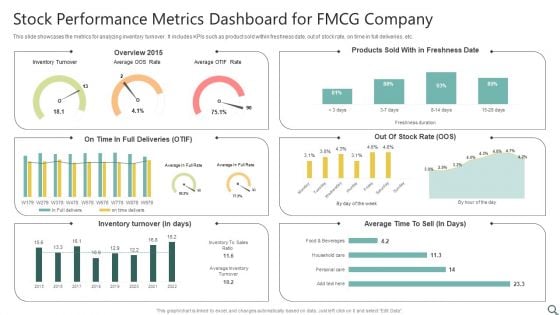
Stock Performance Metrics Dashboard For FMCG Company Ppt Ideas Design Inspiration PDF
This slide showcases the metrics for analyzing inventory turnover. It includes KPIs such as product sold within freshness date, out of stock rate, on time in full deliveries, etc. Showcasing this set of slides titled Stock Performance Metrics Dashboard For FMCG Company Ppt Ideas Design Inspiration PDF. The topics addressed in these templates are Inventory Turnover, Overview 2015, Inventory Turnover. All the content presented in this PPT design is completely editable. Download it and make adjustments in color, background, font etc. as per your unique business setting.


 Continue with Email

 Home
Home


