Clock Diagram
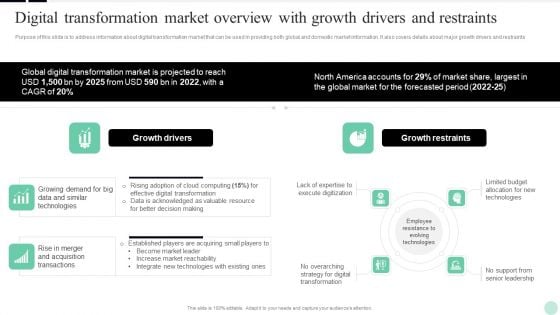
Implementing Digital Transformation Digital Transformation Market Overview With Growth Diagrams PDF
Purpose of this slide is to address information about digital transformation market that can be used in providing both global and domestic market information. It also covers details about major growth drivers and restraints. Coming up with a presentation necessitates that the majority of the effort goes into the content and the message you intend to convey. The visuals of a PowerPoint presentation can only be effective if it supplements and supports the story that is being told. Keeping this in mind our experts created Implementing Digital Transformation Digital Transformation Market Overview With Growth Diagrams PDF to reduce the time that goes into designing the presentation. This way, you can concentrate on the message while our designers take care of providing you with the right template for the situation.
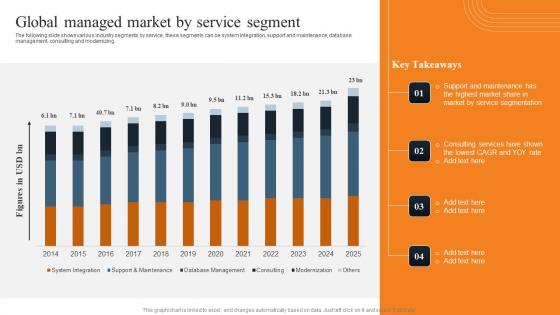
Global Managed Market By Service Layered Pricing Strategy For Managed Services Diagrams Pdf
The following slide shows various industry segments by service, these segments can be system integration, support and maintenance, database management, consulting and modernizing. Retrieve professionally designed Global Managed Market By Service Layered Pricing Strategy For Managed Services Diagrams Pdf to effectively convey your message and captivate your listeners. Save time by selecting pre made slideshows that are appropriate for various topics, from business to educational purposes. These themes come in many different styles, from creative to corporate, and all of them are easily adjustable and can be edited quickly. Access them as PowerPoint templates or as Google Slides themes. You do not have to go on a hunt for the perfect presentation because Slidegeeks got you covered from everywhere. The following slide shows various industry segments by service, these segments can be system integration, support and maintenance, database management, consulting and modernizing.
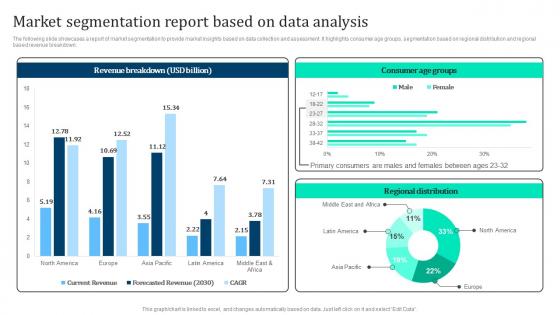
Market Segmentation Report Based Marketing Intelligence Guide Data Gathering Diagrams Pdf
The following slide showcases a report of market segmentation to provide market insights based on data collection and assessment. It highlights consumer age groups, segmentation based on regional distribution and regional based revenue breakdown. Retrieve professionally designed Market Segmentation Report Based Marketing Intelligence Guide Data Gathering Diagrams Pdf to effectively convey your message and captivate your listeners. Save time by selecting pre made slideshows that are appropriate for various topics, from business to educational purposes. These themes come in many different styles, from creative to corporate, and all of them are easily adjustable and can be edited quickly. Access them as PowerPoint templates or as Google Slides themes. You do not have to go on a hunt for the perfect presentation because Slidegeeks got you covered from everywhere. The following slide showcases a report of market segmentation to provide market insights based on data collection and assessment. It highlights consumer age groups, segmentation based on regional distribution and regional based revenue breakdown.
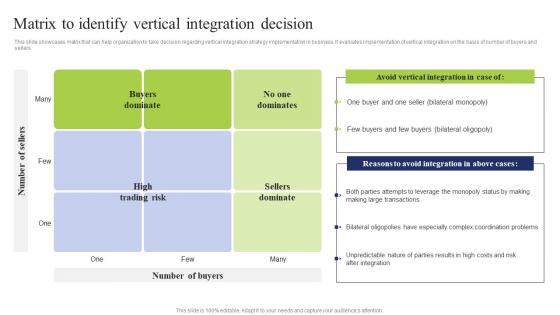
Matrix Identify Vertical Business Integration Tactics To Eliminate Competitors Diagrams Pdf
This slide showcases matrix that can help organization to take decision regarding vertical integration strategy implementation in business. It evaluates implementation of vertical integration on the basis of number of buyers and sellers Do you know about Slidesgeeks Matrix Identify Vertical Business Integration Tactics To Eliminate Competitors Diagrams Pdf These are perfect for delivering any kind od presentation. Using it, create PowerPoint presentations that communicate your ideas and engage audiences. Save time and effort by using our pre designed presentation templates that are perfect for a wide range of topic. Our vast selection of designs covers a range of styles, from creative to business, and are all highly customizable and easy to edit. Download as a PowerPoint template or use them as Google Slides themes. This slide showcases matrix that can help organization to take decision regarding vertical integration strategy implementation in business. It evaluates implementation of vertical integration on the basis of number of buyers and sellers

Brand Awareness Plan Ineffective Product Marketing Impact On Customer Retention Diagrams PDF
This slide shows graphical presentation of impact of ineffective marketing on customer retention rate. Additionally, it provides the impact and reason behind the decline in retention rate. Retrieve professionally designed Brand Awareness Plan Ineffective Product Marketing Impact On Customer Retention Diagrams PDF to effectively convey your message and captivate your listeners. Save time by selecting pre-made slideshows that are appropriate for various topics, from business to educational purposes. These themes come in many different styles, from creative to corporate, and all of them are easily adjustable and can be edited quickly. Access them as PowerPoint templates or as Google Slides themes. You dont have to go on a hunt for the perfect presentation because Slidegeeks got you covered from everywhere.
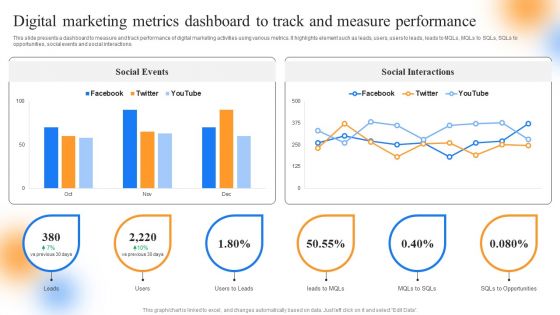
Strategic Guide To Perform Marketing Digital Marketing Metrics Dashboard To Track Diagrams PDF
This slide presents a dashboard to measure and track performance of digital marketing activities using various metrics. It highlights element such as leads, users, users to leads, leads to MQLs, MQLs to SQLs, SQLs to opportunities, social events and social interactions. Retrieve professionally designed Strategic Guide To Perform Marketing Digital Marketing Metrics Dashboard To Track Diagrams PDF to effectively convey your message and captivate your listeners. Save time by selecting pre-made slideshows that are appropriate for various topics, from business to educational purposes. These themes come in many different styles, from creative to corporate, and all of them are easily adjustable and can be edited quickly. Access them as PowerPoint templates or as Google Slides themes. You dont have to go on a hunt for the perfect presentation because Slidegeeks got you covered from everywhere.
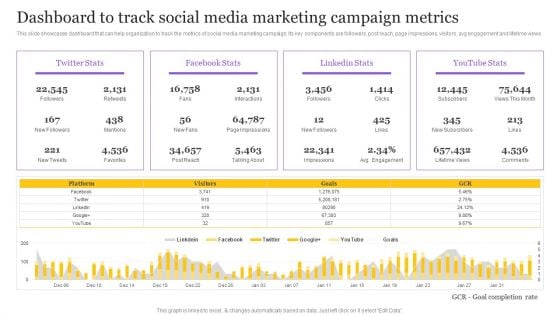
Digital Marketing Strategy Dashboard To Track Social Media Marketing Campaign Metrics Diagrams PDF
This slide showcases dashboard that can help organization to track the metrics of social media marketing campaign. Its key components are followers, post reach, page impressions, visitors, avg engagement and lifetime views. Retrieve professionally designed Digital Marketing Strategy Dashboard To Track Social Media Marketing Campaign Metrics Diagrams PDF to effectively convey your message and captivate your listeners. Save time by selecting pre-made slideshows that are appropriate for various topics, from business to educational purposes. These themes come in many different styles, from creative to corporate, and all of them are easily adjustable and can be edited quickly. Access them as PowerPoint templates or as Google Slides themes. You dont have to go on a hunt for the perfect presentation because Slidegeeks got you covered from everywhere.
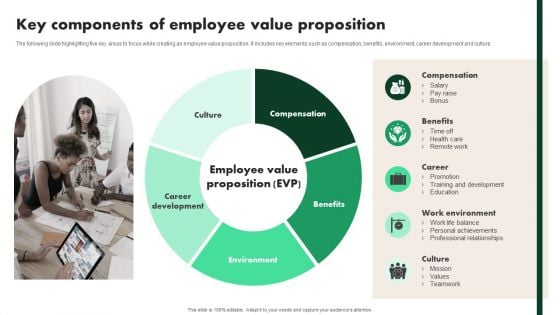
Creating Employee Value Proposition Key Components Of Employee Value Proposition Diagrams PDF
The following slide highlighting five key areas to focus while creating an employee value proposition. It includes key elements such as compensation, benefits, environment, career development and culture. Retrieve professionally designed Creating Employee Value Proposition Key Components Of Employee Value Proposition Diagrams PDF to effectively convey your message and captivate your listeners. Save time by selecting pre-made slideshows that are appropriate for various topics, from business to educational purposes. These themes come in many different styles, from creative to corporate, and all of them are easily adjustable and can be edited quickly. Access them as PowerPoint templates or as Google Slides themes. You dont have to go on a hunt for the perfect presentation because Slidegeeks got you covered from everywhere.
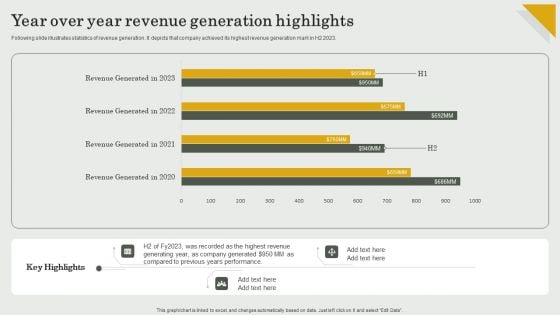
Submission Of Project Viability Report For Bank Loan Year Over Year Revenue Generation Highlights Diagrams PDF
Following slide illustrates statistics of revenue generation. It depicts that company achieved its highest revenue generation mark in H2 2023. Retrieve professionally designed Submission Of Project Viability Report For Bank Loan Year Over Year Revenue Generation Highlights Diagrams PDF to effectively convey your message and captivate your listeners. Save time by selecting pre-made slideshows that are appropriate for various topics, from business to educational purposes. These themes come in many different styles, from creative to corporate, and all of them are easily adjustable and can be edited quickly. Access them as PowerPoint templates or as Google Slides themes. You do not have to go on a hunt for the perfect presentation because Slidegeeks got you covered from everywhere.
Adjusting Financial Strategies And Planning Tracking The Cashflow Improvements With Cash Management Diagrams PDF
This slide showcases the KPIs that would help our business organization to track the improvements in the new cash management process. It includes quick ratio, cash balance, current ratio, days inventory outstanding, etc. Retrieve professionally designed Adjusting Financial Strategies And Planning Tracking The Cashflow Improvements With Cash Management Diagrams PDF to effectively convey your message and captivate your listeners. Save time by selecting pre made slideshows that are appropriate for various topics, from business to educational purposes. These themes come in many different styles, from creative to corporate, and all of them are easily adjustable and can be edited quickly. Access them as PowerPoint templates or as Google Slides themes. You do not have to go on a hunt for the perfect presentation because Slidegeeks got you covered from everywhere.
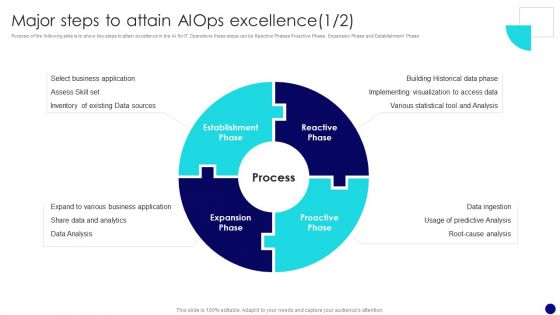
Information Technology Operations Administration With ML Major Steps To Attain Diagrams PDF
Purpose of the following slide is to show key steps to attain excellence in the AI for IT Operations these steps can be Reactive Phases Proactive Phase, Expansion Phase and Establishment Phase. Present like a pro with Information Technology Operations Administration With ML Major Steps To Attain Diagrams PDF Create beautiful presentations together with your team, using our easy to use presentation slides. Share your ideas in real time and make changes on the fly by downloading our templates. So whether you are in the office, on the go, or in a remote location, you can stay in sync with your team and present your ideas with confidence. With Slidegeeks presentation got a whole lot easier. Grab these presentations today.
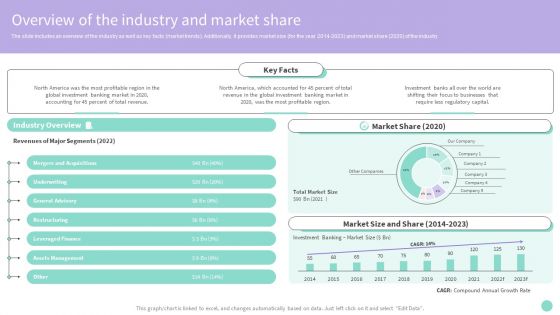
Buy Side Merger And Acquisition Advisory Overview Of The Industry And Market Share Diagrams PDF
The slide includes an overview of the industry as well as key facts market trends. Additionally, it provides market size for the year 2014 to 2023 and market share 2020 of the industry. Do you know about Slidesgeeks de Merger And Acquisition Advisory Overview Of The Industry And Market Share Diagrams PDF These are perfect for delivering any kind od presentation. Using it, create PowerPoint presentations that communicate your ideas and engage audiences. Save time and effort by using our pre designed presentation templates that are perfect for a wide range of topic. Our vast selection of designs covers a range of styles, from creative to business, and are all highly customizable and easy to edit. Download as a PowerPoint template or use them as Google Slides themes.
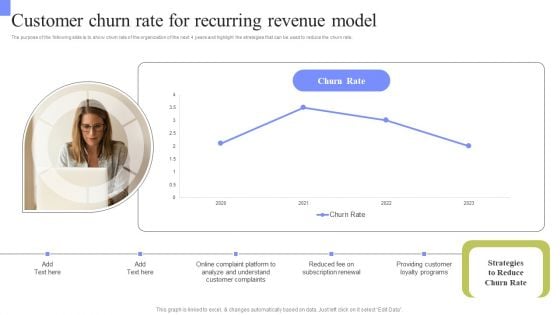
Periodic Revenue Model Customer Churn Rate For Recurring Revenue Model Diagrams PDF
The purpose of the following slide is to show churn rate of the organization of the next 4 years and highlight the strategies that can be used to reduce the churn rate. Do you know about Slidesgeeks Periodic Revenue Model Customer Churn Rate For Recurring Revenue Model Diagrams PDF. These are perfect for delivering any kind od presentation. Using it, create PowerPoint presentations that communicate your ideas and engage audiences. Save time and effort by using our pre designed presentation templates that are perfect for a wide range of topic. Our vast selection of designs covers a range of styles, from creative to business, and are all highly customizable and easy to edit. Download as a PowerPoint template or use them as Google Slides themes.
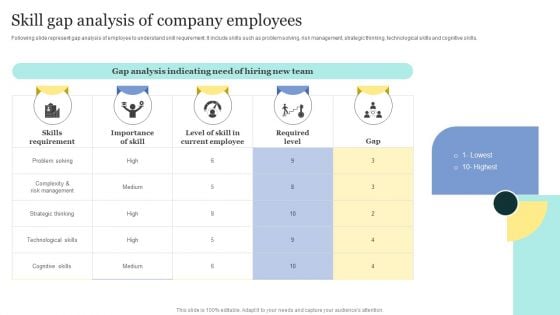
Strategic Approaches To Efficient Candidate Selection Skill Gap Analysis Of Company Employees Diagrams PDF
Following slide represent gap analysis of employee to understand skill requirement. It include skills such as problem solving, risk management, strategic thinking, technological skills and cognitive skills. Do you know about Slidesgeeks Strategic Approaches To Efficient Candidate Selection Skill Gap Analysis Of Company Employees Diagrams PDF These are perfect for delivering any kind od presentation. Using it, create PowerPoint presentations that communicate your ideas and engage audiences. Save time and effort by using our pre-designed presentation templates that are perfect for a wide range of topic. Our vast selection of designs covers a range of styles, from creative to business, and are all highly customizable and easy to edit. Download as a PowerPoint template or use them as Google Slides themes.
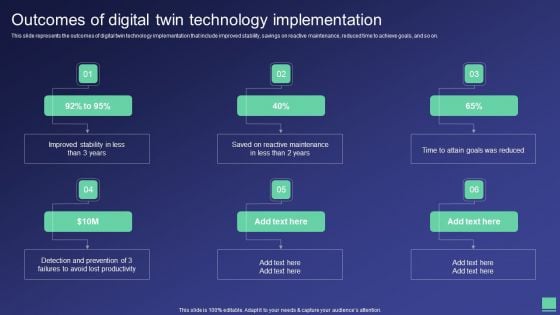
Digital Twin Tech IT Outcomes Of Digital Twin Technology Implementation Diagrams PDF
This slide represents the outcomes of digital twin technology implementation that include improved stability, savings on reactive maintenance, reduced time to achieve goals, and so on. Retrieve professionally designed Digital Twin Tech IT Outcomes Of Digital Twin Technology Implementation Diagrams PDF to effectively convey your message and captivate your listeners. Save time by selecting pre-made slideshows that are appropriate for various topics, from business to educational purposes. These themes come in many different styles, from creative to corporate, and all of them are easily adjustable and can be edited quickly. Access them as PowerPoint templates or as Google Slides themes. You dont have to go on a hunt for the perfect presentation because Slidegeeks got you covered from everywhere.
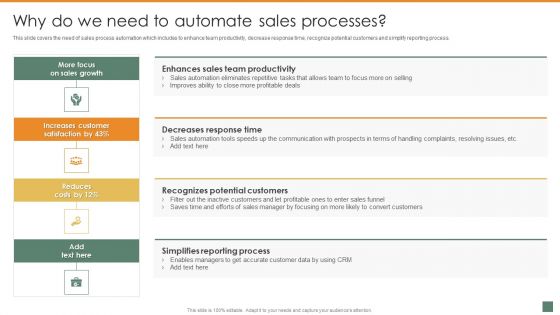
Why Do We Need To Automate Sales Processes Summary And Significance Of Sales Automation Diagrams PDF
This slide covers the need of sales process automation which includes to enhance team productivity, decrease response time, recognize potential customers and simplify reporting process. Retrieve professionally designed Why Do We Need To Automate Sales Processes Summary And Significance Of Sales Automation Diagrams PDF to effectively convey your message and captivate your listeners. Save time by selecting pre-made slideshows that are appropriate for various topics, from business to educational purposes. These themes come in many different styles, from creative to corporate, and all of them are easily adjustable and can be edited quickly. Access them as PowerPoint templates or as Google Slides themes. You do not have to go on a hunt for the perfect presentation because Slidegeeks got you covered from everywhere.
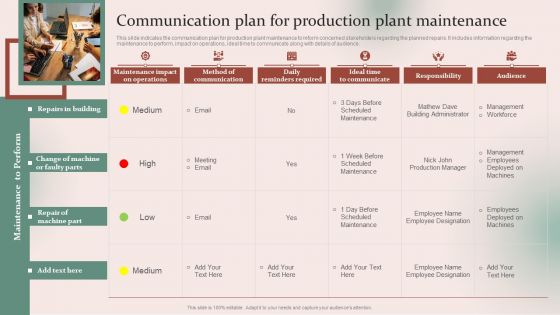
Strategies For Effective Manufacturing Communication Plan For Production Plant Diagrams PDF
This slide indicates the communication plan for production plant maintenance to inform concerned stakeholders regarding the planned repairs. It includes information regarding the maintenance to perform, impact on operations, ideal time to communicate along with details of audience. Retrieve professionally designed Strategies For Effective Manufacturing Communication Plan For Production Plant Diagrams PDF to effectively convey your message and captivate your listeners. Save time by selecting pre-made slideshows that are appropriate for various topics, from business to educational purposes. These themes come in many different styles, from creative to corporate, and all of them are easily adjustable and can be edited quickly. Access them as PowerPoint templates or as Google Slides themes. You dont have to go on a hunt for the perfect presentation because Slidegeeks got you covered from everywhere.

Smart Wireless Sensor Networks Spectrum Sensing Cognitive Radio Technique Diagrams PDF
This slide represents the overview of the spectrum sensing cognitive radio technique that is used to detect if a part of the spectrum is free for use or not. This technique includes powerful algorithms that analyze large amounts of data in real-time. Retrieve professionally designed Smart Wireless Sensor Networks Spectrum Sensing Cognitive Radio Technique Diagrams PDF to effectively convey your message and captivate your listeners. Save time by selecting pre-made slideshows that are appropriate for various topics, from business to educational purposes. These themes come in many different styles, from creative to corporate, and all of them are easily adjustable and can be edited quickly. Access them as PowerPoint templates or as Google Slides themes. You do not have to go on a hunt for the perfect presentation because Slidegeeks got you covered from everywhere.
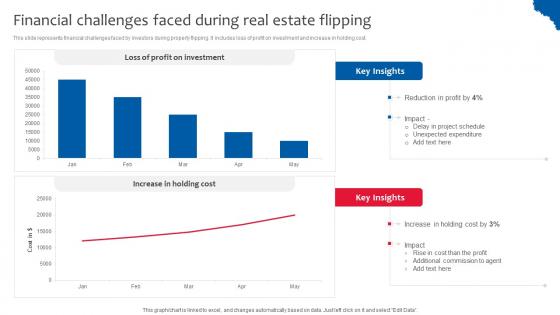
Financial Challenges Faced During Deploying Effective Property Flipping Strategies Diagrams Pdf
This slide represents financial challenges faced by investors during property flipping. It includes loss of profit on investment and increase in holding cost. Coming up with a presentation necessitates that the majority of the effort goes into the content and the message you intend to convey. The visuals of a PowerPoint presentation can only be effective if it supplements and supports the story that is being told. Keeping this in mind our experts created Financial Challenges Faced During Deploying Effective Property Flipping Strategies Diagrams Pdf to reduce the time that goes into designing the presentation. This way, you can concentrate on the message while our designers take care of providing you with the right template for the situation. This slide represents financial challenges faced by investors during property flipping. It includes loss of profit on investment and increase in holding cost.
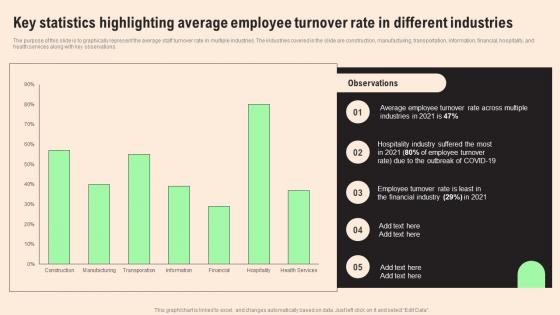
Key Statistics Highlighting Average Employee Turnover Rate In Different Industries Diagrams Pdf
The purpose of this slide is to graphically represent the average staff turnover rate in multiple industries. The industries covered in the slide are construction, manufacturing, transportation, information, financial, hospitality, and health services along with key observations. Boost your pitch with our creative Key Statistics Highlighting Average Employee Turnover Rate In Different Industries Diagrams Pdf. Deliver an awe inspiring pitch that will mesmerize everyone. Using these presentation templates you will surely catch everyones attention. You can browse the ppts collection on our website. We have researchers who are experts at creating the right content for the templates. So you do not have to invest time in any additional work. Just grab the template now and use them. The purpose of this slide is to graphically represent the average staff turnover rate in multiple industries. The industries covered in the slide are construction, manufacturing, transportation, information, financial, hospitality, and health services along with key observations.
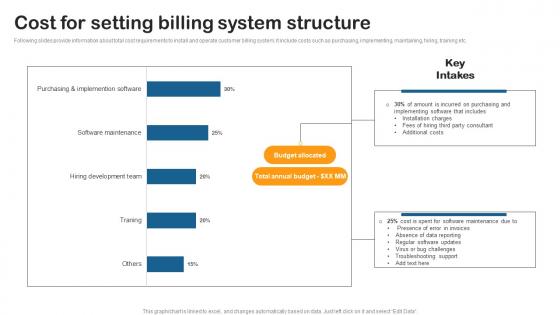
Cost For Setting Billing System Building Utility Billing And Invoicing Management System Diagrams Pdf
Following slides provide information about total cost requirements to install and operate customer billing system. It include costs such as purchasing, implementing, maintaining, hiring, training etc. Present like a pro with Cost For Setting Billing System Building Utility Billing And Invoicing Management System Diagrams Pdf Create beautiful presentations together with your team, using our easy to use presentation slides. Share your ideas in real time and make changes on the fly by downloading our templates. So whether you are in the office, on the go, or in a remote location, you can stay in sync with your team and present your ideas with confidence. With Slidegeeks presentation got a whole lot easier. Grab these presentations today. Following slides provide information about total cost requirements to install and operate customer billing system. It include costs such as purchasing, implementing, maintaining, hiring, training etc.
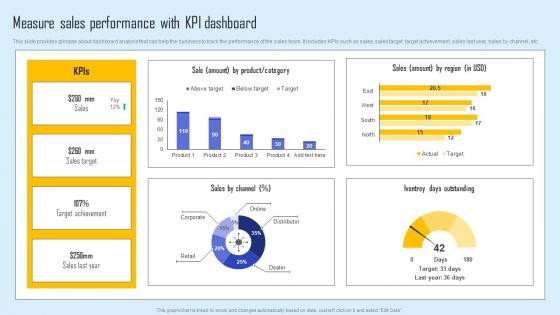
Measure Sales Performance Effective Sales Strategy To Enhance Customer Retention Diagrams Pdf
This slide provides glimpse about dashboard analysis that can help the business to track the performance of the sales team. It includes KPIs such as sales, sales target, target achievement, sales last year, sales by channel, etc. The best PPT templates are a great way to save time, energy, and resources. Slidegeeks have 100 percent editable powerpoint slides making them incredibly versatile. With these quality presentation templates, you can create a captivating and memorable presentation by combining visually appealing slides and effectively communicating your message. Download Measure Sales Performance Effective Sales Strategy To Enhance Customer Retention Diagrams Pdf from Slidegeeks and deliver a wonderful presentation. This slide provides glimpse about dashboard analysis that can help the business to track the performance of the sales team. It includes KPIs such as sales, sales target, target achievement, sales last year, sales by channel, etc.
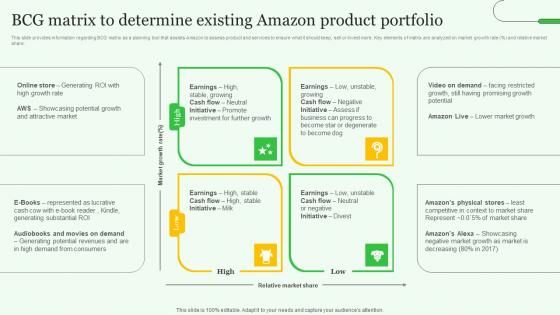
BCG Matrix Determine Existing Exploring Amazons Global Business Model Growth Diagrams Pdf
This slide provides information regarding BCG matrix as a planning tool that assists Amazon to assess product and services to ensure what it should keep, sell or invest more. Key elements of matrix are analyzed on market growth rate precent and relative market share. There are so many reasons you need a BCG Matrix Determine Existing Exploring Amazons Global Business Model Growth Diagrams Pdf. The first reason is you can not spend time making everything from scratch, Thus, Slidegeeks has made presentation templates for you too. You can easily download these templates from our website easily. This slide provides information regarding BCG matrix as a planning tool that assists Amazon to assess product and services to ensure what it should keep, sell or invest more. Key elements of matrix are analyzed on market growth rate precent and relative market share.
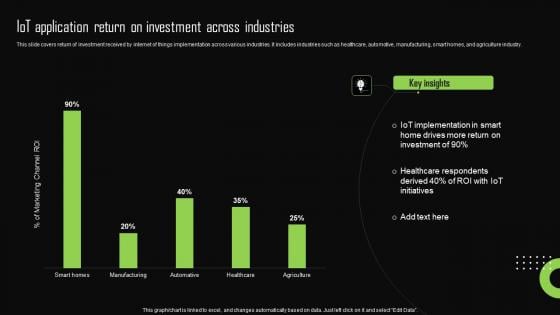
Iot Application Return On Investment Across Iot Device Management Diagrams Pdf
This slide covers return of investment received by internet of things implementation across various industries. It includes industries such as healthcare, automotive, manufacturing, smart homes, and agriculture industry. The best PPT templates are a great way to save time, energy, and resources. Slidegeeks have 100 percent editable powerpoint slides making them incredibly versatile. With these quality presentation templates, you can create a captivating and memorable presentation by combining visually appealing slides and effectively communicating your message. Download Iot Application Return On Investment Across Iot Device Management Diagrams Pdf from Slidegeeks and deliver a wonderful presentation. This slide covers return of investment received by internet of things implementation across various industries. It includes industries such as healthcare, automotive, manufacturing, smart homes, and agriculture industry.
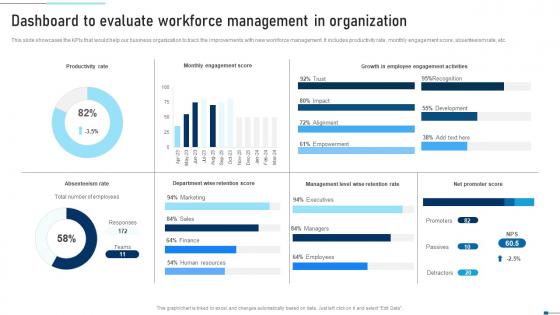
Dashboard To Evaluate Workforce Management In Strategic Talent Recruitment Diagrams Pdf
This slide showcases the KPIs that would help our business organization to track the improvements with new workforce management. It includes productivity rate, monthly engagement score, absenteeism rate, etc. Find highly impressive Dashboard To Evaluate Workforce Management In Strategic Talent Recruitment Diagrams Pdf on Slidegeeks to deliver a meaningful presentation. You can save an ample amount of time using these presentation templates. No need to worry to prepare everything from scratch because Slidegeeks experts have already done a huge research and work for you. You need to download for your upcoming presentation. All the presentation templates are 100 percent editable and you can change the color and personalize the content accordingly. Download now This slide showcases the KPIs that would help our business organization to track the improvements with new workforce management. It includes productivity rate, monthly engagement score, absenteeism rate, etc.
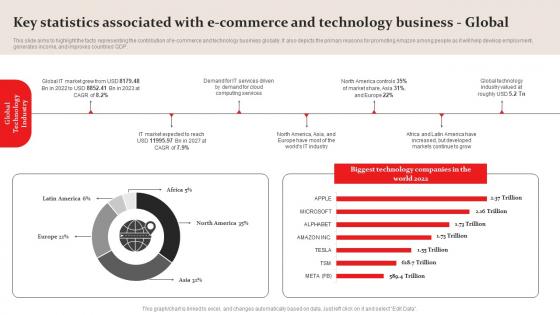
Amazon Business Plan Go To Market Strategy Key Statistics Associated With E Commerce Diagrams Pdf
This slide aims to highlight the facts representing the contribution of e commerce and technology business globally. It also depicts the primary reasons for promoting Amazon among people as it will help develop employment, generates income, and improves countries GDP. There are so many reasons you need a Amazon Business Plan Go To Market Strategy Key Statistics Associated With E Commerce Diagrams Pdf. The first reason is you can not spend time making everything from scratch, Thus, Slidegeeks has made presentation templates for you too. You can easily download these templates from our website easily. This slide aims to highlight the facts representing the contribution of e commerce and technology business globally. It also depicts the primary reasons for promoting Amazon among people as it will help develop employment, generates income, and improves countries GDP.
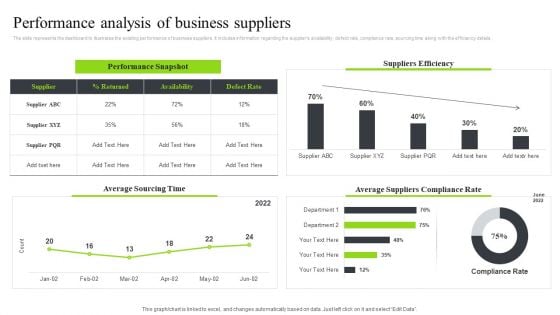
Strategic Sourcing And Supplier Quality Performance Analysis Of Business Suppliers Diagrams PDF
The slide represents the dashboard to illustrates the existing performance of business suppliers. It includes information regarding the suppliers availability, defect rate, compliance rate, sourcing time along with the efficiency details.Welcome to our selection of the Strategic Sourcing And Supplier Quality Performance Analysis Of Business Suppliers Diagrams PDF. These are designed to help you showcase your creativity and bring your sphere to life. Planning and Innovation are essential for any business that is just starting out. This collection contains the designs that you need for your everyday presentations. All of our PowerPoints are 100precent editable, so you can customize them to suit your needs. This multi-purpose template can be used in various situations. Grab these presentation templates today.
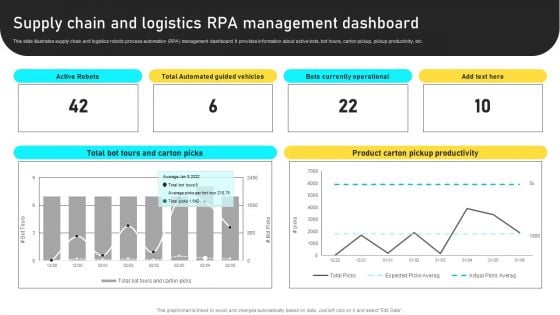
Manufacturing Process Automation For Enhancing Productivity Supply Chain And Logistics RPA Management Dashboard Diagrams PDF
This slide illustrates supply chain and logistics robotic process automation RPA management dashboard. It provides information about active bots, bot hours, carton pickup, pickup productivity, etc. Present like a pro with Manufacturing Process Automation For Enhancing Productivity Supply Chain And Logistics RPA Management Dashboard Diagrams PDF Create beautiful presentations together with your team, using our easy to use presentation slides. Share your ideas in real time and make changes on the fly by downloading our templates. So whether you are in the office, on the go, or in a remote location, you can stay in sync with your team and present your ideas with confidence. With Slidegeeks presentation got a whole lot easier. Grab these presentations today.
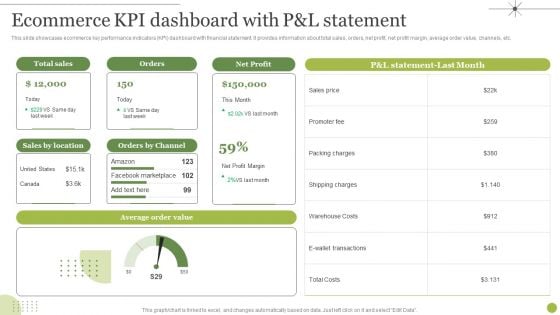
Managing E Commerce Business Accounting Ecommerce KPI Dashboard With P And L Statement Diagrams PDF
This slide showcases ecommerce key performance indicators KPI dashboard with financial statement. It provides information about total sales, orders, net profit, net profit margin, average order value, channels, etc. Present like a pro with Managing E Commerce Business Accounting Ecommerce KPI Dashboard With P And L Statement Diagrams PDF Create beautiful presentations together with your team, using our easy to use presentation slides. Share your ideas in real time and make changes on the fly by downloading our templates. So whether you are in the office, on the go, or in a remote location, you can stay in sync with your team and present your ideas with confidence. With Slidegeeks presentation got a whole lot easier. Grab these presentations today.
Dashboard For Tracking Customer Service Team Performance Consumer Contact Point Guide Diagrams PDF
This slide covers the KPI dashboard for analyzing the performance of client support department. It includes metrics such as first call resolution, unresolved calls, average response rate, the best day to call, average time to solve issues, etc. The Dashboard For Tracking Customer Service Team Performance Consumer Contact Point Guide Diagrams PDF is a compilation of the most recent design trends as a series of slides. It is suitable for any subject or industry presentation, containing attractive visuals and photo spots for businesses to clearly express their messages. This template contains a variety of slides for the user to input data, such as structures to contrast two elements, bullet points, and slides for written information. Slidegeeks is prepared to create an impression.
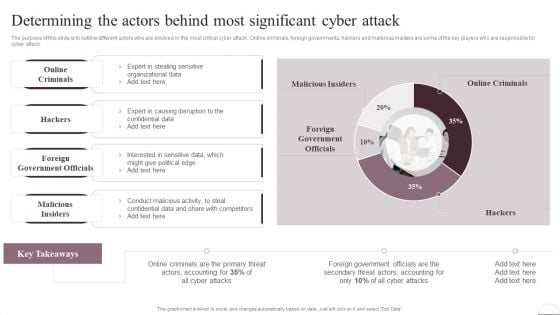
Prevention Of Information Determining The Actors Behind Most Significant Cyber Attack Diagrams PDF
The purpose of this slide is to outline different actors who are involved in the most critical cyber attack. Online criminals, foreign governments, hackers and malicious insiders are some of the key players who are responsible for cyber attack. Present like a pro with Prevention Of Information Determining The Actors Behind Most Significant Cyber Attack Diagrams PDF Create beautiful presentations together with your team, using our easy-to-use presentation slides. Share your ideas in real-time and make changes on the fly by downloading our templates. So whether youre in the office, on the go, or in a remote location, you can stay in sync with your team and present your ideas with confidence. With Slidegeeks presentation got a whole lot easier. Grab these presentations today.
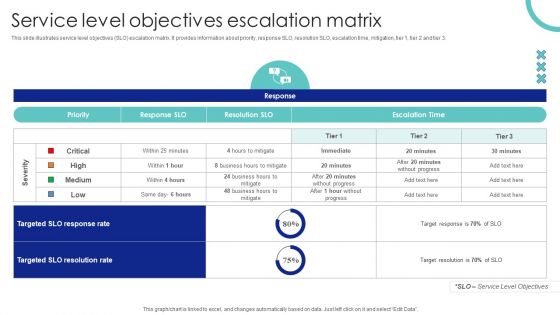
Service Level Objectives Escalation Matrix Ppt PowerPoint Presentation File Diagrams PDF
This slide illustrates service level objectives SLO escalation matrix. It provides information about priority, response SLO, resolution SLO, escalation time, mitigation, tier 1, tier 2 and tier 3. Slidegeeks is here to make your presentations a breeze with Service Level Objectives Escalation Matrix Ppt PowerPoint Presentation File Diagrams PDF With our easy to use and customizable templates, you can focus on delivering your ideas rather than worrying about formatting. With a variety of designs to choose from, you are sure to find one that suits your needs. And with animations and unique photos, illustrations, and fonts, you can make your presentation pop. So whether you are giving a sales pitch or presenting to the board, make sure to check out Slidegeeks first.

Strategic Plan For Enterprise Key Performance Indicators Highlighting Current Problems Diagrams PDF
This slide represents the key performance indicators to track the problems faced by organization and draw effective strategies to tackle the problems. It includes key performance indicators of decline in organizational sales and customer engagement rate. Coming up with a presentation necessitates that the majority of the effort goes into the content and the message you intend to convey. The visuals of a PowerPoint presentation can only be effective if it supplements and supports the story that is being told. Keeping this in mind our experts created Strategic Plan For Enterprise Key Performance Indicators Highlighting Current Problems Diagrams PDF to reduce the time that goes into designing the presentation. This way, you can concentrate on the message while our designers take care of providing you with the right template for the situation.
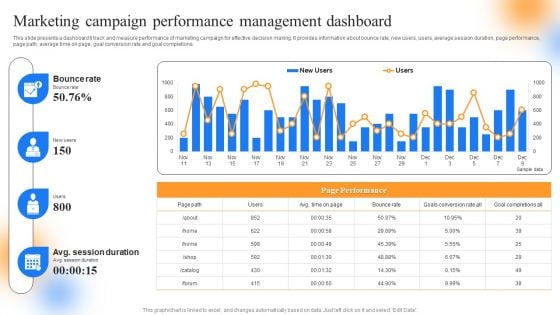
Strategic Guide To Perform Marketing Marketing Campaign Performance Management Dashboard Diagrams PDF
This slide presents a dashboard ti track and measure performance of marketing campaign for effective decision making. It provides information about bounce rate, new users, users, average session duration, page performance, page path, average time on page, goal conversion rate and goal completions. Slidegeeks is here to make your presentations a breeze with Strategic Guide To Perform Marketing Marketing Campaign Performance Management Dashboard Diagrams PDF With our easy to use and customizable templates, you can focus on delivering your ideas rather than worrying about formatting. With a variety of designs to choose from, youre sure to find one that suits your needs. And with animations and unique photos, illustrations, and fonts, you can make your presentation pop. So whether youre giving a sales pitch or presenting to the board, make sure to check out Slidegeeks first.
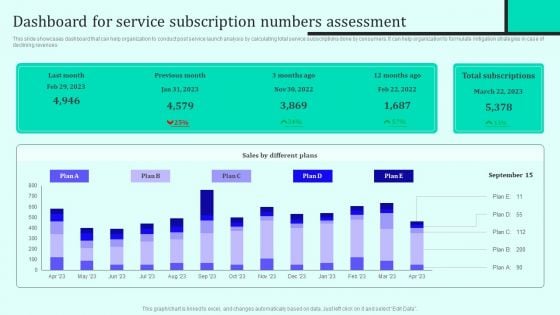
Implementing New Sales And Marketing Process For Services Dashboard For Service Subscription Diagrams PDF
This slide showcases dashboard that can help organization to conduct post service launch analysis by calculating total service subscriptions done by consumers. It can help organization to formulate mitigation strategies in case of declining revenues. Boost your pitch with our creative Implementing New Sales And Marketing Process For Services Dashboard For Service Subscription Diagrams PDF. Deliver an awe inspiring pitch that will mesmerize everyone. Using these presentation templates you will surely catch everyones attention. You can browse the ppts collection on our website. We have researchers who are experts at creating the right content for the templates. So you do not have to invest time in any additional work. Just grab the template now and use them.

Assessing Impact Of Sales Risk Management With Kpi Dashboard Diagrams PDF
The following slide highlights some key performance indicators KPIs to measure the influence of executing sales risk management strategies on revenue performance. It includes elements such as target attainment rate, gross profit, annual growth rate etc. Boost your pitch with our creative Assessing Impact Of Sales Risk Management With Kpi Dashboard Diagrams PDF. Deliver an awe inspiring pitch that will mesmerize everyone. Using these presentation templates you will surely catch everyones attention. You can browse the ppts collection on our website. We have researchers who are experts at creating the right content for the templates. So you do not have to invest time in any additional work. Just grab the template now and use them.
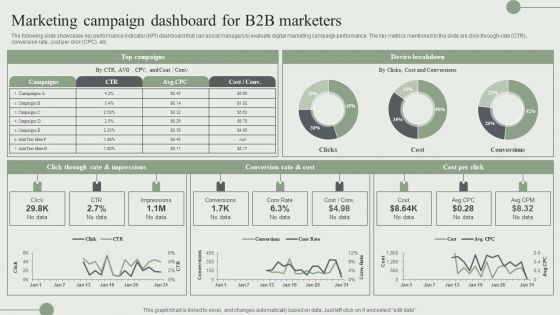
Marketing Campaign Dashboard For B2B Marketers Ppt PowerPoint Presentation File Diagrams PDF
The following slide showcases key performance indicator KPI dashboard that can assist managers to evaluate digital marketing campaign performance. The key metrics mentioned in the slide are click-through-rate CTR, conversion rate, cost per click CPC, etc. Present like a pro with Marketing Campaign Dashboard For B2B Marketers Ppt PowerPoint Presentation File Diagrams PDF Create beautiful presentations together with your team, using our easy to use presentation slides. Share your ideas in real time and make changes on the fly by downloading our templates. So whether you are in the office, on the go, or in a remote location, you can stay in sync with your team and present your ideas with confidence. With Slidegeeks presentation got a whole lot easier. Grab these presentations today.

Regenerative Artificial Intelligence Systems Impact Of Chatgpt On Artificial Intelligence Tokens Diagrams PDF
This slide depicts the change in the prices of five artificial intelligence tokens after the launch of OpenAIs ChatGPT model. These artificial intelligence tokens are DeepBrain Chain, Numeraire, Fetch.ai, SingularityNET, and Alethea Artificial Liquid Intelligence. Coming up with a presentation necessitates that the majority of the effort goes into the content and the message you intend to convey. The visuals of a PowerPoint presentation can only be effective if it supplements and supports the story that is being told. Keeping this in mind our experts created Regenerative Artificial Intelligence Systems Impact Of Chatgpt On Artificial Intelligence Tokens Diagrams PDF to reduce the time that goes into designing the presentation. This way, you can concentrate on the message while our designers take care of providing you with the right template for the situation.
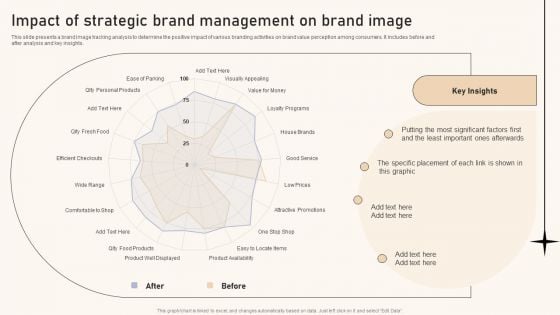
Optimizing Brand Equity Through Strategic Management Impact Of Strategic Brand Management On Brand Image Diagrams PDF
This slide presents a brand image tracking analysis to determine the positive impact of various branding activities on brand value perception among consumers. It includes before and after analysis and key insights. Coming up with a presentation necessitates that the majority of the effort goes into the content and the message you intend to convey. The visuals of a PowerPoint presentation can only be effective if it supplements and supports the story that is being told. Keeping this in mind our experts created Optimizing Brand Equity Through Strategic Management Impact Of Strategic Brand Management On Brand Image Diagrams PDF to reduce the time that goes into designing the presentation. This way, you can concentrate on the message while our designers take care of providing you with the right template for the situation.
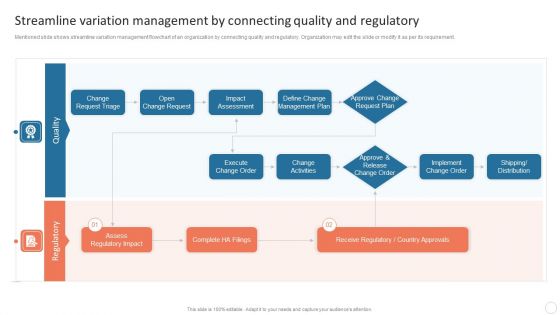
Quality Control Plan Streamline Variation Management By Connecting Quality Diagrams PDF
Mentioned slide shows streamline variation management flowchart of an organization by connecting quality and regulatory. Organization may edit the slide or modify it as per its requirement. Retrieve professionally designed Quality Control Plan Streamline Variation Management By Connecting Quality Diagrams PDF to effectively convey your message and captivate your listeners. Save time by selecting pre-made slideshows that are appropriate for various topics, from business to educational purposes. These themes come in many different styles, from creative to corporate, and all of them are easily adjustable and can be edited quickly. Access them as PowerPoint templates or as Google Slides themes. You dont have to go on a hunt for the perfect presentation because Slidegeeks got you covered from everywhere.
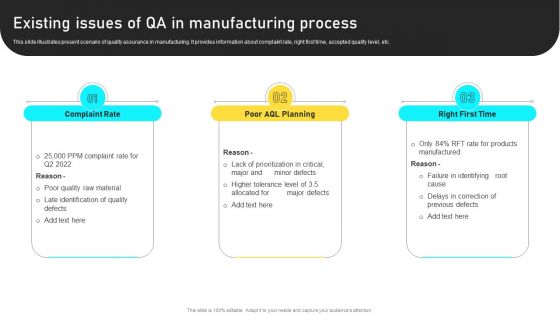
Manufacturing Process Automation For Enhancing Productivity Existing Issues Of Qa In Manufacturing Process Diagrams PDF
This slide illustrates present scenario of quality assurance in manufacturing. It provides information about complaint rate, right first time, accepted quality level, etc. Present like a pro with Manufacturing Process Automation For Enhancing Productivity Existing Issues Of Qa In Manufacturing Process Diagrams PDF Create beautiful presentations together with your team, using our easy to use presentation slides. Share your ideas in real time and make changes on the fly by downloading our templates. So whether you are in the office, on the go, or in a remote location, you can stay in sync with your team and present your ideas with confidence. With Slidegeeks presentation got a whole lot easier. Grab these presentations today.
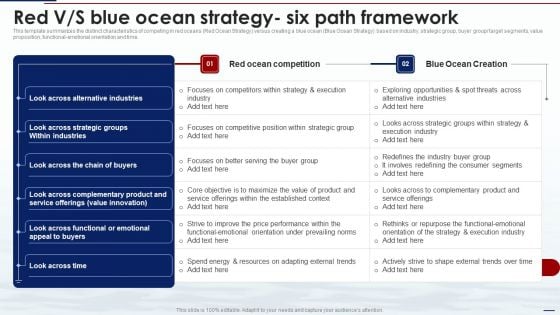
Blue Ocean Tactics Red V S Blue Ocean Strategy Six Path Framework Diagrams PDF
This template summarizes the distinct characteristics of competing in red oceans Red Ocean Strategy versus creating a blue ocean Blue Ocean Strategy based on industry, strategic group, buyer group or target segments, value proposition, functional-emotional orientation and time. Coming up with a presentation necessitates that the majority of the effort goes into the content and the message you intend to convey. The visuals of a PowerPoint presentation can only be effective if it supplements and supports the story that is being told. Keeping this in mind our experts created Blue Ocean Tactics Red VS Blue Ocean Strategy Six Path Framework Diagrams PDF to reduce the time that goes into designing the presentation. This way, you can concentrate on the message while our designers take care of providing you with the right template for the situation.
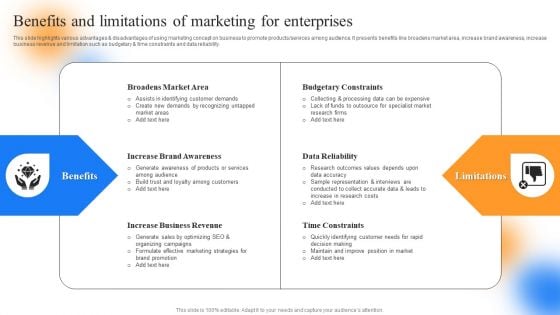
Strategic Guide To Perform Marketing Benefits And Limitations Of Marketing For Enterprises Diagrams PDF
This slide highlights various advantages and disadvantages of using marketing concept on business to promote products or services among audience. It presents benefits like broadens market area, increase brand awareness, increase business revenue and limitation such as budgetary and time constraints and data reliability. Coming up with a presentation necessitates that the majority of the effort goes into the content and the message you intend to convey. The visuals of a PowerPoint presentation can only be effective if it supplements and supports the story that is being told. Keeping this in mind our experts created Strategic Guide To Perform Marketing Benefits And Limitations Of Marketing For Enterprises Diagrams PDF to reduce the time that goes into designing the presentation. This way, you can concentrate on the message while our designers take care of providing you with the right template for the situation.
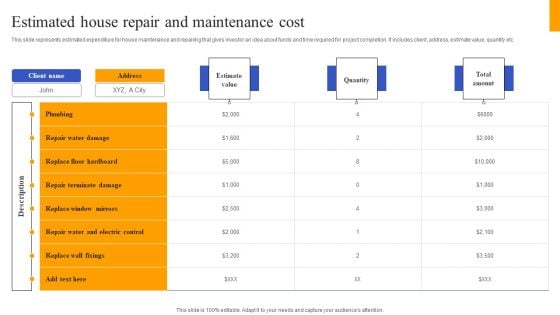
Fix And Flip Method For Renovating Real Estate Estimated House Repair And Maintenance Cost Diagrams PDF
This slide represents estimated expenditure for house maintenance and repairing that gives investor an idea about funds and time required for project completion. It includes client, address, estimate value, quantity etc. Present like a pro with Fix And Flip Method For Renovating Real Estate Estimated House Repair And Maintenance Cost Diagrams PDF Create beautiful presentations together with your team, using our easy to use presentation slides. Share your ideas in real time and make changes on the fly by downloading our templates. So whether you are in the office, on the go, or in a remote location, you can stay in sync with your team and present your ideas with confidence. With Slidegeeks presentation got a whole lot easier. Grab these presentations today.
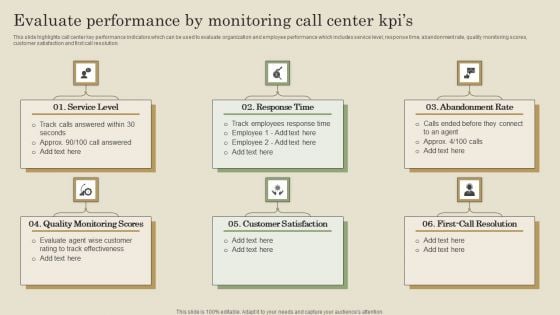
Evaluate Performance By Monitoring Call Center Kpis Ppt PowerPoint Presentation File Diagrams PDF
This slide highlights call center key performance indicators which can be used to evaluate organization and employee performance which includes service level, response time, abandonment rate, quality monitoring scores, customer satisfaction and first call resolution. Present like a pro with Evaluate Performance By Monitoring Call Center Kpis Ppt PowerPoint Presentation File Diagrams PDF Create beautiful presentations together with your team, using our easy to use presentation slides. Share your ideas in real time and make changes on the fly by downloading our templates. So whether you are in the office, on the go, or in a remote location, you can stay in sync with your team and present your ideas with confidence. With Slidegeeks presentation got a whole lot easier. Grab these presentations today.
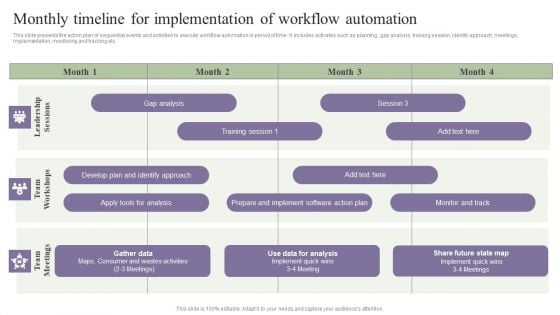
Deployment Of Process Automation To Increase Organisational Performance Monthly Timeline For Implementation Diagrams PDF
This slide presents the action plan of sequential events and activities to execute workflow automation in period of time. It includes activates such as planning , gap analysis, training session, identify approach, meetings, implementation, monitoring and tracking etc. Coming up with a presentation necessitates that the majority of the effort goes into the content and the message you intend to convey. The visuals of a PowerPoint presentation can only be effective if it supplements and supports the story that is being told. Keeping this in mind our experts created Deployment Of Process Automation To Increase Organisational Performance Monthly Timeline For Implementation Diagrams PDF to reduce the time that goes into designing the presentation. This way, you can concentrate on the message while our designers take care of providing you with the right template for the situation.
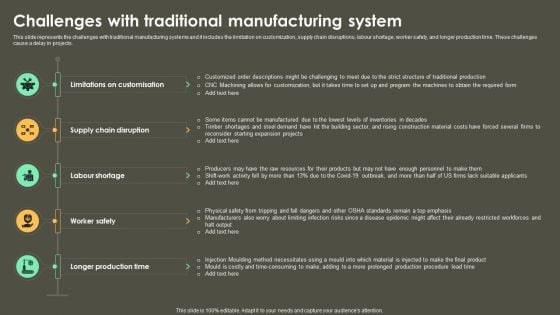
Iot Integration In Manufacturing Challenges With Traditional Manufacturing System Diagrams PDF
This slide represents the challenges with traditional manufacturing systems and it includes the limitation on customization, supply chain disruptions, labour shortage, worker safety, and longer production time. These challenges cause a delay in projects. Present like a pro with Iot Integration In Manufacturing Challenges With Traditional Manufacturing System Diagrams PDF Create beautiful presentations together with your team, using our easy-to-use presentation slides. Share your ideas in real-time and make changes on the fly by downloading our templates. So whether you are in the office, on the go, or in a remote location, you can stay in sync with your team and present your ideas with confidence. With Slidegeeks presentation got a whole lot easier. Grab these presentations today.
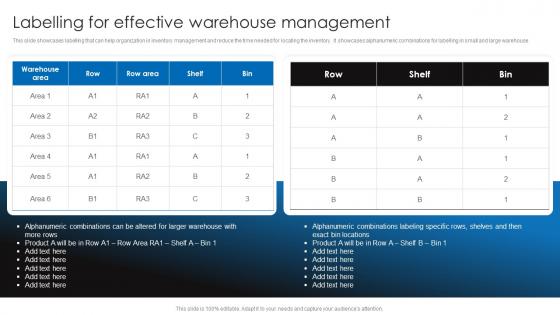
Labelling For Effective Warehouse Management Retail Stock Administration Strategies Diagrams Pdf
This slide showcases labelling that can help organization in inventory management and reduce the time needed for locating the inventory. It showcases alphanumeric combinations for labelling in small and large warehouse.Take your projects to the next level with our ultimate collection of Labelling For Effective Warehouse Management Retail Stock Administration Strategies Diagrams Pdf. Slidegeeks has designed a range of layouts that are perfect for representing task or activity duration, keeping track of all your deadlines at a glance. Tailor these designs to your exact needs and give them a truly corporate look with your own brand colors they all make your projects stand out from the rest. This slide showcases labelling that can help organization in inventory management and reduce the time needed for locating the inventory. It showcases alphanumeric combinations for labelling in small and large warehouse
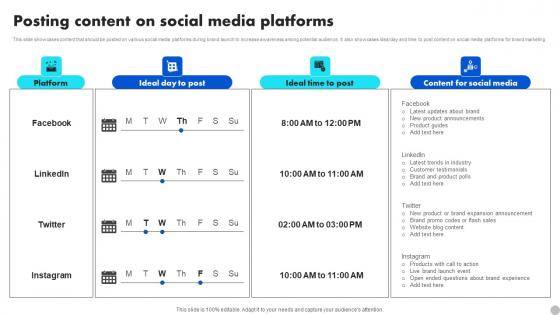
Posting Content On Social Media Platforms Brand Diversification Approach Diagrams Pdf
This slide showcases content that should be posted on various social media platforms during brand launch to increase awareness among potential audience. It also showcases ideal day and time to post content on social media platforms for brand marketing. Slidegeeks is one of the best resources for PowerPoint templates. You can download easily and regulate Posting Content On Social Media Platforms Brand Diversification Approach Diagrams Pdf for your personal presentations from our wonderful collection. A few clicks is all it takes to discover and get the most relevant and appropriate templates. Use our Templates to add a unique zing and appeal to your presentation and meetings. All the slides are easy to edit and you can use them even for advertisement purposes. This slide showcases content that should be posted on various social media platforms during brand launch to increase awareness among potential audience. It also showcases ideal day and time to post content on social media platforms for brand marketing.
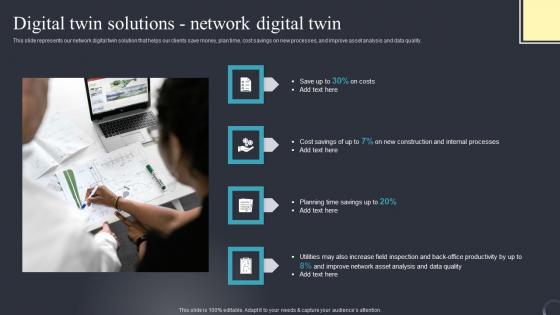
Digital Twin Solutions Network Digital Industrial Transformation Using Digital Twin Diagrams Pdf
This slide represents our network digital twin solution that helps our clients save money, plan time, cost savings on new processes, and improve asset analysis and data quality. Make sure to capture your audiences attention in your business displays with our gratis customizable Digital Twin Solutions Network Digital Industrial Transformation Using Digital Twin Diagrams Pdf. These are great for business strategies, office conferences, capital raising or task suggestions. If you desire to acquire more customers for your tech business and ensure they stay satisfied, create your own sales presentation with these plain slides. This slide represents our network digital twin solution that helps our clients save money, plan time, cost savings on new processes, and improve asset analysis and data quality.

Outcomes Digital Twin Technology Industrial Transformation Using Digital Twin Diagrams Pdf
This slide represents the outcomes of digital twin technology implementation that include improved stability, savings on reactive maintenance, reduced time to achieve goals, and so on. Slidegeeks has constructed Outcomes Digital Twin Technology Industrial Transformation Using Digital Twin Diagrams Pdf after conducting extensive research and examination. These presentation templates are constantly being generated and modified based on user preferences and critiques from editors. Here, you will find the most attractive templates for a range of purposes while taking into account ratings and remarks from users regarding the content. This is an excellent jumping off point to explore our content and will give new users an insight into our top notch PowerPoint Templates. This slide represents the outcomes of digital twin technology implementation that include improved stability, savings on reactive maintenance, reduced time to achieve goals, and so on.
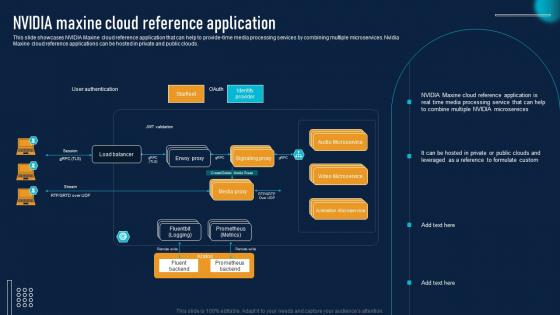
NVIDIA Maxine Cloud NVIDIA AI To Improve Virtual Communication Experience Diagrams Pdf
This slide showcases NVIDIA Maxine cloud reference application that can help to provide time media processing services by combining multiple microservices. Nvidia Maxine cloud reference applications can be hosted in private and public clouds. From laying roadmaps to briefing everything in detail, our templates are perfect for you. You can set the stage with your presentation slides. All you have to do is download these easy to edit and customizable templates. NVIDIA Maxine Cloud NVIDIA AI To Improve Virtual Communication Experience Diagrams Pdf will help you deliver an outstanding performance that everyone would remember and praise you for. Do download this presentation today. This slide showcases NVIDIA Maxine cloud reference application that can help to provide time media processing services by combining multiple microservices. Nvidia Maxine cloud reference applications can be hosted in private and public clouds.
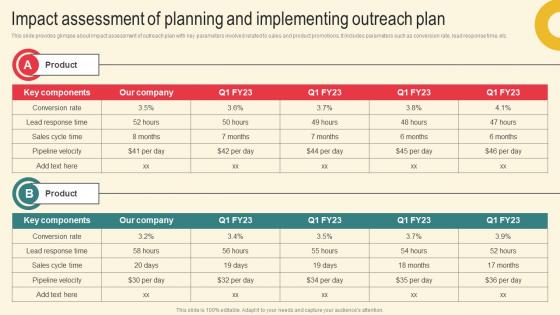
Impact Assessment Of Planning Marketing Plan For Boosting Client Retention In Retail Banking Diagrams Pdf
This slide provides glimpse about impact assessment of outreach plan with key parameters involved related to sales and product promotions. It includes parameters such as conversion rate, lead response time, etc. If your project calls for a presentation, then Slidegeeks is your go to partner because we have professionally designed, easy to edit templates that are perfect for any presentation. After downloading, you can easily edit Impact Assessment Of Planning Marketing Plan For Boosting Client Retention In Retail Banking Diagrams Pdf and make the changes accordingly. You can rearrange slides or fill them with different images. Check out all the handy templates This slide provides glimpse about impact assessment of outreach plan with key parameters involved related to sales and product promotions. It includes parameters such as conversion rate, lead response time, etc.
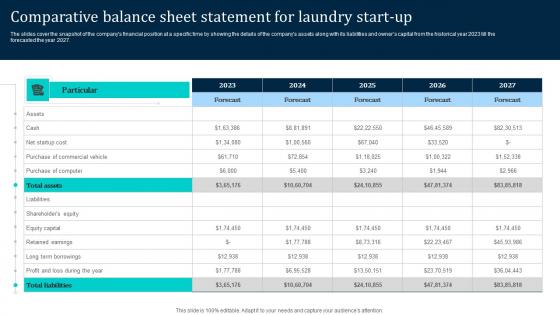
Comparative Balance Sheet Statement Laundromat Business Plan Go To Market Diagrams Pdf
The slides cover the snapshot of the companys financial position at a specific time by showing the details of the companys assets along with its liabilities and owners capital from the historical year 2023 till the forecasted the year 2027.Want to ace your presentation in front of a live audience Our Comparative Balance Sheet Statement Laundromat Business Plan Go To Market Diagrams Pdf can help you do that by engaging all the users towards you.. Slidegeeks experts have put their efforts and expertise into creating these impeccable powerpoint presentations so that you can communicate your ideas clearly. Moreover, all the templates are customizable, and easy-to-edit and downloadable. Use these for both personal and commercial use. The slides cover the snapshot of the companys financial position at a specific time by showing the details of the companys assets along with its liabilities and owners capital from the historical year 2023 till the forecasted the year 2027.
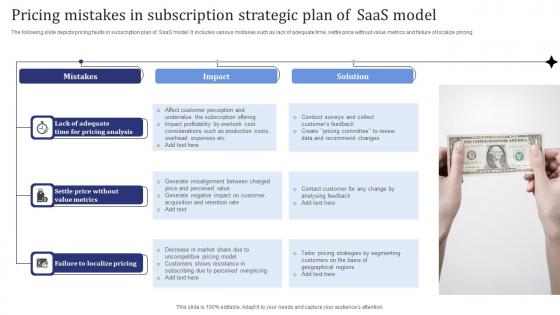
Pricing Mistakes In Subscription Strategic Plan Of Saas Model Diagrams Pdf
The following slide depicts pricing faults in subscription plan of SaaS model. It includes various mistakes such as lack of adequate time, settle price without value metrics and failure of localize pricing. Pitch your topic with ease and precision using this Pricing Mistakes In Subscription Strategic Plan Of Saas Model Diagrams Pdf. This layout presents information on Mistakes, Settle Price Without, Value Metrics. It is also available for immediate download and adjustment. So, changes can be made in the color, design, graphics or any other component to create a unique layout. The following slide depicts pricing faults in subscription plan of SaaS model. It includes various mistakes such as lack of adequate time, settle price without value metrics and failure of localize pricing.
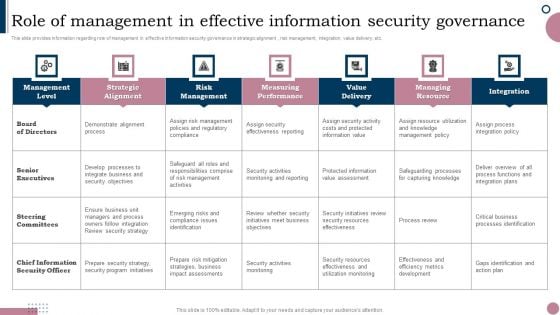
Cios Guide To Optimize Role Of Management In Effective Information Security Governance Diagrams PDF
This slide provides information regarding role of management in effective information security governance in strategic alignment , risk management, integration, value delivery, etc. Retrieve professionally designed Cios Guide To Optimize Role Of Management In Effective Information Security Governance Diagrams PDF to effectively convey your message and captivate your listeners. Save time by selecting pre-made slideshows that are appropriate for various topics, from business to educational purposes. These themes come in many different styles, from creative to corporate, and all of them are easily adjustable and can be edited quickly. Access them as PowerPoint templates or as Google Slides themes. You dont have to go on a hunt for the perfect presentation because Slidegeeks got you covered from everywhere.
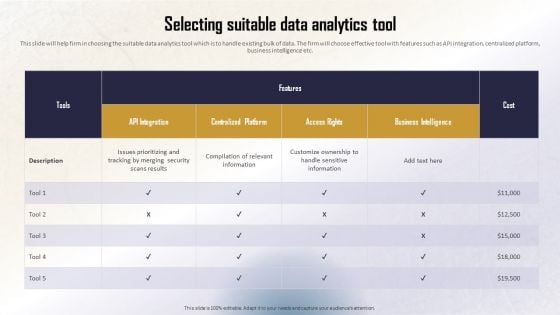
Identifying Direct And Indirect Selecting Suitable Data Analytics Tool Diagrams PDF
This slide will help firm in choosing the suitable data analytics tool which is to handle existing bulk of data. The firm will choose effective tool with features such as API integration, centralized platform, business intelligence etc. Retrieve professionally designed Identifying Direct And Indirect Selecting Suitable Data Analytics Tool Diagrams PDF to effectively convey your message and captivate your listeners. Save time by selecting pre-made slideshows that are appropriate for various topics, from business to educational purposes. These themes come in many different styles, from creative to corporate, and all of them are easily adjustable and can be edited quickly. Access them as PowerPoint templates or as Google Slides themes. You dont have to go on a hunt for the perfect presentation because Slidegeeks got you covered from everywhere.
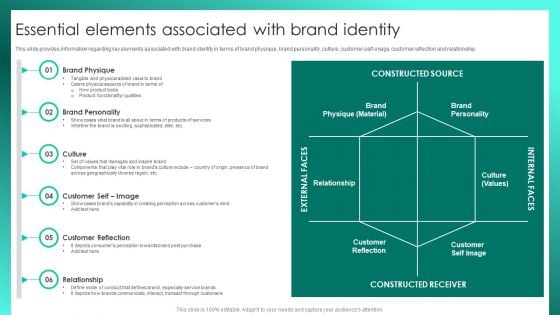
Successful Brand Management Essential Elements Associated With Brand Identity Diagrams PDF
This slide provides information regarding key elements associated with brand identity in terms of brand physique, brand personality, culture, customer self-image, customer reflection and relationship. Retrieve professionally designed Successful Brand Management Essential Elements Associated With Brand Identity Diagrams PDF to effectively convey your message and captivate your listeners. Save time by selecting pre-made slideshows that are appropriate for various topics, from business to educational purposes. These themes come in many different styles, from creative to corporate, and all of them are easily adjustable and can be edited quickly. Access them as PowerPoint templates or as Google Slides themes. You dont have to go on a hunt for the perfect presentation because Slidegeeks got you covered from everywhere.
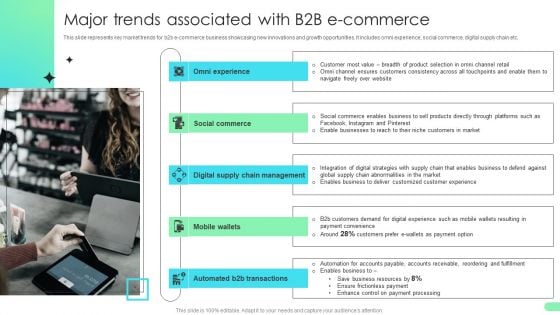
Major Trends Associated With B2b E Commerce Comprehensive Guide For Developing Diagrams PDF
This slide represents key market trends for b2b e-commerce business showcasing new innovations and growth opportunities. It includes omni experience, social commerce, digital supply chain etc.Retrieve professionally designed Major Trends Associated With B2b E Commerce Comprehensive Guide For Developing Diagrams PDF to effectively convey your message and captivate your listeners. Save time by selecting pre-made slideshows that are appropriate for various topics, from business to educational purposes. These themes come in many different styles, from creative to corporate, and all of them are easily adjustable and can be edited quickly. Access them as PowerPoint templates or as Google Slides themes. You do not have to go on a hunt for the perfect presentation because Slidegeeks got you covered from everywhere.
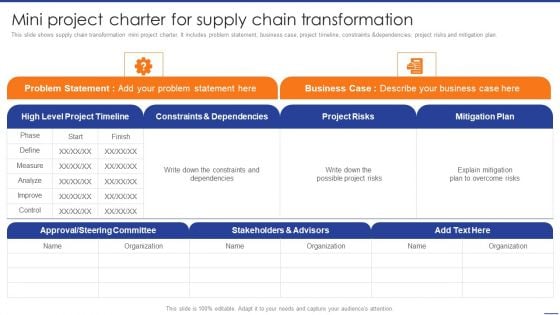
Digital Transformation Of Supply Mini Project Charter For Supply Chain Transformation Diagrams PDF
This slide shows supply chain transformation mini project charter. It includes problem statement, business case, project timeline, constraints and dependencies, project risks and mitigation plan. Retrieve professionally designed Digital Transformation Of Supply Mini Project Charter For Supply Chain Transformation Diagrams PDF to effectively convey your message and captivate your listeners. Save time by selecting pre-made slideshows that are appropriate for various topics, from business to educational purposes. These themes come in many different styles, from creative to corporate, and all of them are easily adjustable and can be edited quickly. Access them as PowerPoint templates or as Google Slides themes. You dont have to go on a hunt for the perfect presentation because Slidegeeks got you covered from everywhere.


 Continue with Email

 Home
Home


