Clock Icon
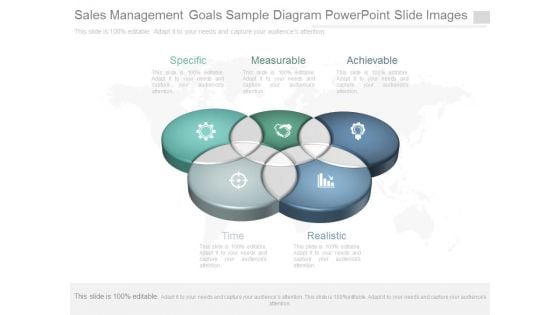
Sales Management Goals Sample Diagram Powerpoint Slide Images
This is a sales management goals sample diagram powerpoint slide images. This is a five stage process. The stages in this process are specific, measurable, achievable, time, realistic.
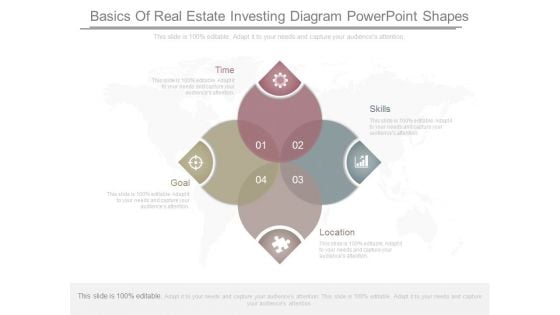
Basics Of Real Estate Investing Diagram Powerpoint Shapes
This is a basics of real estate investing diagram powerpoint shapes. This is a four stage process. The stages in this process are skills, location, goal, time.
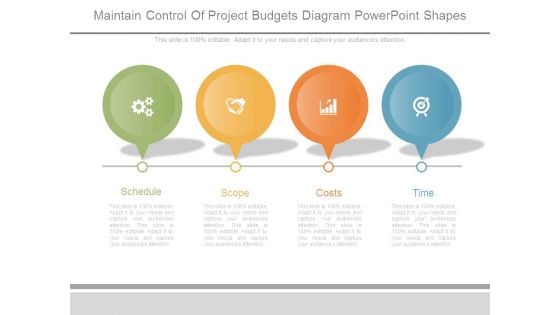
Maintain Control Of Project Budgets Diagram Powerpoint Shapes
This is a maintain control of project budgets diagram powerpoint shapes. This is a four stage process. The stages in this process are schedule, scope, costs, time.

Sales Team Performance Meter Ppt PowerPoint Presentation Diagrams
This is a sales team performance meter ppt powerpoint presentation diagrams. This is a five stage process. The stages in this process are business, meter, speed, time, sales.
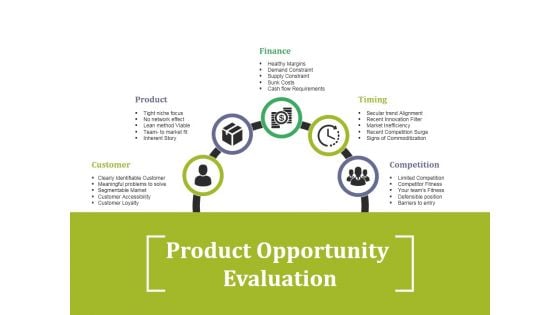
Product Opportunity Evaluation Ppt PowerPoint Presentation Diagram Lists
This is a product opportunity evaluation ppt powerpoint presentation diagram lists. This is a five stage process. The stages in this process are customer, product, finance, timing, competition.
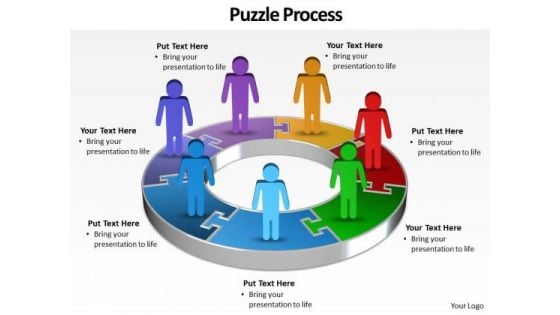
Ppt Group Of World Business PowerPoint Slide Text People With 3d Pie Chart Templates
PPT group of world business powerpoint slide text people with 3d pie chart Templates-This 3D Business PowerPoint Diagram consists of group of people standing on circle representing the growth percentage of individual Business perspective. This Diagram will fit for Business Presentations.-PPT group of world business powerpoint slide text people with 3d pie chart Templates-Abstract, Arrow, Art, Artistic, Background, Business, Colorful, Communication, Computer-Graphics, Concept, Creation, Data, Decoration, Decorative, Design, Design-Element, Digital, Direction, Effect, Elegance, Element, Energy, Flow, Go, Idea, Illustration, Modern, Movement, Network, Symbol Some in your community may have fallen on bad times. Comfort them with our Ppt Group Of World Business PowerPoint Slide Text People With 3d Pie Chart Templates.

People With Pie Chart Business PowerPoint Templates And PowerPoint Backgrounds 0711
Microsoft PowerPoint Template and Background with people with a pie chart Win genuine accolades with our People With Pie Chart Business PowerPoint Templates And PowerPoint Backgrounds 0711. Dont waste time struggling with PowerPoint. Let us do it for you.

Stakeholder Mapping Strategy With Project Impact Impact Shareholder Decisions With Stakeholder Administration Themes PDF
This slide covers the stakeholder mapping strategy after identification of the key stakeholders such as collaboration, maintaining confidence, keeping informed, monitoring and responds. Do you know about Slidesgeeks Stakeholder Mapping Strategy With Project Impact Impact Shareholder Decisions With Stakeholder Administration Themes PDF These are perfect for delivering any kind od presentation. Using it, create PowerPoint presentations that communicate your ideas and engage audiences. Save time and effort by using our pre-designed presentation templates that are perfect for a wide range of topic. Our vast selection of designs covers a range of styles, from creative to business, and are all highly customizable and easy to edit. Download as a PowerPoint template or use them as Google Slides themes.
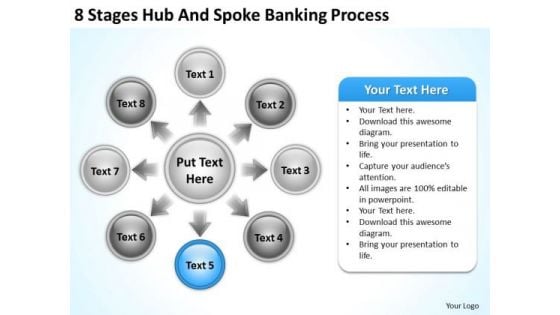
Business Flow Charts Examples 8 Stages Hub And Spoke Banking Process Ppt PowerPoint Template
We present our business flow charts examples 8 stages hub and spoke banking process ppt PowerPoint template.Present our Communication PowerPoint Templates because Our PowerPoint Templates and Slides will steer your racing mind. Hit the right buttons and spur on your audience. Use our Business PowerPoint Templates because You are working at that stage with an air of royalty. Let our PowerPoint Templates and Slides be the jewels in your crown. Download our Circle Charts PowerPoint Templates because Our PowerPoint Templates and Slides has conjured up a web of all you need with the help of our great team. Use them to string together your glistening ideas. Download our Arrows PowerPoint Templates because You canTake a leap off the starting blocks with our PowerPoint Templates and Slides. They will put you ahead of the competition in quick time. Present our Process and Flows PowerPoint Templates because It will Give impetus to the hopes of your colleagues. Our PowerPoint Templates and Slides will aid you in winning their trust.Use these PowerPoint slides for presentations relating to Arrows, Business, Chart, Circle, Company, Concept, Continuity, Continuous, Cycle, Dependency, Diagram, Direction, Dynamic, Endless, Feeds, Graph, Iteration, Iterative, Method, Path, Phase, Presentation, Process, Production, Progress, Progression, Report, Rotation, Sequence, Succession, Vector. The prominent colors used in the PowerPoint template are Blue, Gray, Black. Mastermind plans with our Business Flow Charts Examples 8 Stages Hub And Spoke Banking Process Ppt PowerPoint Template. Download without worries with our money back guaranteee.

Business Team Of Success Global PowerPoint Themes And PowerPoint Slides 0611
Microsoft PowerPoint Theme and Slide with business people team next to a chart over a worldmap Your presentations will become famous with our Business Team Of Success Global PowerPoint Themes And PowerPoint Slides 0611. Dont waste time struggling with PowerPoint. Let us do it for you.

Lego Bar Graph Steps Business PowerPoint Templates And PowerPoint Themes 0512
Lego Bar Graph Steps Business PowerPoint Templates And PowerPoint Themes PPT designs-Microsoft Powerpoint Templates and Background with achievement chart from building blocks Make informative presentations with our Lego Bar Graph Steps Business PowerPoint Templates And PowerPoint Themes 0512. Dont waste time struggling with PowerPoint. Let us do it for you.
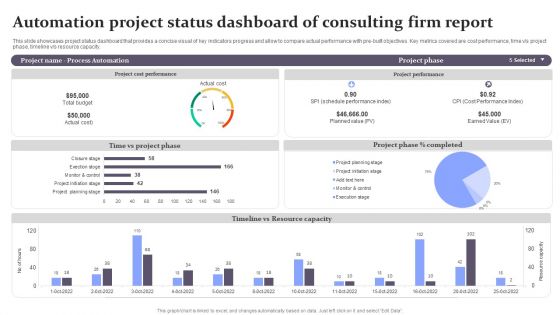
Automation Project Status Dashboard Of Consulting Firm Report Background PDF
This slide showcases project status dashboard that provides a concise visual of key indicators progress and allow to compare actual performance with pre-built objectives. Key metrics covered are cost performance, time v or s project phase, timeline v or s resource capacity. Showcasing this set of slides titled Automation Project Status Dashboard Of Consulting Firm Report Background PDF. The topics addressed in these templates are Project Phase, Planned Value, Cost Performance Index. All the content presented in this PPT design is completely editable. Download it and make adjustments in color, background, font etc. as per your unique business setting.
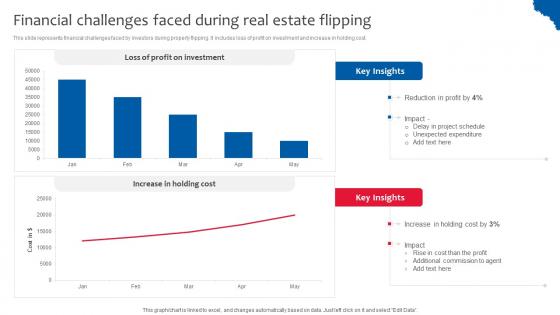
Financial Challenges Faced During Deploying Effective Property Flipping Strategies Diagrams Pdf
This slide represents financial challenges faced by investors during property flipping. It includes loss of profit on investment and increase in holding cost. Coming up with a presentation necessitates that the majority of the effort goes into the content and the message you intend to convey. The visuals of a PowerPoint presentation can only be effective if it supplements and supports the story that is being told. Keeping this in mind our experts created Financial Challenges Faced During Deploying Effective Property Flipping Strategies Diagrams Pdf to reduce the time that goes into designing the presentation. This way, you can concentrate on the message while our designers take care of providing you with the right template for the situation. This slide represents financial challenges faced by investors during property flipping. It includes loss of profit on investment and increase in holding cost.
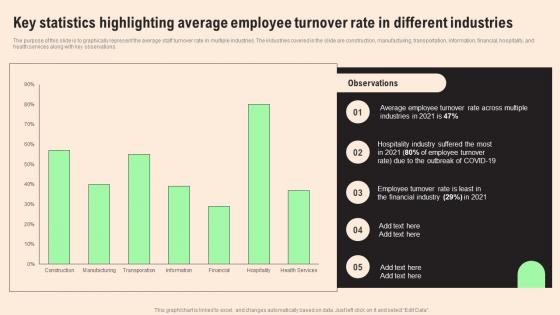
Key Statistics Highlighting Average Employee Turnover Rate In Different Industries Diagrams Pdf
The purpose of this slide is to graphically represent the average staff turnover rate in multiple industries. The industries covered in the slide are construction, manufacturing, transportation, information, financial, hospitality, and health services along with key observations. Boost your pitch with our creative Key Statistics Highlighting Average Employee Turnover Rate In Different Industries Diagrams Pdf. Deliver an awe inspiring pitch that will mesmerize everyone. Using these presentation templates you will surely catch everyones attention. You can browse the ppts collection on our website. We have researchers who are experts at creating the right content for the templates. So you do not have to invest time in any additional work. Just grab the template now and use them. The purpose of this slide is to graphically represent the average staff turnover rate in multiple industries. The industries covered in the slide are construction, manufacturing, transportation, information, financial, hospitality, and health services along with key observations.
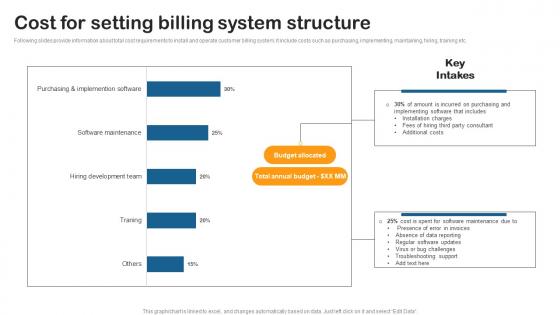
Cost For Setting Billing System Building Utility Billing And Invoicing Management System Diagrams Pdf
Following slides provide information about total cost requirements to install and operate customer billing system. It include costs such as purchasing, implementing, maintaining, hiring, training etc. Present like a pro with Cost For Setting Billing System Building Utility Billing And Invoicing Management System Diagrams Pdf Create beautiful presentations together with your team, using our easy to use presentation slides. Share your ideas in real time and make changes on the fly by downloading our templates. So whether you are in the office, on the go, or in a remote location, you can stay in sync with your team and present your ideas with confidence. With Slidegeeks presentation got a whole lot easier. Grab these presentations today. Following slides provide information about total cost requirements to install and operate customer billing system. It include costs such as purchasing, implementing, maintaining, hiring, training etc.
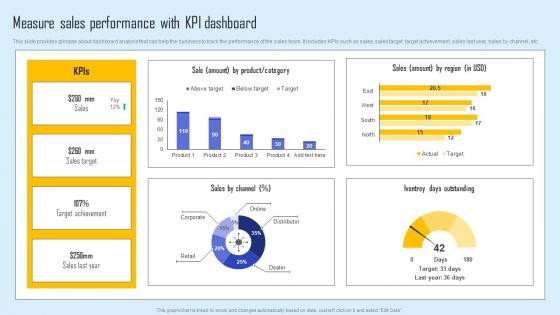
Measure Sales Performance Effective Sales Strategy To Enhance Customer Retention Diagrams Pdf
This slide provides glimpse about dashboard analysis that can help the business to track the performance of the sales team. It includes KPIs such as sales, sales target, target achievement, sales last year, sales by channel, etc. The best PPT templates are a great way to save time, energy, and resources. Slidegeeks have 100 percent editable powerpoint slides making them incredibly versatile. With these quality presentation templates, you can create a captivating and memorable presentation by combining visually appealing slides and effectively communicating your message. Download Measure Sales Performance Effective Sales Strategy To Enhance Customer Retention Diagrams Pdf from Slidegeeks and deliver a wonderful presentation. This slide provides glimpse about dashboard analysis that can help the business to track the performance of the sales team. It includes KPIs such as sales, sales target, target achievement, sales last year, sales by channel, etc.
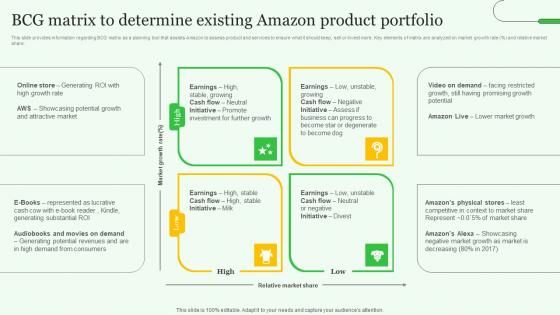
BCG Matrix Determine Existing Exploring Amazons Global Business Model Growth Diagrams Pdf
This slide provides information regarding BCG matrix as a planning tool that assists Amazon to assess product and services to ensure what it should keep, sell or invest more. Key elements of matrix are analyzed on market growth rate precent and relative market share. There are so many reasons you need a BCG Matrix Determine Existing Exploring Amazons Global Business Model Growth Diagrams Pdf. The first reason is you can not spend time making everything from scratch, Thus, Slidegeeks has made presentation templates for you too. You can easily download these templates from our website easily. This slide provides information regarding BCG matrix as a planning tool that assists Amazon to assess product and services to ensure what it should keep, sell or invest more. Key elements of matrix are analyzed on market growth rate precent and relative market share.
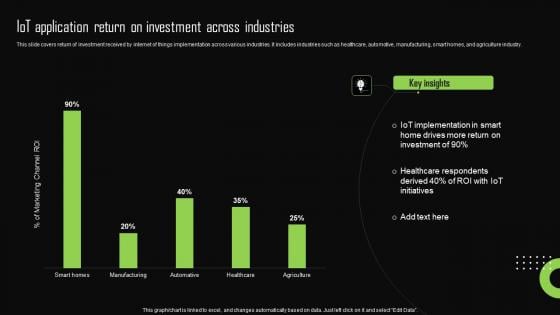
Iot Application Return On Investment Across Iot Device Management Diagrams Pdf
This slide covers return of investment received by internet of things implementation across various industries. It includes industries such as healthcare, automotive, manufacturing, smart homes, and agriculture industry. The best PPT templates are a great way to save time, energy, and resources. Slidegeeks have 100 percent editable powerpoint slides making them incredibly versatile. With these quality presentation templates, you can create a captivating and memorable presentation by combining visually appealing slides and effectively communicating your message. Download Iot Application Return On Investment Across Iot Device Management Diagrams Pdf from Slidegeeks and deliver a wonderful presentation. This slide covers return of investment received by internet of things implementation across various industries. It includes industries such as healthcare, automotive, manufacturing, smart homes, and agriculture industry.
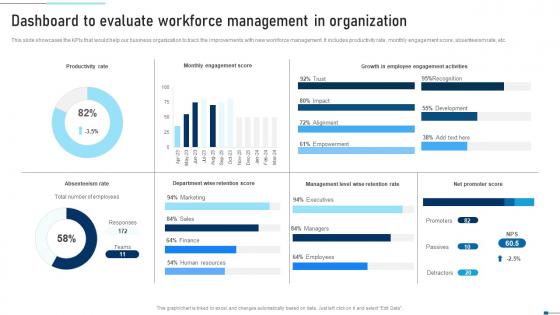
Dashboard To Evaluate Workforce Management In Strategic Talent Recruitment Diagrams Pdf
This slide showcases the KPIs that would help our business organization to track the improvements with new workforce management. It includes productivity rate, monthly engagement score, absenteeism rate, etc. Find highly impressive Dashboard To Evaluate Workforce Management In Strategic Talent Recruitment Diagrams Pdf on Slidegeeks to deliver a meaningful presentation. You can save an ample amount of time using these presentation templates. No need to worry to prepare everything from scratch because Slidegeeks experts have already done a huge research and work for you. You need to download for your upcoming presentation. All the presentation templates are 100 percent editable and you can change the color and personalize the content accordingly. Download now This slide showcases the KPIs that would help our business organization to track the improvements with new workforce management. It includes productivity rate, monthly engagement score, absenteeism rate, etc.
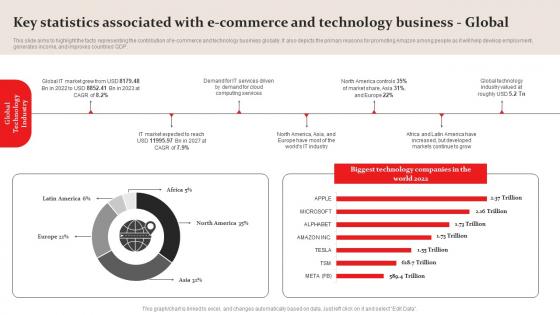
Amazon Business Plan Go To Market Strategy Key Statistics Associated With E Commerce Diagrams Pdf
This slide aims to highlight the facts representing the contribution of e commerce and technology business globally. It also depicts the primary reasons for promoting Amazon among people as it will help develop employment, generates income, and improves countries GDP. There are so many reasons you need a Amazon Business Plan Go To Market Strategy Key Statistics Associated With E Commerce Diagrams Pdf. The first reason is you can not spend time making everything from scratch, Thus, Slidegeeks has made presentation templates for you too. You can easily download these templates from our website easily. This slide aims to highlight the facts representing the contribution of e commerce and technology business globally. It also depicts the primary reasons for promoting Amazon among people as it will help develop employment, generates income, and improves countries GDP.
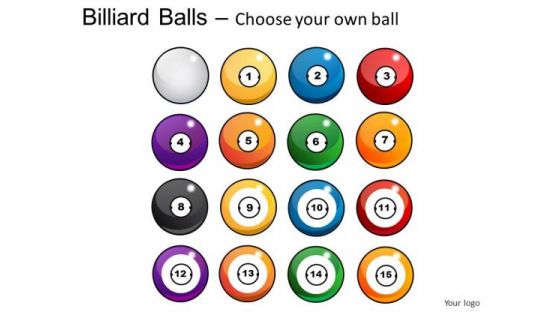
Shiny Billiard Balls With Cue PowerPoint Slides And Ppt Diagram Templates
Shiny Billiard Balls With Cue PowerPoint Slides And PPT Diagram Templates-These high quality powerpoint pre-designed slides and powerpoint templates have been carefully created by our professional team to help you impress your audience. All slides have been created and are 100% editable in powerpoint. Each and every property of any graphic - color, size, orientation, shading, outline etc. can be modified to help you build an effective powerpoint presentation. Any text can be entered at any point in the powerpoint template or slide. Simply DOWNLOAD, TYPE and PRESENT! Design exclusive presentations with our Shiny Billiard Balls With Cue PowerPoint Slides And Ppt Diagram Templates. Dont waste time struggling with PowerPoint. Let us do it for you.
Stripe Billiard Balls With Cue PowerPoint Slides And Ppt Diagram Templates
Stripe Billiard Balls With Cue PowerPoint Slides And PPT Diagram Templates-These high quality powerpoint pre-designed slides and powerpoint templates have been carefully created by our professional team to help you impress your audience. All slides have been created and are 100% editable in powerpoint. Each and every property of any graphic - color, size, orientation, shading, outline etc. can be modified to help you build an effective powerpoint presentation. Any text can be entered at any point in the powerpoint template or slide. Simply DOWNLOAD, TYPE and PRESENT! Make use of our gigantic collection with our Stripe Billiard Balls With Cue PowerPoint Slides And Ppt Diagram Templates. Dont waste time struggling with PowerPoint. Let us do it for you.
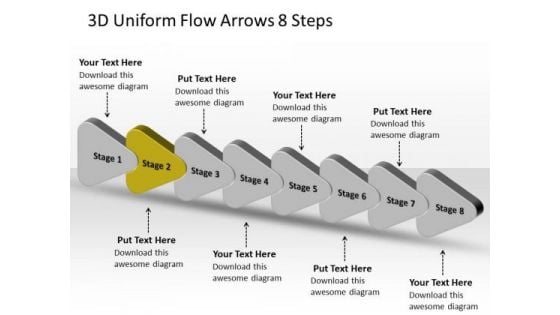
3d Uniform Flow Arrows 8 Steps Ppt Business Production Plan PowerPoint Slides
We present our 3d uniform flow arrows 8 steps ppt business production plan PowerPoint Slides. Use our Business PowerPoint Templates because, Marketing Strategy Business Template: - Maximizing sales of your product is the intended destination. Use our Arrows PowerPoint Templates because, Probe the minds of your colleagues, see their faces light up as they assimilate and understand the value of your suggestions. Use our Success PowerPoint Templates because, At times, however, there is a crucial aspect that requires extra attention. Use our Signs PowerPoint Templates because, they help to lay the base of your trend of thought. Use our Process and Flows PowerPoint Templates because; Watch their mental juices begin to flow. Use these PowerPoint slides for presentations relating to abstract, arrow, arrows, business, chart, design, development, diagram, direction, element, flow, flowchart, graph, linear, management, model, motion, organization, plan, process, program, section, segment, set, sign, solution, strategy, symbol, technology. The prominent colors used in the PowerPoint template are Green, Gray, and Black Boil down the argument with our 3d Uniform Flow Arrows 8 Steps Ppt Business Production Plan PowerPoint Slides. Analyse complexities to their barest detail.
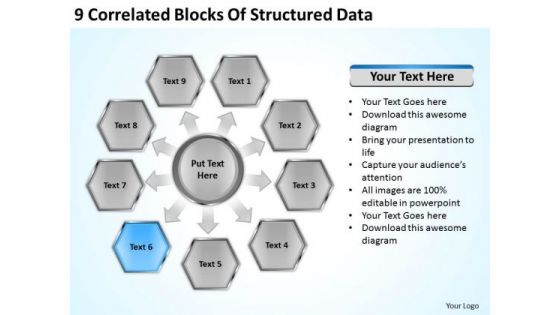
9 Correlated Blocks Of Structured Data Download Business Plans PowerPoint Templates
We present our 9 correlated blocks of structured data download business plans PowerPoint templates.Download our Marketing PowerPoint Templates because Our PowerPoint Templates and Slides are conceived by a dedicated team. Use them and give form to your wondrous ideas. Download our Business PowerPoint Templates because It can Bubble and burst with your ideas. Present our Finance PowerPoint Templates because Our PowerPoint Templates and Slides will let you Hit the right notes. Watch your audience start singing to your tune. Present our Process and Flows PowerPoint Templates because Our PowerPoint Templates and Slides will give good value for money. They also have respect for the value of your time. Download our Arrows PowerPoint Templates because It will let you Set new benchmarks with our PowerPoint Templates and Slides. They will keep your prospects well above par.Use these PowerPoint slides for presentations relating to Diagram, Chart, Business, Background, Vector, Pie, Brown, Abstract, Wheel, Options, Board, Website, Cross, Statistics, Model, Item, Document, Media, Beehives, Red, Hive, Concept, Presentation, Template, Matt, Brochure, Orange, Guide, Description, Multicolor, Marketing, Gray, Development, Title, Management, Honeycomb, Illustration, Six, Catalog, Direction, Plans, Blue, Text, Reports, Financial, Workplace, Navigation, Parts. The prominent colors used in the PowerPoint template are Blue, Gray, Black. Decrease wastage with our 9 Correlated Blocks Of Structured Data Download Business Plans PowerPoint Templates. Download without worries with our money back guaranteee.
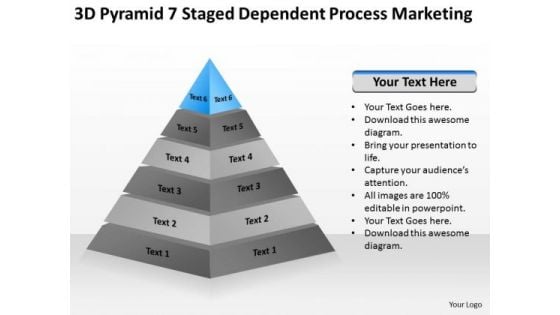
7 Staged Dependent Process Marketing Ppt Business Plan Template PowerPoint Templates
We present our 7 staged dependent process marketing ppt business plan template PowerPoint templates.Present our Business PowerPoint Templates because You canTake a leap off the starting blocks with our PowerPoint Templates and Slides. They will put you ahead of the competition in quick time. Use our Pyramids PowerPoint Templates because It will get your audience in sync. Download our Process and Flows PowerPoint Templates because Our PowerPoint Templates and Slides team portray an attitude of elegance. Personify this quality by using them regularly. Download our Triangles PowerPoint Templates because Watching this your Audience will Grab their eyeballs, they wont even blink. Present our Marketing PowerPoint Templates because Our PowerPoint Templates and Slides will provide you a launch platform. Give a lift off to your ideas and send them into orbit.Use these PowerPoint slides for presentations relating to Pyramid, chart, diagram, graph, step, seven, results, level, shape, part, isolated, triangle, innovation, business, concept,hierarchy, teamwork, symbol, abstract, team, management, support, illustration, stage, object, system, strategy, status, reflection, growth, progress, increase, financial, construction, structure, performance. The prominent colors used in the PowerPoint template are Blue light, Gray, Black. Assist yourself with our 7 Staged Dependent Process Marketing Ppt Business Plan Template PowerPoint Templates. Download without worries with our money back guaranteee.

Dollar And Graph Business PowerPoint Templates And PowerPoint Themes 1112
We present our Dollar And Graph Business PowerPoint Templates And PowerPoint Themes 1112.Use our Signs PowerPoint Templates because, This business powerpoint template helps expound on the logic of your detailed thought process to take your company forward. Use our Money PowerPoint Templates because, Churn the wheels of the brains of your colleagues. Use our Finance PowerPoint Templates because,Educate your team and the attention you have paid. Use our Business PowerPoint Templates because, It is also a time to bond with family, friends, colleagues and any other group of your choice. Use our Success PowerPoint Templates because, Explain thecontribution of each of the elements and how they provide impetus to the next phase.Use these PowerPoint slides for presentations relating to Business graph, signs, success, money, finance, business . The prominent colors used in the PowerPoint template are Yellow, Orange, Black Adopt adventure with our Dollar And Graph Business PowerPoint Templates And PowerPoint Themes 1112. Discover new avenues for your thoughts.
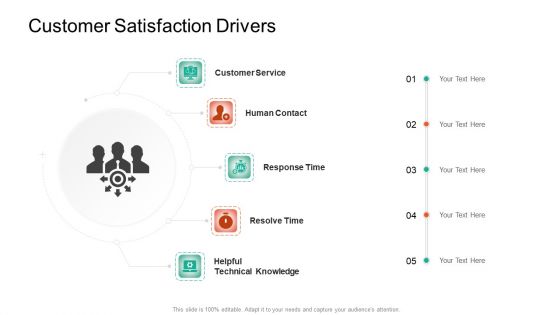
Product Capabilities Customer Satisfaction Drivers Ppt Ideas Themes PDF
This is a product capabilities customer satisfaction drivers ppt ideas themes pdf template with various stages. Focus and dispense information on five stages using this creative set, that comes with editable features. It contains large content boxes to add your information on topics like customer service, human contact, resolve time, response time, helpful technical knowledge. You can also showcase facts, figures, and other relevant content using this PPT layout. Grab it now.
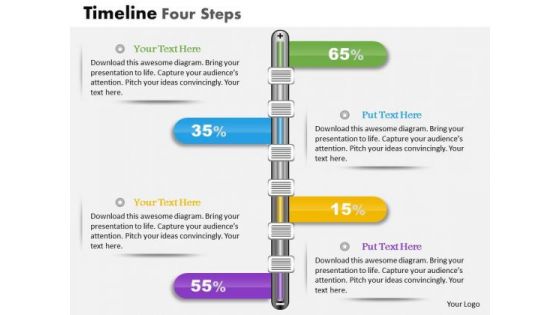
Business Diagram Timeline Four Steps Presentation Template
This business power point template has been designed with graphic of four steps timeline diagram. This image slide contains the concept of time management and business milestones. This slide may be used for business presentations.

Journey To Senior Management Presentation Diagrams
This is a journey to senior management presentation diagrams. This is a four stage process. The stages in this time process are organizational silo, strategy and competitive advantage, business design for innovation, journey to senior management.
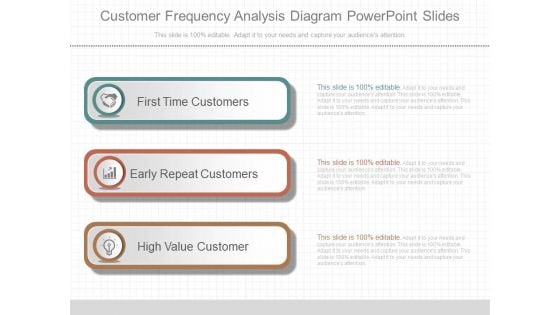
Customer Frequency Analysis Diagram Powerpoint Slides
This is a customer frequency analysis diagram powerpoint slides. This is a three stage process. The stages in this process are first time customers, early repeat customers, high value customer.
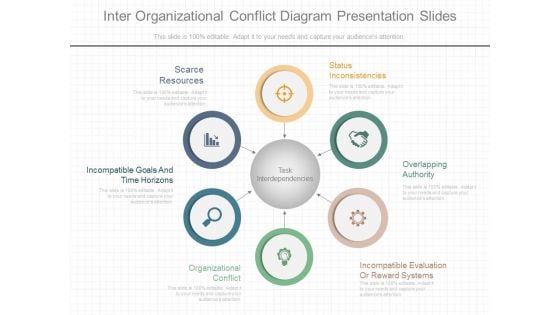
Inter Organizational Conflict Diagram Presentation Slides
This is a inter organizational conflict diagram presentation slides. This is a six stage process. The stages in this process are scarce resources, incompatible goals and time horizons, organizational conflict, status inconsistencies, overlapping authority, incompatible evaluation or reward systems.

Manufacturing Schedule Cycle Diagram Ppt Sample
This is a manufacturing schedule cycle diagram ppt sample. This is a six stage process. The stages in this process are delivery product on time, satisfy customer, improve customer retention, increase sales, drive revenue growth, deliver profit.
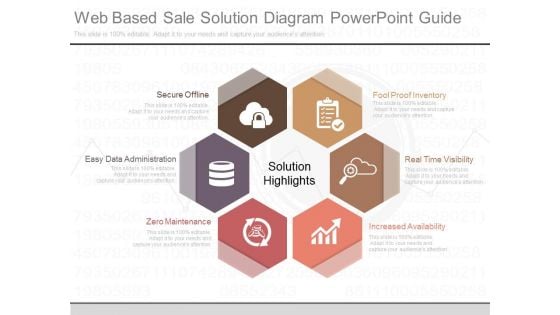
Web Based Sale Solution Diagram Powerpoint Guide
This is a web based sale solution diagram powerpoint guide. This is a six stage process. The stages in this process are fool proof inventory, real time visibility, increased availability, zero maintenance, easy data administration, secure offline.

Performance Cycle Diagram Ppt Powerpoint Ideas
This is a performance cycle diagram ppt powerpoint ideas. This is a five stage process. The stages in this process are repeat if desired, measure performance, establish a baseline, identify bottlenecks, make one change at a time.
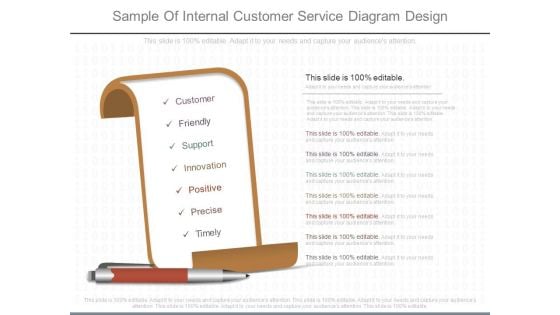
Sample Of Internal Customer Service Diagram Design
This is a sample of internal customer service diagram design. This is a one stage process. The stages in this process are customer, friendly, support, innovation, positive, precise, timely.
Sales Tracking Solution Diagram Powerpoint Guide
This is a sales tracking solution diagram powerpoint guide. This is a five stage process. The stages in this process are significant process charges, swifter implementation with saas, third party integration, synchronization between it and sales staff, real time analytics.
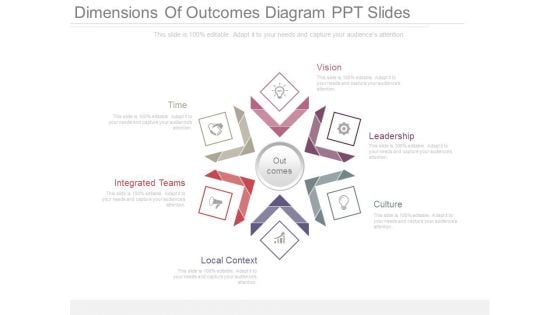
Dimensions Of Outcomes Diagram Ppt Slides
This is a dimensions of outcomes diagram ppt slides. This is a six stage process. The stages in this process are time, integrated teams, local context, culture, leadership, vision, out comes.

Product Portfolio Gap Analysis Diagram Powerpoint Slides
This is a product portfolio gap analysis diagram powerpoint slides. This is a two stage process. The stages in this process are market share, gap analysis, time, product price, place, promotion, people, process, physical environment.
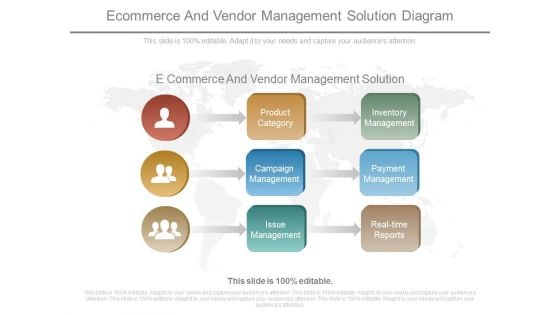
E Commerce And Vendor Management Solution Diagram
This is a e commerce and vendor management solution diagram. This is a nine stage process. The stages in this process are product category, campaign management, issue management, inventory management, payment management, real time reports.\n\n\n\n
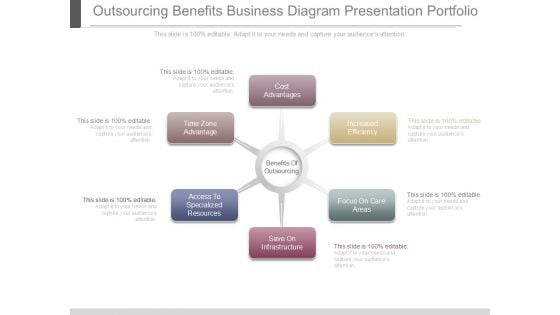
Outsourcing Benefits Business Diagram Presentation Portfolio
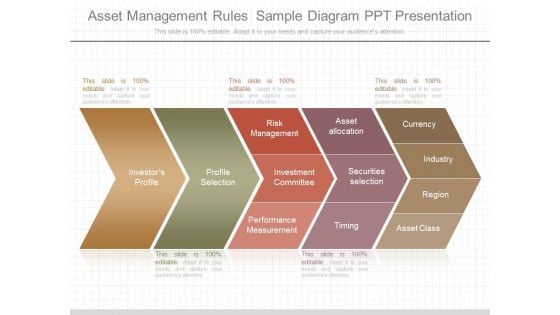
Asset Management Rules Sample Diagram Ppt Presentation
This is a asset management rules sample diagram ppt presentation. This is a five stage process. The stages in this process are investor s profile, profile, profile selection, risk management, investment committee, performance measurement, securities selection, asset allocation, timing.
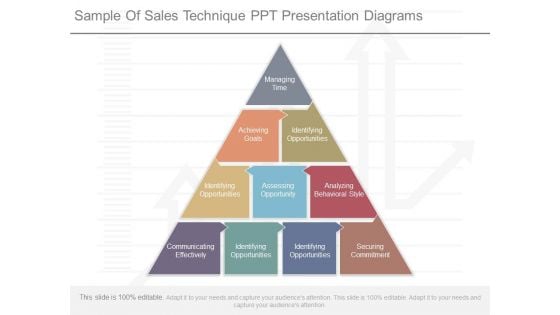
Sample Of Sales Technique Ppt Presentation Diagrams
This is a sample of sales technique ppt presentation diagrams. This is a ten stage process. The stages in this process are managing time, achieving goals, identifying opportunities, assessing opportunity, analyzing behavioral style, communicating effectively, securing commitment.
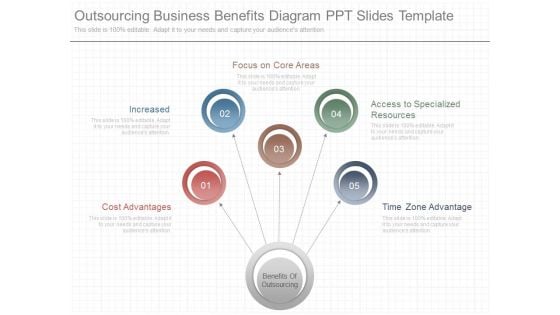
Outsourcing Business Benefits Diagram Ppt Slides Template
This is a outsourcing business benefits diagram ppt slides template. This is a five stage process. The stages in this process are benefits of outsourcing, cost advantages, increased, focus on core areas, access to specialized resources, time zone advantage.
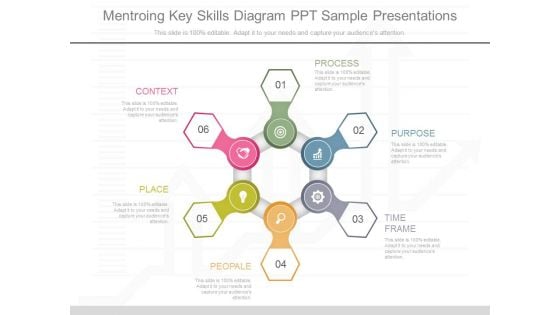
Mentroing Key Skills Diagram Ppt Sample Presentations
This is a mentroing key skills diagram ppt sample presentations. This is a six stage process. The stages in this process are context, place, people, time frame, purpose, process.
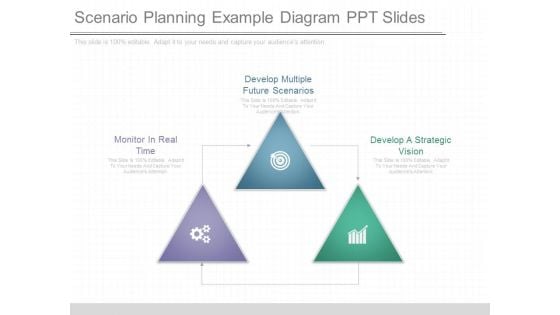
Scenario Planning Example Diagram Ppt Slides
This is a scenario planning example diagram ppt slides. This is a three stage process. The stages in this process are monitor in real time, develop multiple future scenarios, develop a strategic vision.

Hr Dashboard Solutions Diagram Powerpoint Slides
This is a hr dashboard solutions diagram powerpoint slides. This is a two stage process. The stages in this process are time to recruit by month, recruitment cost by month, sick, holiday, suspended, injured.
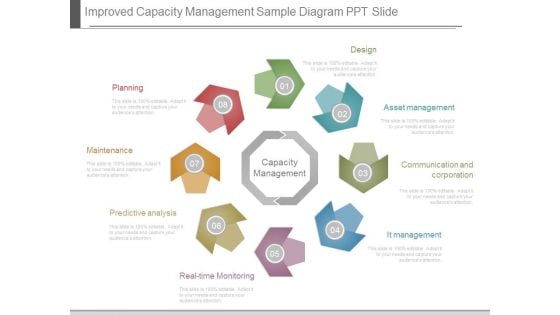
Improved Capacity Management Sample Diagram Ppt Slide
This is a improved capacity management sample diagram ppt slide. This is a eight stage process. The stages in this process are design, asset management, communication and corporation, it management, planning, maintenance, predictive analysis, real time monitoring, capacity management.
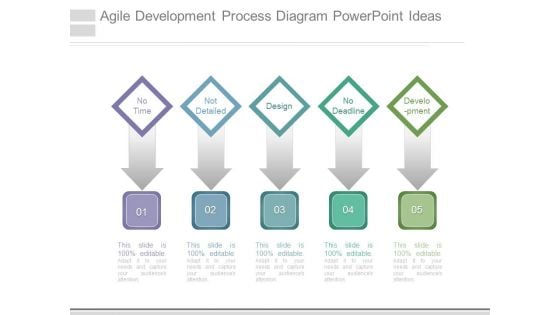
Agile Development Process Diagram Powerpoint Ideas
This is a agile development process diagram powerpoint ideas. This is a five stage process. The stages in this process are no time, not detailed, design, no deadline, development.
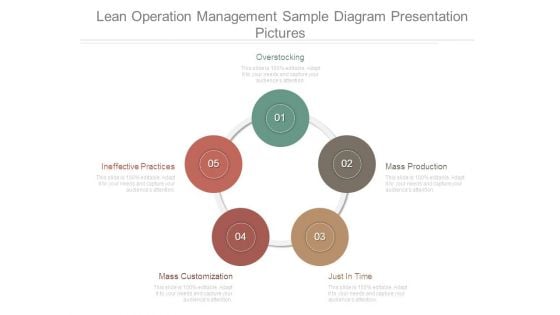
Lean Operation Management Sample Diagram Presentation Pictures
This is a lean operation management sample diagram presentation pictures. This is a five stage process. The stages in this process are overstocking, ineffective practices, mass customization, just in time, mass production.

Process Of Scope Management Diagram Powerpoint Topics
This is a process of scope management diagram powerpoint topics. This is a five stage process. The stages in this process are project integration management, scope management, time management, scope, procurement, communication.
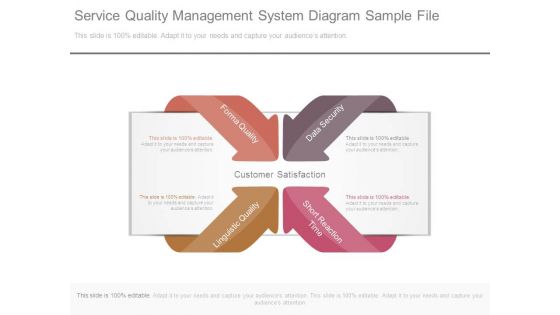
Service Quality Management System Diagram Sample File
This is a service quality management system diagram sample file. This is a four stage process. The stages in this process are forma quality, linguistic quality, data security, short reaction time.
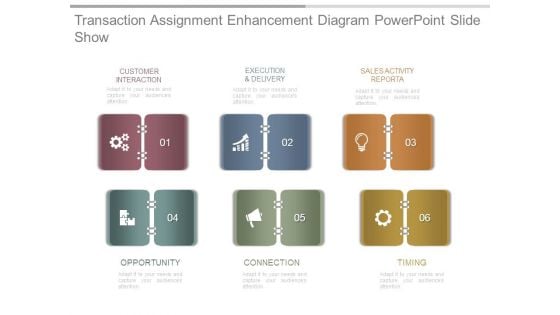
Transaction Assignment Enhancement Diagram Powerpoint Slide Show
This is a transaction assignment enhancement diagram powerpoint slide show. This is a six stage process. The stages in this process are customer interaction, execution and delivery, sales activity reporta, opportunity, connection, timing.
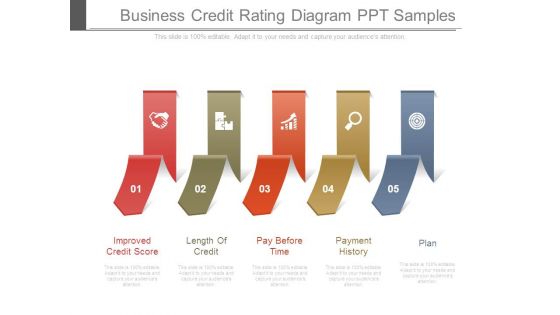
Business Credit Rating Diagram Ppt Samples
This is a business credit rating diagram ppt samples. This is a five stage process. The stages in this process are improved credit score, length of credit, pay before time, payment history, plan.
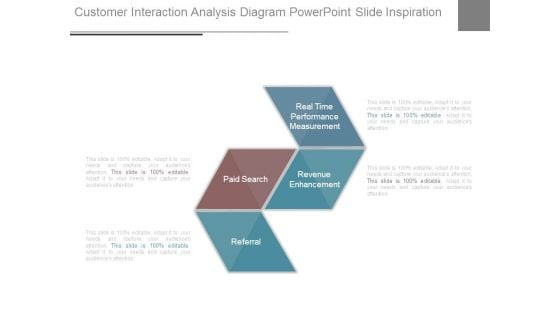
Customer Interaction Analysis Diagram Powerpoint Slide Inspiration
This is a customer interaction analysis diagram powerpoint slide inspiration. This is a four stage process. The stages in this process are referral, paid search, revenue enhancement, real time performance measurement.
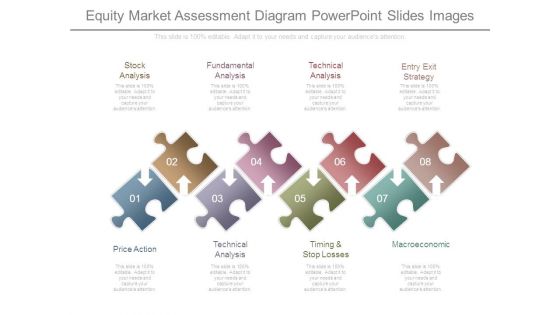
Equity Market Assessment Diagram Powerpoint Slides Images
This is a equity market assessment diagram powerpoint slides images. This is a eight stage process. The stages in this process are stock analysis, fundamental analysis, technical analysis, entry exit strategy, macroeconomic, timing and stop losses, technical analysis, price action.
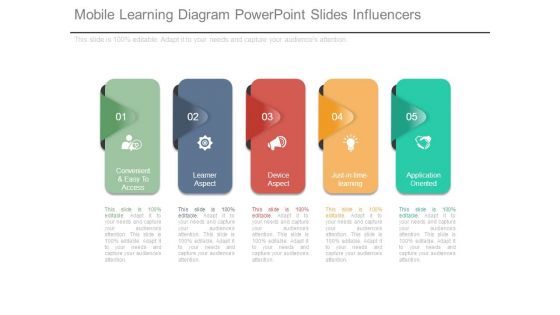
Mobile Learning Diagram Powerpoint Slides Influencers
This is a mobile learning diagram powerpoint slides influencers. This is a five stage process. The stages in this process are convenient and easy to access, learner aspect, device aspect, just in time learning, application oriented.
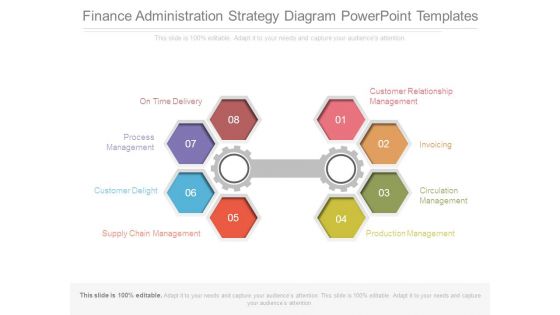
Finance Administration Strategy Diagram Powerpoint Templates
This is a finance administration strategy diagram powerpoint templates. This is a eight stage process. The stages in this process are on time delivery, process management, customer delight, supply chain management, production management, circulation management, invoicing, customer relationship management.

Retailing Example Diagram Powerpoint Slide Background Image
This is a retailing example diagram powerpoint slide background image. This is a two stage process. The stages in this process are internet, channel, time, stock room, store, sever, geography.
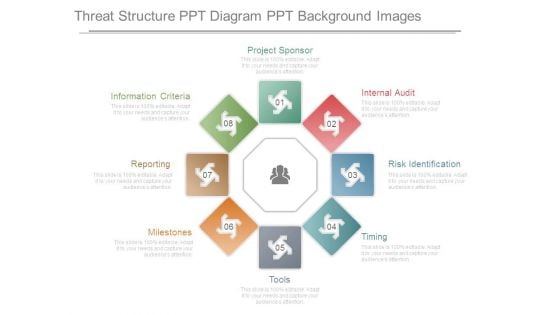
Threat Structure Ppt Diagram Ppt Background Images
This is a threat structure ppt diagram ppt background images. This is a eight stage process. The stages in this process are project sponsor, internal audit, risk identification, timing, tools, milestones, reporting, information criteria.

Cms Web Development Process Diagram Powerpoint Images
This is a cms web development process diagram powerpoint images. This is a seven stage process. The stages in this process are cms, services, simplified content management, save time and efforts, reduce maintenance cost, complete control, catalogue, projects.


 Continue with Email

 Home
Home


