Company Snapshot
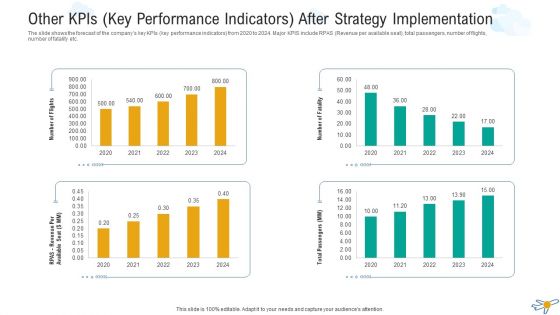
Other Kpis Key Performance Indicators After Strategy Implementation Microsoft PDF
The slide shows the forecast of the companys key KPIs key performance indicators from 2020 to 2024. Major KPIS include RPAS Revenue per available seat, total passengers, number of flights, number of fatality etc. Deliver and pitch your topic in the best possible manner with this other kpis key performance indicators after strategy implementation microsoft pdf. Use them to share invaluable insights on other kpis key performance indicators after strategy implementation and impress your audience. This template can be altered and modified as per your expectations. So, grab it now.
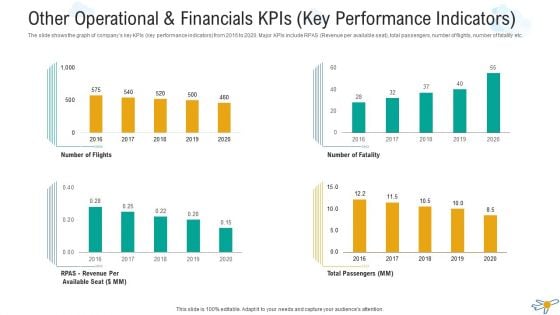
Other Operational And Financials Kpis Key Performance Indicators Professional PDF
The slide shows the graph of companys key KPIs key performance indicators from 2016 to 2020. Major KPIs include RPAS Revenue per available seat, total passengers, number of flights, number of fatality etc. Deliver an awe-inspiring pitch with this creative other operational and financials kpis key performance indicators professional pdf bundle. Topics like other operational and financials kpis key performance indicators can be discussed with this completely editable template. It is available for immediate download depending on the needs and requirements of the user.
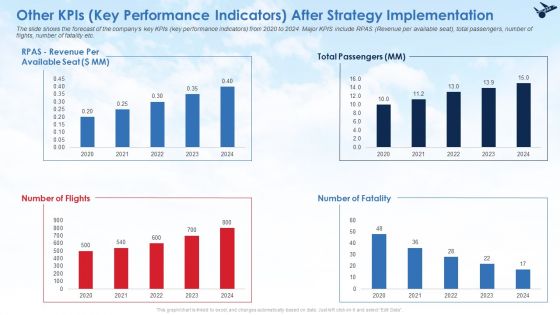
Other Kpis Key Performance Indicators After Strategy Implementation Infographics PDF
The slide shows the forecast of the companys key KPIs key performance indicators from 2020 to 2024. Major KPIS include RPAS Revenue per available seat, total passengers, number of flights, number of fatality etc. Deliver and pitch your topic in the best possible manner with this other kpis key performance indicators after strategy implementation infographics pdf. Use them to share invaluable insights on other kpis key performance indicators after strategy implementation and impress your audience. This template can be altered and modified as per your expectations. So, grab it now.
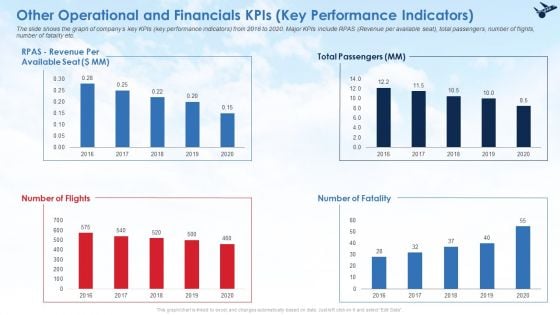
Other Operational And Financials Kpis Key Performance Indicators Ideas PDF
The slide shows the graph of companys key KPIs key performance indicators from 2016 to 2020. Major KPIs include RPAS Revenue per available seat, total passengers, number of flights, number of fatality etc. Deliver an awe inspiring pitch with this creative other operational and financials kpis key performance indicators ideas pdf bundle. Topics like other operational and financials kpis key performance indicators can be discussed with this completely editable template. It is available for immediate download depending on the needs and requirements of the user.
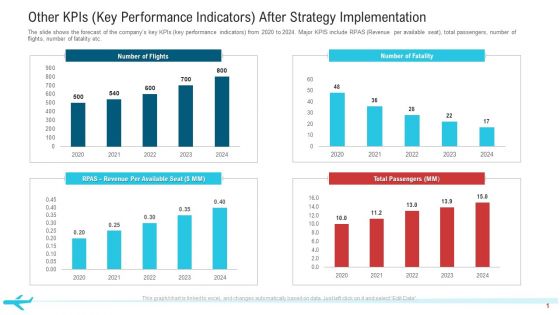
Other Kpis Key Performance Indicators After Strategy Implementation Professional PDF
The slide shows the forecast of the companys key KPIs key performance indicators from 2020 to 2024. Major KPIS include RPAS Revenue per available seat, total passengers, number of flights, number of fatality etc.Deliver and pitch your topic in the best possible manner with this other KPIs key performance indicators after strategy implementation professional pdf. Use them to share invaluable insights on total passengers, number of flights, 2020 to 2024 and impress your audience. This template can be altered and modified as per your expectations. So, grab it now.
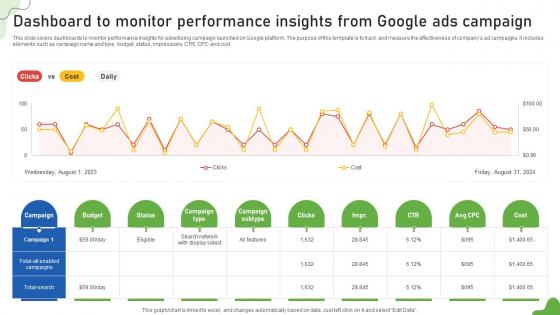
Google Ads Categories Dashboard To Monitor Performance Insights From Google Ads MKT SS V
This slide covers dashboards to monitor performance insights for advertising campaign launched on Google platform. The purpose of this template is to track and measure the effectiveness of companys ad campaigns. It includes elements such as campaign name and type, budget, status, impressions, CTR, CPC and cost. The best PPT templates are a great way to save time, energy, and resources. Slidegeeks have 100 percent editable powerpoint slides making them incredibly versatile. With these quality presentation templates, you can create a captivating and memorable presentation by combining visually appealing slides and effectively communicating your message. Download Google Ads Categories Dashboard To Monitor Performance Insights From Google Ads MKT SS V from Slidegeeks and deliver a wonderful presentation. This slide covers dashboards to monitor performance insights for advertising campaign launched on Google platform. The purpose of this template is to track and measure the effectiveness of companys ad campaigns. It includes elements such as campaign name and type, budget, status, impressions, CTR, CPC and cost.
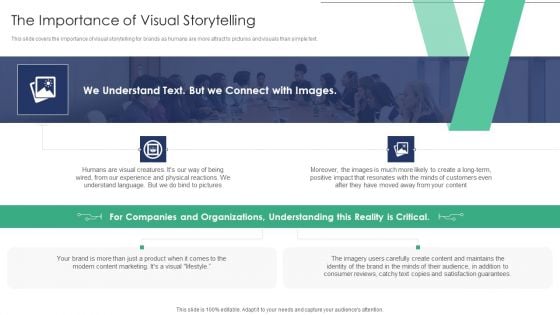
Online Asset Management The Importance Of Visual Storytelling Portrait PDF
This slide covers the importance of visual storytelling for brands as humans are more attract to pictures and visuals than simple text.Deliver and pitch your topic in the best possible manner with this Online Asset Management The Importance Of Visual Storytelling Portrait PDF Use them to share invaluable insights on Companies Organizations, Understanding Reality, Consumer Reviews and impress your audience. This template can be altered and modified as per your expectations. So, grab it now.
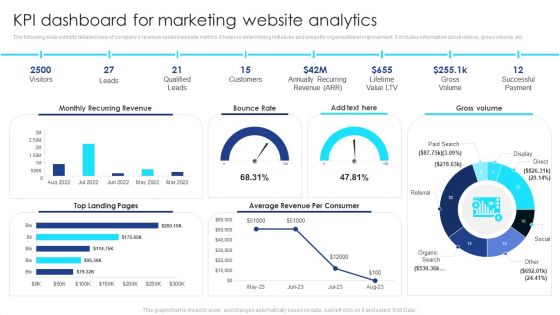
KPI Dashboard For Marketing Website Analytics Summary PDF
The following slide exhibits detailed view of companys revenue-related website metrics. It helps in determining initiatives and areas for organisational improvement. It includes information about visitors, gross volume, etc. Pitch your topic with ease and precision using this KPI Dashboard For Marketing Website Analytics Summary PDF. This layout presents information on Visitors, Leads, Qualified Leads, Customers, Gross Volume, Successful Payment. It is also available for immediate download and adjustment. So, changes can be made in the color, design, graphics or any other component to create a unique layout.
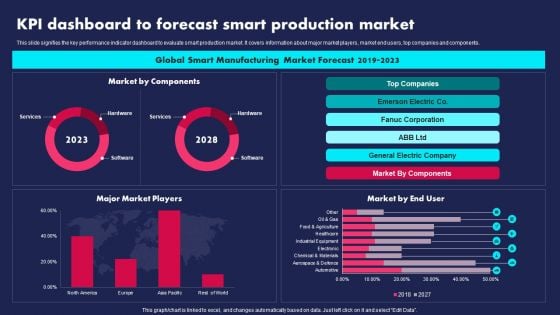
KPI Dashboard To Forecast Smart Production Market Ppt PowerPoint Presentation Gallery Visual Aids PDF
This slide signifies the key performance indicator dashboard to evaluate smart production market. It covers information about major market players, market end users, top companies and components. Pitch your topic with ease and precision using this KPI Dashboard To Forecast Smart Production Market Ppt PowerPoint Presentation Gallery Visual Aids PDF. This layout presents information on Global Smart Manufacturing, Market Forecast, 2019 To 2023. It is also available for immediate download and adjustment. So, changes can be made in the color, design, graphics or any other component to create a unique layout.
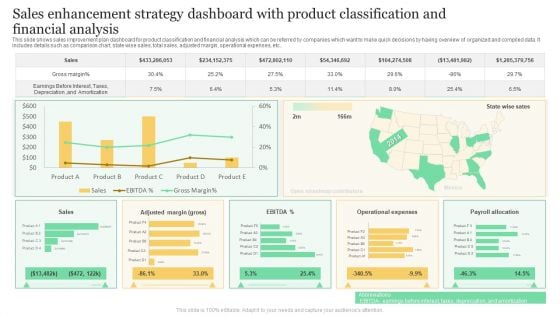
Sales Enhancement Strategy Dashboard With Product Classification And Financial Analysis Formats PDF
This slide shows sales improvement plan dashboard for product classification and financial analysis which can be referred by companies which want to make quick decisions by having overview of organized and compiled data. It includes details such as comparison chart, state wise sales, total sales, adjusted margin, operational expenses, etc. Showcasing this set of slides titled Sales Enhancement Strategy Dashboard With Product Classification And Financial Analysis Formats PDF. The topics addressed in these templates are Gross Margin, Sales, Operational Expenses. All the content presented in this PPT design is completely editable. Download it and make adjustments in color, background, font etc. as per your unique business setting.
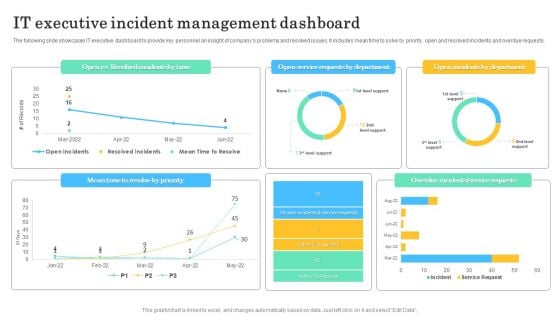
IT Executive Incident Management Dashboard Microsoft PDF
The following slide showcases IT executive dashboard to provide key personnel an insight of companys problems and resolved issues. It includes mean time to solve by priority, open and resolved incidents and overdue requests. Pitch your topic with ease and precision using this IT Executive Incident Management Dashboard Microsoft PDF. This layout presents information on IT Executive Incident, Management Dashboard. It is also available for immediate download and adjustment. So, changes can be made in the color, design, graphics or any other component to create a unique layout.
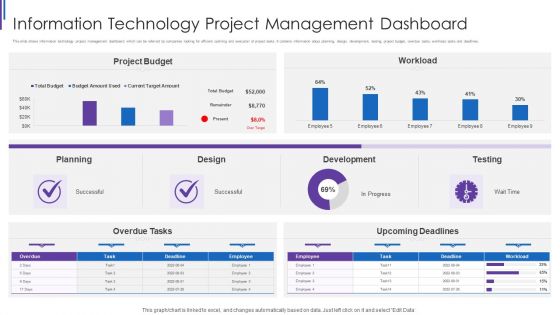
Information Technology Project Management Dashboard Formats PDF
This slide shows information technology project management dashboard which can be referred by companies looking for efficient outlining and execution of project tasks. It contains information about planning, design, development, testing, project budget, overdue tasks, workload, tasks and deadlines. Showcasing this set of slides titled Information Technology Project Management Dashboard Formats PDF. The topics addressed in these templates are Project Budget Workload, Planning Design Development, Upcoming Deadlines Testing. All the content presented in this PPT design is completely editable. Download it and make adjustments in color, background, font etc. as per your unique business setting.
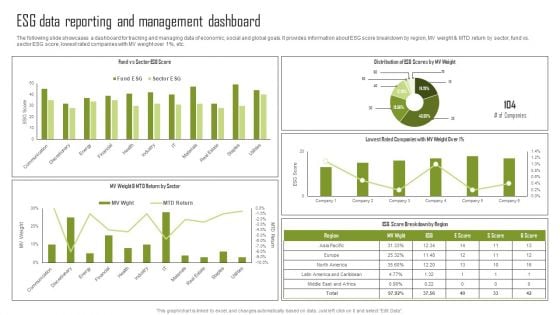
ESG Data Reporting And Management Dashboard Download PDF
The following slide showcases a dashboard for tracking and managing data of economic, social and global goals. It provides information about ESG score breakdown by region, MV weight and MTD return by sector, fund vs. sector ESG score, lowest rated companies with MV weight over 1 percent, etc. Formulating a presentation can take up a lot of effort and time, so the content and message should always be the primary focus. The visuals of the PowerPoint can enhance the presenters message, so our ESG Data Reporting And Management Dashboard Download PDF was created to help save time. Instead of worrying about the design, the presenter can concentrate on the message while our designers work on creating the ideal templates for whatever situation is needed. Slidegeeks has experts for everything from amazing designs to valuable content, we have put everything into ESG Data Reporting And Management Dashboard Download PDF.
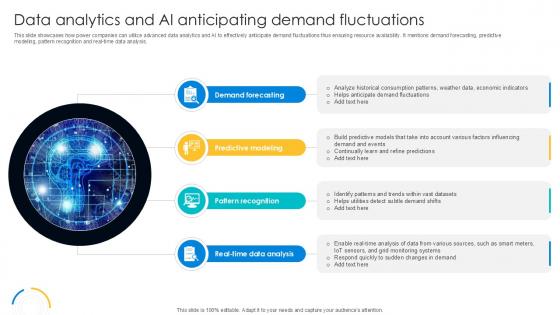
Data Analytics And AI Anticipating Digital Transformation Journey PPT Example DT SS V
This slide showcases how power companies can utilize advanced data analytics and AI to effectively anticipate demand fluctuations thus ensuring resource availability. It mentions demand forecasting, predictive modeling, pattern recognition and real-time data analysis. Formulating a presentation can take up a lot of effort and time, so the content and message should always be the primary focus. The visuals of the PowerPoint can enhance the presenters message, so our Data Analytics And AI Anticipating Digital Transformation Journey PPT Example DT SS V was created to help save time. Instead of worrying about the design, the presenter can concentrate on the message while our designers work on creating the ideal templates for whatever situation is needed. Slidegeeks has experts for everything from amazing designs to valuable content, we have put everything into Data Analytics And AI Anticipating Digital Transformation Journey PPT Example DT SS V This slide showcases how power companies can utilize advanced data analytics and AI to effectively anticipate demand fluctuations thus ensuring resource availability. It mentions demand forecasting, predictive modeling, pattern recognition and real-time data analysis.
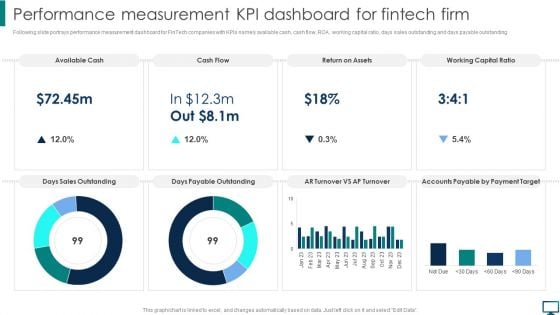
Performance Measurement KPI Dashboard For Fintech Firm Topics PDF
Following slide portrays performance measurement dashboard for FinTech companies with KPIs namely available cash, cash flow, ROA, working capital ratio, days sales outstanding and days payable outstanding. Create an editable Performance Measurement KPI Dashboard For Fintech Firm Topics PDF that communicates your idea and engages your audience. Whether you are presenting a business or an educational presentation, pre designed presentation templates help save time. Performance Measurement KPI Dashboard For Fintech Firm Topics PDF is highly customizable and very easy to edit, covering many different styles from creative to business presentations. Slidegeeks has creative team members who have crafted amazing templates. So, go and get them without any delay.
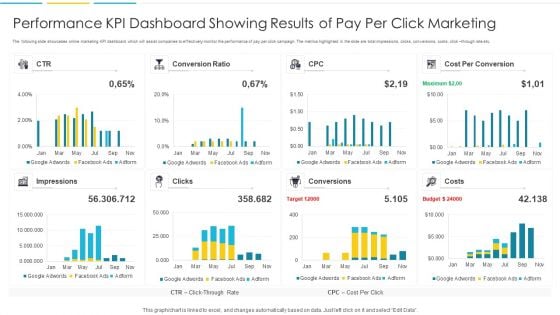
Performance KPI Dashboard Showing Results Of Pay Per Click Marketing Portrait PDF
The following slide showcases online marketing KPI dashboard which will assist companies to effectively monitor the performance of pay per click campaign. The metrics highlighted in the slide are total impressions, clicks, conversions, costs, click through rate etc. Pitch your topic with ease and precision using this Performance KPI Dashboard Showing Results Of Pay Per Click Marketing Portrait PDF. This layout presents information on Impressions, Target, Budget. It is also available for immediate download and adjustment. So, changes can be made in the color, design, graphics or any other component to create a unique layout.
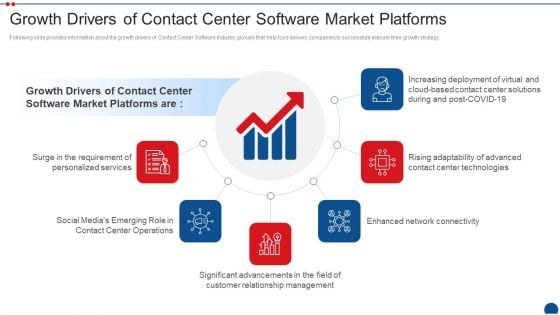
Call Center Application Market Industry Growth Drivers Of Contact Center Software Market Platforms Pictures PDF
Following slide provides information about the growth drivers of Contact Center Software Industry globally that help food delivery companies to successfully execute their growth strategy. This is a call center application market industry growth drivers of contact center software market platforms pictures pdf template with various stages. Focus and dispense information on five stages using this creative set, that comes with editable features. It contains large content boxes to add your information on topics like social media, customer relationship management, enhanced network connectivity, cloud based contact. You can also showcase facts, figures, and other relevant content using this PPT layout. Grab it now.
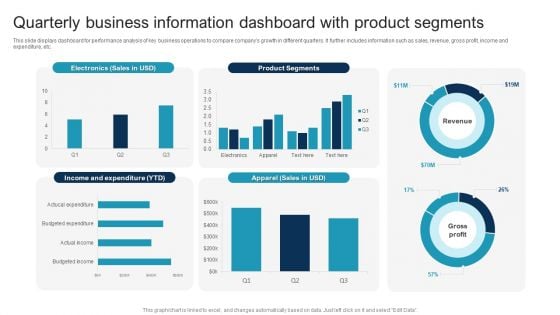
Quarterly Business Information Dashboard With Product Segments Slides PDF
This slide displays dashboard for performance analysis of key business operations to compare companys growth in different quarters. It further includes information such as sales, revenue, gross profit, income and expenditure, etc. Showcasing this set of slides titled Quarterly Business Information Dashboard With Product Segments Slides PDF. The topics addressed in these templates are Quarterly Business Information, Dashboard With Product Segments. All the content presented in this PPT design is completely editable. Download it and make adjustments in color, background, font etc. as per your unique business setting.
Business Operational Expenditure Monitoring Dashboard With Budget Analysis Icons PDF
This slide shows operating expenses OPEX monitoring dashboard with budget analysis assisting companies in evaluating funds useful until end of the year. It visually present the organizations operating expenses by time period and sector. Showcasing this set of slides titled Business Operational Expenditure Monitoring Dashboard With Budget Analysis Icons PDF. The topics addressed in these templates are Business Operational, Budget Analysis, Monitoring Dashboard. All the content presented in this PPT design is completely editable. Download it and make adjustments in color, background, font etc. as per your unique business setting.
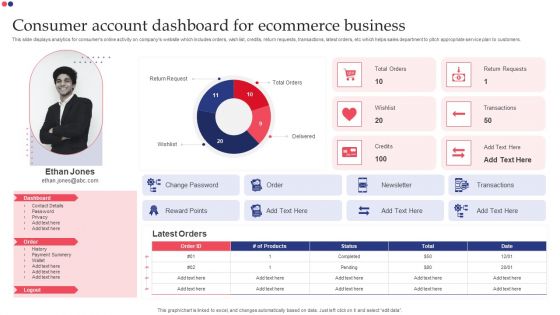
Consumer Account Dashboard For Ecommerce Business Themes PDF
This slide displays analytics for consumers online activity on companys website which includes orders, wish list, credits, return requests, transactions, latest orders, etc which helps sales department to pitch appropriate service plan to customers. Showcasing this set of slides titled Consumer Account Dashboard For Ecommerce Business Themes PDF. The topics addressed in these templates are Dashboard, Return Request, Delivered, Transactions. All the content presented in this PPT design is completely editable. Download it and make adjustments in color, background, font etc. as per your unique business setting.
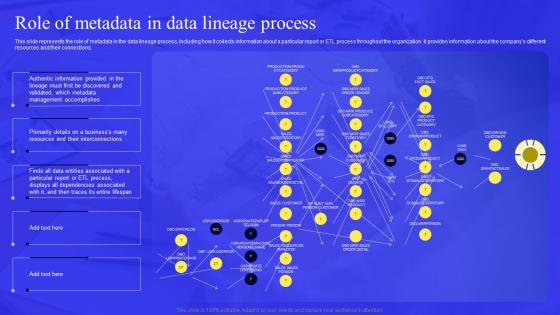
Business Process Data Lineage Role Of Metadata In Data Lineage Process Portrait Pdf
This slide represents the role of metadata in the data lineage process, including how it collects information about a particular report or ETL process throughout the organization. It provides information about the companys different resources and their connections. Do you have an important presentation coming up Are you looking for something that will make your presentation stand out from the rest Look no further than Business Process Data Lineage Role Of Metadata In Data Lineage Process Portrait Pdf. With our professional designs, you can trust that your presentation will pop and make delivering it a smooth process. And with Slidegeeks, you can trust that your presentation will be unique and memorable. So why wait Grab Business Process Data Lineage Role Of Metadata In Data Lineage Process Portrait Pdf today and make your presentation stand out from the rest This slide represents the role of metadata in the data lineage process, including how it collects information about a particular report or ETL process throughout the organization. It provides information about the companys different resources and their connections.

Key Metrics To Measure Success Of Website Marketing Elements PDF
The following slide outlines major metrics through which real estate companies can evaluate website performance. The key performance indicators KPIs highlighted in slide are total visitors, bounce rate, session duration, page views, customer conversion rate, etc. If your project calls for a presentation, then Slidegeeks is your go-to partner because we have professionally designed, easy-to-edit templates that are perfect for any presentation. After downloading, you can easily edit Key Metrics To Measure Success Of Website Marketing Elements PDF and make the changes accordingly. You can rearrange slides or fill them with different images. Check out all the handy templates
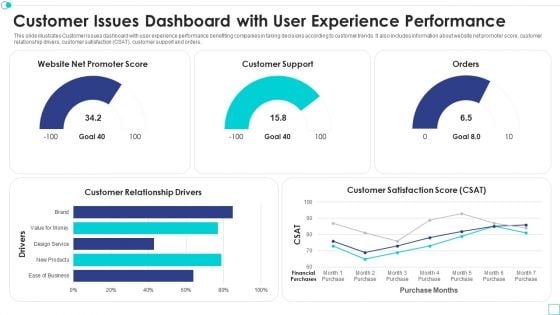
Customer Issues Dashboard With User Experience Performance Graphics PDF
This slide illustrates Customer Issues dashboard with user experience performance benefiting companies in taking decisions according to customer trends. It also includes information about website net promoter score, customer relationship drivers, customer satisfaction CSAT, customer support and orders. Showcasing this set of slides titled customer issues dashboard with user experience performance graphics pdf. The topics addressed in these templates are customer issues dashboard with user experience performance. All the content presented in this PPT design is completely editable. Download it and make adjustments in color, background, font etc. as per your unique business setting.
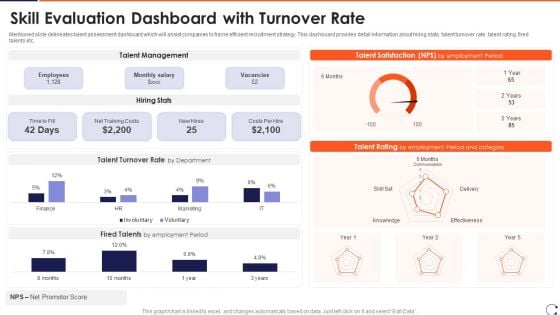
Skill Evaluation Dashboard With Turnover Rate Ideas PDF
Mentioned slide delineates talent assessment dashboard which will assist companies to frame efficient recruitment strategy. This dashboard provides detail information about hiring stats, talent turnover rate, talent rating, fired talents etc.Pitch your topic with ease and precision using this Skill Evaluation Dashboard With Turnover Rate Ideas PDF This layout presents information on Talent Management, Talent Satisfaction, Talent Rating It is also available for immediate download and adjustment. So, changes can be made in the color, design, graphics or any other component to create a unique layout.
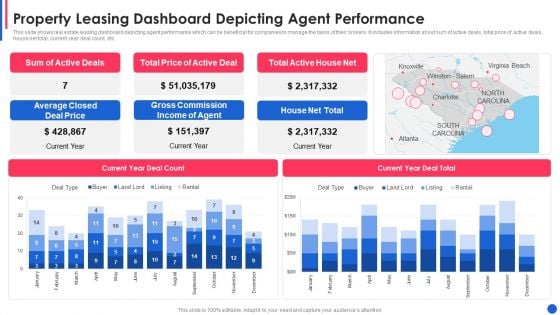
Property Leasing Dashboard Depicting Agent Performance Guidelines PDF
This slide shows real estate leasing dashboard depicting agent performance which can be beneficial for companies to manage the tasks of their brokers. It includes information about sum of active deals, total price of active deals, house net total, current year deal count, etc.Pitch your topic with ease and precision using this property leasing dashboard depicting agent performance guidelines pdf This layout presents information on average closed deal price, gross commission income, total active house net It is also available for immediate download and adjustment. So, changes can be made in the color, design, graphics or any other component to create a unique layout.
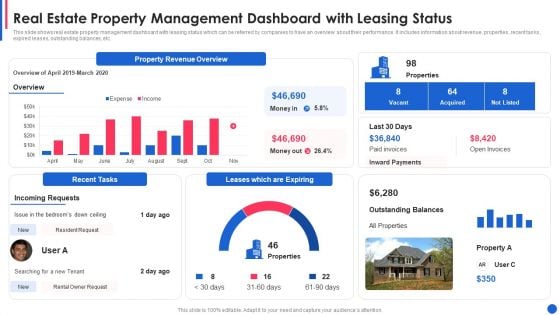
Real Estate Property Management Dashboard With Leasing Status Graphics PDF
This slide shows real estate property management dashboard with leasing status which can be referred by companies to have an overview about their performance. It includes information about revenue, properties, recent tasks, expired leases, outstanding balances, etc.Pitch your topic with ease and precision using this real estate property management dashboard with leasing status graphics pdf This layout presents information on property revenue overview, leases which are expiring, recent tasks It is also available for immediate download and adjustment. So, changes can be made in the color, design, graphics or any other component to create a unique layout.
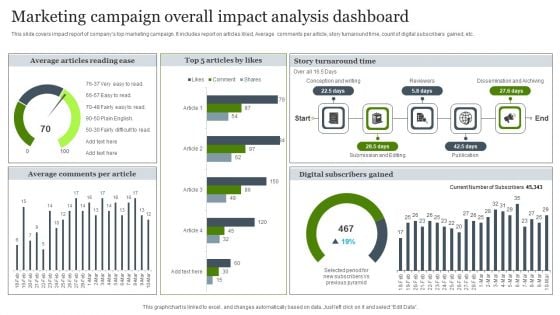
Marketing Campaign Overall Impact Analysis Dashboard Brochure PDF
This slide covers impact report of companys top marketing campaign. It includes report on articles liked, Average comments per article, story turnaround time, count of digital subscribers gained, etc. Pitch your topic with ease and precision using this Marketing Campaign Overall Impact Analysis Dashboard Brochure PDF. This layout presents information on Marketing Campaign, Overall Impact Analysis Dashboard. It is also available for immediate download and adjustment. So, changes can be made in the color, design, graphics or any other component to create a unique layout.
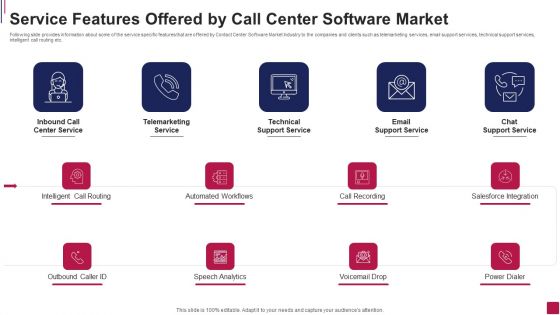
Service Features Offered By Call Center Software Market Sample PDF
Following slide provides information about some of the service specific features that are offered by Contact Center Software Market Industry to the companies and clients such as telemarketing services, email support services, technical support services, intelligent call routing etc.This is a Service Features Offered By Call Center Software Market Sample PDF template with various stages. Focus and dispense information on five stages using this creative set, that comes with editable features. It contains large content boxes to add your information on topics like Telemarketing Service, Technical Support, Email Support You can also showcase facts, figures, and other relevant content using this PPT layout. Grab it now.
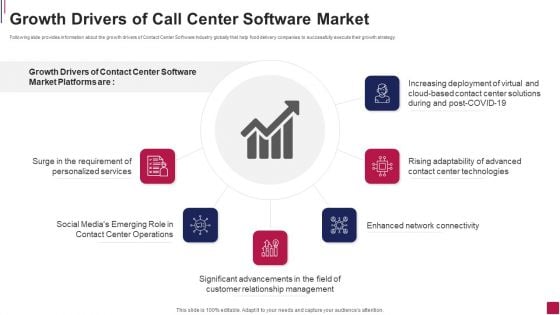
Growth Drivers Of Call Center Software Market Portrait PDF
Following slide provides information about the growth drivers of Contact Center Software Industry globally that help food delivery companies to successfully execute their growth strategy.This is a Growth Drivers Of Call Center Software Market Portrait PDF template with various stages. Focus and dispense information on six stages using this creative set, that comes with editable features. It contains large content boxes to add your information on topics like Growth Drivers, Market Platforms, Center Software You can also showcase facts, figures, and other relevant content using this PPT layout. Grab it now.
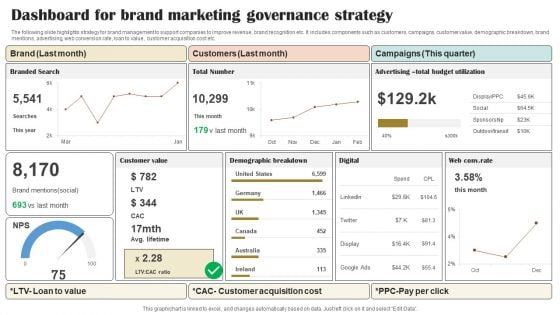
Dashboard For Brand Marketing Governance Strategy Portrait PDF
The following slide highlights strategy for brand management to support companies to improve revenue, brand recognition etc. It includes components such as customers, campaigns, customer value, demographic breakdown, brand mentions, advertising, web conversion rate, loan to value, customer acquisition cost etc. Pitch your topic with ease and precision using this Dashboard For Brand Marketing Governance Strategy Portrait PDF. This layout presents information on Brand, Customers, Campaigns. It is also available for immediate download and adjustment. So, changes can be made in the color, design, graphics or any other component to create a unique layout.
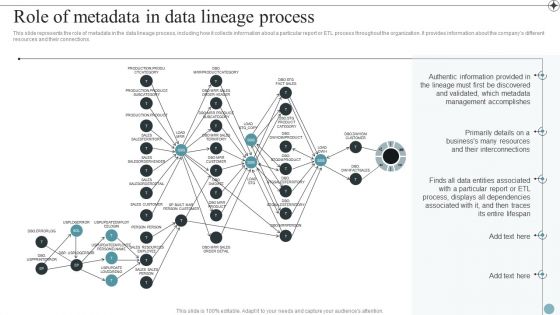
Role Of Metadata In Data Lineage Process Deploying Data Lineage IT Infographics PDF
This slide represents the role of metadata in the data lineage process, including how it collects information about a particular report or ETL process throughout the organization. It provides information about the companys different resources and their connections.From laying roadmaps to briefing everything in detail, our templates are perfect for you. You can set the stage with your presentation slides. All you have to do is download these easy-to-edit and customizable templates. Role Of Metadata In Data Lineage Process Deploying Data Lineage IT Infographics PDF will help you deliver an outstanding performance that everyone would remember and praise you for. Do download this presentation today.
Safety And Health Kpis For Tracking Performance Graph Mockup PDF
This slide represents graph showing key performance indicators tracked by companies for assessment of safety and health performance of their workplace. It includes key metrics such as workforce awareness, safety meetings held, recordable injuries, lost work days, compliance, severity rates etc. Pitch your topic with ease and precision using this Safety And Health Kpis For Tracking Performance Graph Mockup PDF. This layout presents information on Safety And Health, Kpis For Tracking, Performance Graph. It is also available for immediate download and adjustment. So, changes can be made in the color, design, graphics or any other component to create a unique layout.
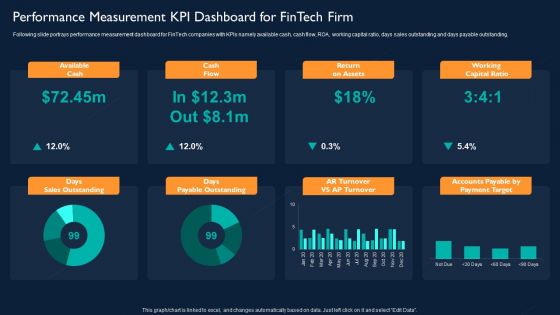
Technology Investment To Enhance Business Growth Performance Measurement KPI Dashboard For Fintech Firm Slides PDF
Following slide portrays performance measurement dashboard for FinTech companies with KPIs namely available cash, cash flow, ROA, working capital ratio, days sales outstanding and days payable outstanding. Deliver an awe inspiring pitch with this creative Technology Investment To Enhance Business Growth Performance Measurement KPI Dashboard For Fintech Firm Slides PDF bundle. Topics like Available Cash, Cash Flow, Return On Assets, Working Capital Ratio can be discussed with this completely editable template. It is available for immediate download depending on the needs and requirements of the user.
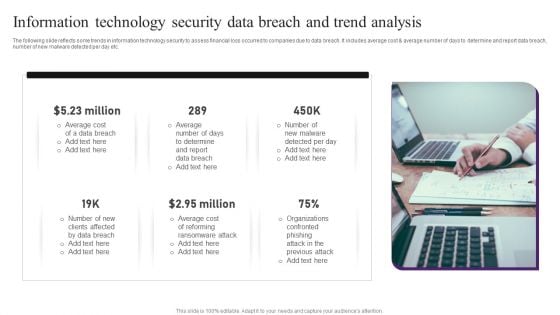
Information Technology Security Data Breach And Trend Analysis Professional PDF
The following slide reflects some trends in information technology security to assess financial loss occurred to companies due to data breach. It includes average cost and average number of days to determine and report data breach, number of new malware detected per day etc. Presenting Information Technology Security Data Breach And Trend Analysis Professional PDF to dispense important information. This template comprises six stages. It also presents valuable insights into the topics including Data Breach, Average Cost, Determine. This is a completely customizable PowerPoint theme that can be put to use immediately. So, download it and address the topic impactfully.
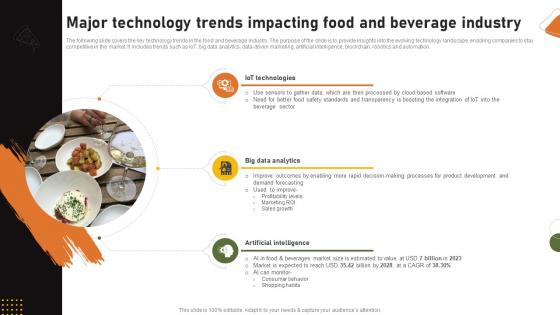
Food And Drink Industry Report Major Technology Trends Impacting Food And Beverage Industry IR SS V
The following slide covers the key technology trends in the food and beverage industry. The purpose of the slide is to provide insights into the evolving technology landscape, enabling companies to stay competitive in the market. It includes trends such as IoT, big data analytics, data-driven marketing, artificial intelligence, blockchain, robotics and automation. Coming up with a presentation necessitates that the majority of the effort goes into the content and the message you intend to convey. The visuals of a PowerPoint presentation can only be effective if it supplements and supports the story that is being told. Keeping this in mind our experts created Food And Drink Industry Report Major Technology Trends Impacting Food And Beverage Industry IR SS V to reduce the time that goes into designing the presentation. This way, you can concentrate on the message while our designers take care of providing you with the right template for the situation. The following slide covers the key technology trends in the food and beverage industry. The purpose of the slide is to provide insights into the evolving technology landscape, enabling companies to stay competitive in the market. It includes trends such as IoT, big data analytics, data-driven marketing, artificial intelligence, blockchain, robotics and automation.
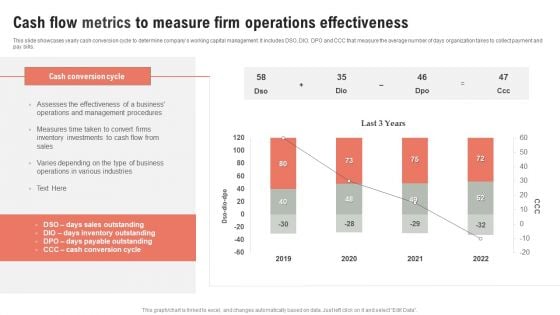
Cash Flow Metrics To Measure Firm Operations Effectiveness Ppt Outline Infographic Template PDF
This slide showcases yearly cash conversion cycle to determine companys working capital management. It includes DSO, DIO, DPO and CCC that measure the average number of days organization takes to collect payment and pay bills. Pitch your topic with ease and precision using this Cash Flow Metrics To Measure Firm Operations Effectiveness Ppt Outline Infographic Template PDF. This layout presents information on Cash Conversion Cycle, 2019 To 2022, Cash Flow. It is also available for immediate download and adjustment. So, changes can be made in the color, design, graphics or any other component to create a unique layout.
Planning Transnational Technique To Improve International Scope Dashboard Tracking Post Expansion Revenue Structure PDF
This slide covers the dashboard for analyzing fast food business sales by location. It includes KPIs such as the companys revenue by location, by type, top 5 expenses by account, top 5 expenses by department, cost of revenue year to date, etc. If your project calls for a presentation, then Slidegeeks is your go to partner because we have professionally designed, easy to edit templates that are perfect for any presentation. After downloading, you can easily edit Planning Transnational Technique To Improve International Scope Dashboard Tracking Post Expansion Revenue Structure PDF and make the changes accordingly. You can rearrange slides or fill them with different images. Check out all the handy templates
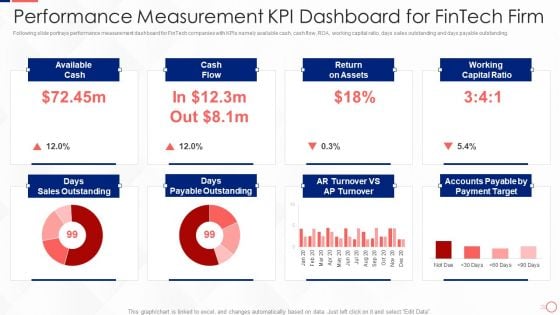
Investing In Tech Innovation Performance Measurement Kpi Dashboard For Fintech Firm Mockup PDF
Following slide portrays performance measurement dashboard for FinTech companies with KPIs namely available cash, cash flow, ROA, working capital ratio, days sales outstanding and days payable outstanding. Deliver and pitch your topic in the best possible manner with this Investing In Tech Innovation Performance Measurement Kpi Dashboard For Fintech Firm Mockup PDF. Use them to share invaluable insights on Available Cash, Cash Flow, Return on Assets, Working Capital Ratio and impress your audience. This template can be altered and modified as per your expectations. So, grab it now.
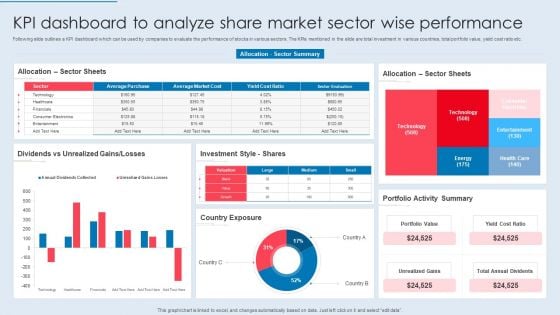
KPI Dashboard To Analyze Share Market Sector Wise Performance Summary PDF
Following slide outlines a KPI dashboard which can be used by companies to evaluate the performance of stocks in various sectors. The KPIs mentioned in the slide are total investment in various countries, total portfolio value, yield cost ratio etc. Pitch your topic with ease and precision using this KPI Dashboard To Analyze Share Market Sector Wise Performance Summary PDF. This layout presents information on Sector Sheets, Dividends Vs Unrealized, Investment Style. It is also available for immediate download and adjustment. So, changes can be made in the color, design, graphics or any other component to create a unique layout.
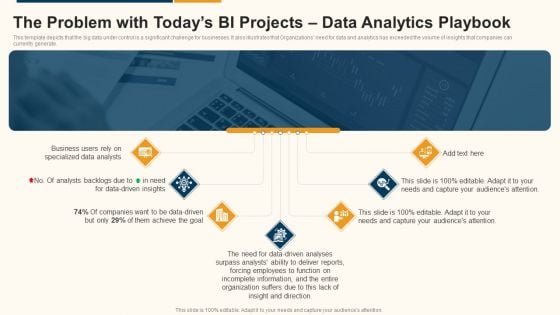
Data Interpretation And Analysis Playbook The Problem With Todays Bi Projects Data Analytics Playbook Introduction PDF
This template depicts that the big data under control is a significant challenge for businesses. It also illustrates that Organizations need for data and analytics has exceeded the volume of insights that companies can currently generate. This is a data interpretation and analysis playbook the problem with todays bi projects data analytics playbook introduction pdf template with various stages. Focus and dispense information on seven stages using this creative set, that comes with editable features. It contains large content boxes to add your information on topics like organization, analysts, business, data driven. You can also showcase facts, figures, and other relevant content using this PPT layout. Grab it now.
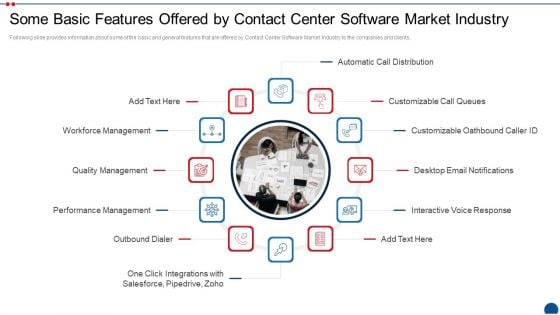
Call Center Application Market Industry Some Basic Features Offered By Contact Center Software Market Industry Template PDF
Following slide provides information about some of the basic and general features that are offered by Contact Center Software Market Industry to the companies and clients. This is a call center application market industry some basic features offered by contact center software market industry template pdf template with various stages. Focus and dispense information on twelve stages using this creative set, that comes with editable features. It contains large content boxes to add your information on topics like automatic call distribution, customizable call queues, workforce management, quality management, performance management. You can also showcase facts, figures, and other relevant content using this PPT layout. Grab it now.
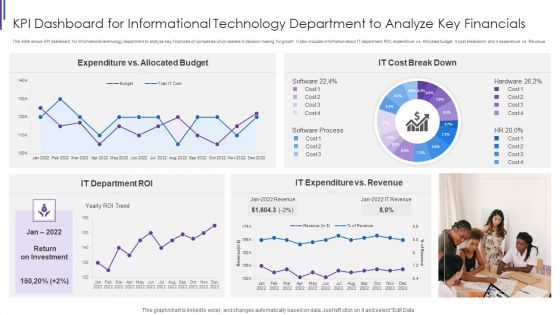
KPI Dashboard For Informational Technology Department To Analyze Key Financials Structure PDF
This slide shows KPI dashboard for informational technology department to analyze key financials of companies which assists in decision making for growth. It also includes information about IT department ROI, expenditure vs. Allocated budget, it cost breakdown and it expenditure vs. Revenue. Pitch your topic with ease and precision using this KPI Dashboard For Informational Technology Department To Analyze Key Financials Structure PDF. This layout presents information on Expenditure Vs Allocated, Budget IT Cost, Break Down IT, Expenditure Vs Revenue, IT Department ROI. It is also available for immediate download and adjustment. So, changes can be made in the color, design, graphics or any other component to create a unique layout.
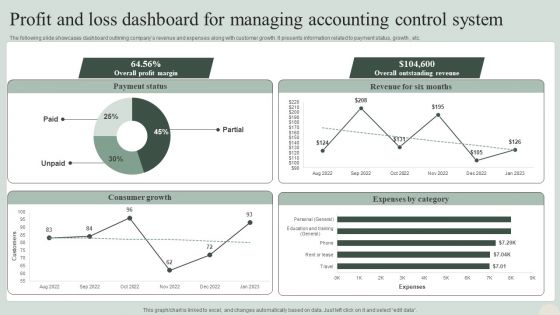
Profit And Loss Dashboard For Managing Accounting Control System Information PDF
The following slide showcases dashboard outlining companys revenue and expenses along with customer growth. It presents information related to payment status, growth , etc. Pitch your topic with ease and precision using this Profit And Loss Dashboard For Managing Accounting Control System Information PDF. This layout presents information on Consumer Growth, Expenses By Category, Overall Outstanding Revenue. It is also available for immediate download and adjustment. So, changes can be made in the color, design, graphics or any other component to create a unique layout.
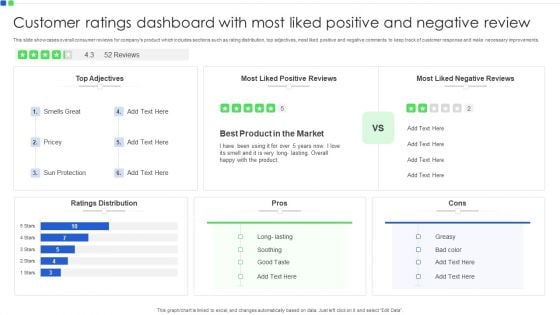
Customer Ratings Dashboard With Most Liked Positive And Negative Review Formats PDF
This slide showcases overall consumer reviews for companys product which includes sections such as rating distribution, top adjectives, most liked positive and negative comments to keep track of customer response and make necessary improvements. Showcasing this set of slides titled Customer Ratings Dashboard With Most Liked Positive And Negative Review Formats PDF. The topics addressed in these templates are Smells Great, Sun Protection, Soothing. All the content presented in this PPT design is completely editable. Download it and make adjustments in color, background, font etc. as per your unique business setting.
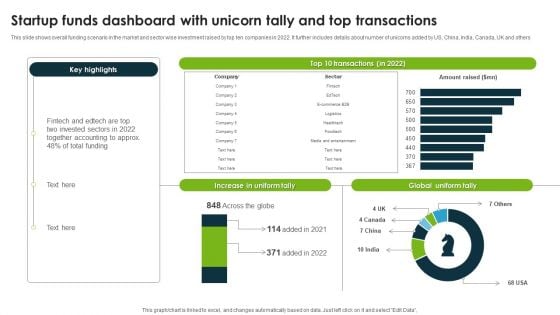
Startup Funds Dashboard With Unicorn Tally And Top Transactions Graphics PDF
This slide shows overall funding scenario in the market and sector wise investment raised by top ten companies in 2022. It further includes details about number of unicorns added by US, China, India, Canada, UK and others. Showcasing this set of slides titled Startup Funds Dashboard With Unicorn Tally And Top Transactions Graphics PDF. The topics addressed in these templates are Invested Sectors, Global Uniform Tally, Increase In Uniform Tally. All the content presented in this PPT design is completely editable. Download it and make adjustments in color, background, font etc. as per your unique business setting.
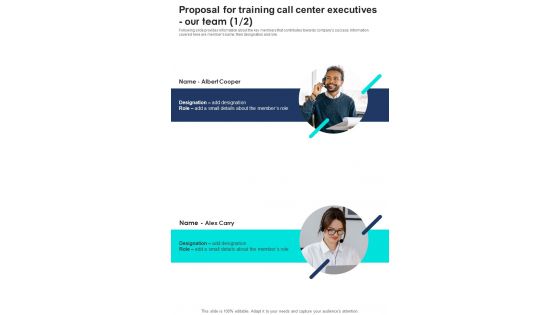
Proposal For Training Call Center Executives Our Team One Pager Sample Example Document
Following slide provides information about the key members that contributes towards companys success. Information covered here are members name, their designation and role. Presenting you an exemplary Proposal For Training Call Center Executives Our Team One Pager Sample Example Document. Our one pager comprises all the must have essentials of an inclusive document. You can edit it with ease, as its layout is completely editable. With such freedom, you can tweak its design and other elements to your requirements. Download this Proposal For Training Call Center Executives Our Team One Pager Sample Example Document brilliant piece now.
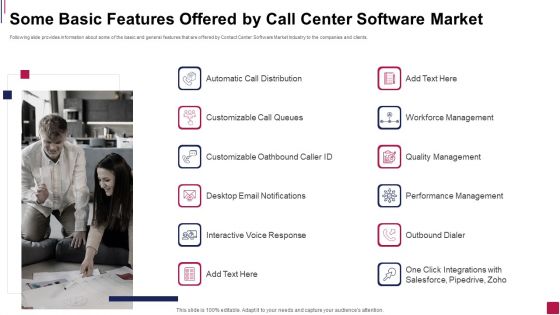
Some Basic Features Offered By Call Center Software Market Guidelines PDF
Following slide provides information about some of the basic and general features that are offered by Contact Center Software Market Industry to the companies and clients. Presenting Some Basic Features Offered By Call Center Software Market Guidelines PDF to provide visual cues and insights. Share and navigate important information on twelve stages that need your due attention. This template can be used to pitch topics like Customizable Queues, Customizable Oathbound, Interactive Response In addtion, this PPT design contains high resolution images, graphics, etc, that are easily editable and available for immediate download.
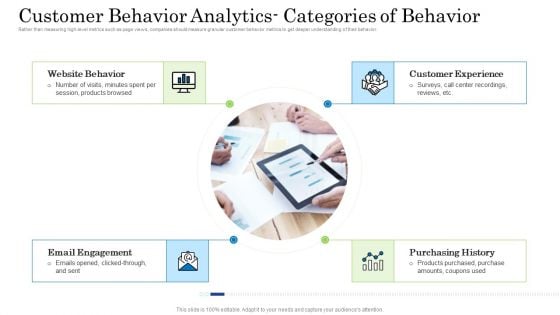
Customer Behavioral Data And Analytics Customer Behavior Analytics Categories Of Behavior Ideas PDF
Rather than measuring high level metrics such as page views, companies should measure granular customer behavior metrics to get deeper understanding of their behavior. This is a customer behavioral data and analytics customer behavior analytics categories of behavior ideas pdf template with various stages. Focus and dispense information on four stages using this creative set, that comes with editable features. It contains large content boxes to add your information on topics like website behavior, email engagement, customer experience, purchasing history. You can also showcase facts, figures, and other relevant content using this PPT layout. Grab it now.
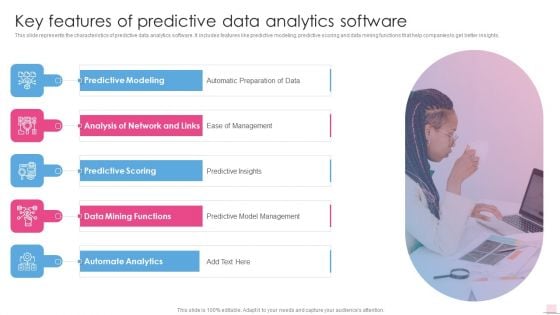
Key Features Of Predictive Data Analytics Software Business Analysis Modification Toolkit Graphics PDF
This slide represents the characteristics of predictive data analytics software. It includes features like predictive modeling, predictive scoring and data mining functions that help companies to get better insights.Presenting Key Features Of Predictive Data Analytics Software Business Analysis Modification Toolkit Graphics PDF to provide visual cues and insights. Share and navigate important information on five stages that need your due attention. This template can be used to pitch topics like Automate Analytics, Predictive Modeling, Automatic Preparation. In addtion, this PPT design contains high resolution images, graphics, etc, that are easily editable and available for immediate download.
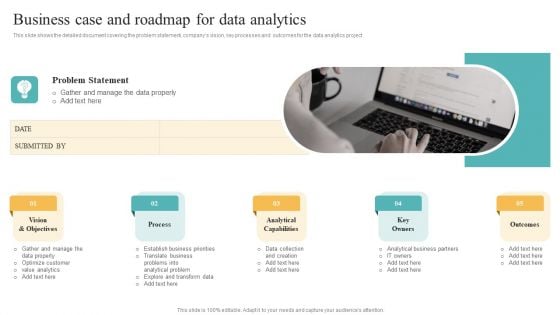
Transformation Toolkit Competitive Intelligence Information Analysis Business Case And Roadmap For Data Analytics Ideas PDF
This slide shows the detailed document covering the problem statement, companys vision, key processes and outcomes for the data analytics project Present like a pro with Transformation Toolkit Competitive Intelligence Information Analysis Business Case And Roadmap For Data Analytics Ideas PDF Create beautiful presentations together with your team, using our easy to use presentation slides. Share your ideas in real time and make changes on the fly by downloading our templates. So whether you are in the office, on the go, or in a remote location, you can stay in sync with your team and present your ideas with confidence. With Slidegeeks presentation got a whole lot easier. Grab these presentations today.
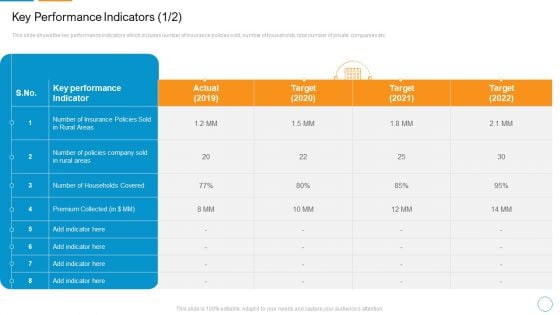
Decreasing Insurance Rate In Countryside Communities Case Competition Key Performance Indicators Target Demonstration PDF
This slide shows the key performance indicators which includes number of insurance policies sold, number of households, total number of private companies etc.Deliver and pitch your topic in the best possible manner with this decreasing insurance rate in countryside communities case competition key performance indicators target demonstration pdf. Use them to share invaluable insights on policies sold in rural areas, premium collected, key performance indicator and impress your audience. This template can be altered and modified as per your expectations. So, grab it now.

Monthly Production And Maintenance Process Internal Corporate Audit Schedule Plan Report Topics PDF
This slide covers month wise companys processes internal audit schedule. It includes inspection report of production, purchasing, data analysis, assembling, suppliers evaluation, quality check inspection , etc. with auditor names. Persuade your audience using this Monthly Production And Maintenance Process Internal Corporate Audit Schedule Plan Report Topics PDF. This PPT design covers one stages, thus making it a great tool to use. It also caters to a variety of topics including Data Analysis, Nonconforming Materials, Production. Download this PPT design now to present a convincing pitch that not only emphasizes the topic but also showcases your presentation skills.
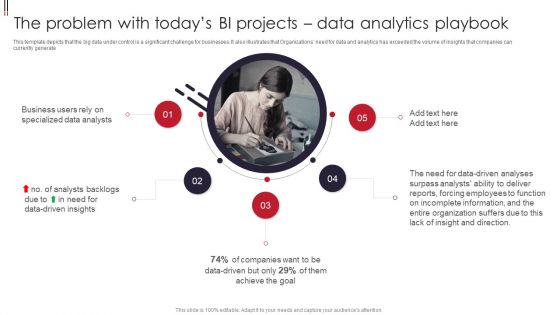
Information Visualizations Playbook The Problem With Todays BI Projects Data Analytics Playbook Portrait PDF
This template depicts that the big data under control is a significant challenge for businesses. It also illustrates that Organizations need for data and analytics has exceeded the volume of insights that companies can currently generate. Presenting Information Visualizations Playbook The Problem With Todays BI Projects Data Analytics Playbook Portrait PDF to provide visual cues and insights. Share and navigate important information on five stages that need your due attention. This template can be used to pitch topics like Business Users, Specialized Data Analysts, Data Driven Insights. In addtion, this PPT design contains high resolution images, graphics, etc, that are easily editable and available for immediate download.

Business Intelligence And Big Key Features Of Predictive Data Analytics Software Microsoft PDF
This slide represents the characteristics of predictive data analytics software. It includes features like predictive modeling, predictive scoring and data mining functions that help companies to get better insights. This is a business intelligence and big key features of predictive data analytics software microsoft pdf template with various stages. Focus and dispense information on five stages using this creative set, that comes with editable features. It contains large content boxes to add your information on topics like analysis network and links, data mining functions, predictive modeling, predictive scoring, automate analytics. You can also showcase facts, figures, and other relevant content using this PPT layout. Grab it now.
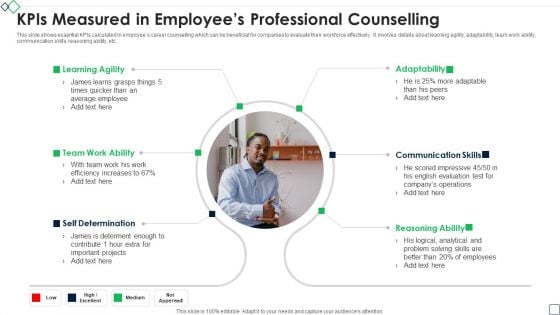
Kpis Measured In Employees Professional Counselling Pictures PDF
This slide shows essential KPIs calculated in employees career counselling which can be beneficial for companies to evaluate their workforce effectively. It involves details about learning agility, adaptability, team work ability, communication skills, reasoning ability, etc. Presenting Kpis Measured In Employees Professional Counselling Pictures PDF to dispense important information. This template comprises six stages. It also presents valuable insights into the topics including Learning Agility, Team Work Ability, Self Determination. This is a completely customizable PowerPoint theme that can be put to use immediately. So, download it and address the topic impactfully.
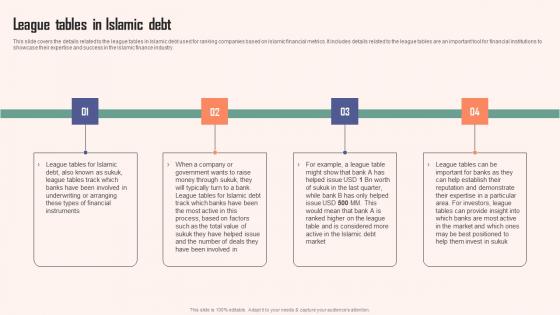
League Tables In Islamic Debt Comprehensive Guide Islamic Pictures PDF
This slide covers the details related to the league tables in Islamic debt used for ranking companies based on Islamic financial metrics. It includes details related to the league tables are an important tool for financial institutions to showcase their expertise and success in the Islamic finance industry. Want to ace your presentation in front of a live audience Our League Tables In Islamic Debt Comprehensive Guide Islamic Pictures PDF can help you do that by engaging all the users towards you. Slidegeeks experts have put their efforts and expertise into creating these impeccable powerpoint presentations so that you can communicate your ideas clearly. Moreover, all the templates are customizable, and easy-to-edit and downloadable. Use these for both personal and commercial use. This slide covers the details related to the league tables in Islamic debt used for ranking companies based on Islamic financial metrics. It includes details related to the league tables are an important tool for financial institutions to showcase their expertise and success in the Islamic finance industry.
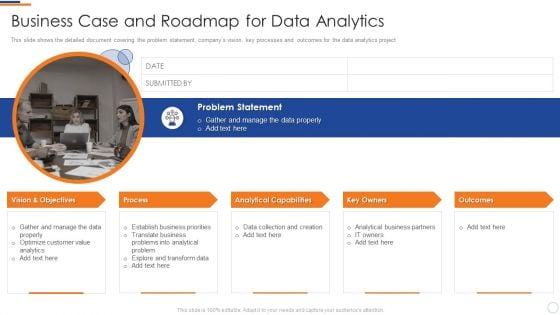
Business Intelligence And Big Data Analytics Business Case And Roadmap For Data Analytics Designs PDF
This slide shows the detailed document covering the problem statement, companys vision, key processes and outcomes for the data analytics project. Presenting business intelligence and big data analytics business case and roadmap for data analytics designs pdf to provide visual cues and insights. Share and navigate important information on one stages that need your due attention. This template can be used to pitch topics like problem statement, vision and objectives, process, analytical capabilities, key owners. In addtion, this PPT design contains high resolution images, graphics, etc, that are easily editable and available for immediate download.
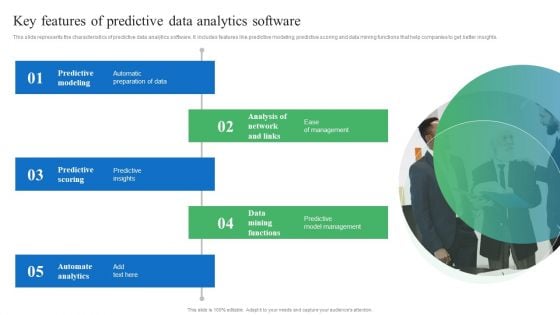
Toolkit For Data Science And Analytics Transition Key Features Of Predictive Data Analytics Software Ideas PDF
This slide represents the characteristics of predictive data analytics software. It includes features like predictive modeling, predictive scoring and data mining functions that help companies to get better insights. If your project calls for a presentation, then Slidegeeks is your go to partner because we have professionally designed, easy to edit templates that are perfect for any presentation. After downloading, you can easily edit Toolkit For Data Science And Analytics Transition Key Features Of Predictive Data Analytics Software Ideas PDF and make the changes accordingly. You can rearrange slides or fill them with different images. Check out all the handy templates.
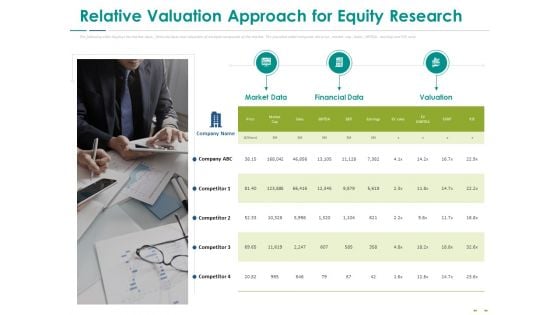
Stock Market Research Report Relative Valuation Approach For Equity Research Inspiration PDF
The following slide displays the market data, financial data and valuation of multiple companies of the market. The provided table compares the price, market cap, Sales, EBITDA, earning and P or E ratio. Presenting stock market research report relative valuation approach for equity research inspiration pdf to provide visual cues and insights. Share and navigate important information on one stages that need your due attention. This template can be used to pitch topics like market data, financial data, valuation. In addition, this PPT design contains high-resolution images, graphics, etc, that are easily editable and available for immediate download.
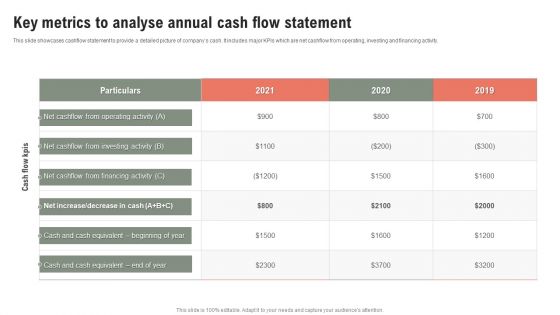
Key Metrics To Analyse Annual Cash Flow Statement Ppt Gallery Microsoft PDF
This slide showcases cashflow statement to provide a detailed picture of companys cash. It includes major KPIs which are net cashflow from operating, investing and financing activity. Pitch your topic with ease and precision using this Key Metrics To Analyse Annual Cash Flow Statement Ppt Gallery Microsoft PDF. This layout presents information on Net Cashflow, 2019 To 2021, Investing Activity. It is also available for immediate download and adjustment. So, changes can be made in the color, design, graphics or any other component to create a unique layout.


 Continue with Email

 Home
Home


