Comparative Analysis
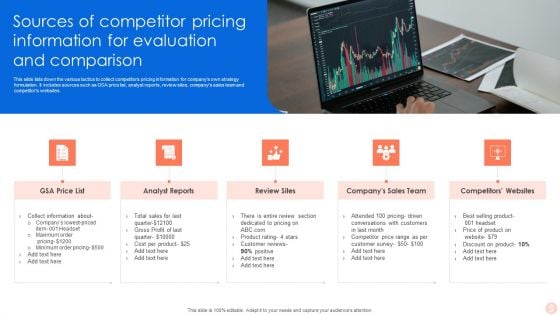
Sources Of Competitor Pricing Information For Evaluation And Comparison Infographics PDF
This slide lists down the various tactics to collect competitors pricing information for companys own strategy formulation. It includes sources such as GSA price list, analyst reports, review sites, companys sales team and competitors websites. Presenting Sources Of Competitor Pricing Information For Evaluation And Comparison Infographics PDF to dispense important information. This template comprises Five stages. It also presents valuable insights into the topics including GSA Price List, Analyst Reports, Review Sites. This is a completely customizable PowerPoint theme that can be put to use immediately. So, download it and address the topic impactfully.
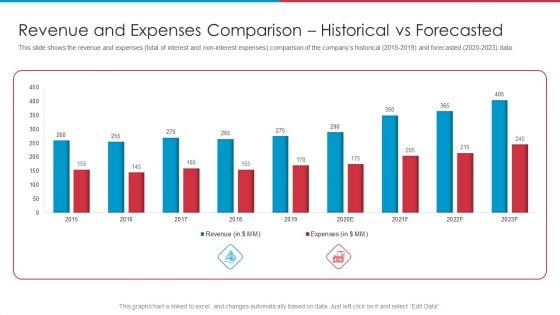
After IPO Equity Revenue And Expenses Comparison Historical Vs Forecasted Slides PDF
This slide shows the revenue and expenses total of interest and non-interest expenses comparison of the companys historical 2015-2019 and forecasted 2020-2023 data. Deliver an awe-inspiring pitch with this creative after ipo equity revenue and expenses comparison historical vs forecasted slides pdf bundle. Topics like revenue and expenses comparison historical vs forecasted can be discussed with this completely editable template. It is available for immediate download depending on the needs and requirements of the user.
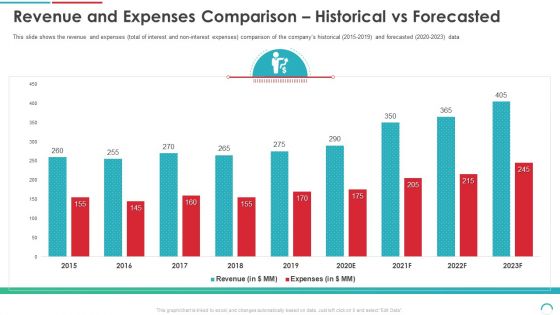
Post Initial Public Offering Equity Financing Pitch Revenue And Expenses Comparison Historical Vs Forecasted Summary PDF
This slide shows the revenue and expenses total of interest and non-interest expenses comparison of the companys historical 2015-2019 and forecasted 2020-2023 data. Deliver an awe inspiring pitch with this creative post initial public offering equity financing pitch revenue and expenses comparison historical vs forecasted summary pdf bundle. Topics like revenue and expenses comparison historical vs forecasted, 2015 to 203 can be discussed with this completely editable template. It is available for immediate download depending on the needs and requirements of the user.
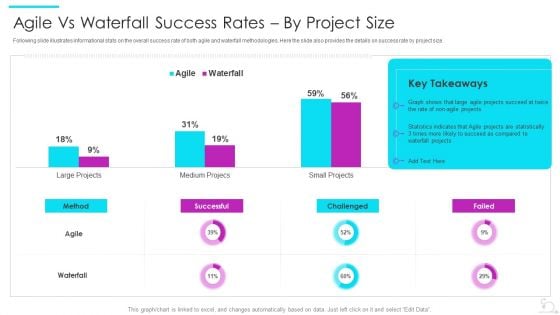
Agile Software Development Lifecycle IT Agile Vs Waterfall Success Rates By Project Size Information PDF
Following slide illustrates informational stats on the overall success rate of both agile and waterfall methodologies. Here the slide also provides the details on success rate by project size.Deliver and pitch your topic in the best possible manner with this agile software development lifecycle it agile vs waterfall success rates by project size information pdf Use them to share invaluable insights on statistics indicates, succeed as compared, projects succeed and impress your audience. This template can be altered and modified as per your expectations. So, grab it now.
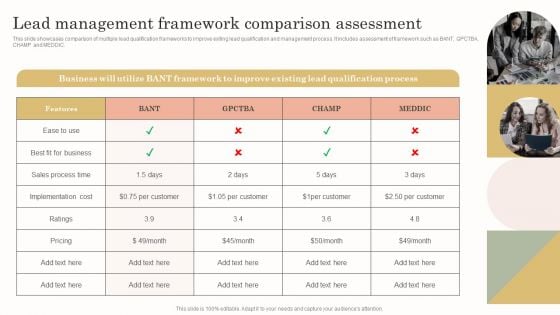
Lead Management Framework Comparison Assessment Demonstration PDF
This slide showcases comparison of multiple lead qualification frameworks to improve exiting lead qualification and management process. It includes assessment of framework such as BANT, GPCTBA, CHAMP and MEDDIC. Whether you have daily or monthly meetings, a brilliant presentation is necessary. Lead Management Framework Comparison Assessment Demonstration PDF can be your best option for delivering a presentation. Represent everything in detail using Lead Management Framework Comparison Assessment Demonstration PDF and make yourself stand out in meetings. The template is versatile and follows a structure that will cater to your requirements. All the templates prepared by Slidegeeks are easy to download and edit. Our research experts have taken care of the corporate themes as well. So, give it a try and see the results.
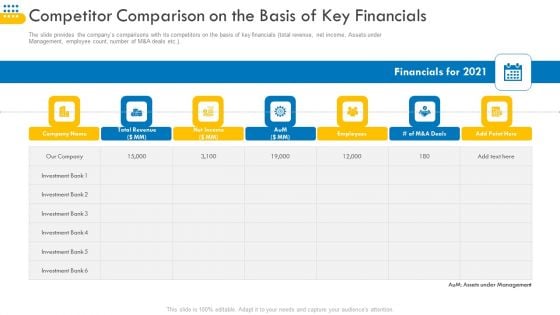
Pitch Deck For Venture Selling Trade Competitor Comparison On The Basis Of Key Financials Elements PDF
Deliver an awe-inspiring pitch with this creative pitch deck for venture selling trade competitor comparison on the basis of key financials elements pdf bundle. Topics like company name, total revenue, net income, employees, our company can be discussed with this completely editable template. It is available for immediate download depending on the needs and requirements of the user.
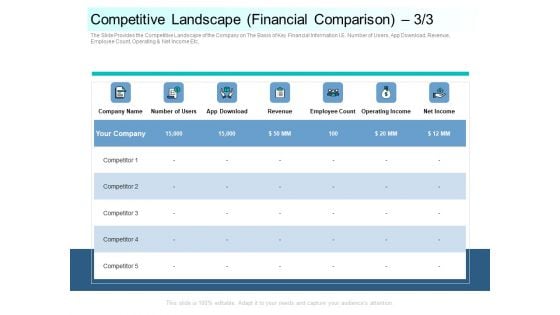
Community Capitalization Pitch Deck Competitive Landscape Financial Comparison Count Graphics Pdf
The Slide Provides the Competitive Landscape of the Company on The Basis of Key Financial Information I.E. Number of Users, App Download, Revenue, Employee Count, Operating Net Income Etc. Deliver an awe inspiring pitch with this creative community capitalization pitch deck competitive landscape financial comparison count graphics pdf bundle. Topics like company, employee count, income, competitive landscape financial comparison can be discussed with this completely editable template. It is available for immediate download depending on the needs and requirements of the user.
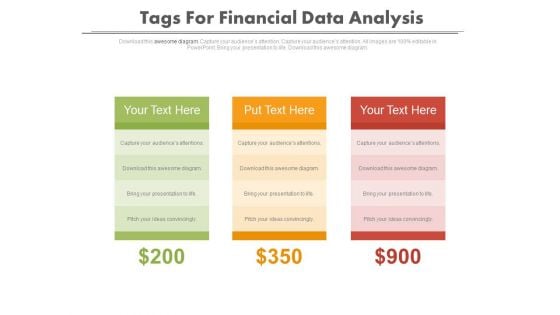
Tags For Financial Data Comparison Powerpoint Slides
Graphic of three text tag with dollar values has been used to design this power point template. This diagram may be used for financial data comparison. Use this diagram to build a professional presentation.
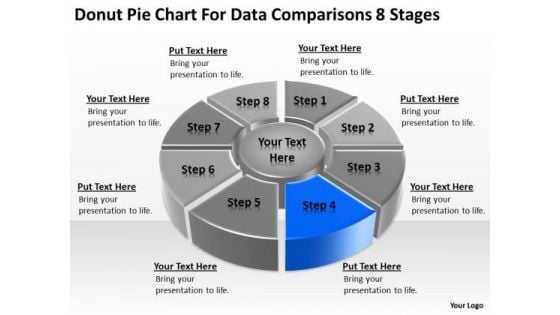
Donut Pie Chart For Data Comparisons 8 Stages Example Business Plan PowerPoint Slides
We present our donut pie chart for data comparisons 8 stages example business plan PowerPoint Slides.Download and present our Success PowerPoint Templates because You are an avid believer in ethical practices. Highlight the benefits that accrue with our PowerPoint Templates and Slides. Download our Finance PowerPoint Templates because You can Channelise the thoughts of your team with our PowerPoint Templates and Slides. Urge them to focus on the goals you have set. Use our Arrows PowerPoint Templates because You should Bet on your luck with our PowerPoint Templates and Slides. Be assured that you will hit the jackpot. Download and present our Circle Charts PowerPoint Templates because You are working at that stage with an air of royalty. Let our PowerPoint Templates and Slides be the jewels in your crown. Download and present our Business PowerPoint Templates because They will Put the wind in your sails. Skim smoothly over the choppy waters of the market.Use these PowerPoint slides for presentations relating to Chart, wheel, pie, graph, vector, process, marketing, diagram, business, catalog, website, network, statistics, model, document, junction, plan, presentation, template, circle, brochure, data, stock, management, box, options, direction, design, company, navigation, financial, structure, button, goals, results. The prominent colors used in the PowerPoint template are Blue, Gray, Black. Every audience enjoys familiar environments. Our Donut Pie Chart For Data Comparisons 8 Stages Example Business Plan PowerPoint Slides bring out a sense of deja vu.
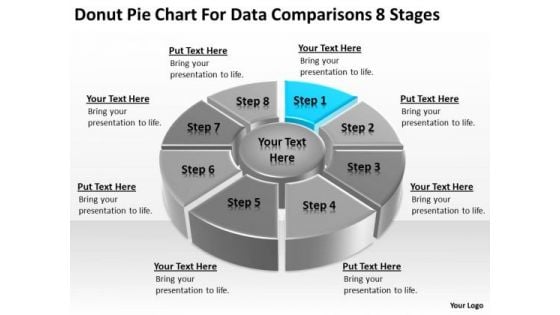
Pie Chart For Data Comparisons 8 Stages People Who Write Business Plans PowerPoint Slides
We present our pie chart for data comparisons 8 stages people who write business plans PowerPoint Slides.Present our Communication PowerPoint Templates because Our PowerPoint Templates and Slides will let Your superior ideas hit the target always and everytime. Download and present our Marketing PowerPoint Templates because Our PowerPoint Templates and Slides team portray an attitude of elegance. Personify this quality by using them regularly. Download and present our Business PowerPoint Templates because It will mark the footprints of your journey. Illustrate how they will lead you to your desired destination. Present our Process and Flows PowerPoint Templates because Our PowerPoint Templates and Slides will fulfill your every need. Use them and effectively satisfy the desires of your audience. Download our Circle Charts PowerPoint Templates because Our PowerPoint Templates and Slides offer you the widest possible range of options.Use these PowerPoint slides for presentations relating to Diagram, Pie, Chart, Process, Network, Statistics, Item, Junction, Corporate, Business, Plan, Vector, Presentation, Template, Circle, Brochure, Data, Report, Marketing, Different, Abstract, Management, Graph, Multicolored, Modern, Four, Illustration, Connection, Options, Strategy, Catalog, Company, Banner, Information, Navigation, Structure, Arrows, Communication. The prominent colors used in the PowerPoint template are Blue, Gray, White. Fashion yourfate with our Pie Chart For Data Comparisons 8 Stages People Who Write Business Plans PowerPoint Slides. Your efforts will achieve their every aim.
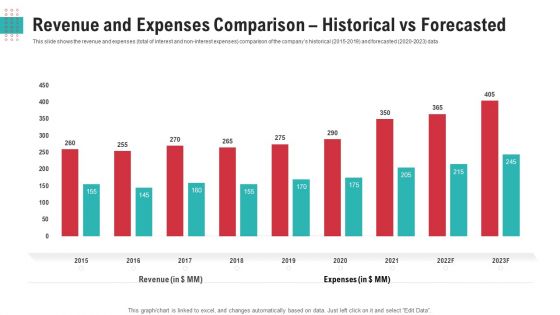
Revenue And Expenses Comparison Historical Vs Forecasted Ppt Show Outfit PDF
This slide shows the revenue and expenses total of interest and non-interest expenses comparison of the companys historical 2015 to 2019 and forecasted 2020 to 2023 data.Deliver an awe-inspiring pitch with this creative revenue and expenses comparison historical vs forecasted ppt show outfit pdf. bundle. Topics like 2015 to 2024, revenue can be discussed with this completely editable template. It is available for immediate download depending on the needs and requirements of the user
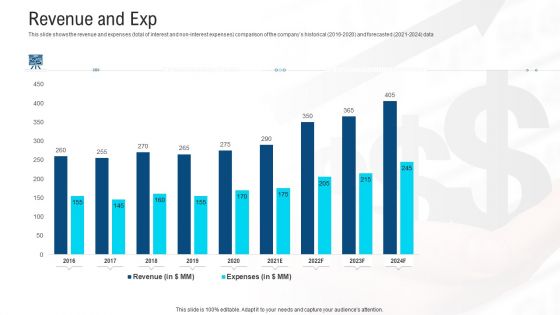
Revenue And Expenses Comparison Historical Vs Forecasted Ppt Show Deck PDF
This slide shows the revenue and expenses total of interest and non interest expenses comparison of the companys historical 2016 to2020 and forecasted 2021 to2024 data.Deliver and pitch your topic in the best possible manner with this revenue and expenses comparison historical vs forecasted ppt show deck pdf. Use them to share invaluable insights on 2015 to 2024, revenue and impress your audience. This template can be altered and modified as per your expectations. So, grab it now.
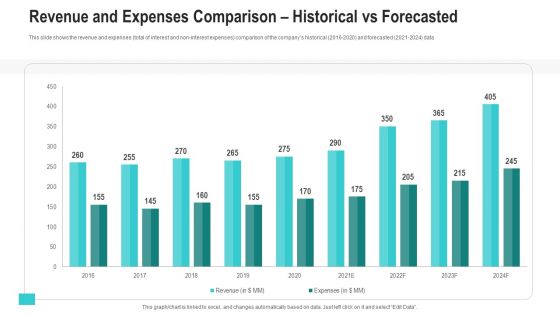
Revenue And Expenses Comparison Historical Vs Forecasted Ppt Show Tips PDF
This slide shows the revenue and expenses total of interest and non-interest expenses comparison of the companys historical 2016-2020 and forecasted 2021-2024 data. Deliver and pitch your topic in the best possible manner with this revenue and expenses comparison historical vs forecasted ppt show tips pdf. Use them to share invaluable insights on revenue, expenses and impress your audience. This template can be altered and modified as per your expectations. So, grab it now.
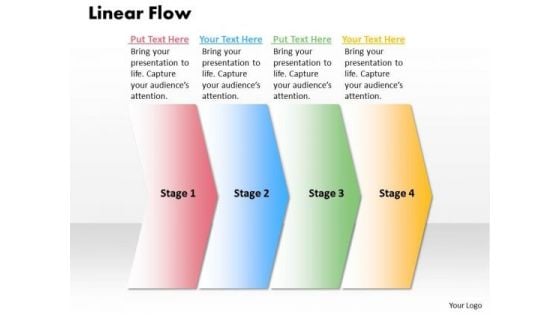
Ppt 4 Phase Diagram Linear Process Flow PowerPoint Template Templates
PPT 4 phase diagram linear process flow powerpoint template Templates-This PowerPoint Diagram shows you Sequential way to prevent losses in Horizontal Line which signifies step by step Execution, inter-related approaches etc. It is shown using colorful arrows arranged in Horizontal manner.-PPT 4 phase diagram linear process flow powerpoint template Templates-Abstract, Advertising, Arrow 3d, Arrow Icon, Arrows, Attractive, Background, Banner, Clean, Compare, Concept, Corporate, Creative, Label, Layout, Texture, Order, Product, Promotion, Sequence, Step, Symbol, Design Give your thoughts the right exposure. Exhibit them with elan on our Ppt 4 Phase Diagram Linear Process Flow PowerPoint Template Templates.
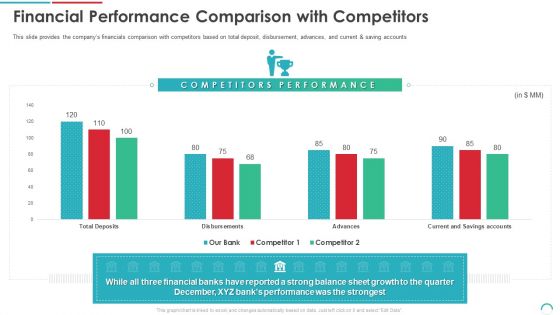
Post Initial Public Offering Equity Financing Pitch Financial Performance Comparison With Competitors Diagrams PDF
This slide provides the companys financials comparison with competitors based on total deposit, disbursement, advances, and current and saving accounts. Deliver an awe inspiring pitch with this creative post initial public offering equity financing pitch financial performance comparison with competitors diagrams pdf bundle. Topics like financial performance comparison with competitors can be discussed with this completely editable template. It is available for immediate download depending on the needs and requirements of the user.
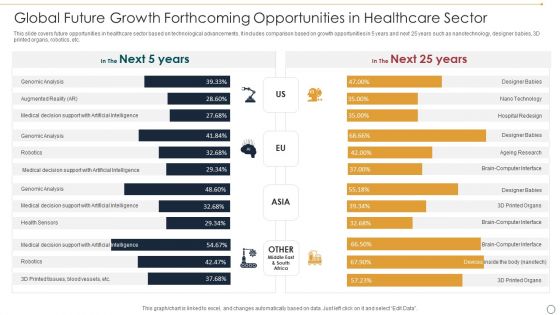
Global Future Growth Forthcoming Opportunities In Healthcare Sector Ppt Pictures Graphic Tips PDF
This slide covers future opportunities in healthcare sector based on technological advancements. It includes comparison based on growth opportunities in 5 years and next 25 years such as nanotechnology, designer babies, 3D printed organs, robotics, etc. Showcasing this set of slides titled Global Future Growth Forthcoming Opportunities In Healthcare Sector Ppt Pictures Graphic Tips PDF. The topics addressed in these templates are Genomic Analysis, Robotics, Health Sensors. All the content presented in this PPT design is completely editable. Download it and make adjustments in color, background, font etc. as per your unique business setting.
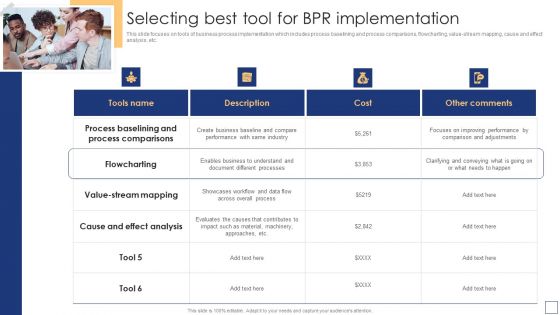
Business Process Redesigning Selecting Best Tool For BPR Implementation Brochure PDF
This slide focuses on tools of business process implementation which includes process baselining and process comparisons, flowcharting, value-stream mapping, cause and effect analysis, etc. This Business Process Redesigning Selecting Best Tool For BPR Implementation Brochure PDF is perfect for any presentation, be it in front of clients or colleagues. It is a versatile and stylish solution for organizing your meetings. The Business Process Redesigning Selecting Best Tool For BPR Implementation Brochure PDF features a modern design for your presentation meetings. The adjustable and customizable slides provide unlimited possibilities for acing up your presentation. Slidegeeks has done all the homework before launching the product for you. So, dont wait, grab the presentation templates today

Mapping User Journey To User Experience Design Ppt Template Strategy SS V
This slide showcases mapping user journey for UX strategy helping companies in identical industries get information about new opportunities. It provides details define, compare, negotiate, select, opportunities, internal ownership, etc.Formulating a presentation can take up a lot of effort and time, so the content and message should always be the primary focus. The visuals of the PowerPoint can enhance the presenters message, so our Mapping User Journey To User Experience Design Ppt Template Strategy SS V was created to help save time. Instead of worrying about the design, the presenter can concentrate on the message while our designers work on creating the ideal templates for whatever situation is needed. Slidegeeks has experts for everything from amazing designs to valuable content, we have put everything into Mapping User Journey To User Experience Design Ppt Template Strategy SS V This slide showcases mapping user journey for UX strategy helping companies in identical industries get information about new opportunities. It provides details define, compare, negotiate, select, opportunities, internal ownership, etc.
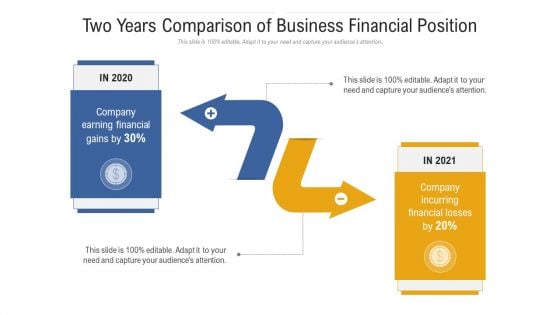
Two Years Comparison Of Business Financial Position Ppt PowerPoint Presentation Model Maker PDF
Presenting two years comparison of business financial position ppt powerpoint presentation model maker pdf to provide visual cues and insights. Share and navigate important information on two stages that need your due attention. This template can be used to pitch topics like company earning financial gains, company incurring financial losses, 2020 to 2021. In addtion, this PPT design contains high resolution images, graphics, etc, that are easily editable and available for immediate download.
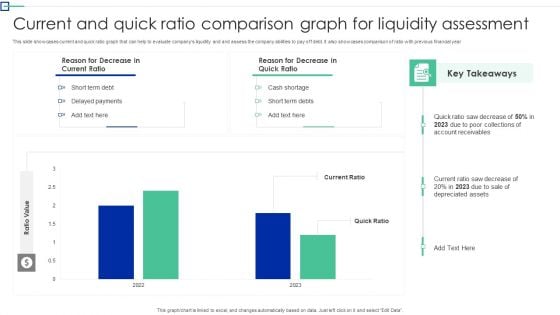
Current And Quick Ratio Comparison Graph For Liquidity Assessment Structure PDF
This slide showcases current and quick ratio graph that can help to evaluate companys liquidity and and assess the company abilities to pay off debt. It also showcases comparison of ratio with previous financial year. Showcasing this set of slides titled Current And Quick Ratio Comparison Graph For Liquidity Assessment Structure PDF. The topics addressed in these templates are Short Term Debt, Delayed Payments, Cash Shortage. All the content presented in this PPT design is completely editable. Download it and make adjustments in color, background, font etc. as per your unique business setting.
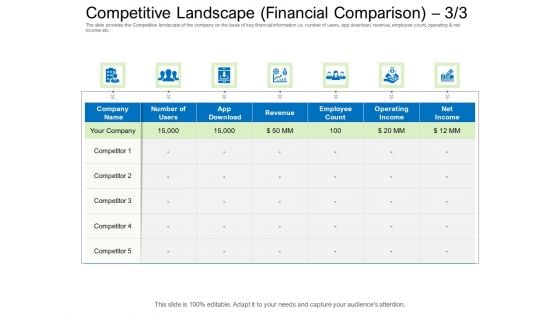
Collective Equity Funding Pitch Deck Competitive Landscape Financial Comparison Operating Infographics PDF
The slide provides the Competitive landscape of the company on the basis of key financial information i.e. number of users, app download, revenue, employee count, operating and net income etc. Deliver an awe-inspiring pitch with this creative collective equity funding pitch deck competitive landscape financial comparison operating infographics pdf. bundle. Topics like competitive landscape financial comparison can be discussed with this completely editable template. It is available for immediate download depending on the needs and requirements of the user.
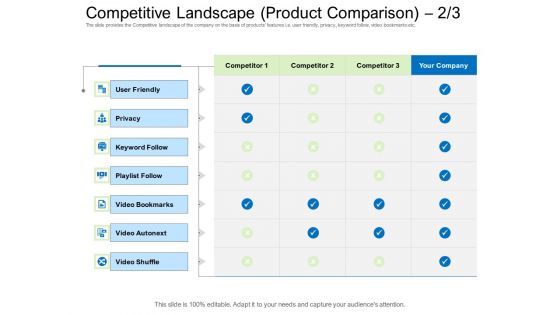
Collective Equity Funding Pitch Deck Competitive Landscape Product Comparison Privacy Formats PDF
The slide provides the Competitive landscape of the company on the basis of products features i.e. user friendly, privacy, keyword follow, video bookmarks etc. Deliver and pitch your topic in the best possible manner with this collective equity funding pitch deck competitive landscape product comparison privacy formats pdf. Use them to share invaluable insights on competitive landscape product comparison and impress your audience. This template can be altered and modified as per your expectations. So, grab it now.
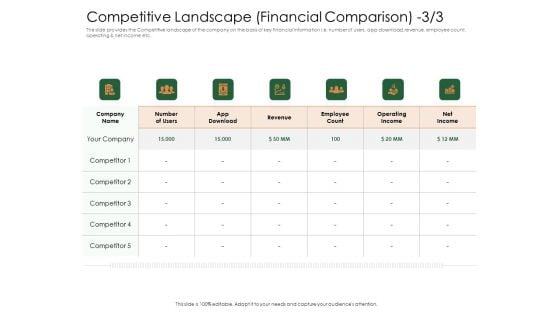
Substitute Financing Pitch Deck Competitive Landscape Financial Comparison Revenue Ideas PDF
The Slide Provides The Competitive Landscape Of The Company On The Basis Of Key Financial Information I.E. Number Of Users, App Download, Revenue, Employee Count, Operating And Net Income Etc. Deliver an awe inspiring pitch with this creative substitute financing pitch deck competitive landscape financial comparison revenue ideas pdf bundle. Topics like competitive landscape financial comparison can be discussed with this completely editable template. It is available for immediate download depending on the needs and requirements of the user.
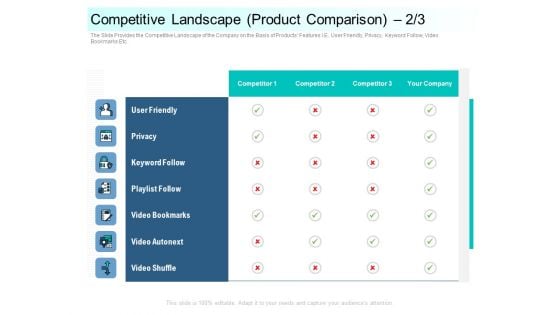
Community Capitalization Pitch Deck Competitive Landscape Product Comparison Privacy Background Pdf
The Slide Provides the Competitive Landscape of the Company on the Basis of Products Features I.E. User Friendly, Privacy, Keyword Follow, Video Bookmarks Etc. Deliver an awe inspiring pitch with this creative community capitalization pitch deck competitive landscape product comparison privacy background pdf bundle. Topics like competitive landscape product comparison can be discussed with this completely editable template. It is available for immediate download depending on the needs and requirements of the user.
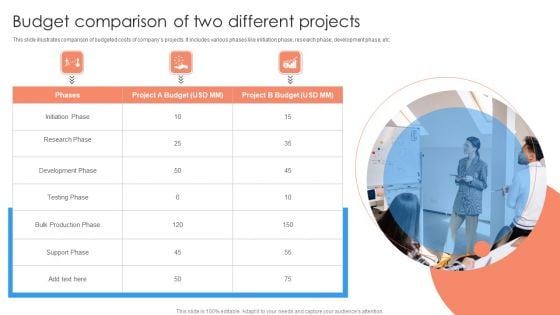
Budget Comparison Of Two Different Projects Ppt PowerPoint Presentation Model PDF
This slide illustrates comparison of budgeted costs of companys projects. It includes various phases like initiation phase, research phase, development phase, etc.Presenting Budget Comparison Of Two Different Projects Ppt PowerPoint Presentation Model PDF to dispense important information. This template comprises one stage. It also presents valuable insights into the topics including Development, Initiation, Testing Phase. This is a completely customizable PowerPoint theme that can be put to use immediately. So, download it and address the topic impactfully.
Competitors Financial Comparison With Income Statement And Balance Sheet Numbers Icons PDF
This slide shows companys Financial Comparison with the competitors based on certain factors like Revenue, EBIT, Net Cash Flows, Total Assets, Working Capital etc. for a specific year Deliver an awe inspiring pitch with this creative competitors financial comparison with income statement and balance sheet numbers icons pdf. bundle. Topics like competitors financial comparison with income statement and balance sheet numbers can be discussed with this completely editable template. It is available for immediate download depending on the needs and requirements of the user.
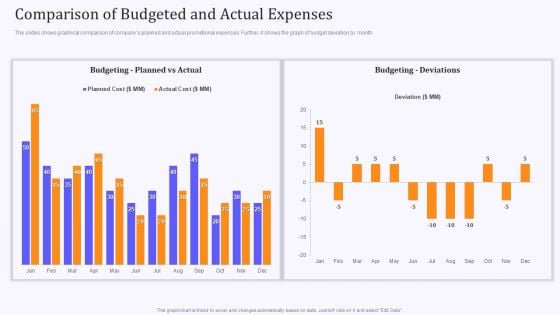
Product Marketing And Awareness Programs Comparison Of Budgeted And Actual Expenses Designs PDF
The slides shows graphical comparison of companys planned and actual promotional expenses. Further, it shows the graph of budget deviation by month. Find highly impressive Product Marketing And Awareness Programs Comparison Of Budgeted And Actual Expenses Designs PDF on Slidegeeks to deliver a meaningful presentation. You can save an ample amount of time using these presentation templates. No need to worry to prepare everything from scratch because Slidegeeks experts have already done a huge research and work for you. You need to download Product Marketing And Awareness Programs Comparison Of Budgeted And Actual Expenses Designs PDF for your upcoming presentation. All the presentation templates are 100 percent editable and you can change the color and personalize the content accordingly. Download now.

Business Segments Revenue Earning Comparison Financial Performance Report Of Software Firm Topics PDF
The following slide shows the comparison of the revenue share by business segments of a software company. It includes services and solutions revenue share for 2019 and 2023 along with key insights. There are so many reasons you need a Business Segments Revenue Earning Comparison Financial Performance Report Of Software Firm Topics PDF. The first reason is you can not spend time making everything from scratch, Thus, Slidegeeks has made presentation templates for you too. You can easily download these templates from our website easily.
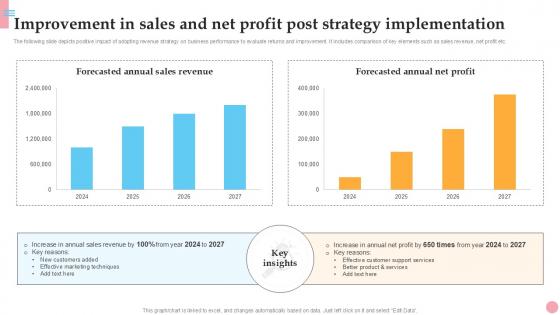
Improvement In Sales And Net Profit How To Improve Company PPT Template Strategy SS V
The following slide depicts positive impact of adopting revenue strategy on business performance to evaluate returns and improvement. It includes comparison of key elements such as sales revenue, net profit etc. This modern and well-arranged Improvement In Sales And Net Profit How To Improve Company PPT Template Strategy SS V provides lots of creative possibilities. It is very simple to customize and edit with the Powerpoint Software. Just drag and drop your pictures into the shapes. All facets of this template can be edited with Powerpoint, no extra software is necessary. Add your own material, put your images in the places assigned for them, adjust the colors, and then you can show your slides to the world, with an animated slide included. The following slide depicts positive impact of adopting revenue strategy on business performance to evaluate returns and improvement. It includes comparison of key elements such as sales revenue, net profit etc.
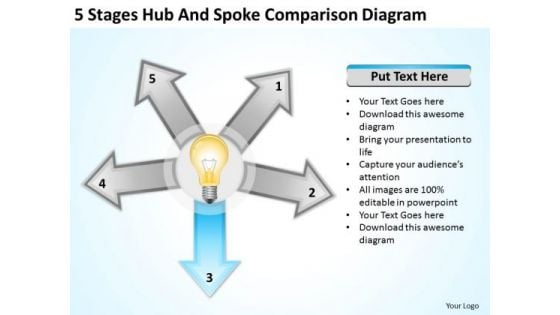
5 Stages Hub And Spoke Comparison Diagram Business Plan For Bar PowerPoint Templates
We present our 5 stages hub and spoke comparison diagram business plan for bar PowerPoint templates.Download our Technology PowerPoint Templates because Our PowerPoint Templates and Slides are created by a hardworking bunch of busybees. Always flitting around with solutions gauranteed to please. Present our Business PowerPoint Templates because Your audience will believe you are the cats whiskers. Download our Process and Flows PowerPoint Templates because You can Create a matrix with our PowerPoint Templates and Slides. Feel the strength of your ideas click into place. Download and present our Marketing PowerPoint Templates because You can Zap them with our PowerPoint Templates and Slides. See them reel under the impact. Use our Arrows PowerPoint Templates because It is Aesthetically crafted by artistic young minds. Our PowerPoint Templates and Slides are designed to display your dexterity.Use these PowerPoint slides for presentations relating to Experiment, spreadsheet, sociology, line chart, conclusion, pie chart, mathematics, innovation, sociological, business, bulb, concept, arrow, presentation, symbol, diagram, social, discovery, process, analysis, report, marketing, intelligent, creative, visualization, mathematical formula, trends, thinking, summary, infographic, exploration, information, conceptual, quantified, exploratory, business. The prominent colors used in the PowerPoint template are Blue, Yellow, White. Approaching the dais can make you anxious. Experience the calmness our 5 Stages Hub And Spoke Comparison Diagram Business Plan For Bar PowerPoint Templates bring.
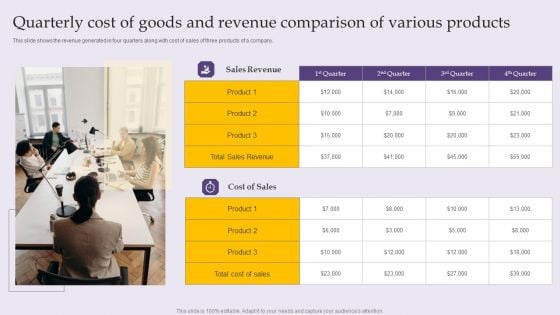
Quarterly Cost Of Goods And Revenue Comparison Of Various Products Microsoft PDF
This slide shows the revenue generated in four quarters along with cost of sales of three products of a company.Presenting Quarterly Cost Of Goods And Revenue Comparison Of Various Products Microsoft PDF to dispense important information. This template comprises one stage. It also presents valuable insights into the topics including Sales Revenue, Cost Sales, Sales Revenue. This is a completely customizable PowerPoint theme that can be put to use immediately. So, download it and address the topic impactfully.

Pitch Deck For Fund Raising From Series C Funding Product Category Comparison By Price Information PDF
This slide shows the different product categories that the company offers like Sweaters, T Shirts, Denim etc. and their product versions based on price ranges of Standard, Deluxe and Premium. Deliver and pitch your topic in the best possible manner with this pitch deck for fund raising from series c funding product category comparison by price information pdf. Use them to share invaluable insights on product category comparison by price and impress your audience. This template can be altered and modified as per your expectations. So, grab it now.
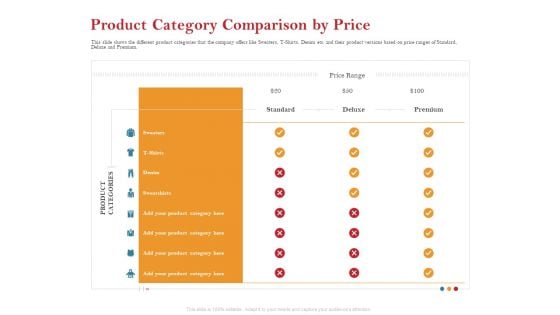
Pitch Deck For Raising Capital For Inorganic Growth Product Category Comparison By Price Download PDF
This slide shows the different product categories that the company offers like Sweaters, T Shirts, Denim etc. and their product versions based on price ranges of Standard, Deluxe and Premium. Deliver and pitch your topic in the best possible manner with this pitch deck for raising capital for inorganic growth product category comparison by price download pdf. Use them to share invaluable insights on product category comparison by price and impress your audience. This template can be altered and modified as per your expectations. So, grab it now.
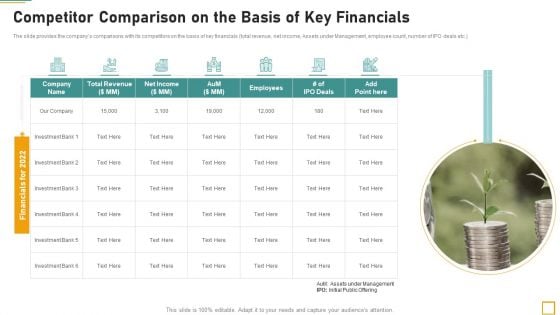
Pitch Book For Investor Funding Contract Competitor Comparison On The Basis Of Key Financials Structure PDF
The slide provides the companys comparisons with its competitors on the basis of key financials total revenue, net income, Assets under Management, employee count, number of IPO deals etc. Presenting pitch book for investor funding contract competitor comparison on the basis of key financials structure pdf to provide visual cues and insights. Share and navigate important information on one stages that need your due attention. This template can be used to pitch topics like total revenue, net income, financials. In addtion, this PPT design contains high resolution images, graphics, etc, that are easily editable and available for immediate download.
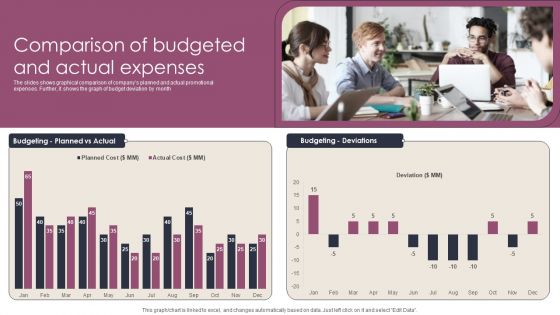
Comparison Of Budgeted And Actual Expenses Stages To Develop Demand Generation Tactics Information PDF
The slides shows graphical comparison of companys planned and actual promotional expenses. Further, it shows the graph of budget deviation by month. Want to ace your presentation in front of a live audience Our Comparison Of Budgeted And Actual Expenses Stages To Develop Demand Generation Tactics Information PDF can help you do that by engaging all the users towards you. Slidegeeks experts have put their efforts and expertise into creating these impeccable powerpoint presentations so that you can communicate your ideas clearly. Moreover, all the templates are customizable, and easy-to-edit and downloadable. Use these for both personal and commercial use.
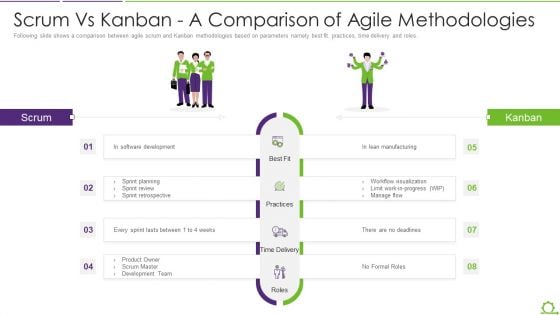
Comparison Between Agile And Scrum IT Scrum Vs Kanban A Comparison Of Agile Methodologies Summary PDF
Following slide shows a comparison between agile scrum and Kanban methodologies based on parameters namely best fit, practices, time delivery and roles. Presenting comparison between agile and scrum it scrum vs kanban a comparison of agile methodologies summary pdf to provide visual cues and insights. Share and navigate important information on four stages that need your due attention. This template can be used to pitch topics like lean manufacturing, software development, sprint planning, sprint review, sprint retrospective. In addtion, this PPT design contains high resolution images, graphics, etc, that are easily editable and available for immediate download.
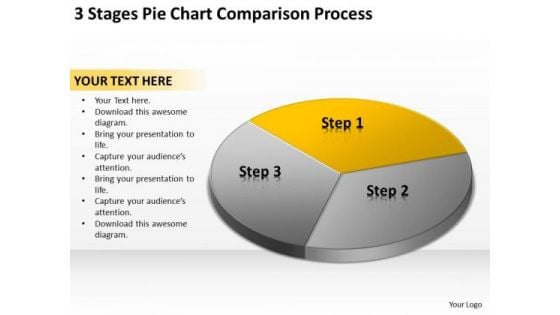
3 Stages Pie Chart Comparison Process Example Of Business Plans PowerPoint Slides
We present our 3 stages pie chart comparison process example of business plans PowerPoint Slides.Download our Marketing PowerPoint Templates because You have gained great respect for your brilliant ideas. Use our PowerPoint Templates and Slides to strengthen and enhance your reputation. Use our Finance PowerPoint Templates because You are working at that stage with an air of royalty. Let our PowerPoint Templates and Slides be the jewels in your crown. Present our Arrows PowerPoint Templates because Our PowerPoint Templates and Slides offer you the widest possible range of options. Download our Circle Charts PowerPoint Templates because You can Create a matrix with our PowerPoint Templates and Slides. Feel the strength of your ideas click into place. Download and present our Business PowerPoint Templates because You can Zap them with our PowerPoint Templates and Slides. See them reel under the impact.Use these PowerPoint slides for presentations relating to Pie, chart, process, menu, website, network, statistics, item, junction, corporate, business, plan, presentation, template, circle, brochure, data, report, marketing, different, management, graph, modern, connection, sphere, options, strategy, catalog, world, spherical, segments, text, company, banner, information, navigation, structure, parts, globe, arrows, communication. The prominent colors used in the PowerPoint template are Yellow, Black, Gray. Create the right environment for prosperity. Fashion the right conditions with our 3 Stages Pie Chart Comparison Process Example Of Business Plans PowerPoint Slides.
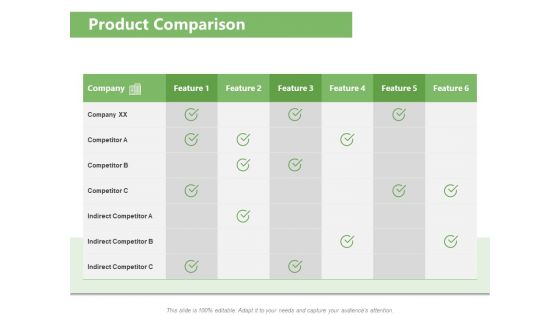
Raising Funds Company Product Comparison Ppt Styles Vector PDF
Presenting this set of slides with name raising funds company product comparison ppt styles vector pdf. The topics discussed in these slides are product comparison. This is a completely editable PowerPoint presentation and is available for immediate download. Download now and impress your audience.
Company Turnover Financial Ratios Chart Comparison Icons PDF
This slide illustrates graph for turnover ratios that are accounts receivable, inventory turnover, accounts payable turnover, fixed asset turnover and total assets turnover ratio. It showcases comparison of three companies. Pitch your topic with ease and precision using this company turnover financial ratios chart comparison icons pdf. This layout presents information on company turnover financial ratios chart comparison. It is also available for immediate download and adjustment. So, changes can be made in the color, design, graphics or any other component to create a unique layout.
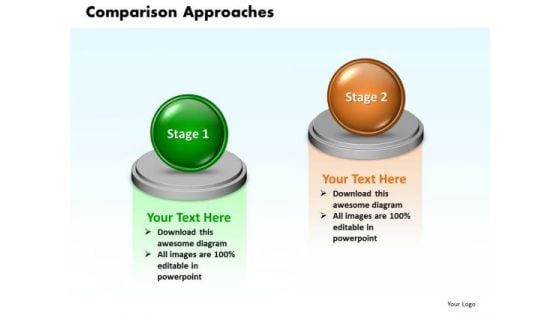
Ppt 3d Animated 2 Circular Approaches Comparison PowerPoint Templates
PPT 3d animated 2 circular approaches comparison PowerPoint Templates-This 3D animated Circular approaches diagram allows presenters to illustrate two approaches.-PPT 3d animated 2 circular approaches comparison PowerPoint Templates-3d, Abstract, Backgrounds, Ball, Business, Choice, Comparison, Concept, Descriptive, Equilibrium, Grow, Illustrations, Instrument, Measurement, Metallic, Part, Partnership, Pattern, Progress, Reflections, Scales, Several, Sphere, Strategy, Success Innovate and succeed with our Ppt 3d Animated 2 Circular Approaches Comparison PowerPoint Templates. Download without worries with our money back guaranteee.
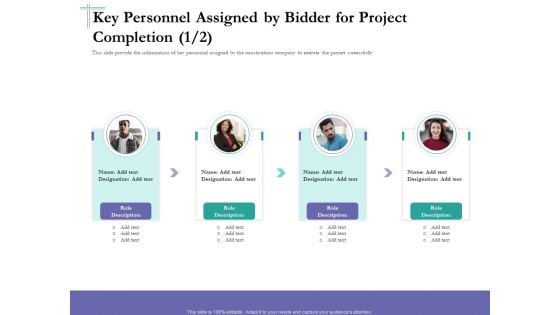
Bidding Cost Comparison Key Personnel Assigned By Bidder For Project Completion Communication Ppt Slide PDF
This slide provide the information of key personnel assigned by the construction company to execute the project successfully. This is a bidding cost comparison key personnel assigned by bidder for project completion communication ppt slide pdf template with various stages. Focus and dispense information on four stages using this creative set, that comes with editable features. It contains large content boxes to add your information on topics like key personnel assigned by bidder for project completion. You can also showcase facts, figures, and other relevant content using this PPT layout. Grab it now.
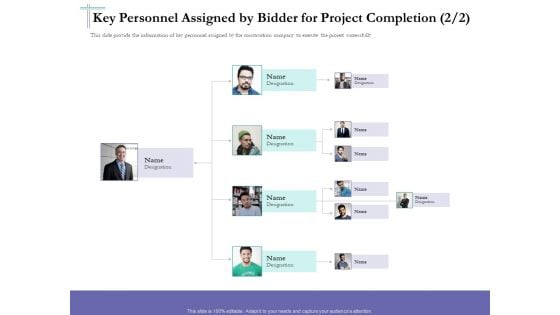
Bidding Cost Comparison Key Personnel Assigned By Bidder For Project Completion Teamwork Ppt Guidelines PDF
This slide provide the information of key personnel assigned by the construction company to execute the project successfully. Presenting bidding cost comparison key personnel assigned by bidder for project completion teamwork ppt guidelines pdf to provide visual cues and insights. Share and navigate important information on three stages that need your due attention. This template can be used to pitch topics like key personnel assigned by bidder for project completion. In addtion, this PPT design contains high resolution images, graphics, etc, that are easily editable and available for immediate download.
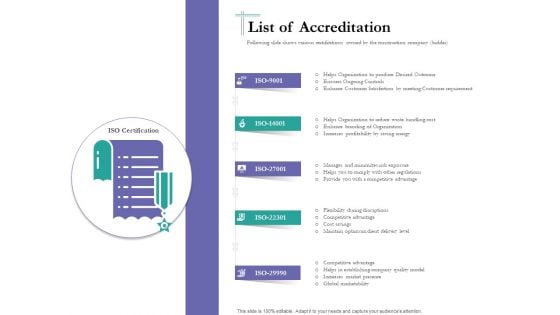
Bidding Cost Comparison List Of Accreditation Ppt Gallery Design Inspiration PDF
Following slide shows various certifications owned by the construction company bidder. This is a bidding cost comparison list of accreditation ppt gallery design inspiration pdf template with various stages. Focus and dispense information on five stages using this creative set, that comes with editable features. It contains large content boxes to add your information on topics like global marketability, competitive advantage, cost savings, ensures ongoing controls, flexibility during disruptions. You can also showcase facts, figures, and other relevant content using this PPT layout. Grab it now.
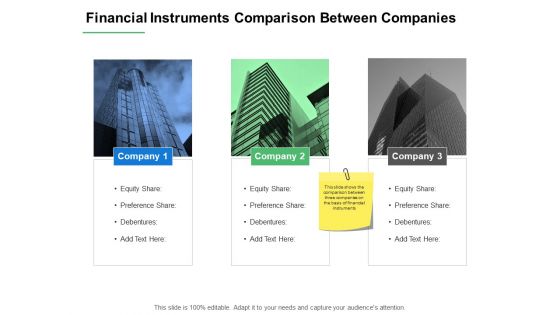
Financial Instruments Comparison Between Companies Ppt PowerPoint Presentation Ideas Display
This is a financial instruments comparison between companies ppt powerpoint presentation ideas display. This is a three stage process. The stages in this process are about us, management, planning, marketing, strategy.
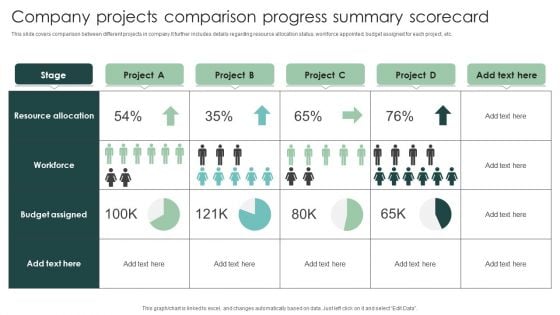
Company Projects Comparison Progress Summary Scorecard Portrait PDF
This slide covers comparison between different projects in company.It further includes details regarding resource allocation status, workforce appointed, budget assigned for each project, etc. Pitch your topic with ease and precision using this Company Projects Comparison Progress Summary Scorecard Portrait PDF. This layout presents information on Resource Allocation, Budget Assigned, Workforce. It is also available for immediate download and adjustment. So, changes can be made in the color, design, graphics or any other component to create a unique layout.
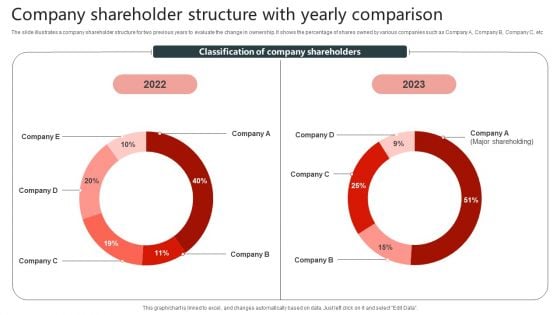
Company Shareholder Structure With Yearly Comparison Infographics PDF
The slide illustrates a company shareholder structure for two previous years to evaluate the change in ownership. It shows the percentage of shares owned by various companies such as Company A, Company B, Company C, etc. Pitch your topic with ease and precision using this Company Shareholder Structure With Yearly Comparison Infographics PDF. This layout presents information on Structure With Yearly Comparison, Company Shareholder. It is also available for immediate download and adjustment. So, changes can be made in the color, design, graphics or any other component to create a unique layout.

Insurance Company Policy Home Plan Covers Comparison Topics PDF
The slide shows comparison matrix of house insurance plans offered by various insurance companies. Its includes insurance companies, eligibility criterias, coverage areas and option covers. Persuade your audience using this Insurance Company Policy Home Plan Covers Comparison Topics PDF. This PPT design covers four stages, thus making it a great tool to use. It also caters to a variety of topics including Insurance Company, Eligibility, Coverage, Optional Covers. Download this PPT design now to present a convincing pitch that not only emphasizes the topic but also showcases your presentation skills.

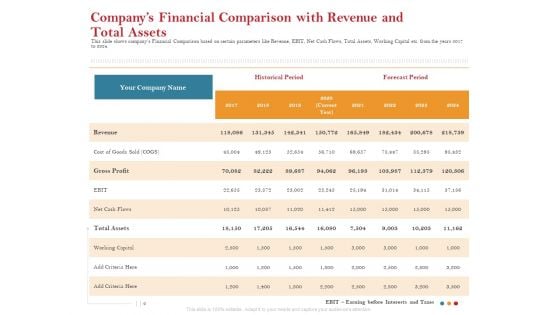
Private Equity Fund Pitch Deck To Raise Series C Funding Companys Financial Comparison With Revenue And Total Assets Professional PDF
This slide shows companys Financial Comparison based on certain parameters like Revenue, EBIT, Net Cash Flows, Total Assets, Working Capital etc. from the years 2017 to 2024. Deliver and pitch your topic in the best possible manner with this private equity fund pitch deck to raise series c funding companys financial comparison with revenue and total assets professional pdf. Use them to share invaluable insights on revenue, gross profit, net cash flows, working capital, cost goals and impress your audience. This template can be altered and modified as per your expectations. So, grab it now.
Pitch Deck For Fund Raising From Series C Funding Companys Financial Comparison With Revenue And Total Assets Icons PDF
This slide shows companys Financial Comparison based on certain parameters like Revenue, EBIT, Net Cash Flows, Total Assets, Working Capital etc. from the years 2017 to 2024. Deliver an awe inspiring pitch with this creative pitch deck for fund raising from series c funding companys financial comparison with revenue and total assets icons pdf bundle. Topics like revenue, gross profit, working capital, cost, criteria can be discussed with this completely editable template. It is available for immediate download depending on the needs and requirements of the user.
Pitch Deck For Raising Capital For Inorganic Growth Companys Financial Comparison With Revenue And Total Assets Structure PDF
This slide shows companys Financial Comparison based on certain parameters like Revenue, EBIT, Net Cash Flows, Total Assets, Working Capital etc. from the years 2017 to 2024. Deliver an awe inspiring pitch with this creative pitch deck for raising capital for inorganic growth companys financial comparison with revenue and total assets structure pdf bundle. Topics like revenue, gross profit, working capital, cost, criteria can be discussed with this completely editable template. It is available for immediate download depending on the needs and requirements of the user.
Pitch Presentation Raising Series C Funds Investment Companys Financial Comparison With Revenue And Total Assets Ideas PDF
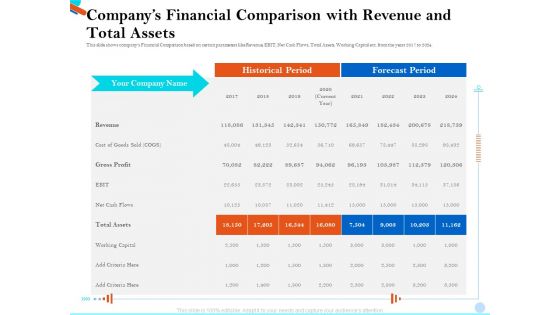
This slide shows companys Financial Comparison based on certain parameters like Revenue, EBIT, Net Cash Flows, Total Assets, Working Capital etc. from the years 2017 to 2024. Deliver an awe inspiring pitch with this creative pitch presentation raising series c funds investment companys financial comparison with revenue and total assets ideas pdf bundle. Topics like revenue, cost, gross profit, working capital, criteria can be discussed with this completely editable template. It is available for immediate download depending on the needs and requirements of the user.
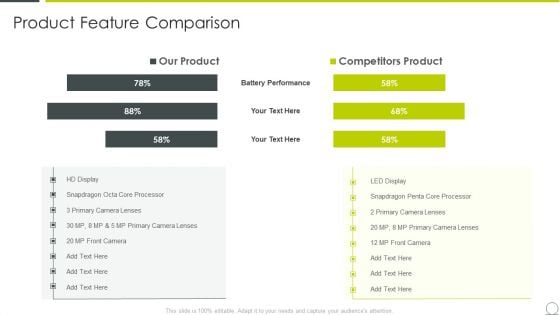
Examining Product Characteristics Brand Messaging Product Feature Comparison Professional PDF
Deliver and pitch your topic in the best possible manner with this examining product characteristics brand messaging product feature comparison professional pdf. Use them to share invaluable insights on product feature comparison and impress your audience. This template can be altered and modified as per your expectations. So, grab it now.
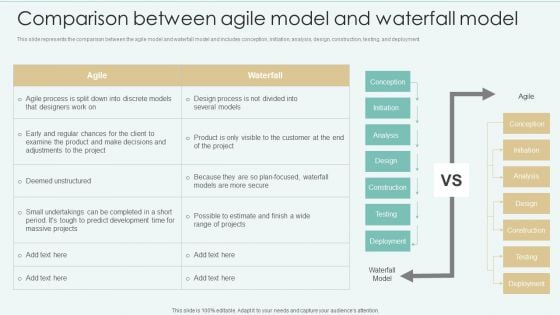
Comparison Between Agile Model And Waterfall Model Demonstration PDF
This slide represents the comparison between the agile model and waterfall model and includes conception, initiation, analysis, design, construction, testing, and deployment. Presenting this PowerPoint presentation, titled Comparison Between Agile Model And Waterfall Model Demonstration PDF, with topics curated by our researchers after extensive research. This editable presentation is available for immediate download and provides attractive features when used. Download now and captivate your audience. Presenting this Comparison Between Agile Model And Waterfall Model Demonstration PDF. Our researchers have carefully researched and created these slides with all aspects taken into consideration. This is a completely customizable Comparison Between Agile Model And Waterfall Model Demonstration PDF that is available for immediate downloading. Download now and make an impact on your audience. Highlight the attractive features available with our PPTs.
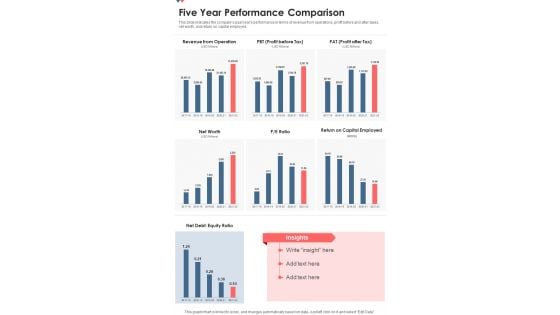
Five Year Performance Comparison One Pager Documents
This slide indicates the companys past years performance in terms of revenue from operations, profit before and after taxes, net worth, and return on capital employed. Presenting you a fantastic Five Year Performance Comparison One Pager Documents. This piece is crafted on hours of research and professional design efforts to ensure you have the best resource. It is completely editable and its design allow you to rehash its elements to suit your needs. Get this Five Year Performance Comparison One Pager Documents A4 One-pager now.
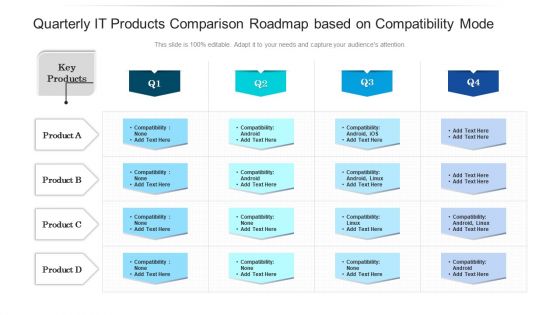
Quarterly IT Products Comparison Roadmap Based On Compatibility Mode Download
Presenting our innovatively structured quarterly it products comparison roadmap based on compatibility mode download Template. Showcase your roadmap process in different formats like PDF, PNG, and JPG by clicking the download button below. This PPT design is available in both Standard Screen and Widescreen aspect ratios. It can also be easily personalized and presented with modified font size, font type, color, and shapes to measure your progress in a clear way.
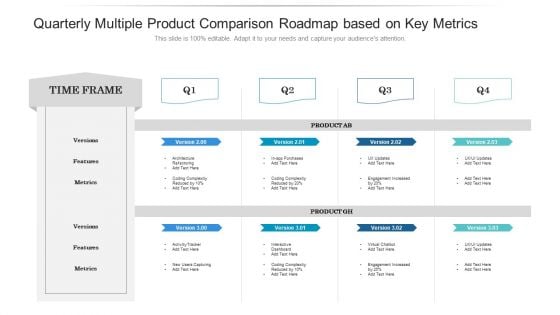
Quarterly Multiple Product Comparison Roadmap Based On Key Metrics Structure
Introducing our quarterly multiple product comparison roadmap based on key metrics structure. This PPT presentation is Google Slides compatible, therefore, you can share it easily with the collaborators for measuring the progress. Also, the presentation is available in both standard screen and widescreen aspect ratios. So edit the template design by modifying the font size, font type, color, and shapes as per your requirements. As this PPT design is fully editable it can be presented in PDF, JPG and PNG formats.
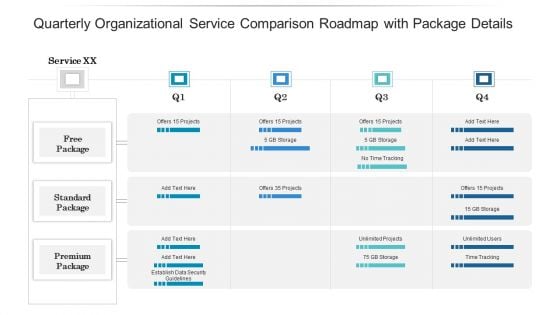
Quarterly Organizational Service Comparison Roadmap With Package Details Mockup
Presenting the quarterly organizational service comparison roadmap with package details mockup. The template includes a roadmap that can be used to initiate a strategic plan. Not only this, the PowerPoint slideshow is completely editable and you can effortlessly modify the font size, font type, and shapes according to your needs. This PPT slide can be easily reached in standard screen and widescreen aspect ratios. The set is also available in various formats like PDF, PNG, and JPG. So download and use it multiple times as per your knowledge.
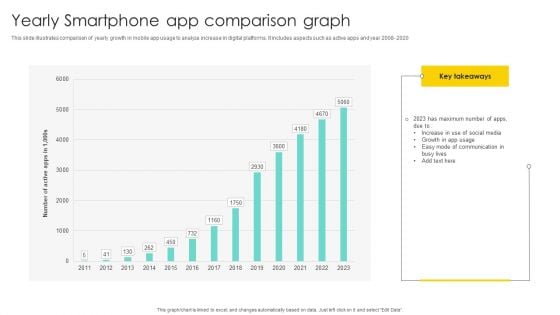
Yearly Smartphone App Comparison Graph Diagrams PDF
Showcasing this set of slides titled Yearly Smartphone App Comparison Graph Diagrams PDF. The topics addressed in these templates are Comparison Graph, Comparison Of Yearly, Growth In App . All the content presented in this PPT design is completely editable. Download it and make adjustments in color, background, font etc. as per your unique business setting.
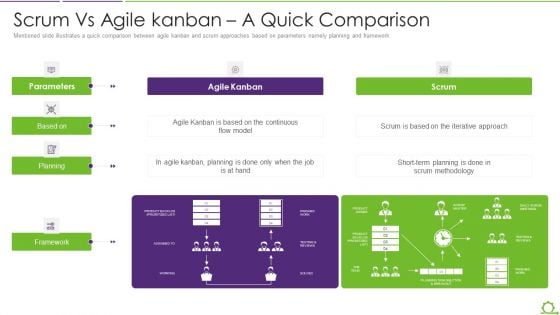
Comparison Between Agile And Scrum IT Scrum Vs Agile Kanban A Quick Comparison Formats PDF
Mentioned slide illustrates a quick comparison between agile kanban and scrum approaches based on parameters namely planning and framework. Deliver an awe inspiring pitch with this creative comparison between agile and scrum it scrum vs agile kanban a quick comparison formats pdf bundle. Topics like parameters, planning, framework, agile kanban, scrum can be discussed with this completely editable template. It is available for immediate download depending on the needs and requirements of the user.
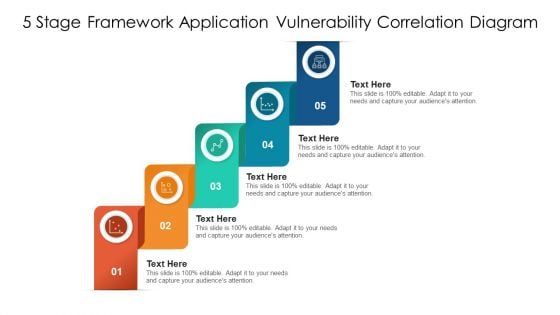
5 Stage Framework Application Vulnerability Correlation Diagram Ppt PowerPoint Presentation Professional Design Ideas PDF
Presenting 5 stage framework application vulnerability correlation diagram ppt powerpoint presentation professional design ideas pdf to dispense important information. This template comprises five stages. It also presents valuable insights into the topics including 5 stage framework application vulnerability correlation diagram. This is a completely customizable PowerPoint theme that can be put to use immediately. So, download it and address the topic impactfully.


 Continue with Email

 Home
Home


