Comparative Analysis
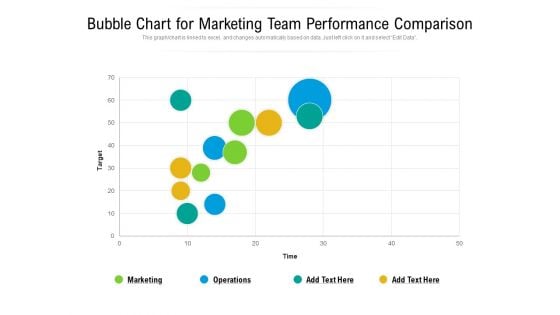
Bubble Chart For Marketing Team Performance Comparison Ppt PowerPoint Presentation File Outline PDF
Presenting this set of slides with name bubble chart for marketing team performance comparison ppt powerpoint presentation file outline pdf. The topics discussed in these slide is bubble chart for marketing team performance comparison. This is a completely editable PowerPoint presentation and is available for immediate download. Download now and impress your audience.

Two Products Comparison Stacked Chart Ppt PowerPoint Presentation Gallery Structure PDF
Pitch your topic with ease and precision using this two products comparison stacked chart ppt powerpoint presentation gallery structure pdf. This layout presents information on two products comparison stacked chart. It is also available for immediate download and adjustment. So, changes can be made in the color, design, graphics or any other component to create a unique layout.
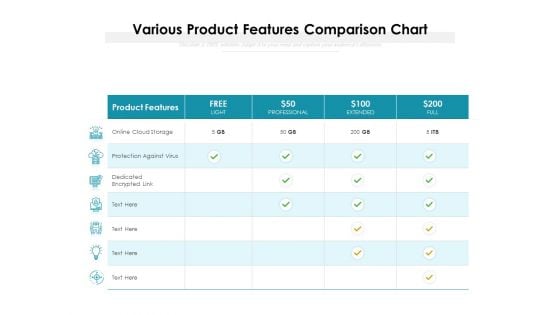
Various Product Features Comparison Chart Ppt PowerPoint Presentation File Graphics Tutorials PDF
Pitch your topic with ease and precision using this various product features comparison chart ppt powerpoint presentation file graphics tutorials pdf. This layout presents information on various product features comparison chart. It is also available for immediate download and adjustment. So, changes can be made in the color, design, graphics or any other component to create a unique layout.
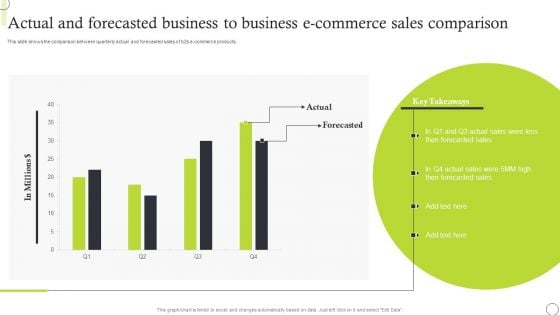
Actual And Forecasted Business To Business E Commerce Sales Comparison Portrait PDF
Pitch your topic with ease and precision using this Actual And Forecasted Business To Business E Commerce Sales Comparison Portrait PDF. This layout presents information on Actual, Forecasted Business, Sales Comparison. It is also available for immediate download and adjustment. So, changes can be made in the color, design
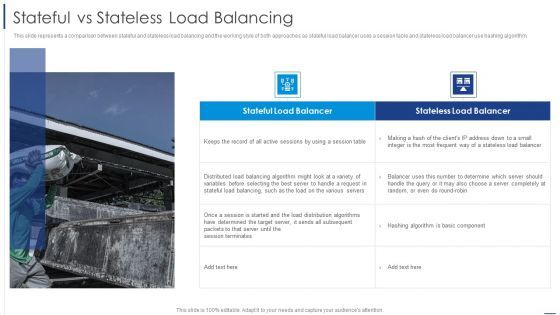
Load Balancing Technique Stateful Vs Stateless Load Balancing Mockup PDF
This slide represents a comparison between stateful and stateless load balancing and the working style of both approaches as stateful load balancer uses a session table and stateless load balancer use hashing algorithm. Deliver an awe inspiring pitch with this creative Load Balancing Technique Stateful Vs Stateless Load Balancing Mockup PDF bundle. Topics like Determined, Target Server can be discussed with this completely editable template. It is available for immediate download depending on the needs and requirements of the user.
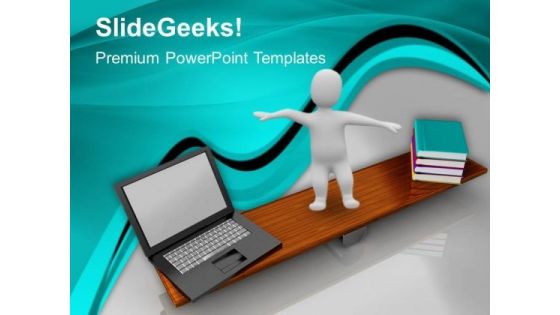
Books And Laptop Education PowerPoint Templates And PowerPoint Themes 1012
Books And Laptop Education PowerPoint Templates And PowerPoint Themes 1012-This PowerPoint Template shows the Laptop and books on the either side of the See-Saw to weigh which one is heavy in every respect. It portrays the concept of Networking, Communication etc. It imitates the comparison between studying through books and laptop. Forward thinking is the way to go. Use our templates to emphasize your views.-Books And Laptop Education PowerPoint Templates And PowerPoint Themes 1012-This PowerPoint template can be used for presentations relating to-Books and laptop, education, people, technology, future, computer Our Books And Laptop Education PowerPoint Templates And PowerPoint Themes 1012 have an enduring feature. They constantly remind people of your views.
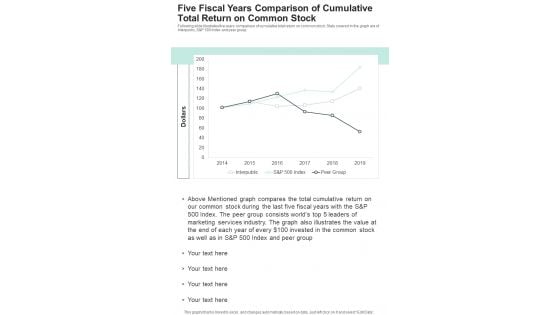
Five Fiscal Years Comparison Of Cumulative Total Return On Common Stock One Pager Documents
Following slide illustrates five years comparison of cumulative total return on common stock. Stats covered in the graph are of interpublic, S and P 500 Index and peer group. Presenting you a fantastic Five Fiscal Years Comparison Of Cumulative Total Return On Common Stock One Pager Documents. This piece is crafted on hours of research and professional design efforts to ensure you have the best resource. It is completely editable and its design allow you to rehash its elements to suit your needs. Get this Five Fiscal Years Comparison Of Cumulative Total Return On Common Stock One Pager Documents A4 One-pager now.
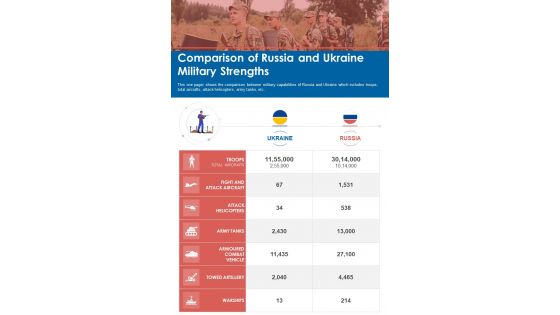
Comparison Of Russia And Ukraine Military Strengths One Pager Sample Example Document
This one pager shows the comparison between military capabilities of Russia and Ukraine which includes troops, total aircrafts, attack helicopters, army tanks, etc. Presenting you an exemplary Comparison Of Russia And Ukraine Military Strengths One Pager Sample Example Document. Our one-pager comprises all the must-have essentials of an inclusive document. You can edit it with ease, as its layout is completely editable. With such freedom, you can tweak its design and other elements to your requirements. Download this Comparison Of Russia And Ukraine Military Strengths One Pager Sample Example Document brilliant piece now.
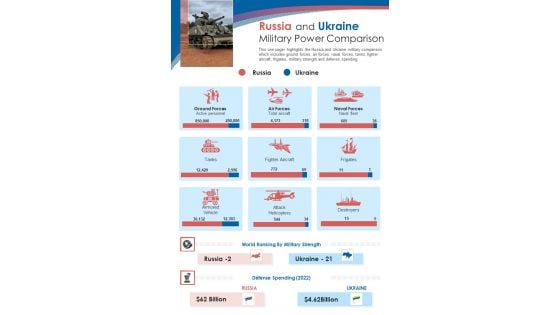
Russia And Ukraine Military Power Comparison One Pager Sample Example Document
This one pager highlights the Russia and Ukraine military comparison which includes ground forces, air forces, naval forces, tanks, fighter aircraft, frigates, military strength and defense spending. Presenting you an exemplary Russia And Ukraine Military Power Comparison One Pager Sample Example Document. Our one-pager comprises all the must-have essentials of an inclusive document. You can edit it with ease, as its layout is completely editable. With such freedom, you can tweak its design and other elements to your requirements. Download this Russia And Ukraine Military Power Comparison One Pager Sample Example Document brilliant piece now.
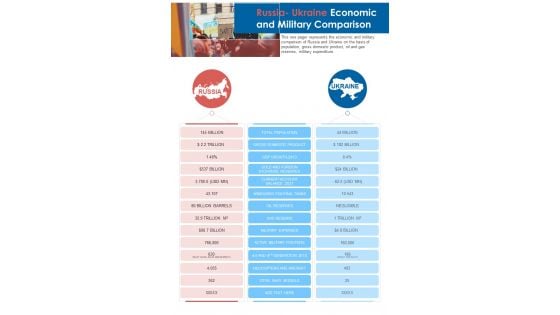
Russia Ukraine Economic And Military Comparison One Pager Sample Example Document
This one pager represents the economic and military comparison of Russia and Ukraine on the basis of population, gross domestic product, oil and gas reserves, military expenditure. Presenting you an exemplary Russia Ukraine Economic And Military Comparison One Pager Sample Example Document. Our one-pager comprises all the must-have essentials of an inclusive document. You can edit it with ease, as its layout is completely editable. With such freedom, you can tweak its design and other elements to your requirements. Download this Russia Ukraine Economic And Military Comparison One Pager Sample Example Document brilliant piece now.
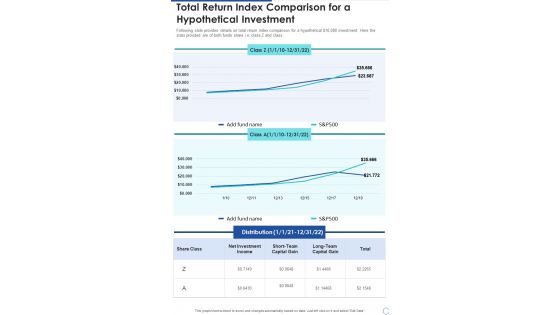
Total Return Index Comparison For A Hypothetical Investment One Pager Documents
Following slide provides details on total return index comparison for a hypothetical 10,000 investment. Here the stats provided are of both funds share i.e. class Z and class A. Presenting you a fantastic Total Return Index Comparison For A Hypothetical Investment One Pager Documents. This piece is crafted on hours of research and professional design efforts to ensure you have the best resource. It is completely editable and its design allow you to rehash its elements to suit your needs. Get this Total Return Index Comparison For A Hypothetical Investment One Pager Documents A4 One-pager now.
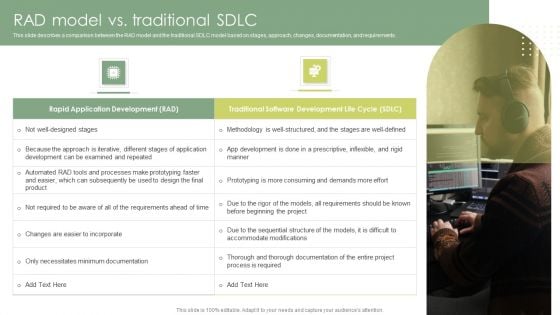
Rad Model Vs Traditional Sdlc Rapid Application Building RAB Model Template PDF
This slide describes a comparison between the RAD model and the traditional SDLC model based on stages, approach, changes, documentation, and requirements. This modern and well arranged Rad Model Vs Traditional Sdlc Rapid Application Building RAB Model Template PDF provides lots of creative possibilities. It is very simple to customize and edit with the Powerpoint Software. Just drag and drop your pictures into the shapes. All facets of this template can be edited with Powerpoint no extra software is necessary. Add your own material, put your images in the places assigned for them, adjust the colors, and then you can show your slides to the world, with an animated slide included.
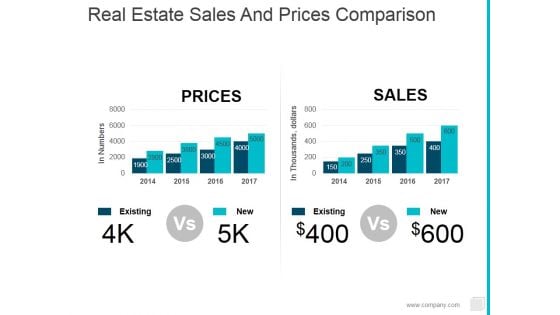
Real Estate Sales And Prices Comparison Ppt PowerPoint Presentation Show Rules
This is a real estate sales and prices comparison ppt powerpoint presentation show rules. This is a two stage process. The stages in this process are existing, new, prices, sales.
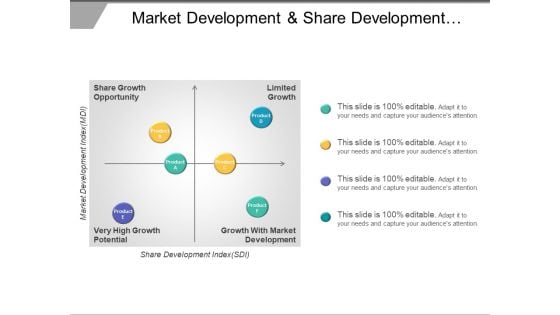
Market Development And Share Development Comparison Matrix Ppt PowerPoint Presentation File Graphics Example
This is a market development and share development comparison matrix ppt powerpoint presentation file graphics example. This is a four stage process. The stages in this process are market overview, market potential, market assessments.
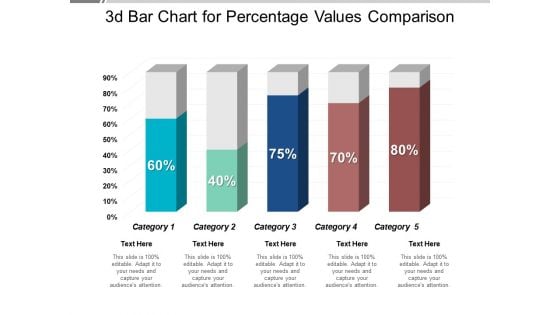
3D Bar Chart For Percentage Values Comparison Ppt PowerPoint Presentation Professional Visual Aids
This is a 3d bar chart for percentage values comparison ppt powerpoint presentation professional visual aids. This is a five stage process. The stages in this process are art, colouring, paint brush.
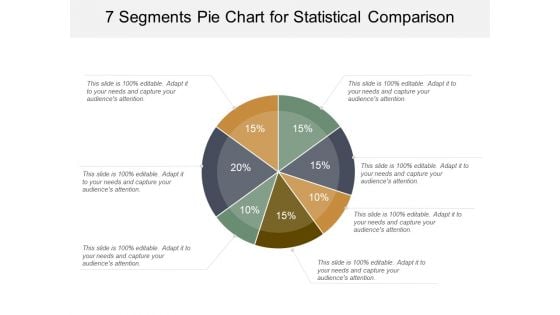
7 Segments Pie Chart For Statistical Comparison Ppt PowerPoint Presentation Gallery Visual Aids
This is a 7 segments pie chart for statistical comparison ppt powerpoint presentation gallery visual aids. This is a seven stage process. The stages in this process are 6 piece pie chart, 6 segment pie chart, 6 parts pie chart.
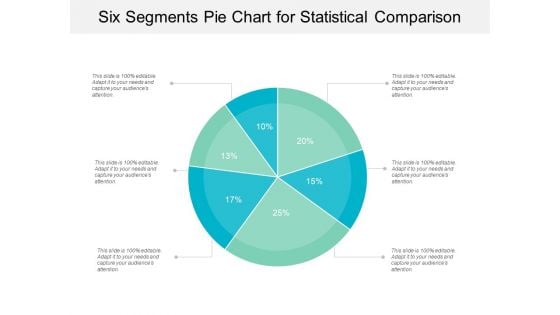
Six Segments Pie Chart For Statistical Comparison Ppt PowerPoint Presentation Gallery Background
This is a six segments pie chart for statistical comparison ppt powerpoint presentation gallery background. This is a six stage process. The stages in this process are 6 piece pie chart, 6 segment pie chart, 6 parts pie chart.
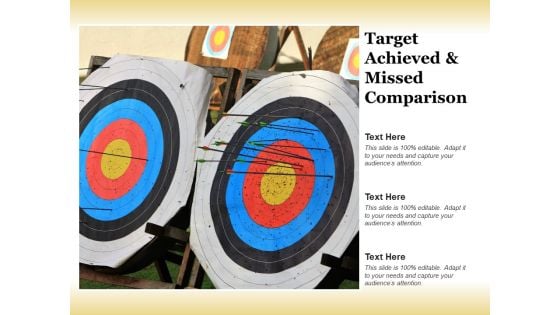
Target Achieved And Missed Comparison Ppt Powerpoint Presentation Visual Aids Deck
This is a target achieved and missed comparison ppt powerpoint presentation visual aids deck. This is a three stage process. The stages in this process are hits and misses, thumb up and thumb down, okay and not okay.
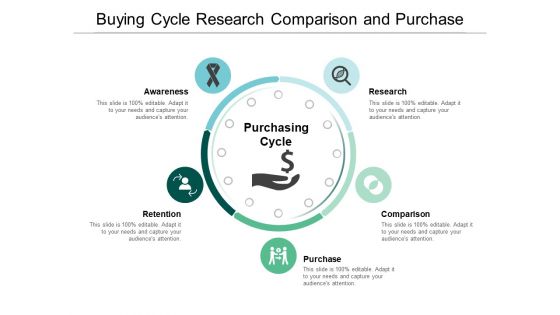
Buying Cycle Research Comparison And Purchase Ppt PowerPoint Presentation Ideas Aids
This is a buying cycle research comparison and purchase ppt powerpoint presentation ideas aids. This is a five stage process. The stages in this process are purchasing process, purchasing cycle, procurement cycle.
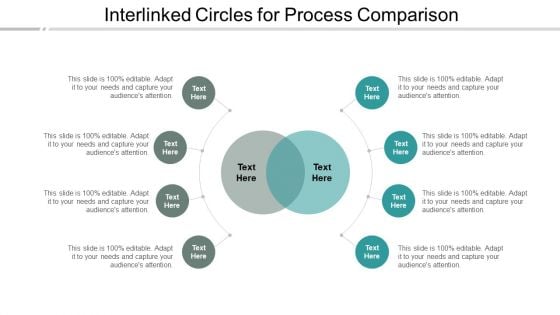
Interlinked Circles For Process Comparison Ppt Powerpoint Presentation File Slide Portrait
This is a interlinked circles for process comparison ppt powerpoint presentation file slide portrait. This is a eight stage process. The stages in this process are circle cluster, cyclic cluster, circular cluster.
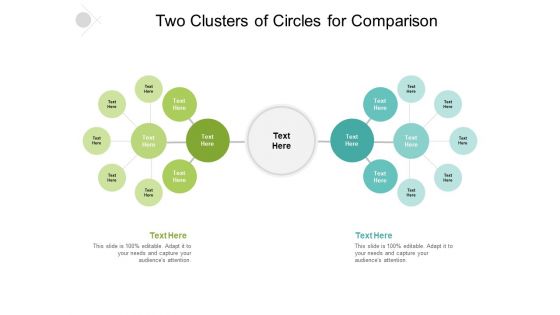
Two Clusters Of Circles For Comparison Ppt Powerpoint Presentation Show Objects
This is a two clusters of circles for comparison ppt powerpoint presentation show objects. This is a two stage process. The stages in this process are circle cluster, cyclic cluster, circular cluster.
Percentage Value Comparison Pie Chart Icon Ppt PowerPoint Presentation Model Clipart Images
This is a percentage value comparison pie chart icon ppt powerpoint presentation model clipart images. This is a three stage process. The stages in this process are percentage icon, dividend icon, portion icon.
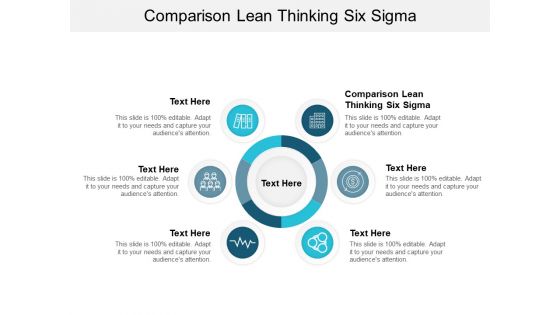
Comparison Lean Thinking Six Sigma Ppt PowerPoint Presentation Outline Inspiration Cpb
Presenting this set of slides with name comparison lean thinking six sigma ppt powerpoint presentation outline inspiration cpb. This is an editable Powerpoint six stages graphic that deals with topics like comparison lean thinking six sigma to help convey your message better graphically. This product is a premium product available for immediate download and is 100 percent editable in Powerpoint. Download this now and use it in your presentations to impress your audience.
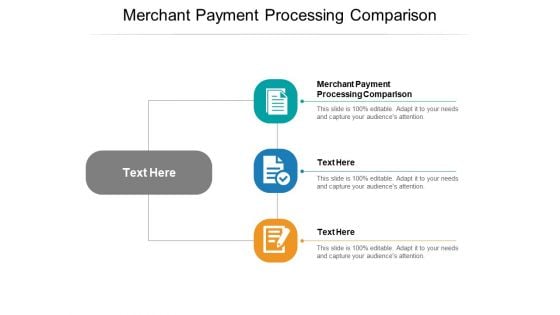
Merchant Payment Processing Comparison Ppt PowerPoint Presentation Model Graphics Tutorials Cpb Pdf
Presenting this set of slides with name merchant payment processing comparison ppt powerpoint presentation model graphics tutorials cpb pdf. This is an editable Powerpoint three stages graphic that deals with topics like merchant payment processing comparison to help convey your message better graphically. This product is a premium product available for immediate download and is 100 percent editable in Powerpoint. Download this now and use it in your presentations to impress your audience.
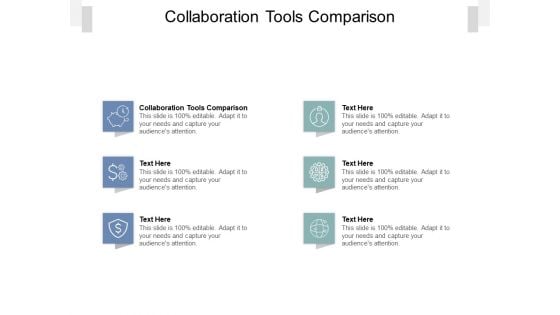
Collaboration Tools Comparison Ppt PowerPoint Presentation Inspiration Background Image Cpb Pdf
Presenting this set of slides with name collaboration tools comparison ppt powerpoint presentation inspiration background image cpb pdf. This is an editable Powerpoint six stages graphic that deals with topics like collaboration tools comparison to help convey your message better graphically. This product is a premium product available for immediate download and is 100 percent editable in Powerpoint. Download this now and use it in your presentations to impress your audience.
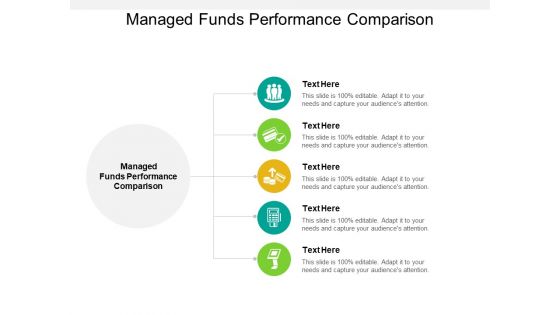
Managed Funds Performance Comparison Ppt PowerPoint Presentation Ideas Graphic Tips Cpb Pdf
Presenting this set of slides with name managed funds performance comparison ppt powerpoint presentation ideas graphic tips cpb pdf. This is an editable Powerpoint five stages graphic that deals with topics like managed funds performance comparison to help convey your message better graphically. This product is a premium product available for immediate download and is 100 percent editable in Powerpoint. Download this now and use it in your presentations to impress your audience.
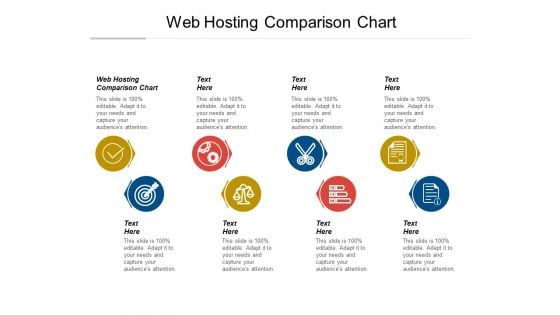
Web Hosting Comparison Chart Ppt PowerPoint Presentation Gallery Themes Cpb Pdf
Presenting this set of slides with name web hosting comparison chart ppt powerpoint presentation gallery themes cpb pdf. This is an editable Powerpoint eight stages graphic that deals with topics like web hosting comparison chart to help convey your message better graphically. This product is a premium product available for immediate download and is 100 percent editable in Powerpoint. Download this now and use it in your presentations to impress your audience.
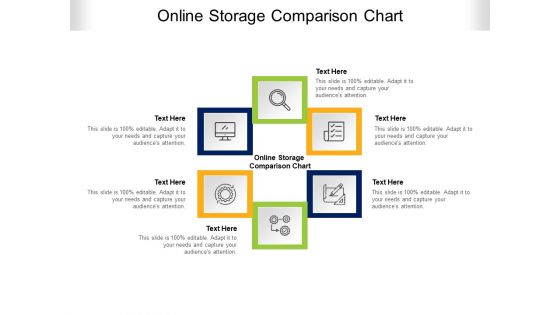
Online Storage Comparison Chart Ppt PowerPoint Presentation Show Topics Cpb Pdf
Presenting this set of slides with name online storage comparison chart ppt powerpoint presentation show topics cpb pdf. This is an editable Powerpoint six stages graphic that deals with topics like online storage comparison chart to help convey your message better graphically. This product is a premium product available for immediate download and is 100 percent editable in Powerpoint. Download this now and use it in your presentations to impress your audience.
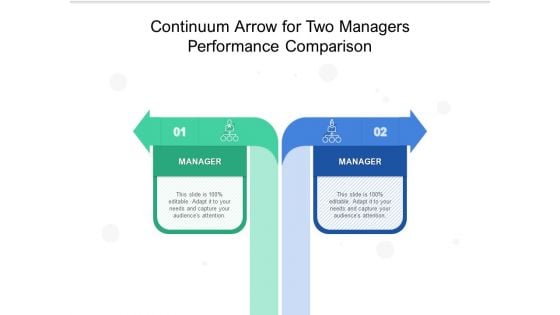
Continuum Arrow For Two Managers Performance Comparison Ppt PowerPoint Presentation Outline Layouts PDF
Persuade your audience using this continuum arrow for two managers performance comparison ppt powerpoint presentation outline layouts pdf. This PPT design covers two stages, thus making it a great tool to use. It also caters to a variety of topics including continuum arrow for two managers performance comparison. Download this PPT design now to present a convincing pitch that not only emphasizes the topic but also showcases your presentation skills.
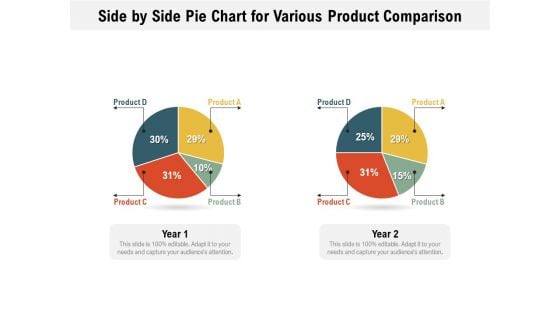
Side By Side Pie Chart For Various Product Comparison Ppt PowerPoint Presentation File Infographics PDF
Pitch your topic with ease and precision using this side by side pie chart for various product comparison ppt powerpoint presentation file infographics pdf. This layout presents information on side by side pie chart for various product comparison. It is also available for immediate download and adjustment. So, changes can be made in the color, design, graphics or any other component to create a unique layout.
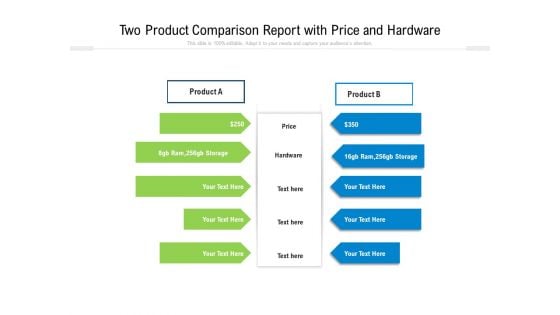
Two Product Comparison Report With Price And Hardware Ppt PowerPoint Presentation Gallery Graphics Pictures PDF
Pitch your topic with ease and precision using this two product comparison report with price and hardware ppt powerpoint presentation gallery graphics pictures pdf. This layout presents information on two product comparison report with price and hardware. It is also available for immediate download and adjustment. So, changes can be made in the color, design, graphics or any other component to create a unique layout.
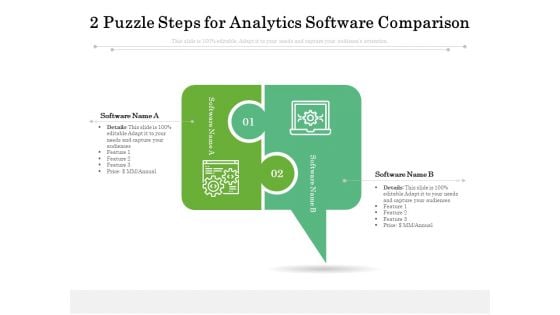
2 Puzzle Steps For Analytics Software Comparison Ppt PowerPoint Presentation Slides File Formats PDF
Persuade your audience using this 2 puzzle steps for analytics software comparison ppt powerpoint presentation slides file formats pdf. This PPT design covers two stages, thus making it a great tool to use. It also caters to a variety of topics including 2 puzzle steps for analytics software comparison. Download this PPT design now to present a convincing pitch that not only emphasizes the topic but also showcases your presentation skills.
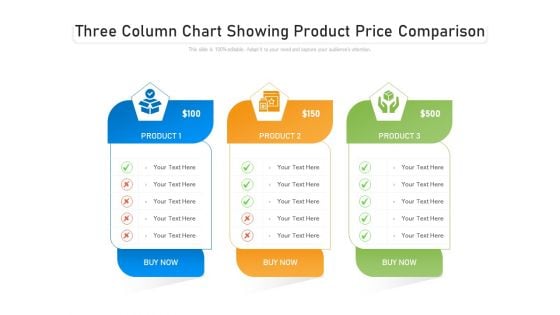
Three Column Chart Showing Product Price Comparison Ppt PowerPoint Presentation Ideas Deck PDF
Persuade your audience using this three column chart showing product price comparison ppt powerpoint presentation ideas deck pdf. This PPT design covers three stages, thus making it a great tool to use. It also caters to a variety of topics including three column chart showing product price comparison. Download this PPT design now to present a convincing pitch that not only emphasizes the topic but also showcases your presentation skills.

Staff Skills Comparison In Self Introduction Ppt PowerPoint Presentation Model Ideas PDF
Persuade your audience using this staff skills comparison in self introduction ppt powerpoint presentation model ideas pdf. This PPT design covers four stages, thus making it a great tool to use. It also caters to a variety of topics including staff skills comparison in self introduction. Download this PPT design now to present a convincing pitch that not only emphasizes the topic but also showcases your presentation skills.
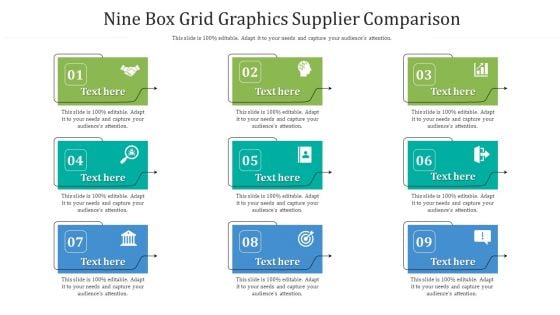
Nine Box Grid Graphics Supplier Comparison Ppt PowerPoint Presentation Gallery Smartart PDF
Persuade your audience using this nine box grid graphics supplier comparison ppt powerpoint presentation gallery smartart pdf. This PPT design covers nine stages, thus making it a great tool to use. It also caters to a variety of topics including nine box grid graphics supplier comparison. Download this PPT design now to present a convincing pitch that not only emphasizes the topic but also showcases your presentation skills.
Icon For Operating Income And Expenditure Budget Comparison Ppt PowerPoint Presentation Professional Graphic Tips PDF
Persuade your audience using this Icon For Operating Income And Expenditure Budget Comparison Ppt PowerPoint Presentation Professional Graphic Tips PDF. This PPT design covers four stages, thus making it a great tool to use. It also caters to a variety of topics including Icon For Operating, Income And Expenditure, Budget Comparison. Download this PPT design now to present a convincing pitch that not only emphasizes the topic but also showcases your presentation skills.

KPI Dashboard Of Customer And Product Sales Performance Comparison Information PDF
This slide shows the KPI dashboard of client and product sales comparison. It also includes sales by location and total sales. Pitch your topic with ease and precision using this KPI Dashboard Of Customer And Product Sales Performance Comparison Information PDF. This layout presents information on Product Sales, Client Sales, Tim Santana. It is also available for immediate download and adjustment. So, changes can be made in the color, design, graphics or any other component to create a unique layout.

Quarterly Comparison Of Security For Cloud Based Systems Threats Infographics PDF
This slide shows the various types of cloud security threats occurred during four quarters. It includes phishing, malware, IoT and password attacks. Pitch your topic with ease and precision using this Quarterly Comparison Of Security For Cloud Based Systems Threats Infographics PDF. This layout presents information on Quarterly Comparison Of Security, Cloud Based Systems Threats. It is also available for immediate download and adjustment. So, changes can be made in the color, design, graphics or any other component to create a unique layout.
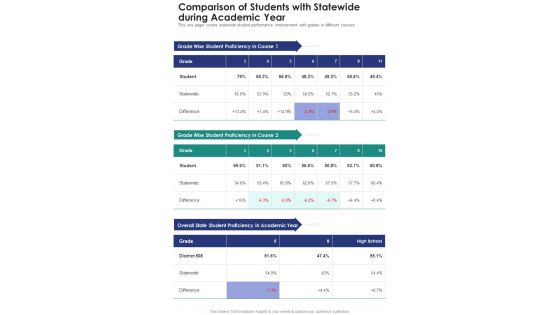
Comparison Of Students With Statewide During Academic Year One Pager Documents
This one pager covers statewide student performance improvement with grades in different courses. Presenting you an exemplary Comparison Of Students With Statewide During Academic Year One Pager Documents. Our one-pager comprises all the must-have essentials of an inclusive document. You can edit it with ease, as its layout is completely editable. With such freedom, you can tweak its design and other elements to your requirements. Download this Comparison Of Students With Statewide During Academic Year One Pager Documents brilliant piece now.
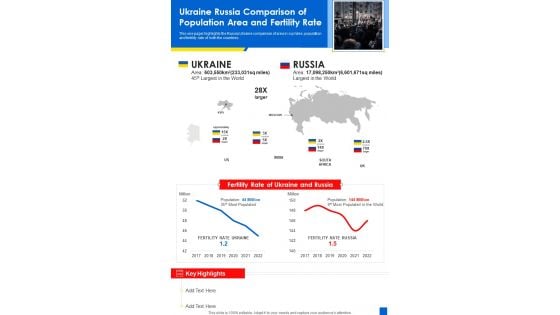
Ukraine Russia Comparison Of Population Area And Fertility Rate One Pager Sample Example Document
Presenting you an exemplary Ukraine Russia Comparison Of Population Area And Fertility Rate One Pager Sample Example Document. Our one-pager comprises all the must-have essentials of an inclusive document. You can edit it with ease, as its layout is completely editable. With such freedom, you can tweak its design and other elements to your requirements. Download this Ukraine Russia Comparison Of Population Area And Fertility Rate One Pager Sample Example Document brilliant piece now.
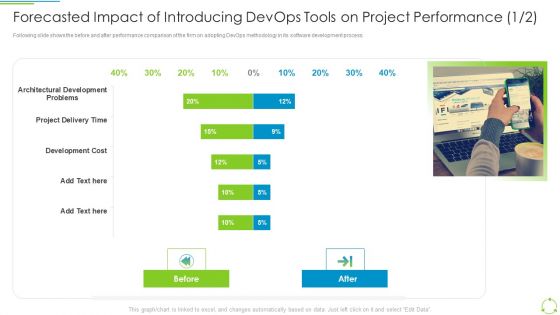
Executing Devops Framework Forecasted Impact Of Introducing Devops Tools Topics PDF
Following slide shows the before and after performance comparison of the firm on adopting DevOps methodology in its software development process. Deliver an awe inspiring pitch with this creative Executing Devops Framework Forecasted Impact Of Introducing Devops Tools Topics PDF bundle. Topics like Development Cost, Project Delivery Time, Architectural Development Problems can be discussed with this completely editable template. It is available for immediate download depending on the needs and requirements of the user.
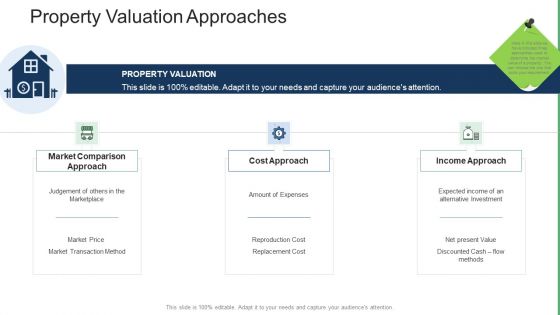
Commercial Property Administration And Advancement Property Valuation Approaches Rules PDF
Presenting commercial property administration and advancement property valuation approaches rules pdf to provide visual cues and insights. Share and navigate important information on three stages that need your due attention. This template can be used to pitch topics like market comparison approach, cost approach, income approach. In addtion, this PPT design contains high resolution images, graphics, etc, that are easily editable and available for immediate download.
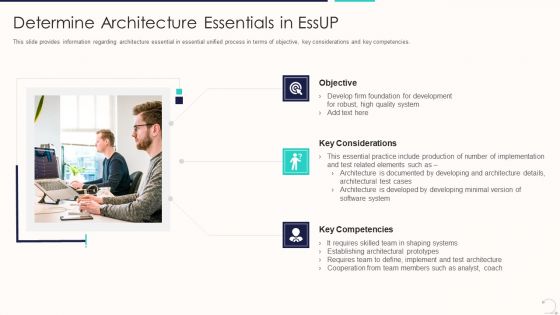
Agile Unified Procedure It Determine Architecture Essentials In Essup Designs PDF
This slide provides information regarding architecture essential in essential unified process in terms of objective, key considerations and key competencies. Presenting agile unified procedure it comparison diagrams pdf to provide visual cues and insights. Share and navigate important information on three stages that need your due attention. This template can be used to pitch topics like comparison. In addtion, this PPT design contains high resolution images, graphics, etc, that are easily editable and available for immediate download.
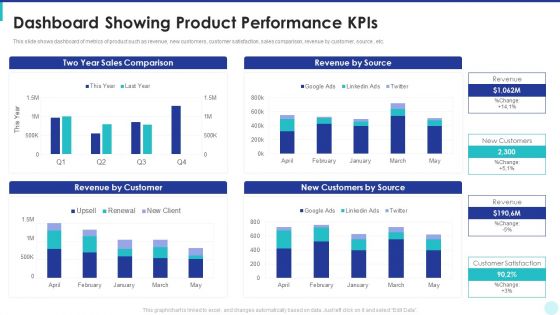
Optimization Of Product Development Life Cycle Dashboard Showing Product Performance Kpis Topics PDF
This slide shows dashboard of metrics of product such as revenue, new customers, customer satisfaction, sales comparison, revenue by customer, source , etc. Deliver an awe inspiring pitch with this creative optimization of product development life cycle dashboard showing product performance kpis topics pdf bundle. Topics like sales comparison, revenue by source, revenue by customer, customers by source can be discussed with this completely editable template. It is available for immediate download depending on the needs and requirements of the user.
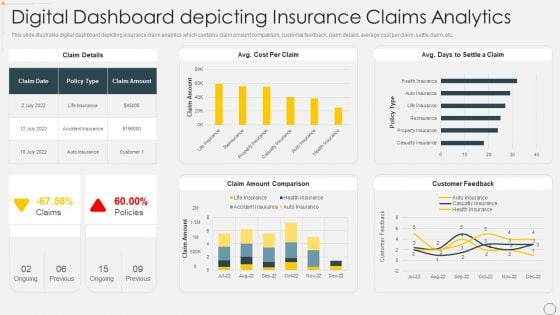
Digital Dashboard Depicting Insurance Claims Analytics Pictures PDF
This slide illustrates digital dashboard depicting insurance claim analytics which contains claim amount comparison, customer feedback, claim details, average cost per claim, settle claim, etc. Showcasing this set of slides titled Digital Dashboard Depicting Insurance Claims Analytics Pictures PDF. The topics addressed in these templates are Policy, Cost, Comparison. All the content presented in this PPT design is completely editable. Download it and make adjustments in color, background, font etc. as per your unique business setting.
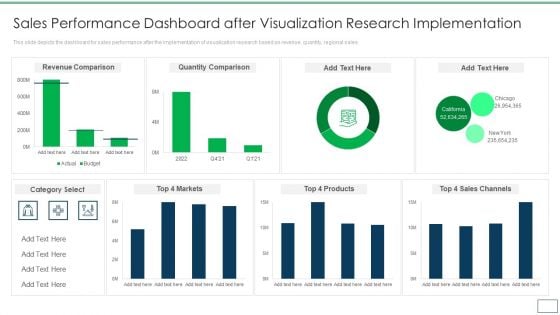
Departments Of Visualization Research Sales Performance Dashboard After Visualization Sample PDF
This slide depicts the dashboard for sales performance after the implementation of visualization research based on revenue, quantity, regional sales.Deliver an awe inspiring pitch with this creative Departments Of Visualization Research Sales Performance Dashboard After Visualization Sample PDF bundle. Topics like Revenue Comparison, Quantity Comparison, Category Select can be discussed with this completely editable template. It is available for immediate download depending on the needs and requirements of the user.
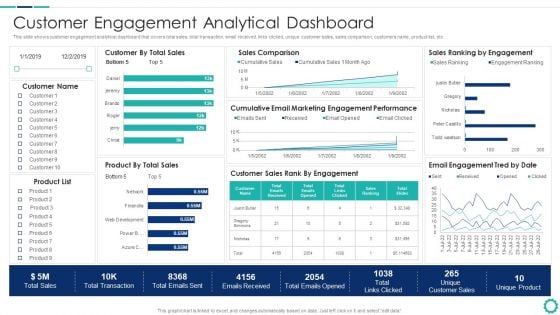
Creating Successful Strategies To Enhance Customer Experience Customer Engagement Analytical Dashboard Slides PDF
This slide shows customer engagement analytical dashboard that covers total sales, total transaction, email received, links clicked, unique customer sales, sales comparison, customers name, product list, etc.Deliver an awe inspiring pitch with this creative Creating Successful Strategies To Enhance Customer Experience Customer Engagement Analytical Dashboard Slides PDF bundle. Topics like Sales Comparison, Engagement Performance, Customer Sales can be discussed with this completely editable template. It is available for immediate download depending on the needs and requirements of the user.

Comparison Between Traditional Software And Saas Program Ppt PowerPoint Presentation File Show PDF
The following slide highlights the comparison between traditional and SaaS platform illustrating key headings which includes metrics, traditional software and SaaS platform. Persuade your audience using this comparison between traditional software and saas program ppt powerpoint presentation file show pdf. This PPT design covers three stages, thus making it a great tool to use. It also caters to a variety of topics including pricing, metrics, traditional software, saas platform. Download this PPT design now to present a convincing pitch that not only emphasizes the topic but also showcases your presentation skills.
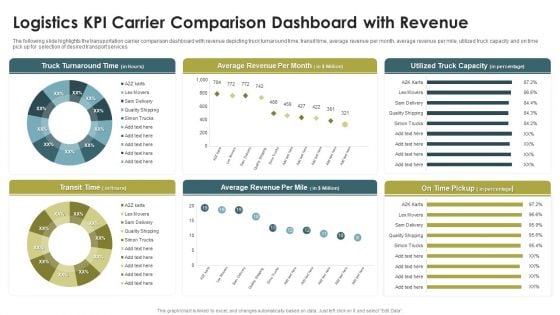
Logistics KPI Carrier Comparison Dashboard With Revenue Ppt Infographics Portfolio PDF
The following slide highlights the transportation carrier comparison dashboard with revenue depicting truck turnaround time, transit time, average revenue per month, average revenue per mile, utilized truck capacity and on time pick up for selection of desired transport services. Pitch your topic with ease and precision using this Logistics KPI Carrier Comparison Dashboard With Revenue Ppt Infographics Portfolio PDF. This layout presents information on Truck Turnaround Time, Average Revenue, Per Month, Transit Time. It is also available for immediate download and adjustment. So, changes can be made in the color, design, graphics or any other component to create a unique layout.
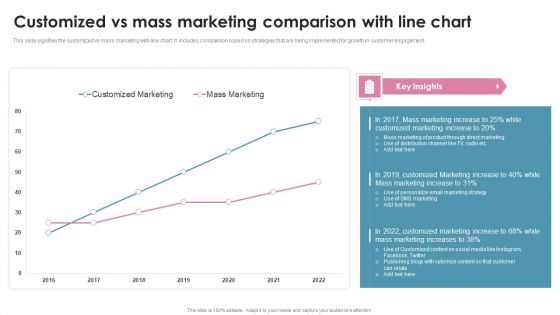
Customized Vs Mass Marketing Comparison With Line Chart Ppt PowerPoint Presentation File Ideas PDF
This slide signifies the customized vs mass marketing with line chart. It includes comparison based on strategies that are being implemented for growth in customer engagement. Pitch your topic with ease and precision using this Customized Vs Mass Marketing Comparison With Line Chart Ppt PowerPoint Presentation File Ideas PDF. This layout presents information on Customized Marketing, Mass Marketing, 2016 To 2022. It is also available for immediate download and adjustment. So, changes can be made in the color, design, graphics or any other component to create a unique layout.
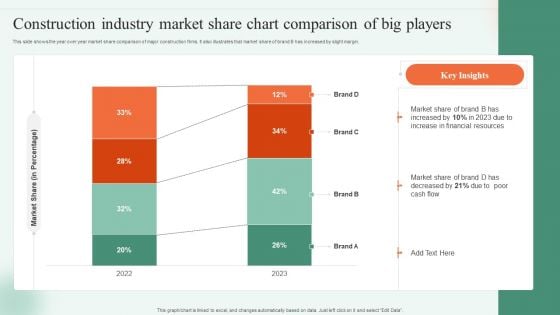
Construction Industry Market Share Chart Comparison Of Big Players Ppt Portfolio Shapes PDF
This slide shows the year over year market share comparison of major construction firms. It also illustrates that market share of brand B has increased by slight margin. Pitch your topic with ease and precision using this Construction Industry Market Share Chart Comparison Of Big Players Ppt Portfolio Shapes PDF. This layout presents information on Market Share Percentage, 2022 To 2023, Market Share. It is also available for immediate download and adjustment. So, changes can be made in the color, design, graphics or any other component to create a unique layout.
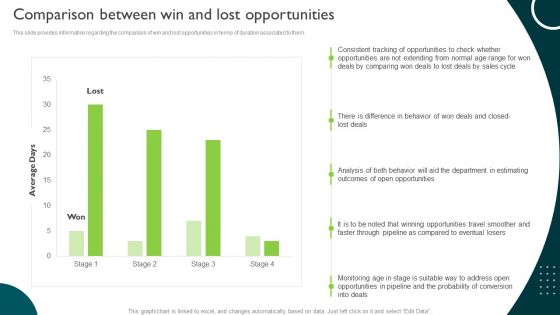
Comparison Between Win And Lost Opportunities Managing Sales Pipeline Health Formats PDF
This slide provides information regarding the comparison of win and lost opportunities in terms of duration associated to them. This Comparison Between Win And Lost Opportunities Managing Sales Pipeline Health Formats PDF from Slidegeeks makes it easy to present information on your topic with precision. It provides customization options, so you can make changes to the colors, design, graphics, or any other component to create a unique layout. It is also available for immediate download, so you can begin using it right away. Slidegeeks has done good research to ensure that you have everything you need to make your presentation stand out. Make a name out there for a brilliant performance.
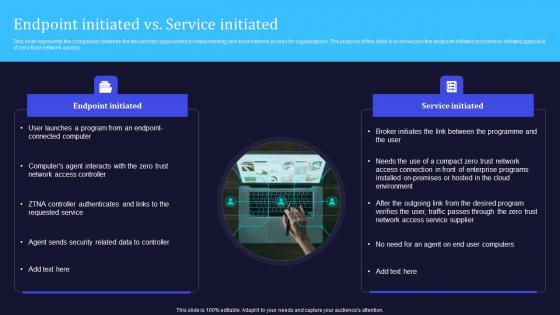
Zero Trust Model Endpoint Initiated Vs Service Initiated
This slide represents the comparison between the two primary approaches to implementing zero-trust network access for organizations. The purpose of this slide is to showcase the endpoint-initiated and service-initiated approach of zero-trust network access. Crafting an eye-catching presentation has never been more straightforward. Let your presentation shine with this tasteful yet straightforward Zero Trust Model Endpoint Initiated Vs Service Initiated template. It offers a minimalistic and classy look that is great for making a statement. The colors have been employed intelligently to add a bit of playfulness while still remaining professional. Construct the ideal Zero Trust Model Endpoint Initiated Vs Service Initiated that effortlessly grabs the attention of your audience Begin now and be certain to wow your customers. This slide represents the comparison between the two primary approaches to implementing zero-trust network access for organizations. The purpose of this slide is to showcase the endpoint-initiated and service-initiated approach of zero-trust network access.
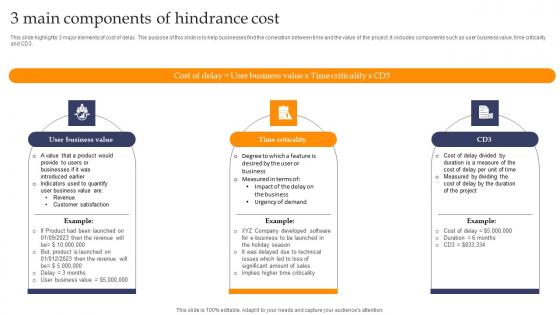
3 Main Components Of Hindrance Cost Mockup pdf
This slide highlights 3 major elements of cost of delay. The purpose of this slide is to help businesses find the correlation between time and the value of the project. It includes components such as user business value, time criticality and CD3. Showcasing this set of slides titled 3 Main Components Of Hindrance Cost Mockup pdf. The topics addressed in these templates are Building Report, Naming Report, Project Health. All the content presented in this PPT design is completely editable. Download it and make adjustments in color, background, font etc. as per your unique business setting. This slide highlights 3 major elements of cost of delay. The purpose of this slide is to help businesses find the correlation between time and the value of the project. It includes components such as user business value, time criticality and CD3.
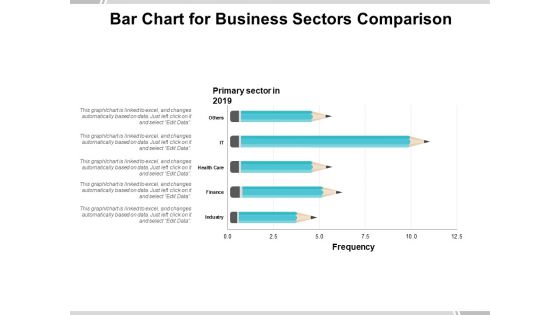
Bar Chart For Business Sectors Comparison Ppt PowerPoint Presentation Professional Guide
Presenting this set of slides with name bar chart for business sectors comparison ppt powerpoint presentation professional guide. The topics discussed in these slides are education, growth, pencil bar graph. This is a completely editable PowerPoint presentation and is available for immediate download. Download now and impress your audience.

B2b E Commerce Platform Comparison Ppt PowerPoint Presentation Infographics Graphics Cpb
Presenting this set of slides with name b2b e commerce platform comparison ppt powerpoint presentation infographics graphics cpb. This is a three stage process. The stages in this process are marketing, business, management, planning, strategy. This is a completely editable PowerPoint presentation and is available for immediate download. Download now and impress your audience.
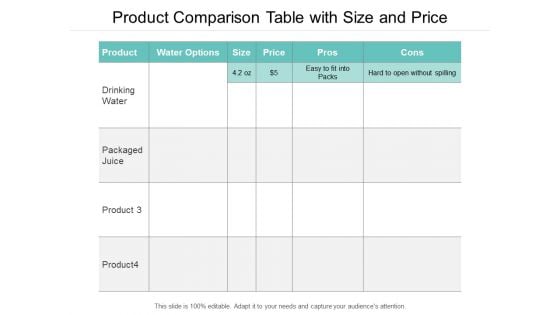
Product Comparison Table With Size And Price Ppt PowerPoint Presentation Slides Graphics Design
Presenting this set of slides with name product comparison table with size and price ppt powerpoint presentation slides graphics design. The topics discussed in these slides are solution options pros and cons, analyze business opportunities, innovative problem. This is a completely editable PowerPoint presentation and is available for immediate download. Download now and impress your audience.

Social Media Advertising Comparison Vs Other Advertising Platforms Ppt PowerPoint Presentation Outline Example
Presenting this set of slides with name social media advertising comparison vs other advertising platforms ppt powerpoint presentation outline example. The topics discussed in these slides are marketing, business, management, planning, strategy. This is a completely editable PowerPoint presentation and is available for immediate download. Download now and impress your audience.
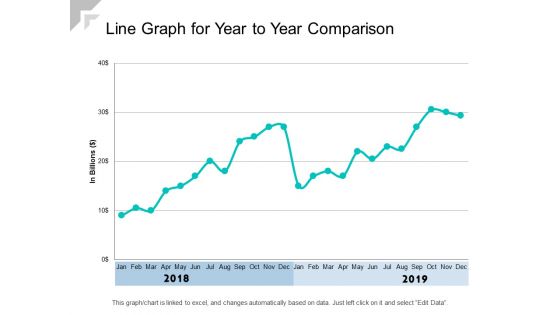
Line Graph For Year To Year Comparison Ppt PowerPoint Presentation Show Graphics Example
Presenting this set of slides with name line graph for year to year comparison ppt powerpoint presentation show graphics example. The topics discussed in these slides are revenue trend, bar chart, financial. This is a completely editable PowerPoint presentation and is available for immediate download. Download now and impress your audience.
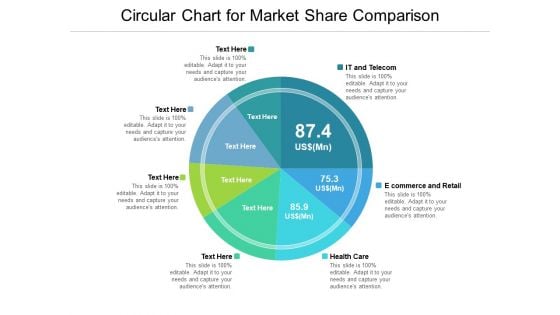
Circular Chart For Market Share Comparison Ppt Powerpoint Presentation Outline Skills
Presenting this set of slides with name circular chart for market share comparison ppt powerpoint presentation outline skills. The topics discussed in these slides are customer communication, customer service, customer satisfaction. This is a completely editable PowerPoint presentation and is available for immediate download. Download now and impress your audience.


 Continue with Email

 Home
Home


