Compare Chart
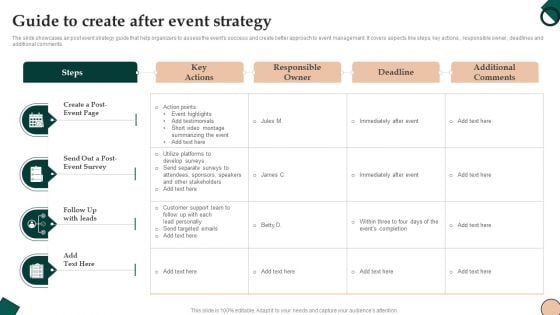
Guide To Create After Event Strategy Diagrams PDF
The slide showcases an post event strategy guide that help organizers to assess the events success and create better approach to event management. It covers aspects like steps, key actions, responsible owner, deadlines and additional comments. Showcasing this set of slides titled Guide To Create After Event Strategy Diagrams PDF. The topics addressed in these templates are Responsible Owner, Deadline, Additional Comments. All the content presented in this PPT design is completely editable. Download it and make adjustments in color, background, font etc. as per your unique business setting.
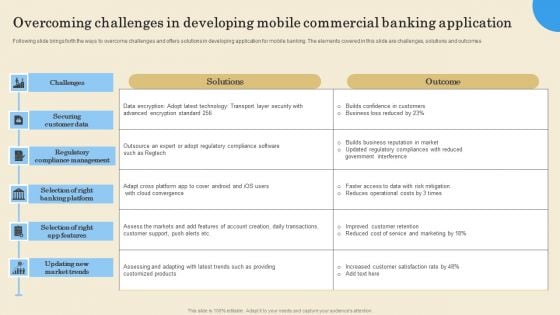
Overcoming Challenges In Developing Mobile Commercial Banking Application Diagrams PDF
Following slide brings forth the ways to overcome challenges and offers solutions in developing application for mobile banking. The elements covered in this slide are challenges, solutions and outcomes. Showcasing this set of slides titled Overcoming Challenges In Developing Mobile Commercial Banking Application Diagrams PDF. The topics addressed in these templates are Regulatory Compliance Management, Securing Customer Data, Updating New Market Trends. All the content presented in this PPT design is completely editable. Download it and make adjustments in color, background, font etc. as per your unique business setting.
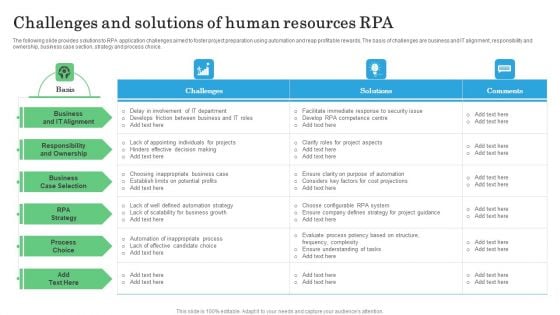
Challenges And Solutions Of Human Resources RPA Diagrams PDF
The following slide provides solutions to RPA application challenges aimed to foster project preparation using automation and reap profitable rewards. The basis of challenges are business and IT alignment, responsibility and ownership, business case section, strategy and process choice. Pitch your topic with ease and precision using this Challenges And Solutions Of Human Resources RPA Diagrams PDF. This layout presents information on Basis, Challenges, Solutions . It is also available for immediate download and adjustment. So, changes can be made in the color, design, graphics or any other component to create a unique layout.
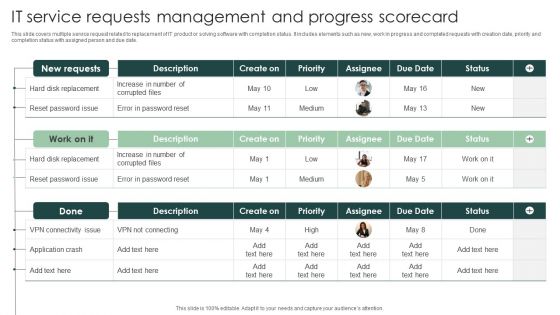
IT Service Requests Management And Progress Scorecard Diagrams PDF
This slide covers multiple service request related to replacement of IT product or solving software with completion status. It includes elements such as new, work in progress and completed requests with creation date, priority and completion status with assigned person and due date.Showcasing this set of slides titled IT Service Requests Management And Progress Scorecard Diagrams PDF. The topics addressed in these templates are Application Crash, Priority, Assignee. All the content presented in this PPT design is completely editable. Download it and make adjustments in color, background, font etc. as per your unique business setting.
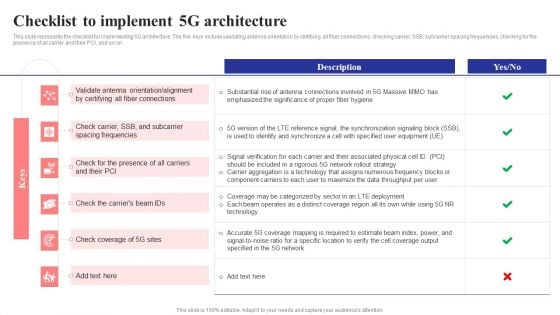
Checklist To Implement 5G Architecture 5G Network Structure Diagrams PDF
This slide represents the checklist for implementing 5G architecture. The five keys include validating antenna orientation by certifying all fiber connections, checking carrier, SSB, subcarrier spacing frequencies, checking for the presence of all carrier and their PCI, and so on.From laying roadmaps to briefing everything in detail, our templates are perfect for you. You can set the stage with your presentation slides. All you have to do is download these easy-to-edit and customizable templates. Checklist To Implement 5G Architecture 5G Network Structure Diagrams PDF will help you deliver an outstanding performance that everyone would remember and praise you for. Do download this presentation today.
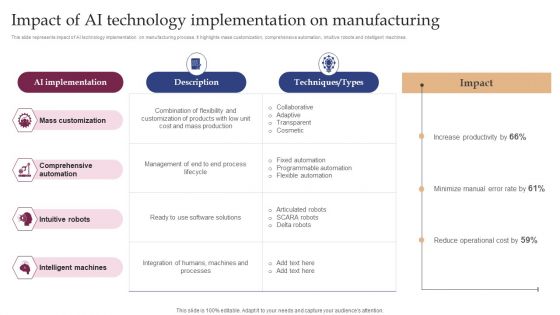
Impact Of AI Technology Implementation On Manufacturing Diagrams PDF
This slide represents impact of AI technology implementation on manufacturing process. It highlights mass customization, comprehensive automation, intuitive robots and intelligent machines. If your project calls for a presentation, then Slidegeeks is your go-to partner because we have professionally designed, easy-to-edit templates that are perfect for any presentation. After downloading, you can easily edit Impact Of AI Technology Implementation On Manufacturing Diagrams PDF and make the changes accordingly. You can rearrange slides or fill them with different images. Check out all the handy templates
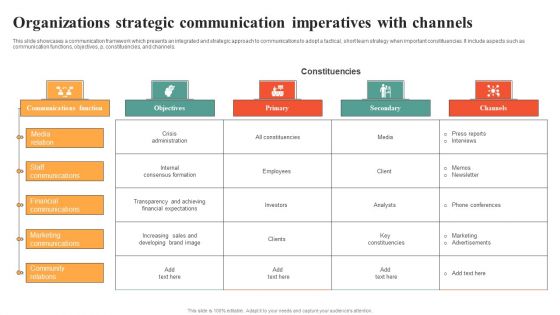
Organizations Strategic Communication Imperatives With Channels Diagrams PDF
This slide showcases a communication framework which presents an integrated and strategic approach to communications to adopt a tactical, short team strategy when important constituencies. It include aspects such as communication functions, objectives, p, constituencies, and channels. Pitch your topic with ease and precision using this Organizations Strategic Communication Imperatives With Channels Diagrams PDF This layout presents information on Communications Function, Objectives, Primary. It is also available for immediate download and adjustment. So, changes can be made in the color, design, graphics or any other component to create a unique layout.
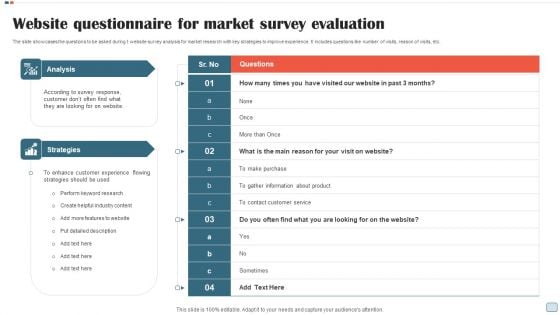
Website Questionnaire For Market Survey Evaluation Diagrams PDF
The slide showcases the questions to be asked during t website survey analysis for market research with key strategies to improve experience. It includes questions like number of visits, reason of visits, etc. Pitch your topic with ease and precision using this Website Questionnaire For Market Survey Evaluation Diagrams PDF. This layout presents information on Analysis, Survey Response, Strategies, Perform, Industry Content. It is also available for immediate download and adjustment. So, changes can be made in the color, design, graphics or any other component to create a unique layout.
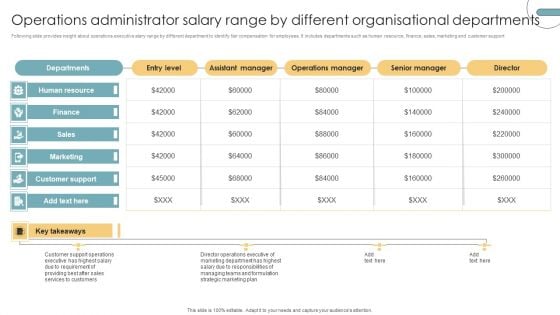
Operations Administrator Salary Range By Different Organisational Departments Diagrams PDF
Following slide provides insight about operations executive alary range by different department to identify fair compensation for employees. It includes departments such as human resource, finance, sales, marketing and customer support. Showcasing this set of slides titled Operations Administrator Salary Range By Different Organisational Departments Diagrams PDF. The topics addressed in these templates are Human Resource, Finance, Sales, Marketing, Customer Support. All the content presented in this PPT design is completely editable. Download it and make adjustments in color, background, font etc. as per your unique business setting.
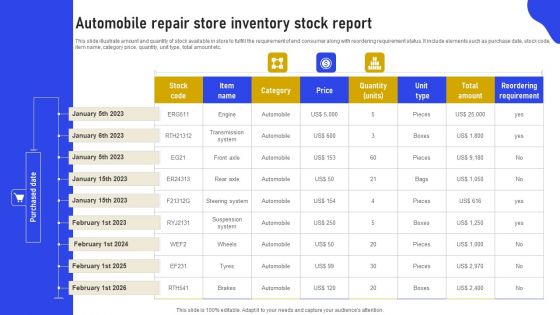
Automobile Repair Store Inventory Stock Report Diagrams PDF
This slide illustrate amount and quantity of stock available in store to fulfill the requirement of end consumer along with reordering requirement status. It include elements such as purchase date, stock code, item name, category price, quantity, unit type, total amount etc. Pitch your topic with ease and precision using this Automobile Repair Store Inventory Stock Report Diagrams PDF. This layout presents information on Stock Code, Category, Price. It is also available for immediate download and adjustment. So, changes can be made in the color, design, graphics or any other component to create a unique layout.
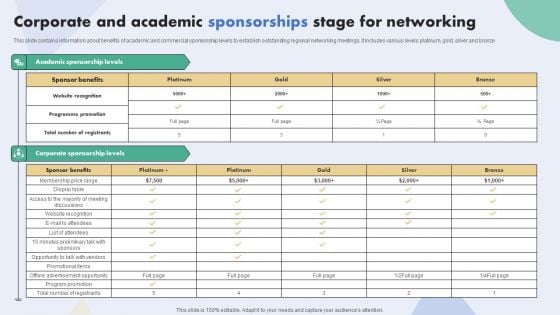
Corporate And Academic Sponsorships Stage For Networking Diagrams PDF
This slide contains information about benefits of academic and commercial sponsorship levels to establish outstanding regional networking meetings. It includes various levels platinum, gold, silver and bronze. Pitch your topic with ease and precision using this Corporate And Academic Sponsorships Stage For Networking Diagrams PDF. This layout presents information on Academic Sponsorship Levels, Corporate Sponsorship Levels. It is also available for immediate download and adjustment. So, changes can be made in the color, design, graphics or any other component to create a unique layout.
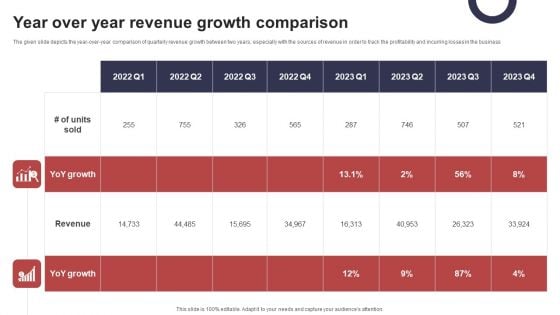
Year Over Year Revenue Growth Comparison Diagrams PDF
The given slide depicts the year over year comparison of quarterly revenue growth between two years, especially with the sources of revenue in order to track the profitability and incurring losses in the business. Showcasing this set of slides titled Year Over Year Revenue Growth Comparison Diagrams PDF. The topics addressed in these templates are Year Over Year, Revenue Growth, Comparison. All the content presented in this PPT design is completely editable. Download it and make adjustments in color, background, font etc. as per your unique business setting.
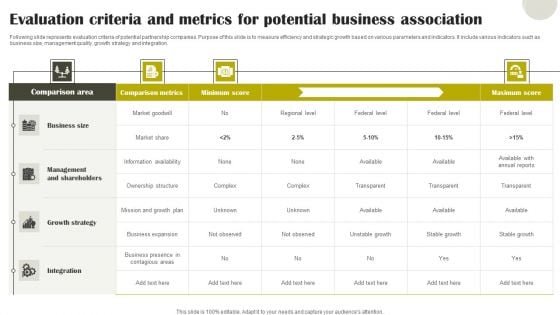
Evaluation Criteria And Metrics For Potential Business Association Diagrams PDF
Following slide represents evaluation criteria of potential partnership companies. Purpose of this slide is to measure efficiency and strategic growth based on various parameters and indicators. It include various indicators such as business size, management quality, growth strategy and integration. Showcasing this set of slides titled Evaluation Criteria And Metrics For Potential Business Association Diagrams PDF. The topics addressed in these templates are Growth Strategy, Management And Shareholders, Business Size. All the content presented in this PPT design is completely editable. Download it and make adjustments in color, background, font etc. as per your unique business setting.
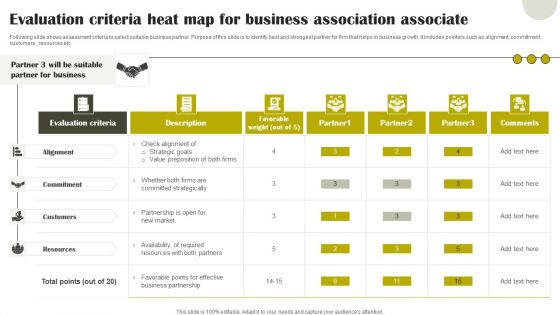
Evaluation Criteria Heat Map For Business Association Associate Diagrams PDF
Following slide shows assessment criteria to select suitable business partner. Purpose of this slide is to identify best and strongest partner for firm that helps in business growth. It includes pointers such as alignment, commitment, customers , resources etc. Pitch your topic with ease and precision using this Evaluation Criteria Heat Map For Business Association Associate Diagrams PDF. This layout presents information on Evaluation Criteria, Resources, Business Partnership. It is also available for immediate download and adjustment. So, changes can be made in the color, design, graphics or any other component to create a unique layout.
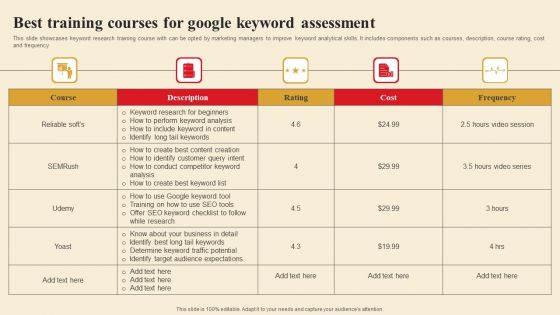
Best Training Courses For Google Keyword Assessment Diagrams PDF
This slide showcases keyword research training course with can be opted by marketing managers to improve keyword analytical skills. It includes components such as courses, description, course rating, cost and frequency. Showcasing this set of slides titled Best Training Courses For Google Keyword Assessment Diagrams PDF. The topics addressed in these templates are Keyword Analysis, Traffic Potential, Determine. All the content presented in this PPT design is completely editable. Download it and make adjustments in color, background, font etc. as per your unique business setting.
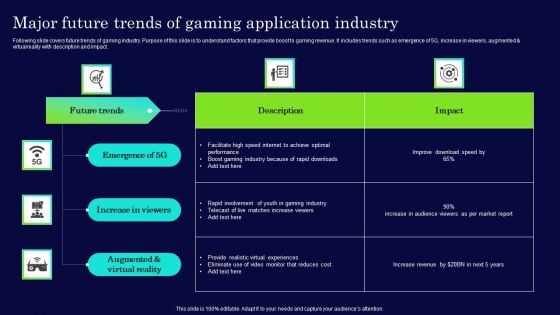
Major Future Trends Of Gaming Application Industry Diagrams PDF
Following slide covers future trends of gaming industry. Purpose of this slide is to understand factors that provide boost to gaming revenue. It includes trends such as emergence of 5G, increase in viewers, augmented and virtualreality with description and impact. Pitch your topic with ease and precision using this Major Future Trends Of Gaming Application Industry Diagrams PDF. This layout presents information on Major Future Trends, Gaming Application Industry. It is also available for immediate download and adjustment. So, changes can be made in the color, design, graphics or any other component to create a unique layout.
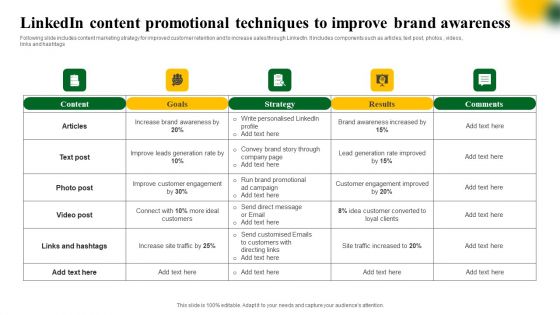
Linkedin Content Promotional Techniques To Improve Brand Awareness Diagrams PDF
Following slide includes content marketing strategy for improved customer retention and to increase sales through LinkedIn. It includes components such as articles, text post, photos , videos,links and hashtags. Pitch your topic with ease and precision using this Linkedin Content Promotional Techniques To Improve Brand Awareness Diagrams PDF. This layout presents information on Brand Awareness, Goals, Strategy. It is also available for immediate download and adjustment. So, changes can be made in the color, design, graphics or any other component to create a unique layout.
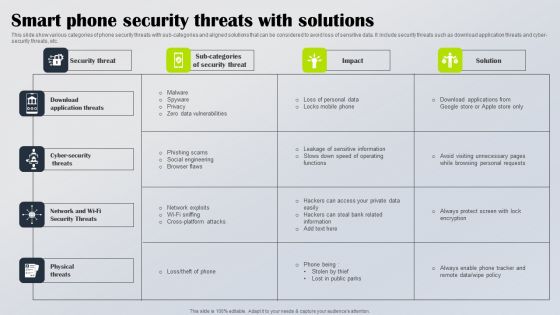
Smart Phone Security Threats With Solutions Diagrams PDF
This slide show various categories of phone security threats with sub categories and aligned solutions that can be considered to avoid loss of sensitive data. It include security threats such as download application threats and cyber security threats, etc. Showcasing this set of slides titled Smart Phone Security Threats With Solutions Diagrams PDF. The topics addressed in these templates are Download Application Threats, Cyber Security Threats, Network Wi Fi Security Threats. All the content presented in this PPT design is completely editable. Download it and make adjustments in color, background, font etc. as per your unique business setting.
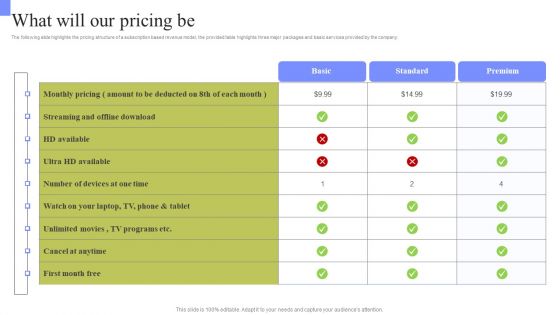
Periodic Revenue Model What Will Our Pricing Be Diagrams PDF
The following slide highlights the pricing structure of a subscription based revenue model, the provided table highlights three major packages and basic services provided by the company. Present like a pro with Periodic Revenue Model What Will Our Pricing Be Diagrams PDF Create beautiful presentations together with your team, using our easy to use presentation slides. Share your ideas in real time and make changes on the fly by downloading our templates. So whether you are in the office, on the go, or in a remote location, you can stay in sync with your team and present your ideas with confidence. With Slidegeeks presentation got a whole lot easier. Grab these presentations today.
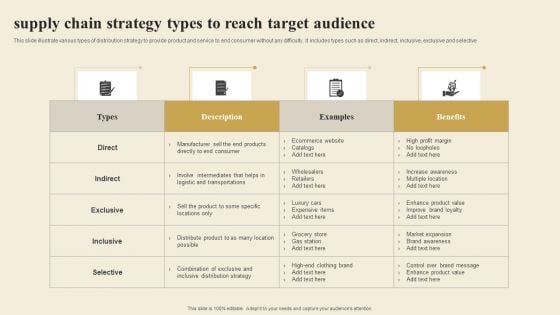
Supply Chain Strategy Types To Reach Target Audience Diagrams PDF
This slide illustrate various types of distribution strategy to provide product and service to end consumer without any difficulty. It includes types such as direct, indirect, inclusive, exclusive and selective. Pitch your topic with ease and precision using this Supply Chain Strategy Types To Reach Target Audience Diagrams PDF. This layout presents information on Direct, Indirect, Exclusive. It is also available for immediate download and adjustment. So, changes can be made in the color, design, graphics or any other component to create a unique layout.
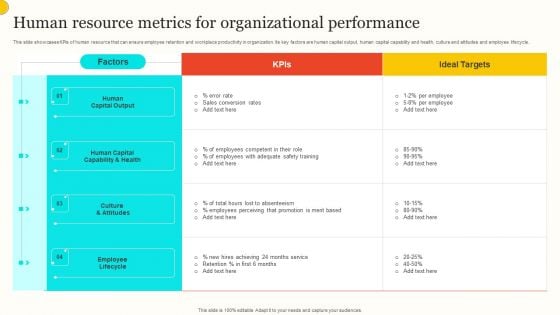
Human Resource Metrics For Organizational Performance Diagrams PDF
This slide showcases KPIs of human resource that can ensure employee retention and workplace productivity in organization. Its key factors are human capital output, human capital capability and health, culture and attitudes and employee lifecycle. Showcasing this set of slides titled Human Resource Metrics For Organizational Performance Diagrams PDF. The topics addressed in these templates are Human Capital Output, Human Capital Capability Health, Culture Attitudes. All the content presented in this PPT design is completely editable. Download it and make adjustments in color, background, font etc. as per your unique business setting.
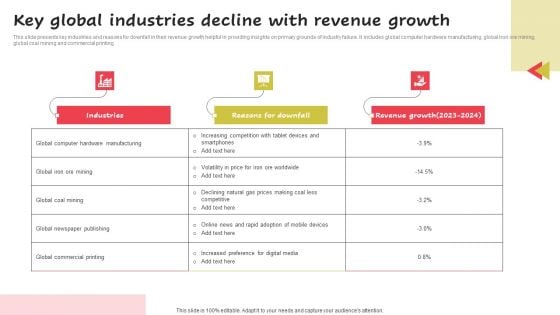
Key Global Industries Decline With Revenue Growth Diagrams PDF
This slide presents key industries and reasons for downfall in their revenue growth helpful in providing insights on primary grounds of industry failure. It includes global computer hardware manufacturing, global iron ore mining, global coal mining and commercial printing. Showcasing this set of slides titled Key Global Industries Decline With Revenue Growth Diagrams PDF. The topics addressed in these templates are Industries, Reasons Downfall, Revenue Growth. All the content presented in this PPT design is completely editable. Download it and make adjustments in color, background, font etc. as per your unique business setting.
Booting Brand Image By Tracking KPI Metrics Diagrams PDF
This slide consists of key performance indicators to be used by mangers to track the brand awareness . Key metrices covered are content reach, brand mention, blog shares, search volume data, repeat purchase and organic traffic. Showcasing this set of slides titled Booting Brand Image By Tracking KPI Metrics Diagrams PDF. The topics addressed in these templates are Content Reach, Brand Mentions, Blog Shares. All the content presented in this PPT design is completely editable. Download it and make adjustments in color, background, font etc. as per your unique business setting.

Investment Opportunities To Reduce Carbon Footprint Diagrams PDF
This slide presents major investment opportunities that can be used by managers operating within different business segments to reduce their carbon footprint. Major business segments covered are agriculture, food processing, transport, etc. Showcasing this set of slides titled Investment Opportunities To Reduce Carbon Footprint Diagrams PDF. The topics addressed in these templates are Agriculture, Food Processing, Transport. All the content presented in this PPT design is completely editable. Download it and make adjustments in color, background, font etc. as per your unique business setting.
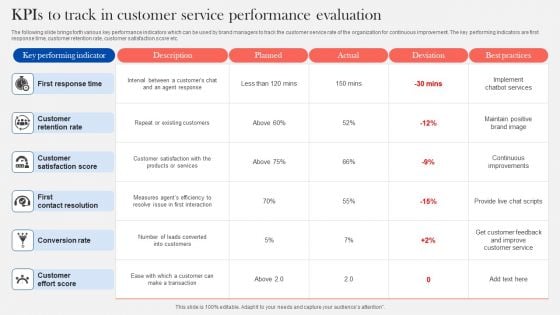
Kpis To Track In Customer Service Performance Evaluation Diagrams PDF
The following slide brings forth various key performance indicators which can be used by brand managers to track the customer service rate of the organization for continuous improvement. The key performing indicators are first response time, customer retention rate, customer satisfaction score etc. Showcasing this set of slides titled Kpis To Track In Customer Service Performance Evaluation Diagrams PDF. The topics addressed in these templates are First Response Time, Customer Retention Rate, Customer Satisfaction Score. All the content presented in this PPT design is completely editable. Download it and make adjustments in color, background, font etc. as per your unique business setting.
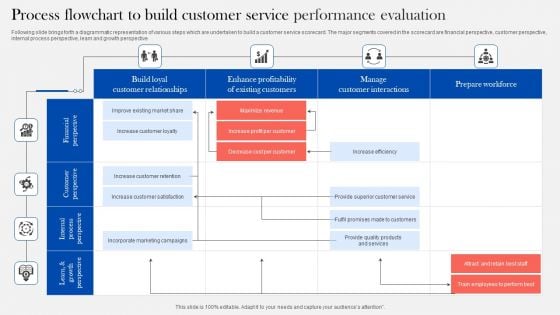
Process Flowchart To Build Customer Service Performance Evaluation Diagrams PDF
Following slide brings forth a diagrammatic representation of various steps which are undertaken to build a customer service scorecard. The major segments covered in the scorecard are financial perspective, customer perspective, internal process perspective, learn and growth perspective , Showcasing this set of slides titled Process Flowchart To Build Customer Service Performance Evaluation Diagrams PDF. The topics addressed in these templates are Internal Process Perspective, Customer Perspective, Financial Perspective. All the content presented in this PPT design is completely editable. Download it and make adjustments in color, background, font etc. as per your unique business setting.
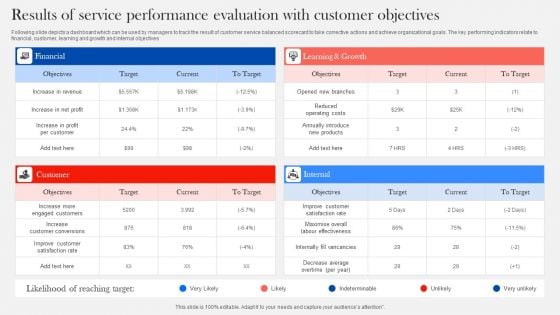
Results Of Service Performance Evaluation With Customer Objectives Diagrams PDF
Following slide depicts a dashboard which can be used by managers to track the result of customer service balanced scorecard to take corrective actions and achieve organizational goals. The key performing indicators relate to financial, customer, learning and growth and internal objectives. Showcasing this set of slides titled Results Of Service Performance Evaluation With Customer Objectives Diagrams PDF. The topics addressed in these templates are Financial, Customer, Internal. All the content presented in this PPT design is completely editable. Download it and make adjustments in color, background, font etc. as per your unique business setting.
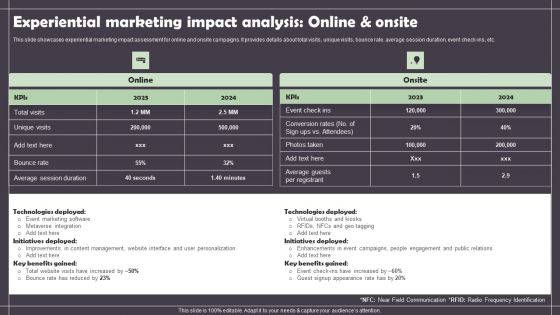
Experiential Marketing Impact Analysis Online And Onsite Diagrams PDF
This slide showcases experiential marketing impact assessment for online and onsite campaigns. It provides details about total visits, unique visits, bounce rate, average session duration, event check-ins, etc. From laying roadmaps to briefing everything in detail, our templates are perfect for you. You can set the stage with your presentation slides. All you have to do is download these easy to edit and customizable templates. Experiential Marketing Impact Analysis Online And Onsite Diagrams PDF will help you deliver an outstanding performance that everyone would remember and praise you for. Do download this presentation today.
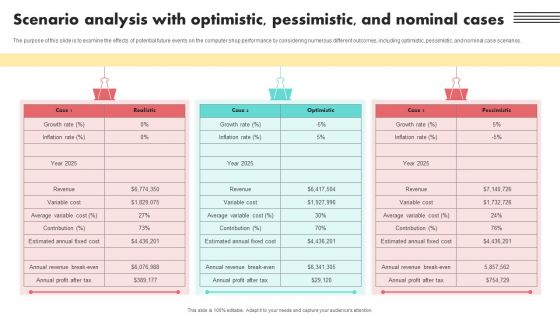
Scenario Analysis With Optimistic Pessimistic And Nominal Cases Diagrams PDF
The purpose of this slide is to examine the effects of potential future events on the computer shop performance by considering numerous different outcomes, including optimistic, pessimistic, and nominal case scenarios. Slidegeeks is one of the best resources for PowerPoint templates. You can download easily and regulate Scenario Analysis With Optimistic Pessimistic And Nominal Cases Diagrams PDF for your personal presentations from our wonderful collection. A few clicks is all it takes to discover and get the most relevant and appropriate templates. Use our Templates to add a unique zing and appeal to your presentation and meetings. All the slides are easy to edit and you can use them even for advertisement purposes.
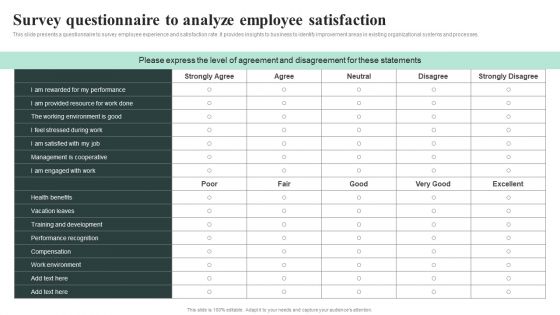
Survey Questionnaire To Analyze Employee Satisfaction Diagrams PDF
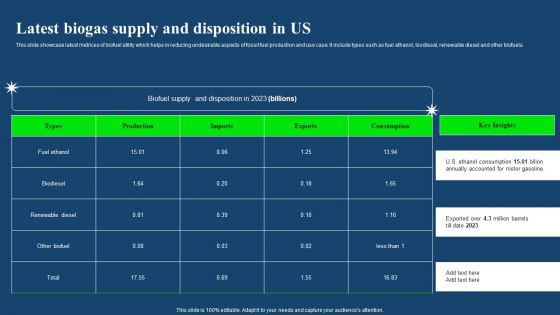
Latest Biogas Supply And Disposition In US Diagrams PDF
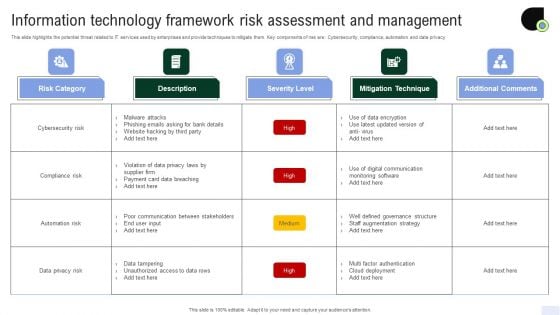
Information Technology Framework Risk Assessment And Management Diagrams PDF
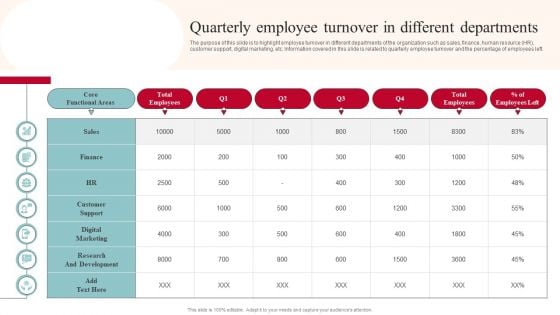
Quarterly Employee Turnover In Different Departments Diagrams PDF
The purpose of this slide is to highlight employee turnover in different departments of the organization such as sales, finance, human resource HR, customer support, digital marketing, etc. Information covered in this slide is related to quarterly employee turnover and the percentage of employees left. From laying roadmaps to briefing everything in detail, our templates are perfect for you. You can set the stage with your presentation slides. All you have to do is download these easy to edit and customizable templates. Quarterly Employee Turnover In Different Departments Diagrams PDF will help you deliver an outstanding performance that everyone would remember and praise you for. Do download this presentation today.
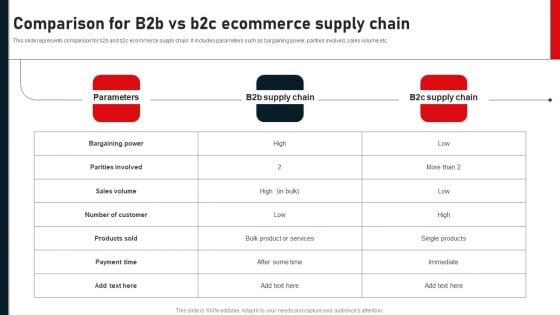
Comparison For B2B Vs B2c Ecommerce Supply Chain Diagrams PDF
This slide represents comparison for b2b and b2c ecommerce supply chain. It includes parameters such as bargaining power, parities involved, sales volume etc. This Comparison For B2B Vs B2c Ecommerce Supply Chain Diagrams PDF is perfect for any presentation, be it in front of clients or colleagues. It is a versatile and stylish solution for organizing your meetings. The product features a modern design for your presentation meetings. The adjustable and customizable slides provide unlimited possibilities for acing up your presentation. Slidegeeks has done all the homework before launching the product for you. So, do not wait, grab the presentation templates today
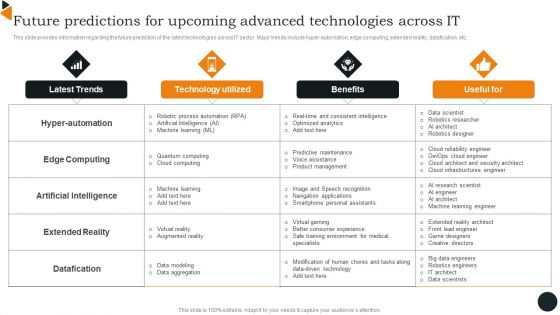
Future Predictions For Upcoming Advanced Technologies Across IT Diagrams PDF
This slide provides information regarding the future prediction of the latest technologies across IT sector. Major trends include hyper-automation, edge computing, extended reality, datafication, etc. Want to ace your presentation in front of a live audience Our Future Predictions For Upcoming Advanced Technologies Across IT Diagrams PDF can help you do that by engaging all the users towards you. Slidegeeks experts have put their efforts and expertise into creating these impeccable powerpoint presentations so that you can communicate your ideas clearly. Moreover, all the templates are customizable, and easy to edit and downloadable. Use these for both personal and commercial use.
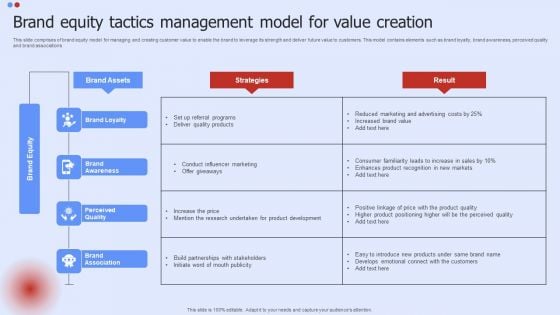
Brand Equity Tactics Management Model For Value Creation Diagrams PDF
This slide comprises of brand equity model for managing and creating customer value to enable the brand to leverage its strength and deliver future value to customers. This model contains elements such as brand loyalty, brand awareness, perceived quality and brand associations. Showcasing this set of slides titled Brand Equity Tactics Management Model For Value Creation Diagrams PDF. The topics addressed in these templates are Brand Loyalty, Brand Awareness, Perceived Quality. All the content presented in this PPT design is completely editable. Download it and make adjustments in color, background, font etc. as per your unique business setting.
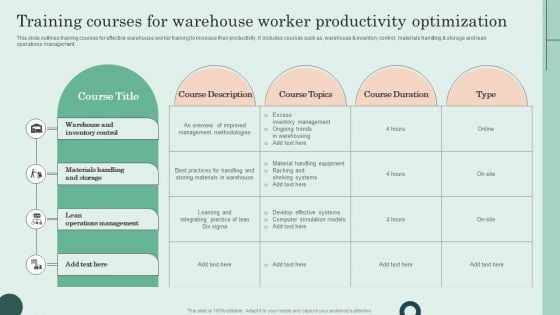
Training Courses For Warehouse Worker Productivity Optimization Diagrams PDF
This slide outlines training courses for effective warehouse worker training to increase their productivity. It includes courses such as, warehouse and inventory control, materials handling and storage and lean operations management. The best PPT templates are a great way to save time, energy, and resources. Slidegeeks have 100 percent editable powerpoint slides making them incredibly versatile. With these quality presentation templates, you can create a captivating and memorable presentation by combining visually appealing slides and effectively communicating your message. Download Training Courses For Warehouse Worker Productivity Optimization Diagrams PDF from Slidegeeks and deliver a wonderful presentation.
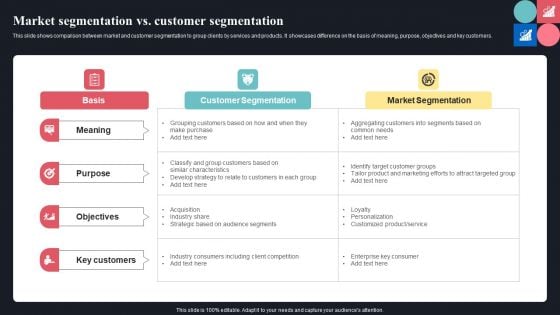
Market Segmentation Vs Customer Segmentation Ppt Styles Diagrams PDF
This slide shows comparison between market and customer segmentation to group clients by services and products. It showcases difference on the basis of meaning, purpose, objectives and key customers. Want to ace your presentation in front of a live audience Our Market Segmentation Vs Customer Segmentation Ppt Styles Diagrams PDF can help you do that by engaging all the users towards you. Slidegeeks experts have put their efforts and expertise into creating these impeccable powerpoint presentations so that you can communicate your ideas clearly. Moreover, all the templates are customizable, and easy to edit and downloadable. Use these for both personal and commercial use.
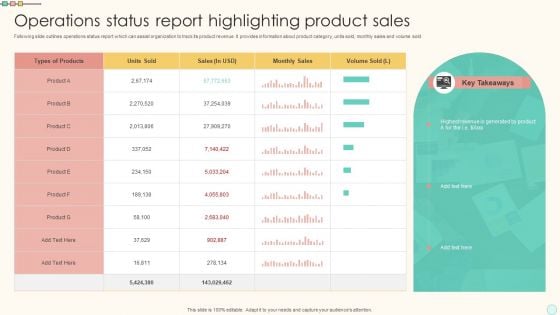
Operations Status Report Highlighting Product Sales Diagrams PDF
Following slide outlines operations status report which can assist organization to track its product revenue. It provides information about product category, units sold, monthly sales and volume sold. Pitch your topic with ease and precision using this Operations Status Report Highlighting Product Sales Diagrams PDF. This layout presents information on Operations Status Report, Highlighting Product Sales. It is also available for immediate download and adjustment. So, changes can be made in the color, design, graphics or any other component to create a unique layout.
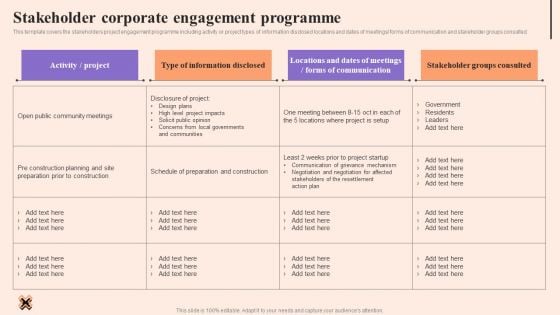
Corporate Communication Strategy Stakeholder Corporate Engagement Programme Diagrams PDF
This template covers the stakeholders project engagement programme including activity or project types of information disclosed locations and dates of meetings forms of communication and stakeholder groups consulted Present like a pro with Corporate Communication Strategy Stakeholder Corporate Engagement Programme Diagrams PDF Create beautiful presentations together with your team, using our easy-to-use presentation slides. Share your ideas in real-time and make changes on the fly by downloading our templates. So whether you are in the office, on the go, or in a remote location, you can stay in sync with your team and present your ideas with confidence. With Slidegeeks presentation got a whole lot easier. Grab these presentations today.
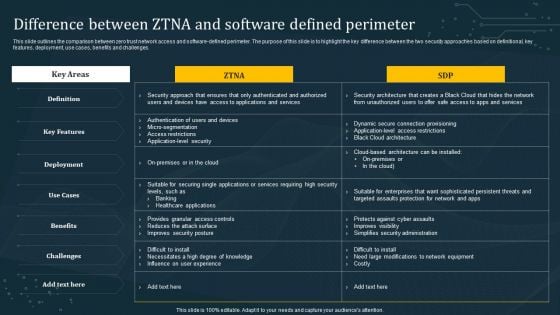
Difference Between ZTNA And Software Defined Perimeter Diagrams PDF
This slide outlines the comparison between zero trust network access and software-defined perimeter. The purpose of this slide is to highlight the key difference between the two security approaches based on definitional, key features, deployment, use cases, benefits and challenges. Make sure to capture your audiences attention in your business displays with our gratis customizable Difference Between ZTNA And Software Defined Perimeter Diagrams PDF. These are great for business strategies, office conferences, capital raising or task suggestions. If you desire to acquire more customers for your tech business and ensure they stay satisfied, create your own sales presentation with these plain slides.
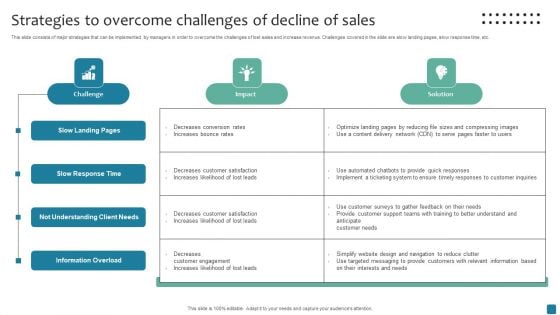
Strategies To Overcome Challenges Of Decline Of Sales Diagrams PDF
This slide consists of major strategies that can be implemented by managers in order to overcome the challenges of lost sales and increase revenue. Challenges covered in the slide are slow landing pages, slow response time, etc. Showcasing this set of slides titled Strategies To Overcome Challenges Of Decline Of Sales Diagrams PDF. The topics addressed in these templates are Challenge, Impact, Solution. All the content presented in this PPT design is completely editable. Download it and make adjustments in color, background, font etc. as per your unique business setting.
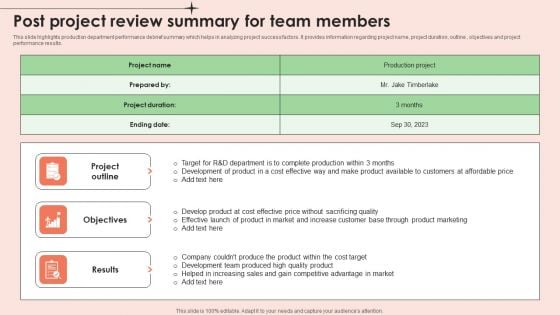
Post Project Review Summary For Team Members Diagrams PDF
This slide highlights production department performance debrief summary which helps in analyzing project success factors. It provides information regarding project name, project duration, outline , objectives and project performance results. Showcasing this set of slides titled Post Project Review Summary For Team Members Diagrams PDF. The topics addressed in these templates are Increase Customer, Sacrificing Quality, Develop Product. All the content presented in this PPT design is completely editable. Download it and make adjustments in color, background, font etc. as per your unique business setting.
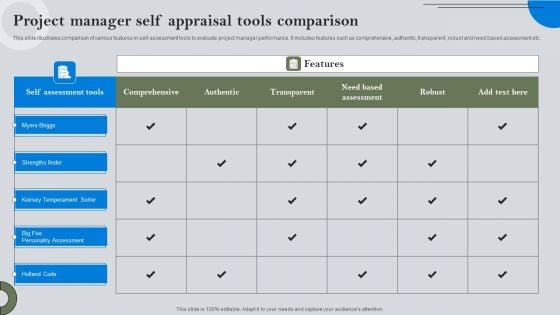
Project Manager Self Appraisal Tools Comparison Diagrams PDF
This slide illustrates comparison of various features in self-assessment tools to evaluate project manager performance. It includes features such as comprehensive, authentic, transparent, robust and need based assessment etc. Showcasing this set of slides titled Project Manager Self Appraisal Tools Comparison Diagrams PDF. The topics addressed in these templates are Myers Briggs, Strengths Finder, Keirsey Temperament Sorter. All the content presented in this PPT design is completely editable. Download it and make adjustments in color, background, font etc. as per your unique business setting.
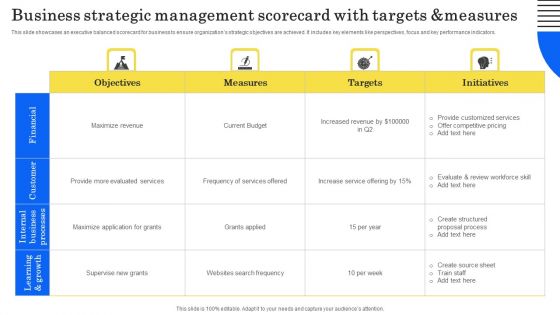
Business Strategic Management Scorecard With Targets And Measures Diagrams PDF
This slide showcases an executive balanced scorecard for business to ensure organizations strategic objectives are achieved. It includes key elements like perspectives, focus and key performance indicators. Showcasing this set of slides titled Business Strategic Management Scorecard With Targets And Measures Diagrams PDF. The topics addressed in these templates are Provide Customized Services, Offer Competitive Pricing, Grants Applied. All the content presented in this PPT design is completely editable. Download it and make adjustments in color, background, font etc. as per your unique business setting.
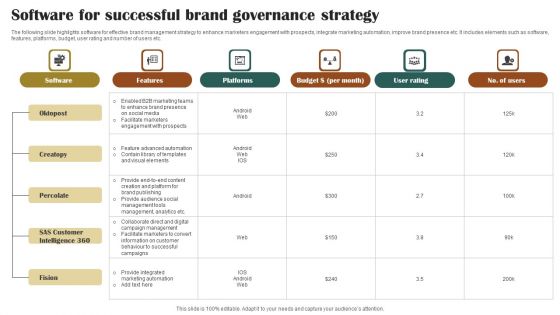
Software For Successful Brand Governance Strategy Diagrams PDF
The following slide highlights software for effective brand management strategy to enhance marketers engagement with prospects, integrate marketing automation, improve brand presence etc. It includes elements such as software, features, platforms, budget, user rating and number of users etc. Pitch your topic with ease and precision using this Software For Successful Brand Governance Strategy Diagrams PDF. This layout presents information on Budget, Creatopy, SAS Customer Intelligence. It is also available for immediate download and adjustment. So, changes can be made in the color, design, graphics or any other component to create a unique layout.
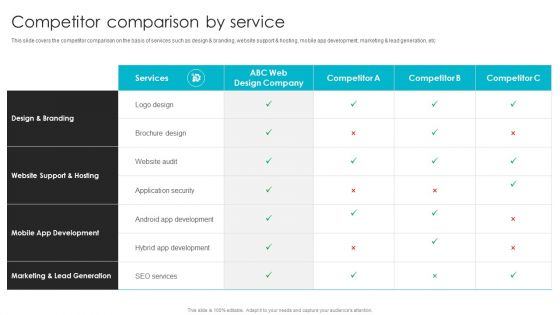
Web Design Company Overview Competitor Comparison By Service Diagrams PDF
This slide covers the competitor comparison on the basis of services such as design and branding, website support and hosting, mobile app development, marketing and lead generation, etc. Are you in need of a template that can accommodate all of your creative concepts This one is crafted professionally and can be altered to fit any style. Use it with Google Slides or PowerPoint. Include striking photographs, symbols, depictions, and other visuals. Fill, move around, or remove text boxes as desired. Test out color palettes and font mixtures. Edit and save your work, or work with colleagues. Download Web Design Company Overview Competitor Comparison By Service Diagrams PDF and observe how to make your presentation outstanding. Give an impeccable presentation to your group and make your presentation unforgettable.
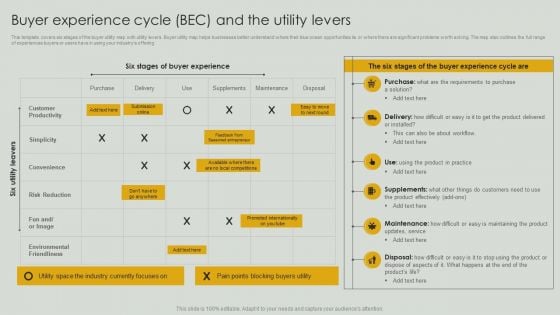
Buyer Experience Cycle BEC And The Utility Levers Diagrams PDF
This template covers six stages of the buyer utility map with utility levers. Buyer utility map helps businesses better understand where their blue ocean opportunities lie or where there are significant problems worth solving. The map also outlines the full range of experiences buyers or users have in using your industrys offering. Make sure to capture your audiences attention in your business displays with our gratis customizable Buyer Experience Cycle BEC And The Utility Levers Diagrams PDF. These are great for business strategies, office conferences, capital raising or task suggestions. If you desire to acquire more customers for your tech business and ensure they stay satisfied, create your own sales presentation with these plain slides.
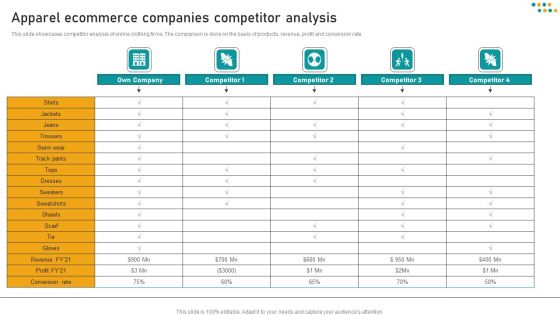
E Commerce Business Apparel Ecommerce Companies Competitor Analysis Diagrams PDF
This slide showcases competitor analysis of online clothing firms. The comparison is done on the basis of products, revenue, profit and conversion rate. Coming up with a presentation necessitates that the majority of the effort goes into the content and the message you intend to convey. The visuals of a PowerPoint presentation can only be effective if it supplements and supports the story that is being told. Keeping this in mind our experts created E Commerce Business Apparel Ecommerce Companies Competitor Analysis Diagrams PDF to reduce the time that goes into designing the presentation. This way, you can concentrate on the message while our designers take care of providing you with the right template for the situation.
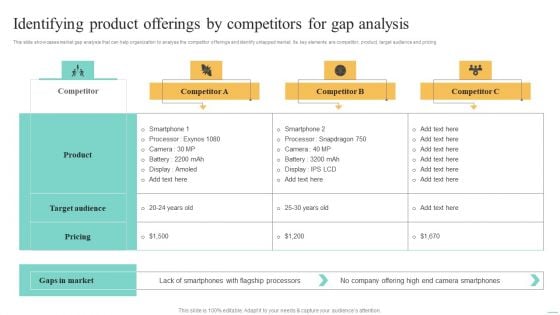
Price Leadership Technique Identifying Product Offerings Diagrams PDF
This slide showcases market gap analysis that can help organization to analyse the competitor offerings and identify untapped market. Its key elements are competitor, product, target audience and pricing. Coming up with a presentation necessitates that the majority of the effort goes into the content and the message you intend to convey. The visuals of a PowerPoint presentation can only be effective if it supplements and supports the story that is being told. Keeping this in mind our experts created Price Leadership Technique Identifying Product Offerings Diagrams PDF to reduce the time that goes into designing the presentation. This way, you can concentrate on the message while our designers take care of providing you with the right template for the situation.
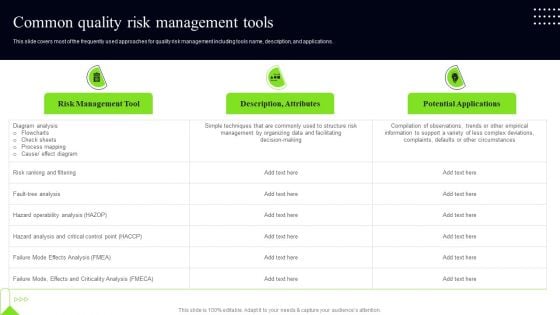
Quality Assessment Common Quality Risk Management Tools Diagrams PDF
This slide covers most of the frequently used approaches for quality risk management including tools name, description, and applications. Are you in need of a template that can accommodate all of your creative concepts This one is crafted professionally and can be altered to fit any style. Use it with Google Slides or PowerPoint. Include striking photographs, symbols, depictions, and other visuals. Fill, move around, or remove text boxes as desired. Test out color palettes and font mixtures. Edit and save your work, or work with colleagues. Download Quality Assessment Common Quality Risk Management Tools Diagrams PDF and observe how to make your presentation outstanding. Give an impeccable presentation to your group and make your presentation unforgettable.
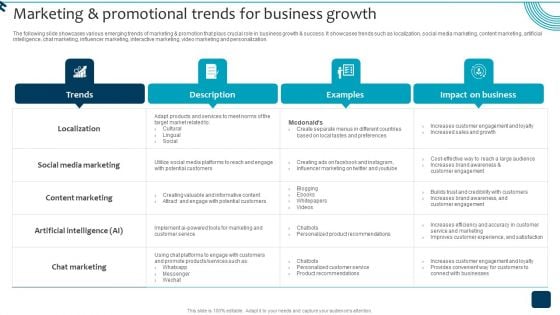
Marketing And Promotional Trends For Business Growth Diagrams PDF
The following slide showcases various emerging trends of marketing and promotion that plays crucial role in business growth and success. It showcases trends such as localization, social media marketing, content marketing, artificial intelligence, chat marketing, influencer marketing, interactive marketing, video marketing and personalization. This Marketing And Promotional Trends For Business Growth Diagrams PDF from Slidegeeks makes it easy to present information on your topic with precision. It provides customization options, so you can make changes to the colors, design, graphics, or any other component to create a unique layout. It is also available for immediate download, so you can begin using it right away. Slidegeeks has done good research to ensure that you have everything you need to make your presentation stand out. Make a name out there for a brilliant performance.
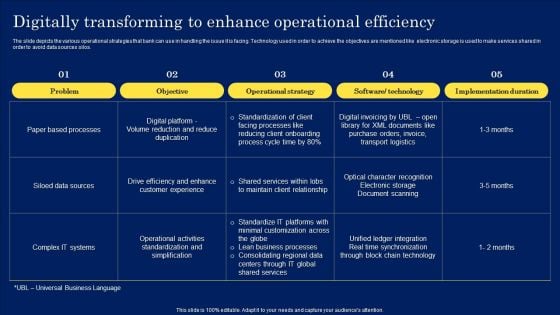
Digitally Transforming To Enhance Operational Efficiency Diagrams PDF
The slide depicts the various operational strategies that bank can use in handling the issue it is facing. Technology used in order to achieve the objectives are mentioned like electronic storage is used to make services shared in order to avoid data sources silos. Boost your pitch with our creative Digitally Transforming To Enhance Operational Efficiency Diagrams PDF. Deliver an awe inspiring pitch that will mesmerize everyone. Using these presentation templates you will surely catch everyones attention. You can browse the ppts collection on our website. We have researchers who are experts at creating the right content for the templates. So you do not have to invest time in any additional work. Just grab the template now and use them.
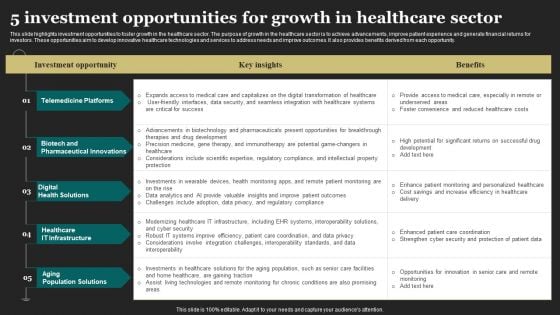
5 Investment Opportunities For Growth In Healthcare Sector Diagrams PDF
This slide highlights investment opportunities to foster growth in the healthcare sector. The purpose of growth in the healthcare sector is to achieve advancements, improve patient experience and generate financial returns for investors. These opportunities aim to develop innovative healthcare technologies and services to address needs and improve outcomes. It also provides benefits derived from each opportunity. Showcasing this set of slides titled 5 Investment Opportunities For Growth In Healthcare Sector Diagrams PDF. The topics addressed in these templates are Biotech And Pharmaceutical Innovations, Potential, Cyber Security. All the content presented in this PPT design is completely editable. Download it and make adjustments in color, background, font etc. as per your unique business setting.
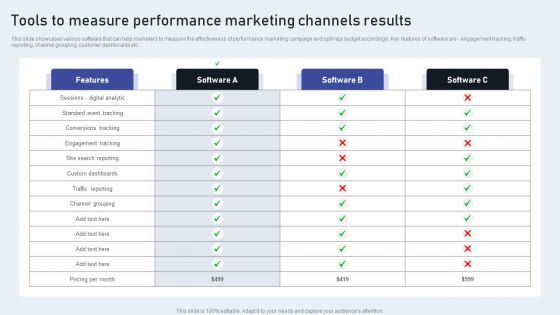
Tools To Measure Performance Marketing Channels Results Diagrams PDF
This slide showcases various software that can help marketers to measure the effectiveness of performance marketing campaign and optimize budget accordingly. Key features of software are - engagement tracking, traffic reporting, channel grouping, customer dashboards etc. The Tools To Measure Performance Marketing Channels Results Diagrams PDF is a compilation of the most recent design trends as a series of slides. It is suitable for any subject or industry presentation, containing attractive visuals and photo spots for businesses to clearly express their messages. This template contains a variety of slides for the user to input data, such as structures to contrast two elements, bullet points, and slides for written information. Slidegeeks is prepared to create an impression.
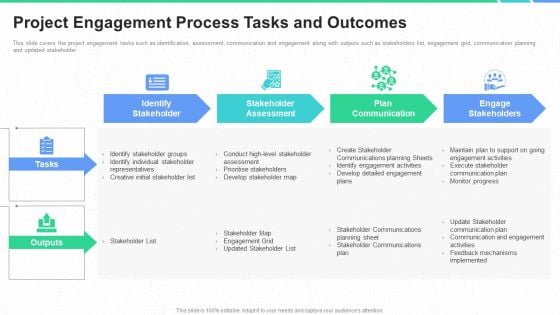
Stakeholders Participation Project Development Process Project Engagement Process Tasks And Outcomes Formats PDF
This slide covers the project engagement tasks such as identification, assessment, communication and engagement along with outputs such as stakeholders list, engagement grid, communication planning and updated stakeholder. Deliver an awe inspiring pitch with this creative stakeholders participation project development process project engagement process tasks and outcomes formats pdf bundle. Topics like develop stakeholder map, stakeholder list, stakeholder assessment, plan communication engage, stakeholders can be discussed with this completely editable template. It is available for immediate download depending on the needs and requirements of the user.
Managing Brand Equity Across Geographic Boundaries Market Segments And Cultures Icons PDF
This slide outlines a plan to help the organization manage brand equity across cultures, markets, and geographies. It includes aspects such as strategy, actions, and impact. Retrieve professionally designed Managing Brand Equity Across Geographic Boundaries Market Segments And Cultures Icons PDF to effectively convey your message and captivate your listeners. Save time by selecting pre-made slideshows that are appropriate for various topics, from business to educational purposes. These themes come in many different styles, from creative to corporate, and all of them are easily adjustable and can be edited quickly. Access them as PowerPoint templates or as Google Slides themes. You do not have to go on a hunt for the perfect presentation because Slidegeeks got you covered from everywhere.
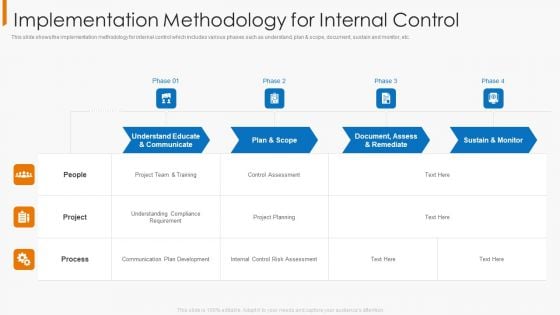
Implementation Methodology For Internal Control Introduction PDF
This slide shows the implementation methodology for internal control which includes various phases such as understand, plan and scope, document, sustain and monitor, etc. Deliver and pitch your topic in the best possible manner with this implementation methodology for internal control introduction pdf. Use them to share invaluable insights on project planning, plan, requirement, project team and impress your audience. This template can be altered and modified as per your expectations. So, grab it now.
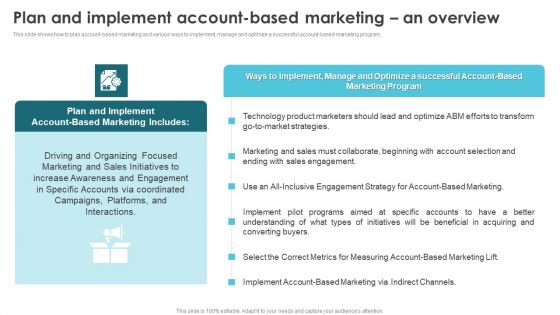
Product Marketing For Generating Plan And Implement Account Based Marketing Sample PDF
This slide shows how to plan account-based marketing and various ways to implement, manage and optimize a successful account-based marketing program. Do you have to make sure that everyone on your team knows about any specific topic I yes, then you should give Product Marketing For Generating Plan And Implement Account Based Marketing Sample PDF a try. Our experts have put a lot of knowledge and effort into creating this impeccable Product Marketing For Generating Plan And Implement Account Based Marketing Sample PDF. You can use this template for your upcoming presentations, as the slides are perfect to represent even the tiniest detail. You can download these templates from the Slidegeeks website and these are easy to edit. So grab these today.
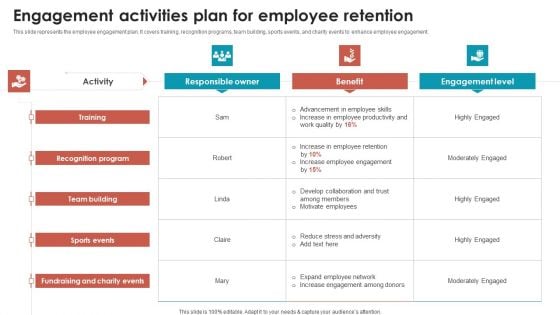
Talent Management Optimization With Workforce Staffing Engagement Activities Plan For Employee Retention Brochure PDF
This slide represents the employee engagement plan. It covers training, recognition programs, team building, sports events, and charity events to enhance employee engagement. Get a simple yet stunning designed Talent Management Optimization With Workforce Staffing Engagement Activities Plan For Employee Retention Brochure PDF. It is the best one to establish the tone in your meetings. It is an excellent way to make your presentations highly effective. So, download this PPT today from Slidegeeks and see the positive impacts. Our easy to edit Talent Management Optimization With Workforce Staffing Engagement Activities Plan For Employee Retention Brochure PDF can be your go to option for all upcoming conferences and meetings. So, what are you waiting for Grab this template today.


 Continue with Email

 Home
Home


