Compare Chart
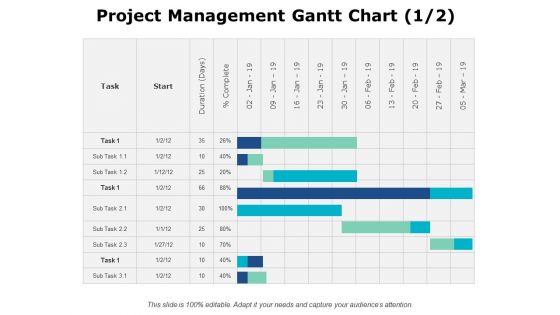
Project Management Gantt Chart Ppt PowerPoint Presentation Infographic Template Background Image
This is a project management gantt chart ppt powerpoint presentation infographic template background image. This is a fourteen stage process. The stages in this process are.
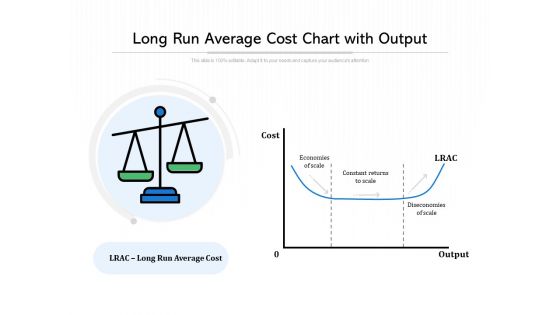
Long Run Average Cost Chart With Output Ppt PowerPoint Presentation Gallery Design Inspiration PDF
Presenting long run average cost chart with output ppt powerpoint presentation gallery design inspiration pdf to dispense important information. This template comprises two stages. It also presents valuable insights into the topics including long run average cost chart with output. This is a completely customizable PowerPoint theme that can be put to use immediately. So, download it and address the topic impactfully
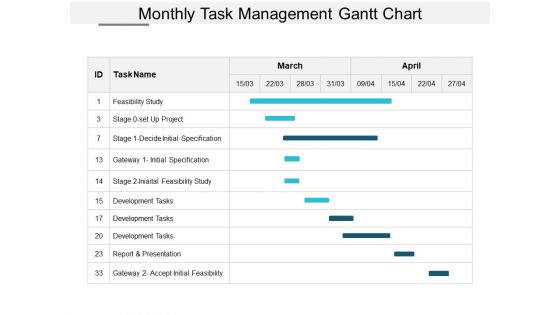
Monthly Task Management Gantt Chart Ppt Powerpoint Presentation Outline Example File
This is a monthly task management gantt chart ppt powerpoint presentation outline example file. This is a three stage process. The stages in this process are new product development, new product launch, introducing new product.
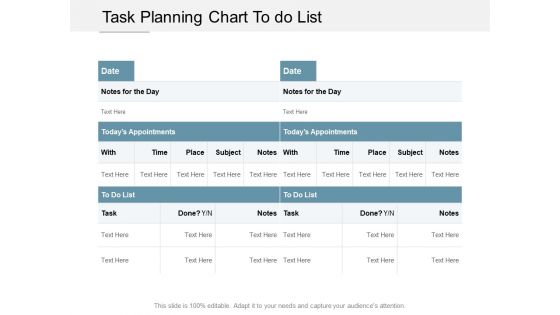
Task Planning Chart To Do List Ppt PowerPoint Presentation Infographics Picture Cpb
This is a task planning chart to do list ppt powerpoint presentation infographics picture cpb. This is a three stage process. The stages in this process are key activities, key highlights, list of activities.
Gantt Chart For Task Planning And Management Ppt PowerPoint Presentation Icon Mockup
This is a gantt chart for task planning and management ppt powerpoint presentation icon mockup. This is a three stage process. The stages in this process are project management software, project management tools, project management techniques.

Task Management Chart With Status Priority Due Date Ppt PowerPoint Presentation Slides Format Ideas Cpb
This is a task management chart with status priority due date ppt powerpoint presentation slides format ideas cpb. This is a six stage process. The stages in this process are key activities, key highlights, list of activities.
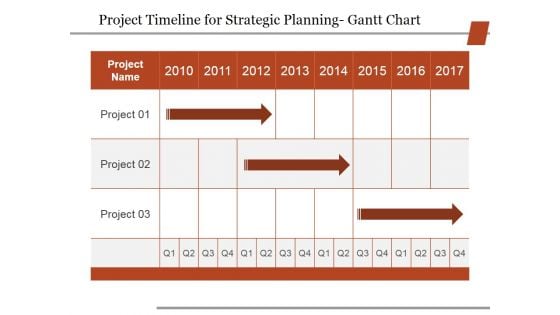
Project Timeline For Strategic Planning Gantt Chart Ppt PowerPoint Presentation Professional Ideas
This is a project timeline for strategic planning gantt chart ppt powerpoint presentation professional ideas. This is a three stage process. The stages in this process are Business, Strategy, Marketing, Analysis, Table.

Gantt Chart For Project Planning Ppt PowerPoint Presentation Slides Design Ideas
This is a gantt chart for project planning ppt powerpoint presentation slides design ideas. This is a three stage process. The stages in this process are project management software, project management tools, project management techniques.
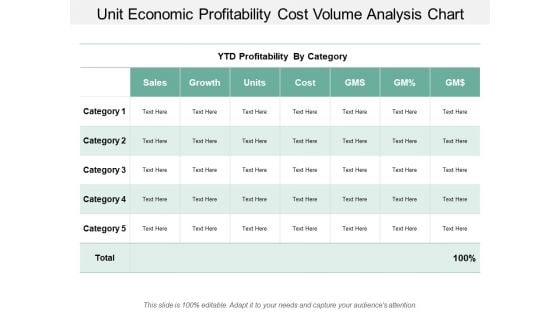
Unit Economic Profitability Cost Volume Analysis Chart Ppt PowerPoint Presentation Styles Graphics Design
This is a unit economic profitability cost volume analysis chart ppt powerpoint presentation styles graphics design. This is a five stage process. The stages in this process are business unit profitability, profitable organization, corporate unit profitability.
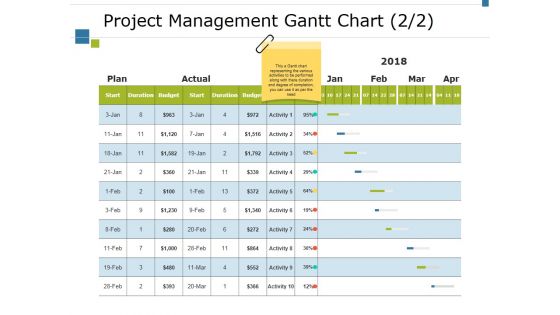
Project Management Gantt Chart Template 1 Ppt PowerPoint Presentation File Design Ideas
This is a project management gantt chart template 1 ppt powerpoint presentation file design ideas. This is a five stage process. The stages in this process are actual, plan, activity, budget, duration.

Project Management Gantt Chart Finance Ppt PowerPoint Presentation File Layout Ideas
This is a project management gantt chart finance ppt powerpoint presentation file layout ideas. This is a three stage process. The stages in this process are business, planning, strategy, marketing, management.
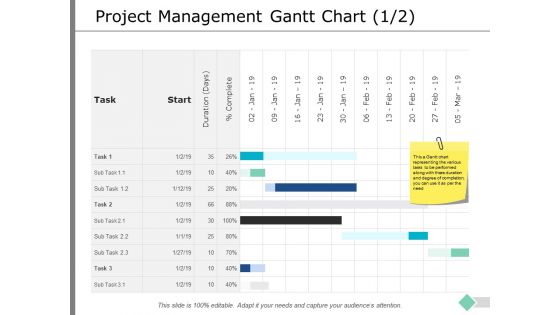
Project Management Gantt Chart Business Ppt PowerPoint Presentation Inspiration Layout Ideas
This is a project management gantt chart business ppt powerpoint presentation inspiration layout ideas. This is a nine stage process. The stages in this process are business, planning, strategy, marketing, management.
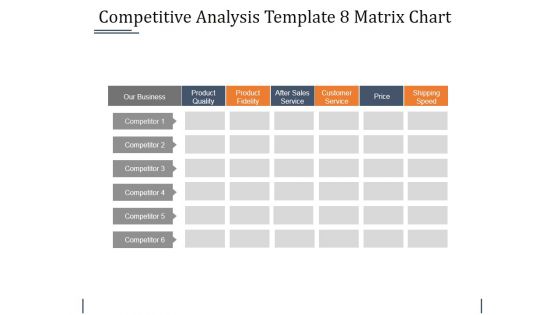
Competitive Analysis Template 8 Matrix Chart Ppt PowerPoint Presentation Show Outfit
This is a competitive analysis template 8 matrix chart ppt powerpoint presentation show outfit. This is a six stage process. The stages in this process are product quality, product fidelity, after sales service, customer service, price, shipping speed.
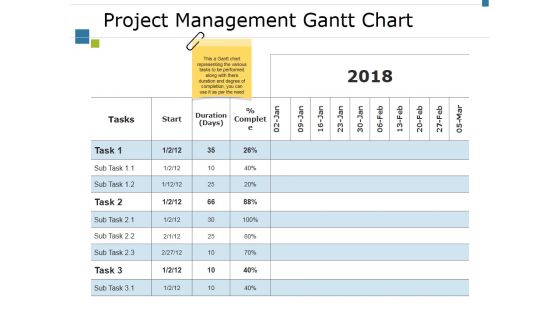
Project Management Gantt Chart Template 2 Ppt PowerPoint Presentation Pictures Outfit
This is a project management gantt chart template 2 ppt powerpoint presentation pictures outfit. This is a three stage process. The stages in this process are start, duration, task, complete, sub task.
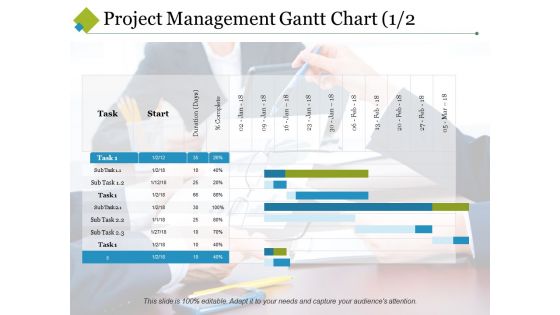
Project Management Gantt Chart Template 1 Ppt PowerPoint Presentation Visual Aids Summary
This is a project management gantt chart template 1 ppt powerpoint presentation visual aids summary. This is a two stage process. The stages in this process are start, task, sub task, duration, complete.
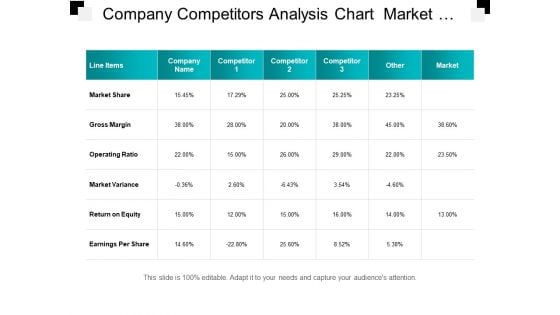
Company Competitors Analysis Chart Market Share And Return On Equity Ppt PowerPoint Presentation Picture
This is a company competitors analysis chart market share and return on equity ppt powerpoint presentation picture. This is a seven stage process. The stages in this process are competitive analysis, benchmark competition, competition landscape.
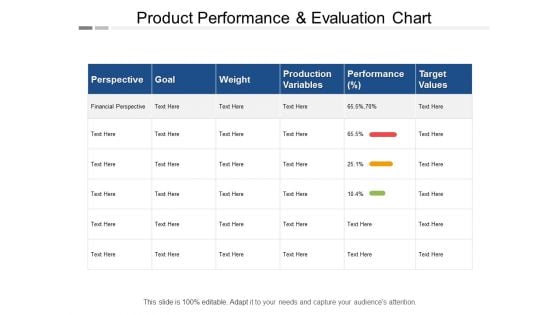
Product Performance And Evaluation Chart Ppt PowerPoint Presentation Pictures Slide Download
This is a product performance and evaluation chart ppt powerpoint presentation pictures slide download. This is a sex stage process. The stages in this process are production management, production performance, production improvement.
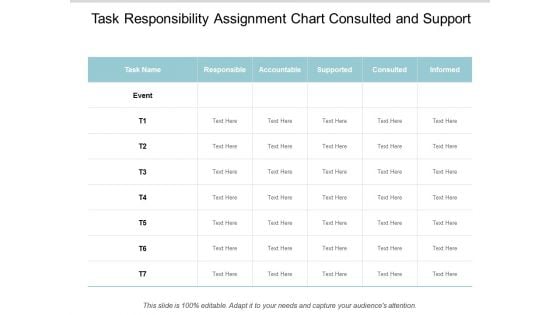
Task Responsibility Assignment Chart Consulted And Support Ppt Powerpoint Presentation Styles Background
This is a task responsibility assignment chart consulted and support ppt powerpoint presentation styles background. This is a seven stage process. The stages in this process are authority matrix, responsibility matrix, leadership matrix.
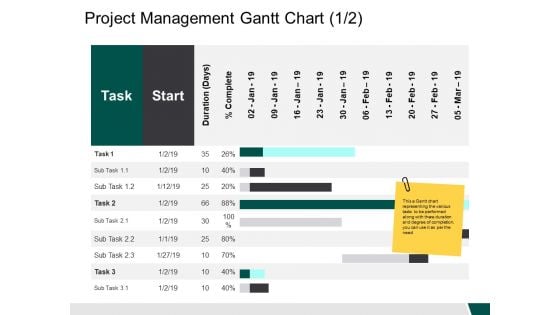
Project Management Gantt Chart Start Ppt PowerPoint Presentation Outline Example Introduction
This is a project management gantt chart start ppt powerpoint presentation outline example introduction. This is a two stage process. The stages in this process are business, management, strategy, analysis, marketing.
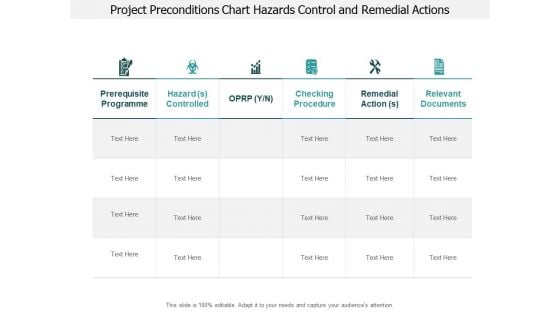
Project Preconditions Chart Hazards Control And Remedial Actions Ppt PowerPoint Presentation Pictures Show
This is a project preconditions chart hazards control and remedial actions ppt powerpoint presentation pictures show. This is a six stage process. The stages in this process are need, requirement, prerequisite.

Comparison Chart Return On Capital Employed Ppt PowerPoint Presentation Portfolio Templates
This is a comparison chart return on capital employed ppt powerpoint presentation portfolio templates. This is a two stage process. The stages in this process are accounting ratio, roce, return on capital employed.
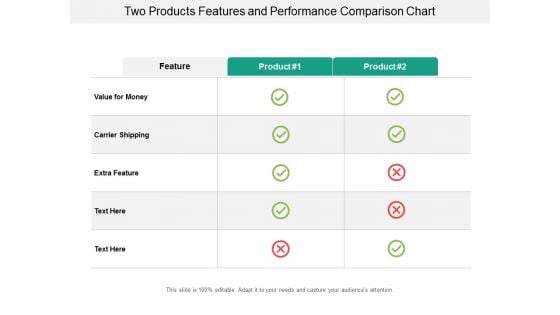
Two Products Features And Performance Comparison Chart Ppt Powerpoint Presentation Ideas Layout Ideas
This is a two products features and performance comparison chart ppt powerpoint presentation ideas layout ideas. This is a two stage process. The stages in this process are product differentiation, product comparison, brand differentiation.
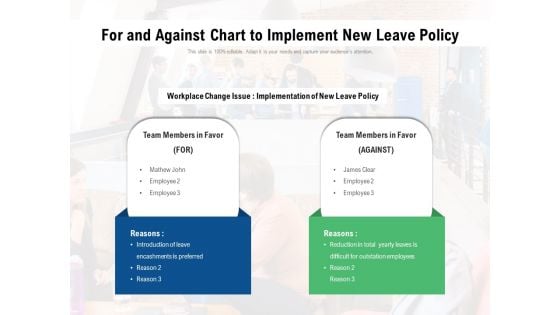
For And Against Chart To Implement New Leave Policy Ppt PowerPoint Presentation File Templates PDF
Presenting for and against chart to implement new leave policy ppt powerpoint presentation file templates pdf to dispense important information. This template comprises two stages. It also presents valuable insights into the topics including for and against chart to implement new leave policy. This is a completely customizable PowerPoint theme that can be put to use immediately. So, download it and address the topic impactfully.
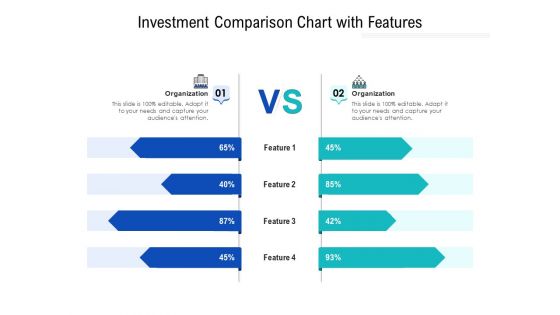
Investment Comparison Chart With Features Ppt PowerPoint Presentation File Structure PDF
Persuade your audience using this investment comparison chart with features ppt powerpoint presentation file structure pdf. This PPT design covers two stages, thus making it a great tool to use. It also caters to a variety of topics including investment comparison chart with features. Download this PPT design now to present a convincing pitch that not only emphasizes the topic but also showcases your presentation skills.

Two Product Comparison Chart With Features Ppt PowerPoint Presentation File Formats PDF
Persuade your audience using this two product comparison chart with features ppt powerpoint presentation file formats pdf. This PPT design covers two stages, thus making it a great tool to use. It also caters to a variety of topics including two product comparison chart with features. Download this PPT design now to present a convincing pitch that not only emphasizes the topic but also showcases your presentation skills.
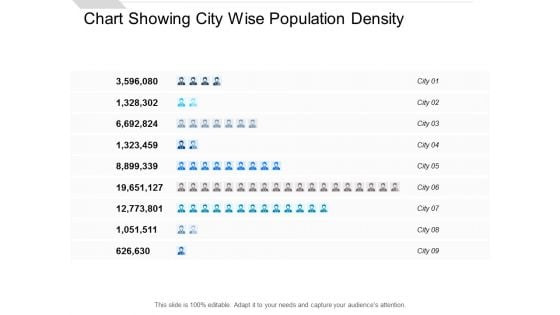
Chart Showing City Wise Population Density Ppt PowerPoint Presentation Infographic Template Slides
Presenting this set of slides with name chart showing city wise population density ppt powerpoint presentation infographic template slides. This is a nine stage process. The stages in this process are people graph, sales performance, population data demographics. This is a completely editable PowerPoint presentation and is available for immediate download. Download now and impress your audience.
Conversion Rate Optimization Funnel Chart With Icons Ppt PowerPoint Presentation Layouts Visual Aids PDF
Presenting this set of slides with name conversion rate optimization funnel chart with icons ppt powerpoint presentation layouts visual aids pdf. This is a two stage process. The stages in this process are conversion optimization, cro. This is a completely editable PowerPoint presentation and is available for immediate download. Download now and impress your audience.
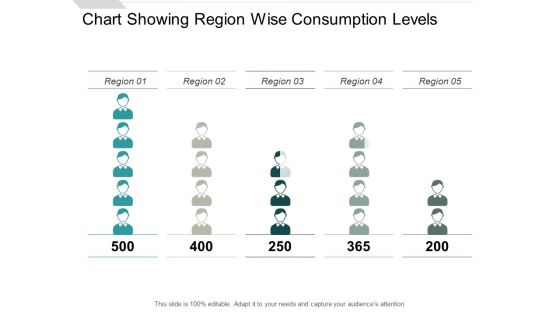
Chart Showing Region Wise Consumption Levels Ppt PowerPoint Presentation Layouts Design Ideas
Presenting this set of slides with name chart showing region wise consumption levels ppt powerpoint presentation layouts design ideas. This is a five stage process. The stages in this process are people graph, sales performance, population data demographics. This is a completely editable PowerPoint presentation and is available for immediate download. Download now and impress your audience.
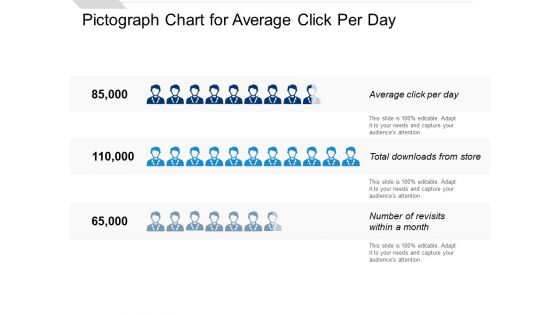
Pictograph Chart For Average Click Per Day Ppt PowerPoint Presentation Slides Format
Presenting this set of slides with name pictograph chart for average click per day ppt powerpoint presentation slides format. This is a three stage process. The stages in this process are people graph, sales performance, population data demographics. This is a completely editable PowerPoint presentation and is available for immediate download. Download now and impress your audience.
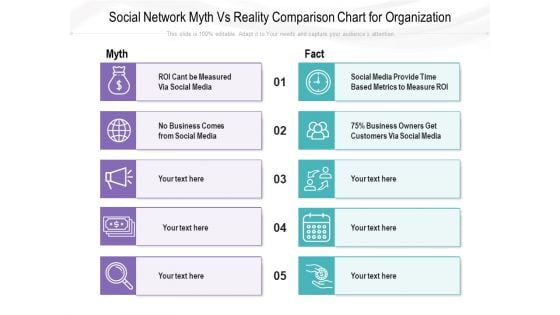
Social Network Myth Vs Reality Comparison Chart For Organization Ppt PowerPoint Presentation File Clipart PDF
Presenting this set of slides with name social network myth vs reality comparison chart for organization ppt powerpoint presentation file clipart pdf. This is a two stage process. The stages in this process are myth, fact. This is a completely editable PowerPoint presentation and is available for immediate download. Download now and impress your audience.
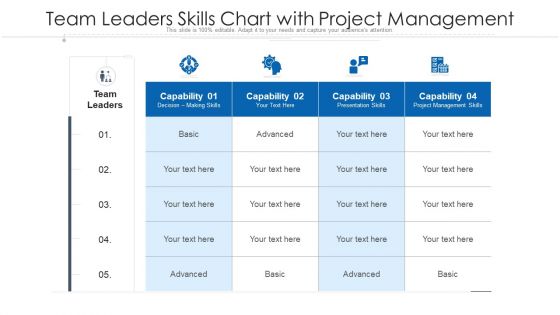
Team Leaders Skills Chart With Project Management Ppt Model Gallery PDF
Pitch your topic with ease and precision using this team leaders skills chart with project management ppt model gallery pdf. This layout presents information on management, capability, presentation. It is also available for immediate download and adjustment. So, changes can be made in the color, design, graphics or any other component to create a unique layout.
Two Mobile Phones Features And Price Comparison Chart Ppt PowerPoint Presentation Icon Show PDF
Persuade your audience using this two mobile phones features and price comparison chart ppt powerpoint presentation icon show pdf. This PPT design covers one stages, thus making it a great tool to use. It also caters to a variety of topics including price, resolution, screen size, storage, battery. Download this PPT design now to present a convincing pitch that not only emphasizes the topic but also showcases your presentation skills.
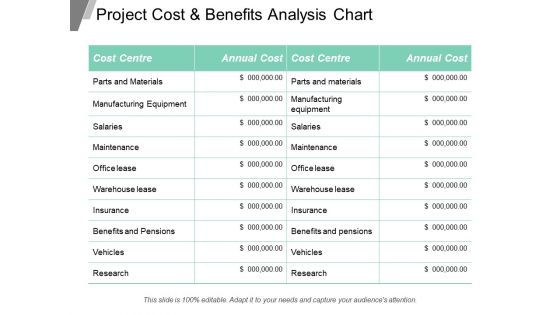
Project Cost And Benefits Analysis Chart Ppt Powerpoint Presentation Inspiration Slideshow
This is a balance scale with cost and benefits ppt powerpoint presentation show. This is a two stage process. The stages in this process are business, finance, marketing, strategy, compare, management.
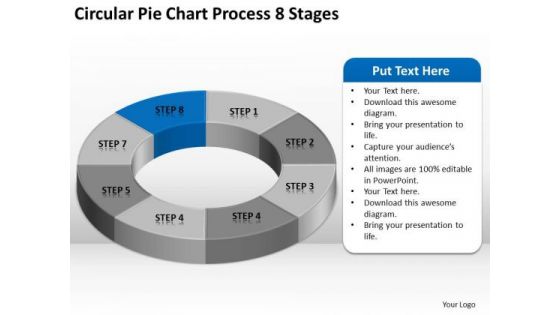
Circular Pie Chart Process 8 Stages Ppt Business Plan Financials PowerPoint Slides
We present our circular pie chart process 8 stages ppt business plan financials PowerPoint Slides.Present our Marketing PowerPoint Templates because Our PowerPoint Templates and Slides come in all colours, shades and hues. They help highlight every nuance of your views. Use our Finance PowerPoint Templates because you should Experience excellence with our PowerPoint Templates and Slides. They will take your breath away. Present our Business PowerPoint Templates because You can Create a matrix with our PowerPoint Templates and Slides. Feel the strength of your ideas click into place. Download our Circle Charts PowerPoint Templates because Our PowerPoint Templates and Slides team portray an attitude of elegance. Personify this quality by using them regularly. Present our Shapes PowerPoint Templates because It is Aesthetically crafted by artistic young minds. Our PowerPoint Templates and Slides are designed to display your dexterity.Use these PowerPoint slides for presentations relating to Chart, Pie, Graph, Vector, 3d, Icon, Diagram, Progress, Business, Circular, Design, Information, Market, Opinion, Corporate, Sign, Symbol, Shadow, Percentage, Graphic, Finance, Data, Element, Drawing, Report, Marketing, Shape, Illustration, Earnings, Number, Strategy, Money, Dimensional, Survey, Growth, Colorful, Global, Account, Part, Investment, Statistic, Financial. The prominent colors used in the PowerPoint template are Blue, Gray, White. Our Circular Pie Chart Process 8 Stages Ppt Business Plan Financials PowerPoint Slides compare to a classic dessert. Your audience will have their cake and eat it too.
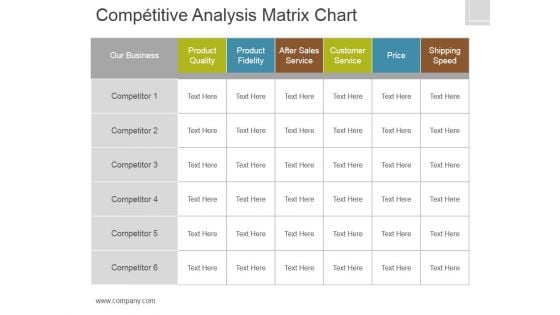
Competitive Analysis Template 8 Matrix Chart Ppt PowerPoint Presentation Designs Download
This is a competitive analysis template 8 matrix chart ppt powerpoint presentation designs download. This is a six stage process. The stages in this process are product quality, product fidelity, after sales service, customer service, price, shipping speed.
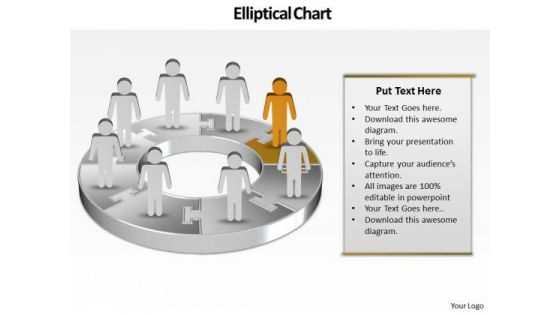
Ppt Team Work Person Presentation Standing Orange Piece Of Chart PowerPoint Templates
PPT team work person presentation standing orange piece of chart PowerPoint Templates-Use this graphical approach to represent global business issues such as financial data, stock market Exchange, increase in sales, corporate presentations and more. Create captivating presentations to deliver comparative and weighted arguments.-PPT team work person presentation standing orange piece of chart PowerPoint Templates-arrow, bar, business, businessman, candidate, cartoon, character, chart, circle, circular, client, communication, company, concept, diagram, finance, financial, flow, growth, human, illustration, increase, information, iteration, man, market, marketing, process, processing, profit, sales, statistics, stats, success, target Bounce back with our Ppt Team Work Person Presentation Standing Orange Piece Of Chart PowerPoint Templates. You will come out on top.
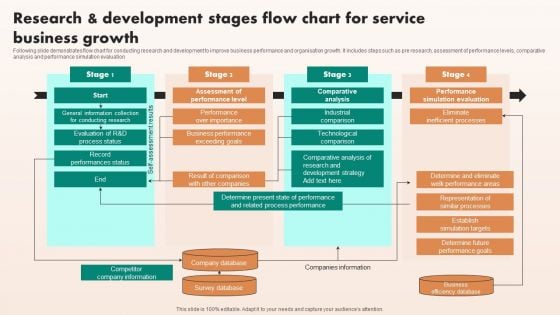
Research And Development Stages Flow Chart For Service Business Growth Sample PDF
Following slide demonstrates flow chart for conducting research and development to improve business performance and organisation growth. It includes steps such as pre research, assessment of performance levels, comparative analysis and performance simulation evaluation. Presenting Research And Development Stages Flow Chart For Service Business Growth Sample PDF to dispense important information. This template comprises four stages. It also presents valuable insights into the topics including Business Efficiency Database, Company Database, Survey Database. This is a completely customizable PowerPoint theme that can be put to use immediately. So, download it and address the topic impactfully.
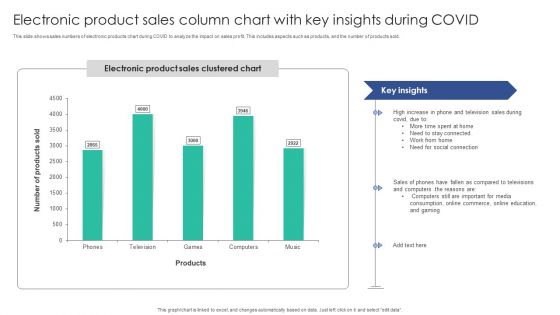
Electronic Product Sales Column Chart With Key Insights During COVID Microsoft PDF
This slide shows sales numbers of electronic products chart during COVID to analyze the impact on sales profit. This includes aspects such as products, and the number of products sold. Pitch your topic with ease and precision using this Electronic Product Sales Column Chart With Key Insights During COVID Microsoft PDF. This layout presents information on Stay Connected, Social Connection, Compared Televisions. It is also available for immediate download and adjustment. So, changes can be made in the color, design, graphics or any other component to create a unique layout.
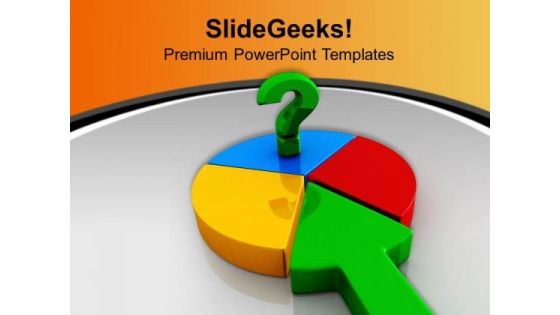
Question On Pie Chart Business PowerPoint Templates And PowerPoint Themes 1012
Deliver amazing Presentations with our above template which contains an image of finnancial diagramme. This image has been professionally designed to emphasize the concept of statistics and finance. This image has been conceived to enable you to emphatically communicate your ideas in your Business PPT presentations showing success, strategy and growth. Create captivating presentations to deliver comparative and weighted arguments. Make a name for yourself with our Question On Pie Chart Business PowerPoint Templates And PowerPoint Themes 1012. You will be at the top of your game.
Food Company Financial Performance Summary Historical Food Product Sales Chart Icons PDF
The following slide shows the comparative sales growth of agricultural products and processed foods. It shows the product sales from more than three decades to assess the change in demand of company products. This Food Company Financial Performance Summary Historical Food Product Sales Chart Icons PDF from Slidegeeks makes it easy to present information on your topic with precision. It provides customization options, so you can make changes to the colors, design, graphics, or any other component to create a unique layout. It is also available for immediate download, so you can begin using it right away. Slidegeeks has done good research to ensure that you have everything you need to make your presentation stand out. Make a name out there for a brilliant performance.
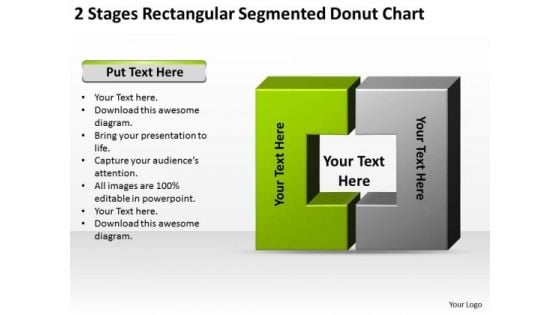
2 Stages Rectangular Segmented Donut Chart Ppt Business Plans Samples PowerPoint Templates
We present our 2 stages rectangular segmented donut chart ppt business plans samples PowerPoint templates.Download our Business PowerPoint Templates because Our PowerPoint Templates and Slides will fulfill your every need. Use them and effectively satisfy the desires of your audience. Use our Success PowerPoint Templates because Our PowerPoint Templates and Slides will Embellish your thoughts. They will help you illustrate the brilliance of your ideas. Download our Shapes PowerPoint Templates because Our PowerPoint Templates and Slides provide you with a vast range of viable options. Select the appropriate ones and just fill in your text. Present our Marketing PowerPoint Templates because You should Bet on your luck with our PowerPoint Templates and Slides. Be assured that you will hit the jackpot. Download our Boxes PowerPoint Templates because It will Raise the bar of your Thoughts. They are programmed to take you to the next level.Use these PowerPoint slides for presentations relating to Abstract, achievement, advertising, attractive, background, banner, bright, brochure, business, choice, clean, compare, concept, creative, design, diagram, element, illustration, management, marketing, modern, process, special, step, symbol, template, text, vector, version, web, website . The prominent colors used in the PowerPoint template are Black, Green, Gray. Achieve productivity improvement with our 2 Stages Rectangular Segmented Donut Chart Ppt Business Plans Samples PowerPoint Templates. They will make you look good.
Optimistic Businessman Business PowerPoint Template 0910
Optimistic or successful business man holding an organizational chart Compare products and services with our Optimistic Businessman Business PowerPoint Template 0910. You will come out on top.
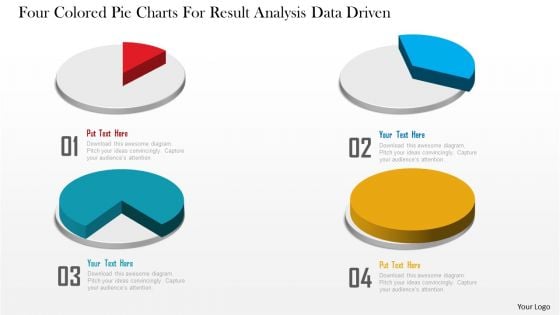
Business Diagram Four Colored Pie Charts For Result Analysis Data Driven PowerPoint Slide
This business diagram displays graphic of pie charts. This business slide is suitable to present and compare business data. Use this diagram to build professional presentations for your viewers.
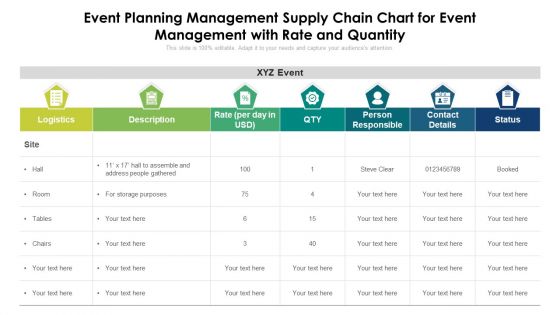
Event Planning Management Supply Chain Chart For Event Management With Rate And Quantity Ppt PowerPoint Presentation File Format PDF
Showcasing this set of slides titled event planning management supply chain chart for event management with rate and quantity ppt powerpoint presentation file format pdf. The topics addressed in these templates are event planning management supply chain chart for event management with rate and quantity. All the content presented in this PPT design is completely editable. Download it and make adjustments in color, background, font etc. as per your unique business setting.
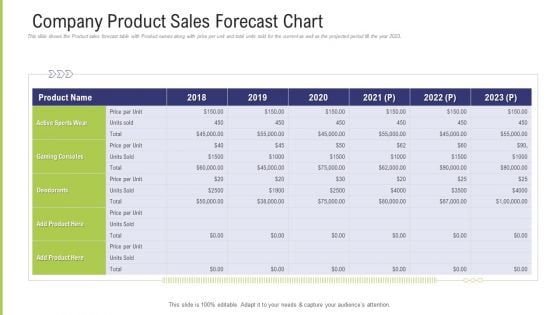
Funding Pitch Deck To Obtain Long Term Debt From Banks Company Product Sales Forecast Chart Clipart PDF
This slide shows the Product sales forecast table with Product names along with price per unit and total units sold for the current as well as the projected period till the year 2023. Deliver and pitch your topic in the best possible manner with this funding pitch deck to obtain long term debt from banks company product sales forecast chart clipart pdf. Use them to share invaluable insights on company product sales forecast chart, 2018 to 2023 and impress your audience. This template can be altered and modified as per your expectations. So, grab it now.
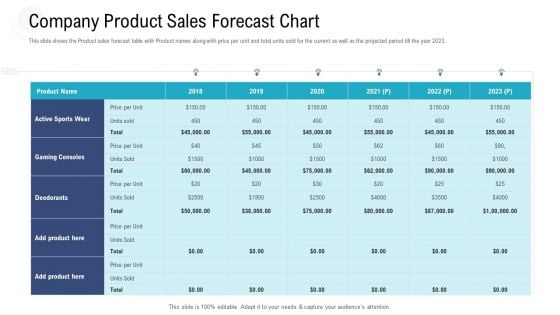
Investor Pitch Deck To Procure Federal Debt From Banks Company Product Sales Forecast Chart Ppt Gallery Ideas PDF
This slide shows the Product sales forecast table with Product names along with price per unit and total units sold for the current as well as the projected period till the year 2023. Deliver and pitch your topic in the best possible manner with this investor pitch deck to procure federal debt from banks company product sales forecast chart ppt gallery ideas pdf. Use them to share invaluable insights on company product sales forecast chart, 2018 to 2023 and impress your audience. This template can be altered and modified as per your expectations. So, grab it now.
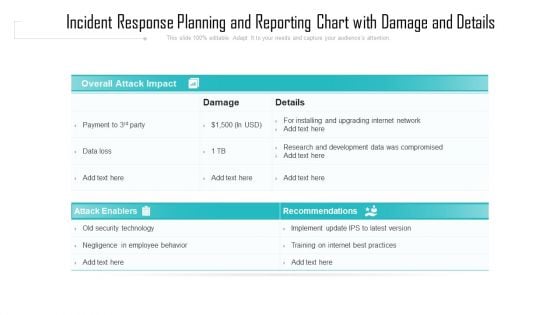
Incident Response Planning And Reporting Chart With Damage And Details Ppt PowerPoint Presentation File Design Templates PDF
Showcasing this set of slides titled incident response planning and reporting chart with damage and details ppt powerpoint presentation file design templates pdf. The topics addressed in these templates are development, training, implement. All the content presented in this PPT design is completely editable. Download it and make adjustments in color, background, font etc. as per your unique business setting.
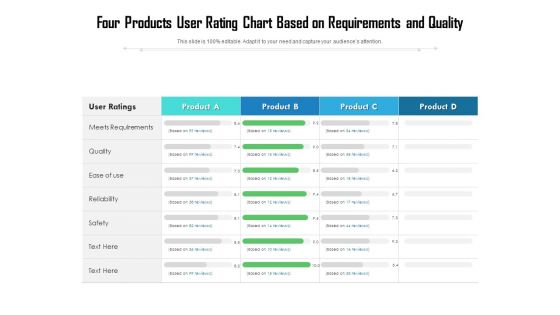
Four Products User Rating Chart Based On Requirements And Quality Ppt PowerPoint Presentation Gallery Slide Download PDF
Showcasing this set of slides titled four products user rating chart based on requirements and quality ppt powerpoint presentation gallery slide download pdf. The topics addressed in these templates are reliability, safety, quality. All the content presented in this PPT design is completely editable. Download it and make adjustments in colour, background, font etc. as per your unique business setting.
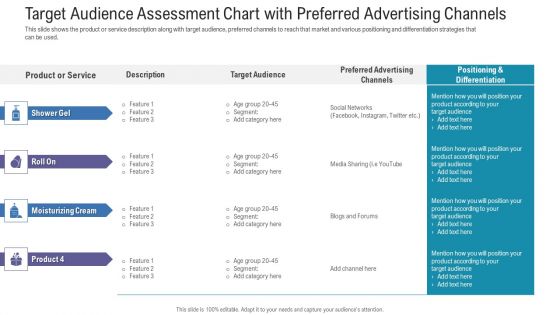
Pitch Deck For Fundraising From Angel Investors Target Audience Assessment Chart With Preferred Advertising Channels Information PDF
Deliver an awe inspiring pitch with this creative pitch deck for fundraising from angel investors target audience assessment chart with preferred advertising channels information pdf bundle. Topics like product or service, target audience, target audience, social networks, preferred advertising channels can be discussed with this completely editable template. It is available for immediate download depending on the needs and requirements of the user.
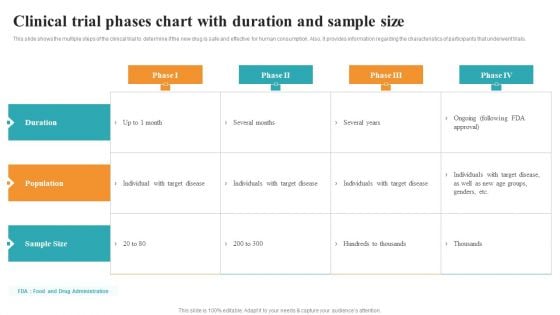
Clinical Trial Phases Chart With Duration And Sample Size Medical Research Phases For Clinical Tests Mockup PDF
This slide shows the multiple steps of the clinical trial to determine if the new drug is safe and effective for human consumption. Also, it provides information regarding the characteristics of participants that underwent trials. Presenting this PowerPoint presentation, titled Clinical Trial Phases Chart With Duration And Sample Size Medical Research Phases For Clinical Tests Mockup PDF, with topics curated by our researchers after extensive research. This editable presentation is available for immediate download and provides attractive features when used. Download now and captivate your audience. Presenting this Clinical Trial Phases Chart With Duration And Sample Size Medical Research Phases For Clinical Tests Mockup PDF. Our researchers have carefully researched and created these slides with all aspects taken into consideration. This is a completely customizable Clinical Trial Phases Chart With Duration And Sample Size Medical Research Phases For Clinical Tests Mockup PDF that is available for immediate downloading. Download now and make an impact on your audience. Highlight the attractive features available with our PPTs.
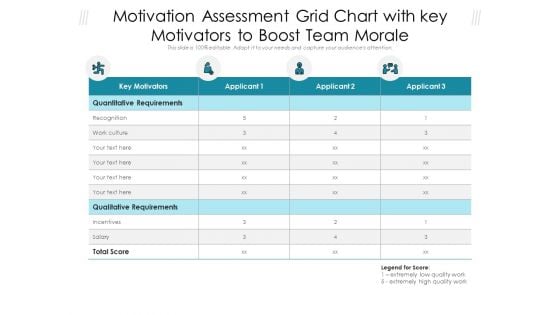
Motivation Assessment Grid Chart With Key Motivators To Boost Team Morale Ppt PowerPoint Presentation Gallery Visual Aids PDF
Persuade your audience using this motivation assessment grid chart with key motivators to boost team morale ppt powerpoint presentation gallery visual aids pdf. This PPT design covers three stages, thus making it a great tool to use. It also caters to a variety of topics including track the right metrics, maintain momentum, involve everyone. Download this PPT design now to present a convincing pitch that not only emphasizes the topic but also showcases your presentation skills.
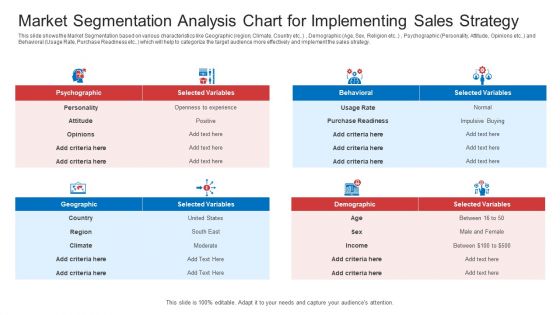
Strategic Plan To Increase Sales Volume And Revenue Market Segmentation Analysis Chart For Implementing Sales Strategy Microsoft PDF
This slide shows the Market Segmentation based on various characteristics like Geographic region, Climate, Country etc. Demographic Age, Sex, Religion etc. Psychographic Personality, Attitude, Opinions etc. and Behavioral Usage Rate, Purchase Readiness etc. which will help to categorize the target audience more effectively and implement the sales strategy. Deliver an awe inspiring pitch with this creative strategic plan to increase sales volume and revenue market segmentation analysis chart for implementing sales strategy microsoft pdf bundle. Topics like psychographic, behavioral, geographic, demographic can be discussed with this completely editable template. It is available for immediate download depending on the needs and requirements of the user.
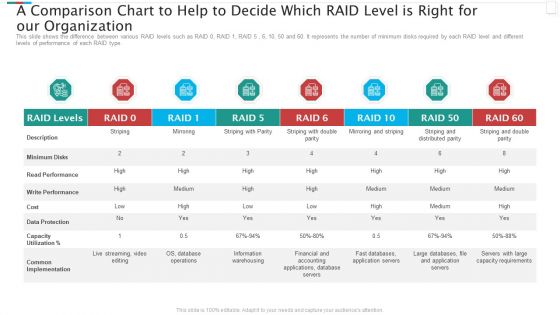
A Comparison Chart To Help To Decide Which RAID Level Is Right For Our Organization Mockup PDF
This slide shows the difference between various RAID levels such as RAID 0, RAID 1, RAID 5 , 6, 10, 50 and 60. It represents the number of minimum disks required by each RAID level and different levels of performance of each RAID type. Deliver an awe inspiring pitch with this creative a comparison chart to help to decide which raid level is right for our organization mockup pdf bundle. Topics like read performance, common implementation, data protection, financial and accounting can be discussed with this completely editable template. It is available for immediate download depending on the needs and requirements of the user.
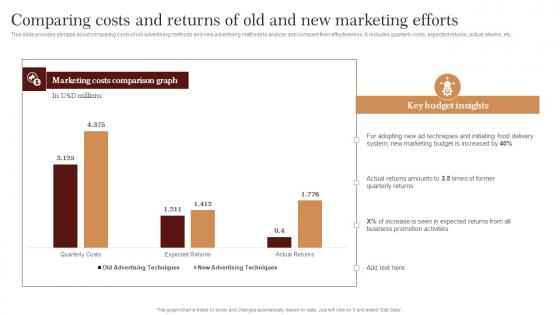
Comparing Costs And Returns Of Old And Strategic Advertising Plan For Bakehouse Professional Pdf
This slide provides glimpse about comparing costs of old advertising methods and new advertising methods to analyze and compare their effectiveness. It includes quarterly costs, expected returns, actual returns, etc.Find a pre designed and impeccable Comparing Costs And Returns Of Old And Strategic Advertising Plan For Bakehouse Professional Pdf. The templates can ace your presentation without additional effort. You can download these easy to edit presentation templates to make your presentation stand out from others. So, what are you waiting for Download the template from Slidegeeks today and give a unique touch to your presentation. This slide provides glimpse about comparing costs of old advertising methods and new advertising methods to analyze and compare their effectiveness. It includes quarterly costs, expected returns, actual returns, etc.
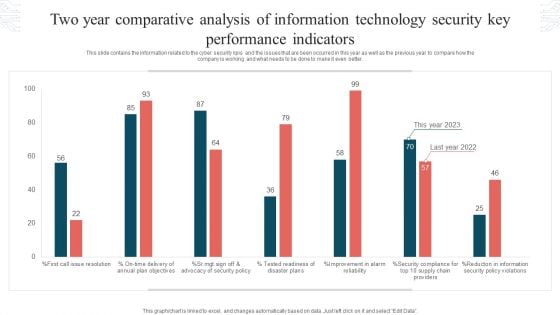
Two Year Comparative Analysis Of Information Technology Security Key Performance Indicators Graphics PDF
This slide contains the information related to the cyber security kpis and the issues that are been occurred in this year as well as the previous year to compare how the company is working and what needs to be done to make it even better. Showcasing this set of slides titled Two Year Comparative Analysis Of Information Technology Security Key Performance Indicators Graphics PDF. The topics addressed in these templates are Tested Readiness, Disaster Plans, Security Policy Violations. All the content presented in this PPT design is completely editable. Download it and make adjustments in color, background, font etc. as per your unique business setting.
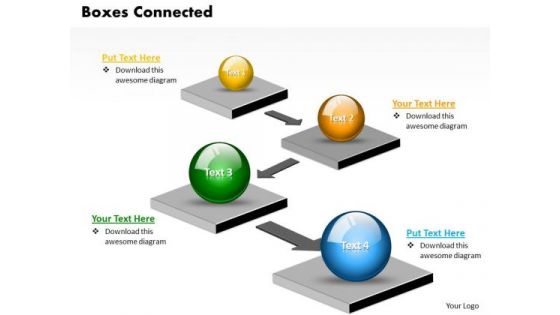
Business Charts PowerPoint Templates 3d Boxes Connected With Arrows Linear Circular Direction Sales
Business Charts PowerPoint templates 3d boxes connected with arrows linear circular direction Sales-Use this Graphical Interface to follow the Correct Path to reach the Destination. This 3D PowerPoint Diagram Shows Four Circular text boxes pointing one to the other defining which Path to follow. This Diagram will make your Presentation Attractive and Delightful to watch. Compare paths with our Business Charts PowerPoint Templates 3d Boxes Connected With Arrows Linear Circular Direction Sales. Download without worries with our money back guaranteee.

Remote Sales Plan For Comparing Social Media Platforms For Generating Leads Strategy SS V
This slide showcases comparative assessment of various social media platforms that can help organization to generate leads, Various platforms are LinkedIn, Twitter, Facebook, YouTube, Instagram, Pinterest, Snapchat etc. Get a simple yet stunning designed Remote Sales Plan For Comparing Social Media Platforms For Generating Leads Strategy SS V. It is the best one to establish the tone in your meetings. It is an excellent way to make your presentations highly effective. So, download this PPT today from Slidegeeks and see the positive impacts. Our easy-to-edit Remote Sales Plan For Comparing Social Media Platforms For Generating Leads Strategy SS V can be your go-to option for all upcoming conferences and meetings. So, what are you waiting for Grab this template today. This slide showcases comparative assessment of various social media platforms that can help organization to generate leads, Various platforms are LinkedIn, Twitter, Facebook, YouTube, Instagram, Pinterest, Snapchat etc.
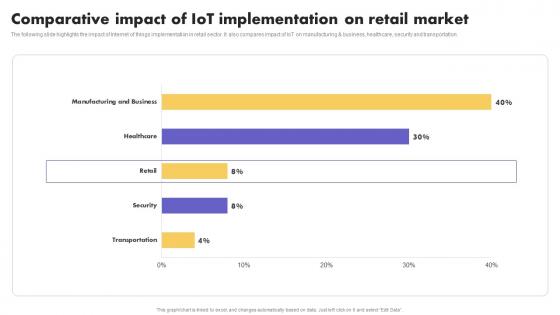
IoT Application In Global Comparative Impact Of IoT Implementation Guidelines Pdf
The following slide highlights the impact of Internet of things implementation in retail sector. It also compares impact of IoT on manufacturing and business, healthcare, security and transportation. Create an editable IoT Application In Global Comparative Impact Of IoT Implementation Guidelines Pdf that communicates your idea and engages your audience. Whether you are presenting a business or an educational presentation, pre-designed presentation templates help save time. IoT Application In Global Comparative Impact Of IoT Implementation Guidelines Pdf is highly customizable and very easy to edit, covering many different styles from creative to business presentations. Slidegeeks has creative team members who have crafted amazing templates. So, go and get them without any delay. The following slide highlights the impact of Internet of things implementation in retail sector. It also compares impact of IoT on manufacturing and business, healthcare, security and transportation
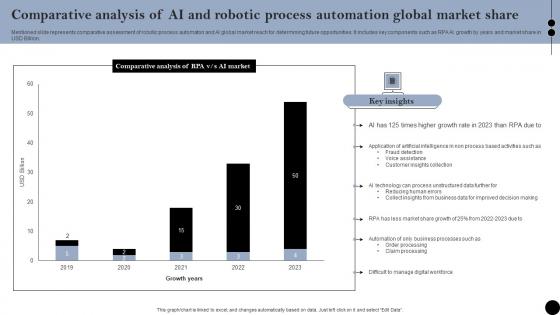
Comparative Analysis Of AI And Robotic Process Automation Global Market Share Introduction Pdf
Mentioned slide represents comparative assessment of robotic process automaton and AI global market reach for determining future opportunities. It includes key components such as RPA AI growth by years and market share in USD Billion. Showcasing this set of slides titled Comparative Analysis Of AI And Robotic Process Automation Global Market Share Introduction Pdf. The topics addressed in these templates are Comparative Analysis, Key Insights, 2019 To 2023. All the content presented in this PPT design is completely editable. Download it and make adjustments in color, background, font etc. as per your unique business setting. Mentioned slide represents comparative assessment of robotic process automaton and AI global market reach for determining future opportunities. It includes key components such as RPA AI growth by years and market share in USD Billion.
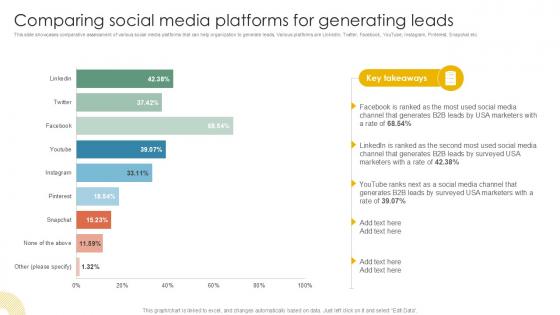
Comparing Social Media Platforms Inside Vs Outside Sales PPT Slide Strategy SS V
This slide showcases comparative assessment of various social media platforms that can help organization to generate leads, Various platforms are LinkedIn, Twitter, Facebook, YouTube, Instagram, Pinterest, Snapchat etc. Get a simple yet stunning designed Comparing Social Media Platforms Inside Vs Outside Sales PPT Slide Strategy SS V. It is the best one to establish the tone in your meetings. It is an excellent way to make your presentations highly effective. So, download this PPT today from Slidegeeks and see the positive impacts. Our easy-to-edit Comparing Social Media Platforms Inside Vs Outside Sales PPT Slide Strategy SS V can be your go-to option for all upcoming conferences and meetings. So, what are you waiting for Grab this template today. This slide showcases comparative assessment of various social media platforms that can help organization to generate leads, Various platforms are LinkedIn, Twitter, Facebook, YouTube, Instagram, Pinterest, Snapchat etc.


 Continue with Email

 Home
Home


