Compare Chart
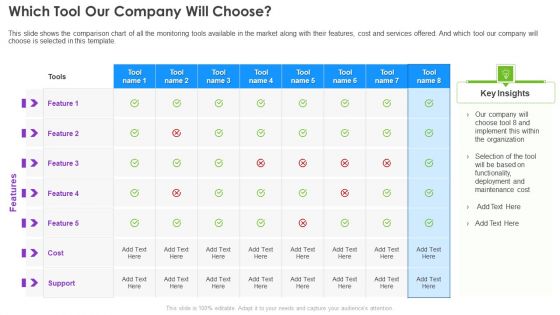
Infrastructure Supervision Which Tool Our Company Will Choose Download PDF
This slide shows the comparison chart of all the monitoring tools available in the market along with their features, cost and services offered. And which tool our company will choose is selected in this template. Deliver an awe inspiring pitch with this creative Infrastructure Supervision Which Tool Our Company Will Choose Download PDF bundle. Topics like Organization, Functionality, Deployment, Maintenance Cost can be discussed with this completely editable template. It is available for immediate download depending on the needs and requirements of the user.
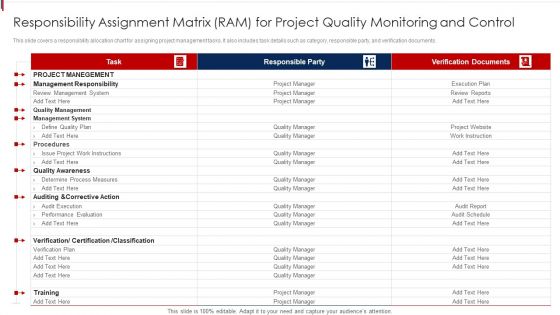
Responsibility Assignment Matrix RAM For Project Quality Monitoring And Control Portrait PDF
This slide covers a responsibility allocation chart for assigning project management tasks. It also includes task details such as category, responsible party, and verification documents. Pitch your topic with ease and precision using this Responsibility Assignment Matrix RAM For Project Quality Monitoring And Control Portrait PDF. This layout presents information on Project Management, Quality Awareness, Management System. It is also available for immediate download and adjustment. So, changes can be made in the color, design, graphics or any other component to create a unique layout.
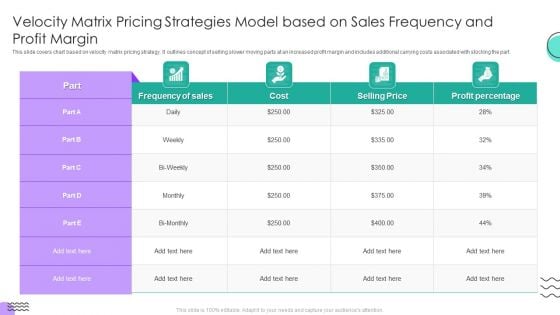
Velocity Matrix Pricing Strategies Model Based On Sales Frequency And Profit Margin Rules PDF
This slide covers chart based on velocity matrix pricing strategy. It outlines concept of selling slower moving parts at an increased profit margin and includes additional carrying costs associated with stocking the part.Pitch your topic with ease and precision using this Velocity Matrix Pricing Strategies Model Based On Sales Frequency And Profit Margin Rules PDF. This layout presents information on Frequency Sales, Selling Price, Profit Percentage. It is also available for immediate download and adjustment. So, changes can be made in the color, design, graphics or any other component to create a unique layout.
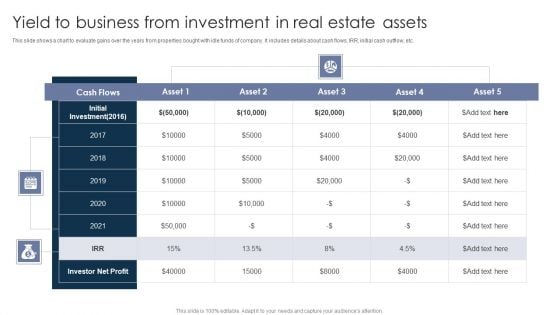
Yield To Business From Investment In Real Estate Assets Ppt PowerPoint Presentation Infographic Template Example 2015 PDF
This slide shows a chart to evaluate gains over the years from properties bought with idle funds of company. It includes details about cash flows, IRR, initial cash outflow, etc. Showcasing this set of slides titled Yield To Business From Investment In Real Estate Assets Ppt PowerPoint Presentation Infographic Template Example 2015 PDF. The topics addressed in these templates are Yield Business, Investment Real, Estate Assets. All the content presented in this PPT design is completely editable. Download it and make adjustments in color, background, font etc. as per your unique business setting.
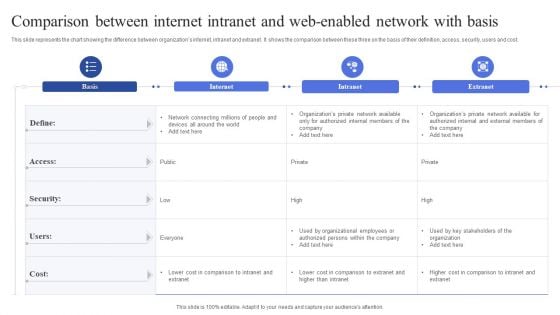
Comparison Between Internet Intranet And Web Enabled Network With Basis Summary PDF
This slide represents the chart showing the difference between organizations internet, intranet and extranet. It shows the comparison between these three on the basis of their definition, access, security, users and cost. Showcasing this set of slides titled Comparison Between Internet Intranet And Web Enabled Network With Basis Summary PDF. The topics addressed in these templates are Internet, Extranet, Public. All the content presented in this PPT design is completely editable. Download it and make adjustments in color, background, font etc. as per your unique business setting.
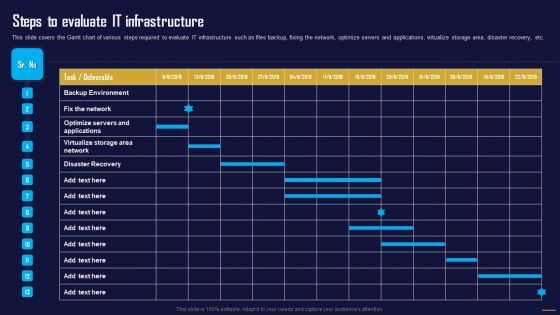
Steps To Evaluate IT Infrastructure Information Tech System Maintenance Slides PDF
This slide covers the Gantt chart of various steps required to evaluate IT infrastructure such as files backup, fixing the network, optimize servers and applications, virtualize storage area, disaster recovery, etc. The Steps To Evaluate IT Infrastructure Information Tech System Maintenance Slides PDF is a compilation of the most recent design trends as a series of slides. It is suitable for any subject or industry presentation, containing attractive visuals and photo spots for businesses to clearly express their messages. This template contains a variety of slides for the user to input data, such as structures to contrast two elements, bullet points, and slides for written information. Slidegeeks is prepared to create an impression.
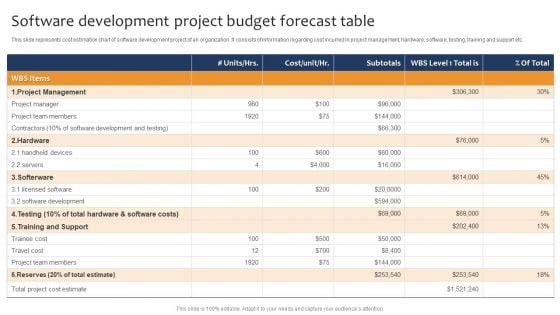
Software Development Project Budget Forecast Table Ppt Model Slides PDF
This slide represents cost estimation chart of software development project of an organization. It consists of information regarding cost incurred in project management, hardware, software, testing, training and support etc. Pitch your topic with ease and precision using this Software Development Project Budget Forecast Table Ppt Model Slides PDF. This layout presents information on Project Management, Training And Support, Cost Estimate. It is also available for immediate download and adjustment. So, changes can be made in the color, design, graphics or any other component to create a unique layout.
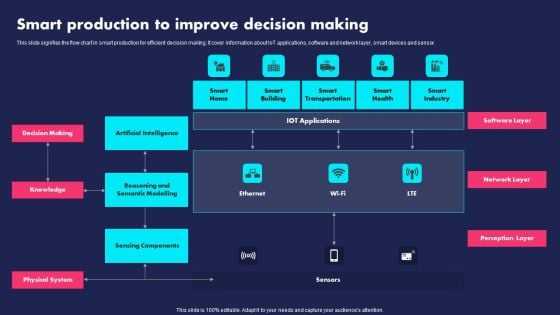
Smart Production To Improve Decision Making Ppt PowerPoint Presentation File Elements PDF
This slide signifies the flow chart in smart production for efficient decision making. It cover information about IoT applications, software and network layer, smart devices and sensor. Pitch your topic with ease and precision using this Smart Production To Improve Decision Making Ppt PowerPoint Presentation File Elements PDF. This layout presents information on Decision Making, Knowledge, Physical System. It is also available for immediate download and adjustment. So, changes can be made in the color, design, graphics or any other component to create a unique layout.
Report On Annual Sales Attrition Tracking By Regions Rules PDF
This slide covers region wise turnover chart depicting sale of companys total amount of products. It includes elements such sales agent name, region, sales quota and YTD goal achievement by workforce. Showcasing this set of slides titled Report On Annual Sales Attrition Tracking By Regions Rules PDF. The topics addressed in these templates are Annual Sales Attrition Tracking. All the content presented in this PPT design is completely editable. Download it and make adjustments in color, background, font etc. as per your unique business setting.
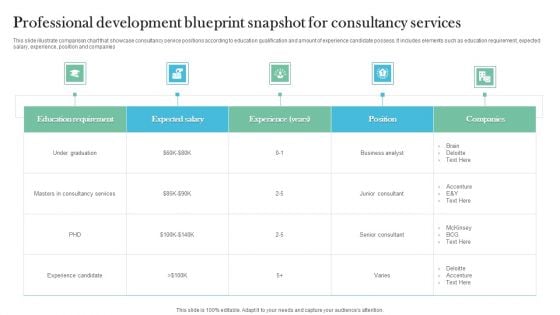
Professional Development Blueprint Snapshot For Consultancy Services Microsoft PDF
This slide illustrate comparison chart that showcase consultancy service positions according to education qualification and amount of experience candidate possess. It includes elements such as education requirement, expected salary, experience, position and companies. Pitch your topic with ease and precision using this Professional Development Blueprint Snapshot For Consultancy Services Microsoft PDF. This layout presents information on Consultancy Services, Education Requirement, Business Analyst. It is also available for immediate download and adjustment. So, changes can be made in the color, design, graphics or any other component to create a unique layout.
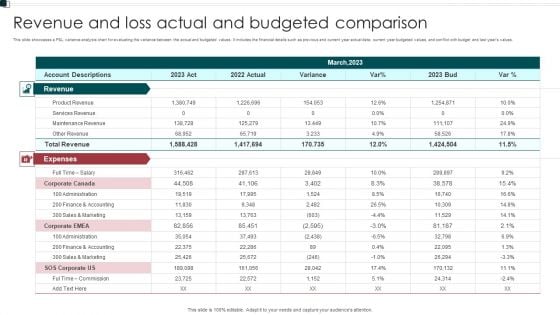
Revenue And Loss Actual And Budgeted Comparison Elements PDF
This slide showcases a P and L variance analysis chart for evaluating the variance between the actual and budgeted values. It includes the financial details such as previous and current year actual data current year budgeted values, and conflict with budget and last years values. Showcasing this set of slides titled Revenue And Loss Actual And Budgeted Comparison Elements PDF. The topics addressed in these templates are Expenses, Administration, Commission. All the content presented in this PPT design is completely editable. Download it and make adjustments in color, background, font etc. as per your unique business setting.

Banking Application Comparison Framework To Choose Best Service Ppt Slides Graphic Tips PDF
This slide illustrate various banking application features compassion chart to choose best app for usage. It includes elements such as real time notification, 24 7 customer service support, overdraft features, future spending forecasting etc. Pitch your topic with ease and precision using this Banking Application Comparison Framework To Choose Best Service Ppt Slides Graphic Tips PDF. This layout presents information on Real Time Notification, Customer Service Support, Overdraft Features. It is also available for immediate download and adjustment. So, changes can be made in the color, design, graphics or any other component to create a unique layout.
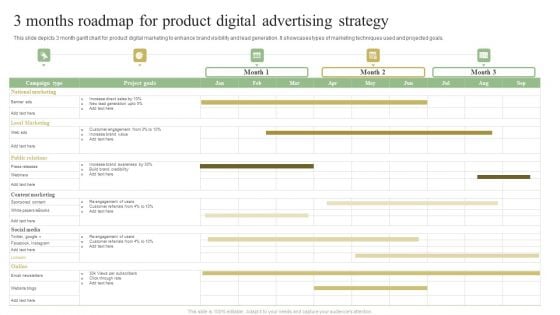
3 Months Roadmap For Product Digital Advertising Strategy Portrait PDF
This slide depicts 3 month gantt chart for product digital marketing to enhance brand visibility and lead generation. It showcases types of marketing techniques used and projected goals.Pitch your topic with ease and precision using this 3 Months Roadmap For Product Digital Advertising Strategy Portrait PDF. This layout presents information on National Marketing, Local Marketing, Brand Awareness. It is also available for immediate download and adjustment. So, changes can be made in the color, design, graphics or any other component to create a unique layout.
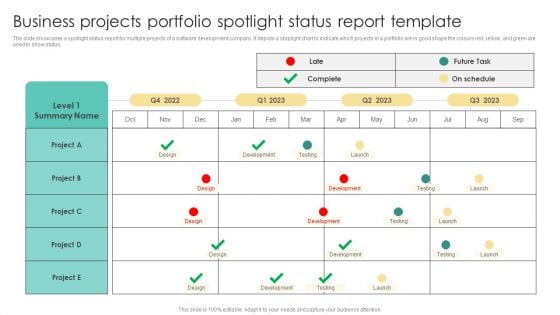
Business Projects Portfolio Spotlight Status Report Template Brochure PDF
The slide showcases a spotlight status report for multiple projects of a software development company. It depicts a stoplight chart to indicate which projects in a portfolio are in good shape the colours red, yellow, and green are used to show status. Showcasing this set of slides titled Business Projects Portfolio Spotlight Status Report Template Brochure PDF. The topics addressed in these templates are Business Projects Portfolio, Spotlight Status, Report Template. All the content presented in this PPT design is completely editable. Download it and make adjustments in color, background, font etc. as per your unique business setting.
On Time Delivery Shipping Tracking Metrics Report With Process Flowchart Information PDF
This slide displays the order delivery chart for tracking average delivery duration and reasons for shipment delays. It also includes order details such as order ID, date of the order, delivery date, and key highlights of the delivery process. Showcasing this set of slides titled On Time Delivery Shipping Tracking Metrics Report With Process Flowchart Information PDF. The topics addressed in these templates are Our Delivery Process, Begin Production, Production Process. All the content presented in this PPT design is completely editable. Download it and make adjustments in color, background, font etc. as per your unique business setting.
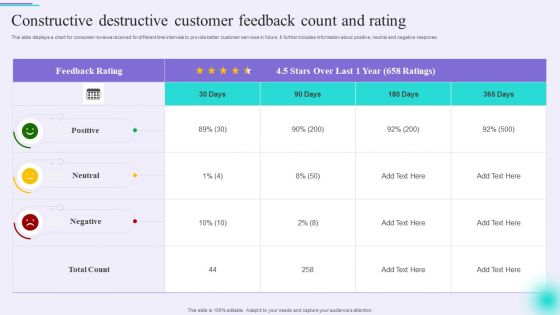
Constructive Destructive Customer Feedback Count And Rating Elements PDF
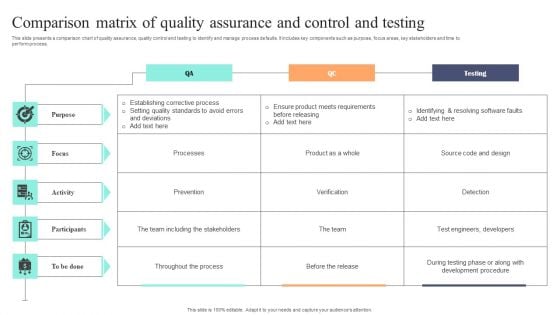
Comparison Matrix Of Quality Assurance And Control And Testing Graphics PDF
This slide presents a comparison chart of quality assurance, quality control and testing to identify and manage process defaults. It includes key components such as purpose, focus areas, key stakeholders and time to perform process. Showcasing this set of slides titled Comparison Matrix Of Quality Assurance And Control And Testing Graphics PDF. The topics addressed in these templates are Purpose, Focus, Activity. All the content presented in this PPT design is completely editable. Download it and make adjustments in color, background, font etc. as per your unique business setting.
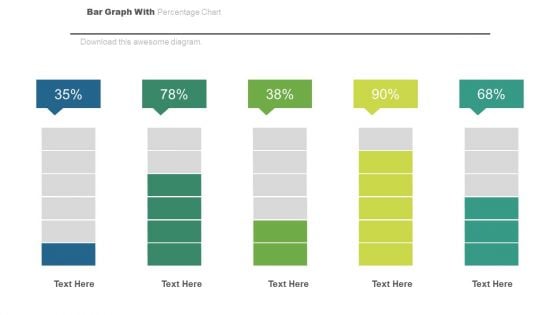
Bar Graph For Statistical Analysis Powerpoint Slides
This PowerPoint template has been designed with bar chart and percentage values. You may download this PPT slide to depict statistical analysis. Add this slide to your presentation and impress your superiors.
Twitter Google Plus Facebook Social Media Powerpoint Slides
This professional slide contains graphics of Twitter, Google plus and Face book social media logos. You may use this chart for comparison of social media sites. Add this slide to your presentation and impress your superiors.

House And Money Business PowerPoint Templates And PowerPoint Themes 0812
House And Money Business PowerPoint Templates And PowerPoint Themes 0812-Microsoft Powerpoint Templates and Background with house and money Our House And Money Business PowerPoint Templates And PowerPoint Themes 0812 compare to a classic dessert. Your audience will have their cake and eat it too.
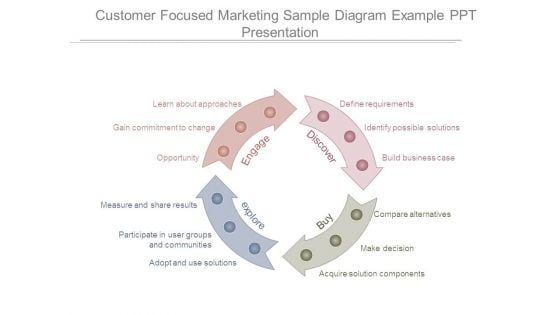
Customer Focused Marketing Sample Diagram Example Ppt Presentation
This is a customer focused marketing sample diagram example ppt presentation. This is a four stage process. The stages in this process are learn about approaches, gain commitment to change, opportunity, measure and share results, participate in user groups and communities, adopt and use solutions, acquire solution components, make decision, compare alternatives, build business case, identify possible solutions, define requirements, engage, discover, buy, explore.

Marketing Strategies For Retail Store Merchandising Strategy- Premium Placement Graphics PDF
Deliver an awe-inspiring pitch with this creative marketing strategies for retail store merchandising strategy premium placement graphics pdf. bundle. Topics likemost people scan in z pattern and compare products horizontally, key takeaways, premium placement of goods can be discussed with this completely editable template. It is available for immediate download depending on the needs and requirements of the user.

Products And Services Offered Carelulu Shareholders Fund Raising Pitch Deck Ideas Pdf
This slide shows products services provided by a company that provides an online marketplace for parents to quickly find and compare childcare services nearby. It consists of categories like search, compare, booking, payment and communication. Formulating a presentation can take up a lot of effort and time, so the content and message should always be the primary focus. The visuals of the PowerPoint can enhance the presenters message, so our Products And Services Offered Carelulu Shareholders Fund Raising Pitch Deck Ideas Pdf was created to help save time. Instead of worrying about the design, the presenter can concentrate on the message while our designers work on creating the ideal templates for whatever situation is needed. Slidegeeks has experts for everything from amazing designs to valuable content, we have put everything into Products And Services Offered Carelulu Shareholders Fund Raising Pitch Deck Ideas Pdf This slide shows products services provided by a company that provides an online marketplace for parents to quickly find and compare childcare services nearby. It consists of categories like search, compare, booking, payment and communication.
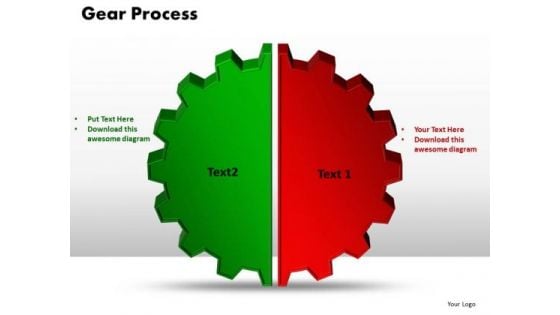
PowerPoint Templates Gear Process Success Ppt Slide Designs
PowerPoint Templates Gear Process Success PPT Slide Designs-Use this diagram to compare two items, their attributes and characteristics.-PowerPoint Templates Gear Process Success PPT Slide Designs Be as fastidious as you want to be. Our PowerPoint Templates Gear Process Success Ppt Slide Designs will be more than a match.
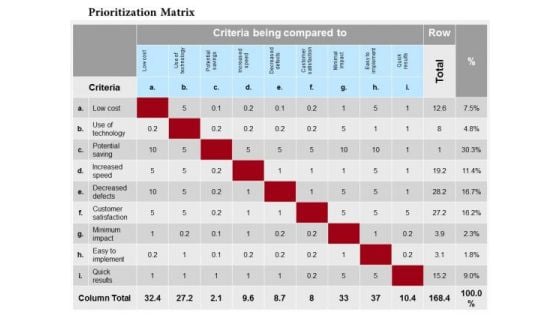
Business Framework Prioritization Matrix PowerPoint Presentation
The prioritization matrix, also know as the criteria matrix, is used to compare choices relative to criteria like price, service, ease of use and almost any other factor desired. Use this image slide in business presentations to express views on planning and management. This image slide will enhance the quality of your presentations.
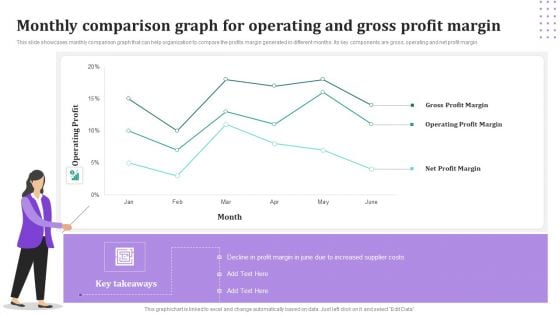
Monthly Comparison Graph For Operating And Gross Profit Margin Pictures PDF
This slide showcases monthly comparison graph that can help organization to compare the profits margin generated in different months. Its key components are gross, operating and net profit margin. Showcasing this set of slides titled Monthly Comparison Graph For Operating And Gross Profit Margin Pictures PDF. The topics addressed in these templates are Gross Profit Margin, Operating Profit Margin, Net Profit Margin. All the content presented in this PPT design is completely editable. Download it and make adjustments in color, background, font etc. as per your unique business setting.
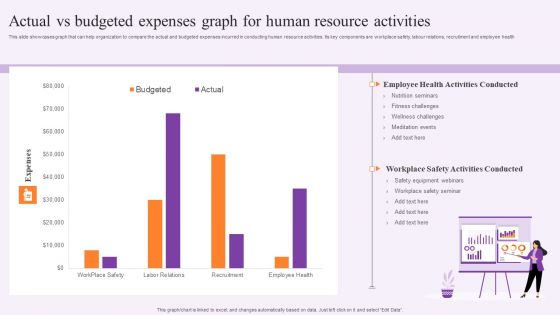
Actual Vs Budgeted Expenses Graph For Human Resource Activities Guidelines PDF
This slide showcases graph that can help organization to compare the actual and budgeted expenses incurred in conducting human resource activities. Its key components are workplace safety, labour relations, recruitment and employee health. Showcasing this set of slides titled Actual Vs Budgeted Expenses Graph For Human Resource Activities Guidelines PDF. The topics addressed in these templates are Safety Equipment Webinars, Employee, Expenses. All the content presented in this PPT design is completely editable. Download it and make adjustments in color, background, font etc. as per your unique business setting.
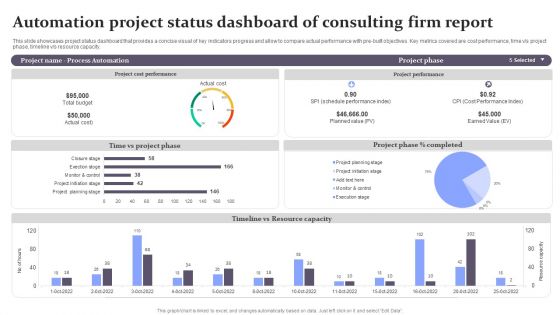
Automation Project Status Dashboard Of Consulting Firm Report Background PDF
This slide showcases project status dashboard that provides a concise visual of key indicators progress and allow to compare actual performance with pre-built objectives. Key metrics covered are cost performance, time v or s project phase, timeline v or s resource capacity. Showcasing this set of slides titled Automation Project Status Dashboard Of Consulting Firm Report Background PDF. The topics addressed in these templates are Project Phase, Planned Value, Cost Performance Index. All the content presented in this PPT design is completely editable. Download it and make adjustments in color, background, font etc. as per your unique business setting.
Financial Procedure Dashboard Indicating Yearly Revenue Analysis Icons PDF
This slide illustrates finance process dashboard indicating yearly revenue analysis which contains gross profit margin, operating profit ratio, net profit, revenue and cost of goods sold cogs operating expenses, etc. It can be referred by company owners who can compare it with previous years performance and make related decisions for future. Showcasing this set of slides titled Financial Procedure Dashboard Indicating Yearly Revenue Analysis Icons PDF. The topics addressed in these templates are Operating Profit Percentage, Net Profit Percentage, Operating Profit Ratio. All the content presented in this PPT design is completely editable. Download it and make adjustments in color, background, font etc. as per your unique business setting.
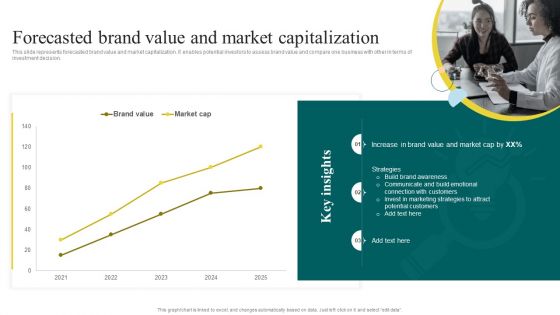
Yearly Brand Promotion Plan Forecasted Brand Value And Market Capitalization Sample PDF
This slide represents forecasted brand value and market capitalization. It enables potential investors to assess brand value and compare one business with other in terms of investment decision. From laying roadmaps to briefing everything in detail, our templates are perfect for you. You can set the stage with your presentation slides. All you have to do is download these easy-to-edit and customizable templates.Yearly Brand Promotion Plan Forecasted Brand Value And Market Capitalization Sample PDF will help you deliver an outstanding performance that everyone would remember and praise you for. Do download this presentation today.
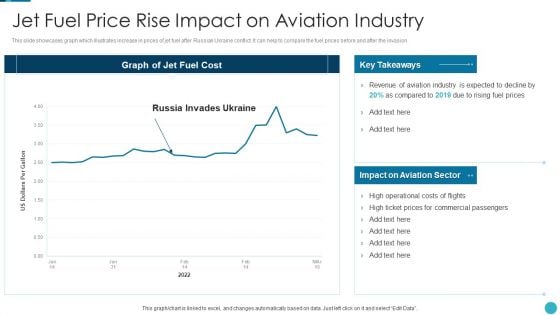
Russia Ukraine War Influence On Airline Sector Jet Fuel Price Rise Impact On Aviation Industry Ideas PDF
This slide showcases graph which illustrates increase in prices of jet fuel after Russian Ukraine conflict. It can help to compare the fuel prices before and after the invasion Deliver and pitch your topic in the best possible manner with this russia ukraine war influence on airline sector jet fuel price rise impact on aviation industry ideas pdf Use them to share invaluable insights on jet fuel price rise impact on aviation industry and impress your audience. This template can be altered and modified as per your expectations. So, grab it now.
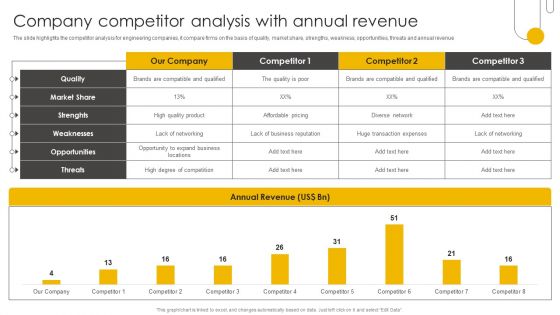
Engineering Enterprise Competitive Company Competitor Analysis With Annual Designs PDF
The slide highlights the competitor analysis for engineering companies, it compare firms on the basis of quality, market share, strengths, weakness, opportunities, threats and annual revenue. Find a pre-designed and impeccable Engineering Enterprise Competitive Company Competitor Analysis With Annual Designs PDF. The templates can ace your presentation without additional effort. You can download these easy-to-edit presentation templates to make your presentation stand out from others. So, what are you waiting for Download the template from Slidegeeks today and give a unique touch to your presentation.
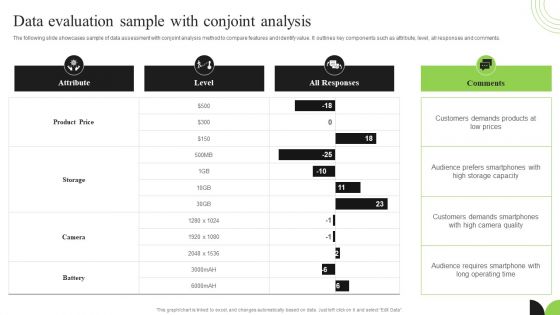
Guidebook For Executing Business Market Intelligence Data Evaluation Sample With Conjoint Analysis Ideas PDF
The following slide showcases sample of data assessment with conjoint analysis method to compare features and identify value. It outlines key components such as attribute, level, all responses and comments. Boost your pitch with our creative Guidebook For Executing Business Market Intelligence Data Evaluation Sample With Conjoint Analysis Ideas PDF. Deliver an awe inspiring pitch that will mesmerize everyone. Using these presentation templates you will surely catch everyones attention. You can browse the ppts collection on our website. We have researchers who are experts at creating the right content for the templates. So you do not have to invest time in any additional work. Just grab the template now and use them.
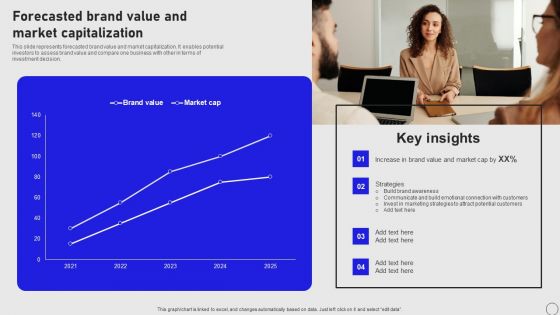
Implementing Annual Brand Marketing Strategy Forecasted Brand Value And Market Capitalization Professional PDF
This slide represents forecasted brand value and market capitalization. It enables potential investors to assess brand value and compare one business with other in terms of investment decision. From laying roadmaps to briefing everything in detail, our templates are perfect for you. You can set the stage with your presentation slides. All you have to do is download these easy to edit and customizable templates. Implementing Annual Brand Marketing Strategy Forecasted Brand Value And Market Capitalization Professional PDF will help you deliver an outstanding performance that everyone would remember and praise you for. Do download this presentation today.
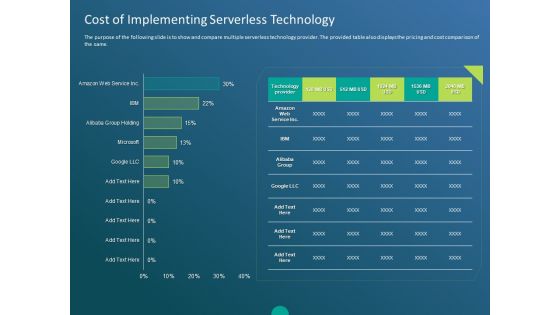
Functioning Of Serverless Computing Cost Of Implementing Serverless Technology Ppt Gallery Brochure PDF
The purpose of the following slide is to show and compare multiple serverless technology provider. The provided table also displays the pricing and cost comparison of the same. Deliver and pitch your topic in the best possible manner with this functioning of serverless computing cost of implementing serverless technology ppt gallery brochure pdf. Use them to share invaluable insights on technology provider, cost implementing, serverless technology and impress your audience. This template can be altered and modified as per your expectations. So, grab it now.
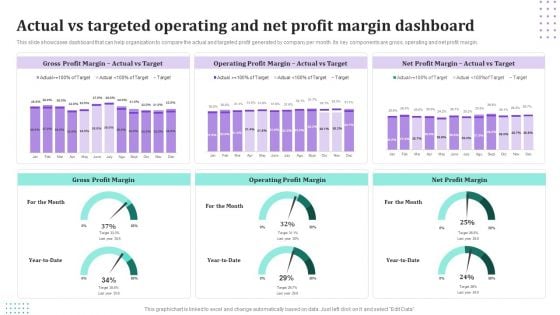
Actual Vs Targeted Operating And Net Profit Margin Dashboard Information PDF
This slide showcases dashboard that can help organization to compare the actual and targeted profit generated by company per month. Its key components are gross, operating and net profit margin. Showcasing this set of slides titled Actual Vs Targeted Operating And Net Profit Margin Dashboard Information PDF. The topics addressed in these templates are Gross Profit Margin, Operating Profit Margin, Net Profit Margin. All the content presented in this PPT design is completely editable. Download it and make adjustments in color, background, font etc. as per your unique business setting.

Pre Launch Activities Marketing Platform For Effective Lead Generation Structure PDF
This slide signifies the key statistics for pre launch activities marketing platform to enhance lead generation rate. It covers information about direct mail, trade show, email marketing, telemarketing, blogs and social media. Showcasing this set of slides titled Pre Launch Activities Marketing Platform For Effective Lead Generation Structure PDF. The topics addressed in these templates are Direct Mail Campaign Leads, Compare To Estimated. All the content presented in this PPT design is completely editable. Download it and make adjustments in color, background, font etc. as per your unique business setting.
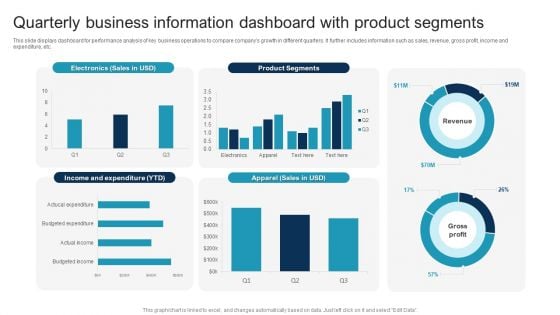
Quarterly Business Information Dashboard With Product Segments Slides PDF
This slide displays dashboard for performance analysis of key business operations to compare companys growth in different quarters. It further includes information such as sales, revenue, gross profit, income and expenditure, etc. Showcasing this set of slides titled Quarterly Business Information Dashboard With Product Segments Slides PDF. The topics addressed in these templates are Quarterly Business Information, Dashboard With Product Segments. All the content presented in this PPT design is completely editable. Download it and make adjustments in color, background, font etc. as per your unique business setting.
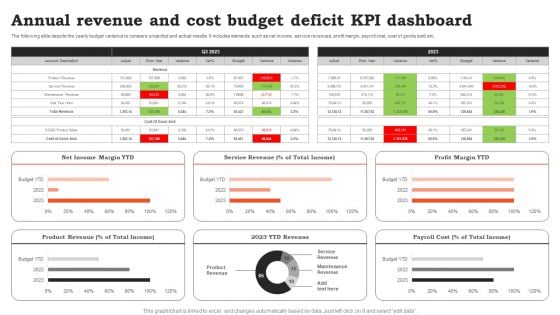
Annual Revenue And Cost Budget Deficit KPI Dashboard Ideas PDF
The following slide depicts the yearly budget variance to compare projected and actual results. It includes elements such as net income, service revenues, profit margin, payroll cost, cost of goods sold etc. Showcasing this set of slides titled Annual Revenue And Cost Budget Deficit KPI Dashboard Ideas PDF. The topics addressed in these templates are Cost Budget, Deficit KPI Dashboard. All the content presented in this PPT design is completely editable. Download it and make adjustments in color, background, font etc. as per your unique business setting.
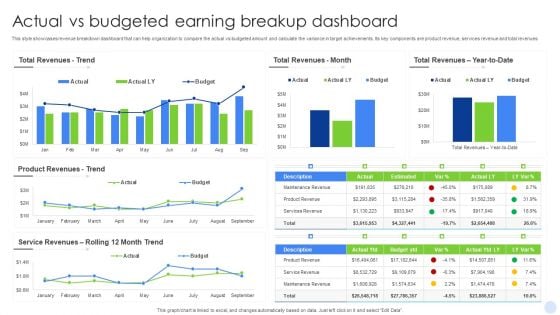
Actual Vs Budgeted Earning Breakup Dashboard Inspiration PDF
This style showcases revenue breakdown dashboard that can help organization to compare the actual vs budgeted amount and calculate the variance in target achievements. Its key components are product revenue, services revenue and total revenues. Showcasing this set of slides titled Actual Vs Budgeted Earning Breakup Dashboard Inspiration PDF. The topics addressed in these templates are Actual Vs Budgeted, Earning Breakup Dashboard. All the content presented in this PPT design is completely editable. Download it and make adjustments in color, background, font etc. as per your unique business setting.
Monthly Comparison Dashboard For Lead Tracking Sample PDF
This slide showcases dashboard that can help organization to compare the leads converted in different months and make changes in sales and marketing campaigns . Its key components lead generated by country, by industry type and lead sources by month. Showcasing this set of slides titled Monthly Comparison Dashboard For Lead Tracking Sample PDF. The topics addressed in these templates are Leads Received, Industry Type, Lead Generated. All the content presented in this PPT design is completely editable. Download it and make adjustments in color, background, font etc. as per your unique business setting.
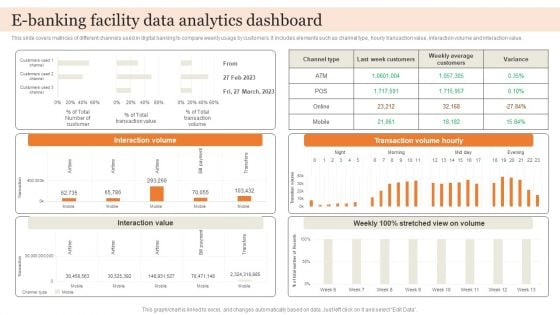
E Banking Facility Data Analytics Dashboard Brochure PDF
This slide covers matrices of different channels used in digital banking to compare weekly usage by customers. It includes elements such as channel type, hourly transaction value, interaction volume and interaction value. Showcasing this set of slides titled E Banking Facility Data Analytics Dashboard Brochure PDF. The topics addressed in these templates are Interaction Value, Transaction Volume Hourly, Interaction Volume. All the content presented in this PPT design is completely editable. Download it and make adjustments in color, background, font etc. as per your unique business setting.
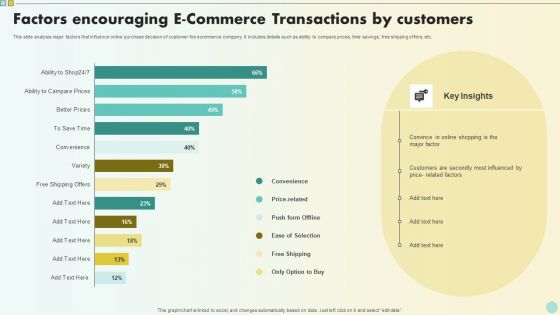
Factors Encouraging E Commerce Transactions By Customers Infographics PDF
This slide analysis major factors that influence online purchase decision of customer foe ecommerce company. It includes details such as ability to compare prices, time savings, free shipping offers, etc. Showcasing this set of slides titled Factors Encouraging E Commerce Transactions By Customers Infographics PDF. The topics addressed in these templates are Key Insights, Convenience, Push Form Offline. All the content presented in this PPT design is completely editable. Download it and make adjustments in color, background, font etc. as per your unique business setting.
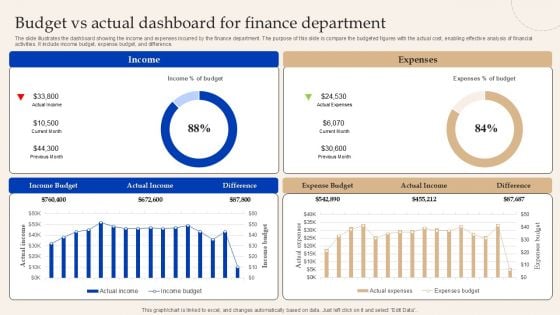
Budget Vs Actual Dashboard For Finance Department Brochure PDF
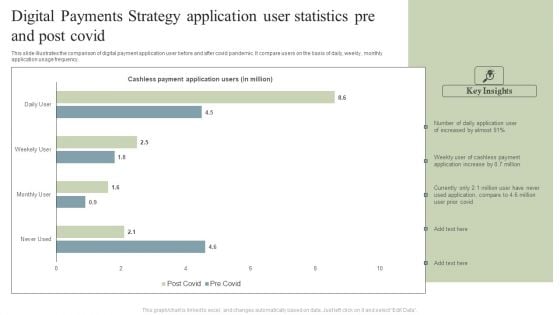
Digital Payments Strategy Application User Statistics Pre And Post Covid Pictures PDF
This slide illustrates the comparison of digital payment application user before and after covid pandemic. It compare users on the basis of daily, weekly, monthly application usage frequency. Pitch your topic with ease and precision using this Digital Payments Strategy Application User Statistics Pre And Post Covid Pictures PDF. This layout presents information on Cashless Payment, Application Users, Cashless Payment, Application Increase. It is also available for immediate download and adjustment. So, changes can be made in the color, design, graphics or any other component to create a unique layout.

Monthly Analysis For Actual And Budget Financials Metrics Professional PDF
The following slide shows review report to compare difference in actually spend and planned budget for cost planning in future. It further includes details about maintenance and repairs, supplies, rent, mortgage, etc. Pitch your topic with ease and precision using this Monthly Analysis For Actual And Budget Financials Metrics Professional PDF. This layout presents information on Budget Totals, Expenses, Budget Overview. It is also available for immediate download and adjustment. So, changes can be made in the color, design, graphics or any other component to create a unique layout.
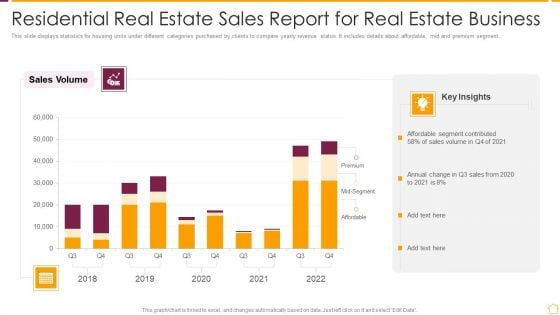
Residential Real Estate Sales Report For Real Estate Business Ppt PowerPoint Presentation File Master Slide PDF
This slide displays statistics for housing units under different categories purchased by clients to compare yearly revenue status. It includes details about affordable, mid and premium segment. Pitch your topic with ease and precision using this Residential Real Estate Sales Report For Real Estate Business Ppt PowerPoint Presentation File Master Slide PDF. This layout presents information on Affordable Segment Contributed, Sales Volume, 2018 To 2022. It is also available for immediate download and adjustment. So, changes can be made in the color, design, graphics or any other component to create a unique layout.
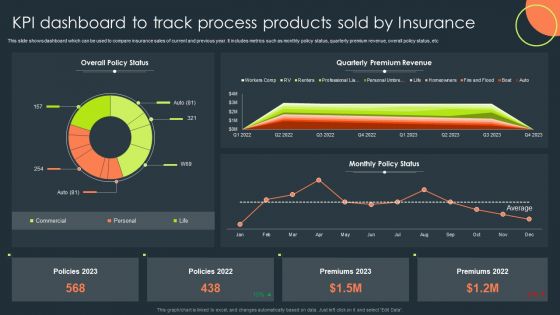
KPI Dashboard To Track Process Products Sold By Insurance Topics PDF
This slide shows dashboard which can be used to compare insurance sales of current and previous year. It includes metrics such as monthly policy status, quarterly premium revenue, overall policy status, etc. Pitch your topic with ease and precision using this KPI Dashboard To Track Process Products Sold By Insurance Topics PDF. This layout presents information on Overall Policy Status, Quarterly Premium Revenue, Monthly Policy Status. It is also available for immediate download and adjustment. So, changes can be made in the color, design, graphics or any other component to create a unique layout.
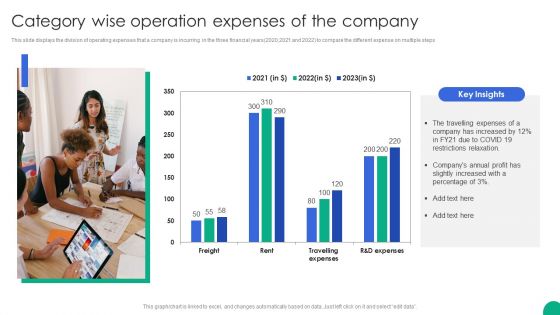
Category Wise Operation Expenses Of The Company Topics PDF
This slide displays the division of operating expenses that a company is incurring in the three financial years 2020,2021 and 2022 to compare the different expense on multiple steps.Pitch your topic with ease and precision using this Category Wise Operation Expenses Of The Company Topics PDF. This layout presents information on Travelling Expenses, Increased Restrictions, Relaxation. It is also available for immediate download and adjustment. So, changes can be made in the color, design, graphics or any other component to create a unique layout.
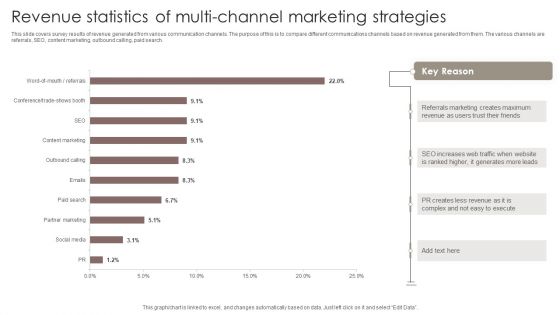
Revenue Statistics Of Multi Channel Marketing Strategies Microsoft PDF
This slide covers survey results of revenue generated from various communication channels. The purpose of this is to compare different communications channels based on revenue generated from them. The various channels are referrals, SEO, content marketing, outbound calling, paid search.Pitch your topic with ease and precision using this Revenue Statistics Of Multi Channel Marketing Strategies Microsoft PDF. This layout presents information on Referrals Marketing, Creates Maximum, Generates Leads. It is also available for immediate download and adjustment. So, changes can be made in the color, design, graphics or any other component to create a unique layout.
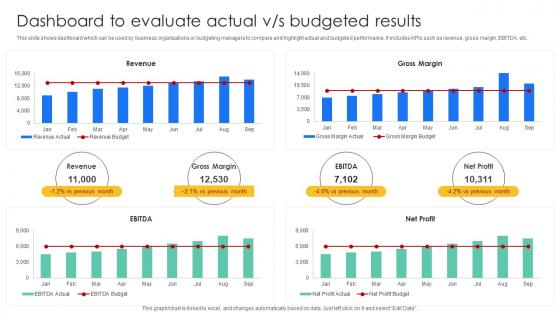
Dashboard To Evaluate Actual Vs Budgeted Results Effective And Efficient Tools To Develop Fin SS V
This slide shows dashboard which can be used by business organizations or budgeting managers to compare and highlight actual and budgeted performance. It includes KPIs such as revenue, gross margin, EBITDA, etc. Find highly impressive Dashboard To Evaluate Actual Vs Budgeted Results Effective And Efficient Tools To Develop Fin SS V on Slidegeeks to deliver a meaningful presentation. You can save an ample amount of time using these presentation templates. No need to worry to prepare everything from scratch because Slidegeeks experts have already done a huge research and work for you. You need to download Dashboard To Evaluate Actual Vs Budgeted Results Effective And Efficient Tools To Develop Fin SS V for your upcoming presentation. All the presentation templates are 100 percent editable and you can change the color and personalize the content accordingly. Download now This slide shows dashboard which can be used by business organizations or budgeting managers to compare and highlight actual and budgeted performance. It includes KPIs such as revenue, gross margin, EBITDA, etc.
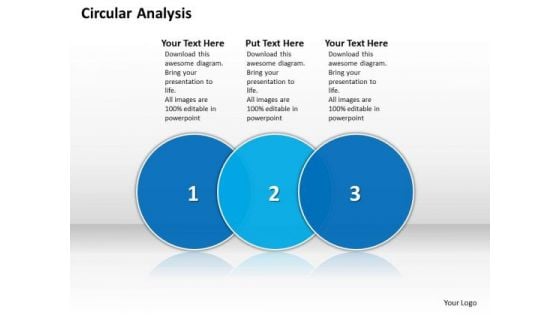
Ppt Circular Analysis Of 3 Phase Diagram Describing Process PowerPoint Templates
PPT circular analysis of 3 phase diagram describing process PowerPoint Templates-This PowerPoint diagram can be used to compare three approaches and evaluate the effectiveness. You can easily insert text to this slide as per your requirement. Use this Slide to coordinate business plans.-PPT circular analysis of 3 phase diagram describing process PowerPoint Templates-3, Advice, Analysis, Analyze, Answer, Area, Career, Chart, Choice, Circles, Concept, Determination, Diagram, Graph, Idea, Illustration, Intersect, Measurement, Opportunities, Options, Overlap, Overlapped, Overlapping, Passion, Passionate, Prioritize, Priority, Profession Expose the facts with our Ppt Circular Analysis Of 3 Phase Diagram Describing Process PowerPoint Templates. Get down to the actuality of it all.
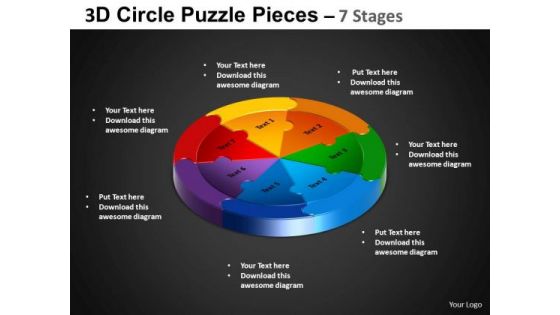
PowerPoint Template Circular Process Circle Puzzle Diagram Ppt Design
PowerPoint Template Circular Process Circle Puzzle Diagram PPT Design-These high quality powerpoint pre-designed slides and powerpoint templates have been carefully created by our professional team to help you impress your audience. All slides have been created and are 100% editable in powerpoint. Each and every property of any graphic - color, size, orientation, shading, outline etc. can be modified to help you build an effective powerpoint presentation. Any text can be entered at any point in the powerpoint template or slide. Simply DOWNLOAD, TYPE and PRESENT! Compare products and services with our PowerPoint Template Circular Process Circle Puzzle Diagram Ppt Design. You will come out on top.
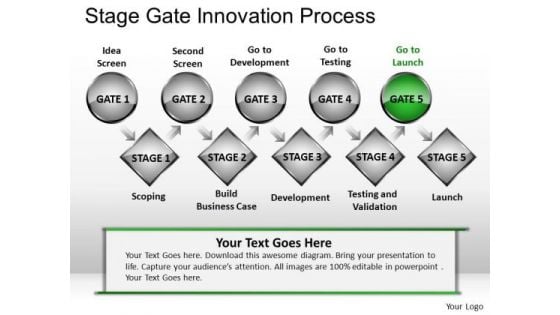
PowerPoint Process Corporate Strategy Stage Gate Innovation Process Ppt Designs Slides
PowerPoint Process Corporate Strategy Stage Gate Innovation Process PPT Designs slides-These high quality powerpoint pre-designed slides and powerpoint templates have been carefully created by our professional team to help you impress your audience. All slides have been created and are 100% editable in powerpoint. Each and every property of any graphic - color, size, orientation, shading, outline etc. can be modified to help you build an effective powerpoint presentation. Any text can be entered at any point in the powerpoint template or slide. Simply DOWNLOAD, TYPE and PRESENT! Compare products and services with our PowerPoint Process Corporate Strategy Stage Gate Innovation Process Ppt Designs Slides. You will come out on top.
Digital Advertising Plan For Bakery Business Daily Food Order Delivery Tracking Sheet Infographics PDF
This slide provides glimpse about tracking chart of all the online orders received by the certain branch of the bakery. It includes order ID, status, date, time, customer, dasher, channel, subtotal, food ratings by customer, etc. Formulating a presentation can take up a lot of effort and time, so the content and message should always be the primary focus. The visuals of the PowerPoint can enhance the presenters message, so our Digital Advertising Plan For Bakery Business Daily Food Order Delivery Tracking Sheet Infographics PDF was created to help save time. Instead of worrying about the design, the presenter can concentrate on the message while our designers work on creating the ideal templates for whatever situation is needed. Slidegeeks has experts for everything from amazing designs to valuable content, we have put everything into Digital Advertising Plan For Bakery Business Daily Food Order Delivery Tracking Sheet Infographics PDF.
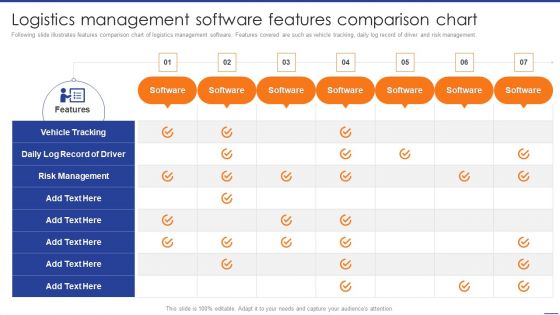
Digital Transformation Of Supply Logistics Management Software Features Comparison Summary PDF
Following slide illustrates features comparison chart of logistics management software. Features covered are such as vehicle tracking, daily log record of driver and risk management. Explore a selection of the finest Digital Transformation Of Supply Logistics Management Software Features Comparison Summary PDF here. With a plethora of professionally designed and pre-made slide templates, you can quickly and easily find the right one for your upcoming presentation. You can use our Digital Transformation Of Supply Logistics Management Software Features Comparison Summary PDF to effectively convey your message to a wider audience. Slidegeeks has done a lot of research before preparing these presentation templates. The content can be personalized and the slides are highly editable. Grab templates today from Slidegeeks.
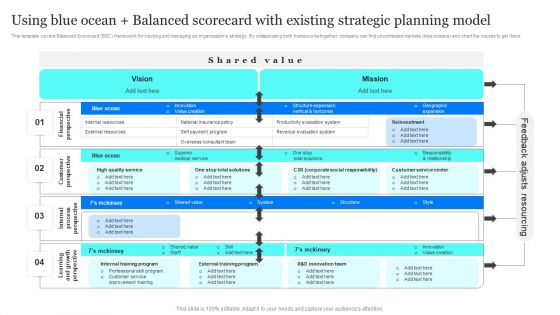
Using Blue Ocean Balanced Scorecard With Existing Strategic Planning Model Introduction PDF
This template covers Balanced Scorecard BSC framework for tracking and managing an organizations strategy. By collaborating both frameworks together, company can find uncontested markets blue oceans and chart the course to get there. Retrieve professionally designed Using Blue Ocean Balanced Scorecard With Existing Strategic Planning Model Introduction PDF to effectively convey your message and captivate your listeners. Save time by selecting pre made slideshows that are appropriate for various topics, from business to educational purposes. These themes come in many different styles, from creative to corporate, and all of them are easily adjustable and can be edited quickly. Access them as PowerPoint templates or as Google Slides themes. You do not have to go on a hunt for the perfect presentation because Slidegeeks got you covered from everywhere.
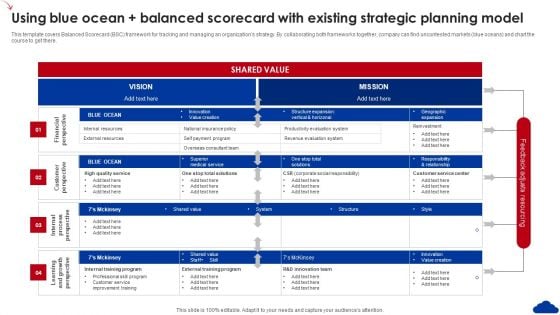
5 Step Guide For Transitioning To Blue Ocean Strategy Using Blue Ocean Balanced Scorecard Existing Information PDF
This template covers Balanced Scorecard BSC framework for tracking and managing an organizations strategy. By collaborating both frameworks together, company can find uncontested markets blue oceans and chart the course to get there. Whether you have daily or monthly meetings, a brilliant presentation is necessary. 5 Step Guide For Transitioning To Blue Ocean Strategy Using Blue Ocean Balanced Scorecard Existing Information PDF can be your best option for delivering a presentation. Represent everything in detail using 5 Step Guide For Transitioning To Blue Ocean Strategy Using Blue Ocean Balanced Scorecard Existing Information PDF and make yourself stand out in meetings. The template is versatile and follows a structure that will cater to your requirements. All the templates prepared by Slidegeeks are easy to download and edit. Our research experts have taken care of the corporate themes as well. So, give it a try and see the results.
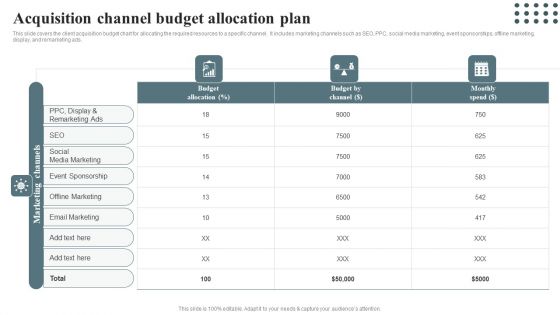
Techniques For Enhancing Buyer Acquisition Acquisition Channel Budget Allocation Plan Elements PDF
This slide covers the client acquisition budget chart for allocating the required resources to a specific channel. It includes marketing channels such as SEO, PPC, social media marketing, event sponsorships, offline marketing, display, and remarketing ads. Find highly impressive Techniques For Enhancing Buyer Acquisition Acquisition Channel Budget Allocation Plan Elements PDF on Slidegeeks to deliver a meaningful presentation. You can save an ample amount of time using these presentation templates. No need to worry to prepare everything from scratch because Slidegeeks experts have already done a huge research and work for you. You need to download Techniques For Enhancing Buyer Acquisition Acquisition Channel Budget Allocation Plan Elements PDF for your upcoming presentation. All the presentation templates are 100precent editable and you can change the color and personalize the content accordingly. Download now.
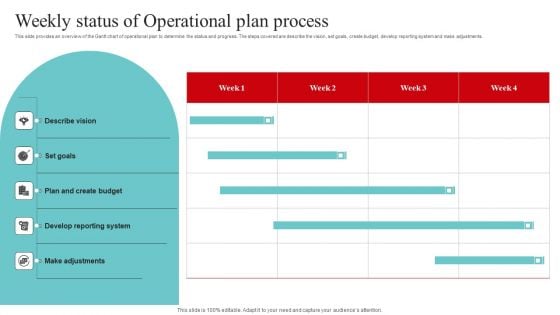
Strategic And Operational Strategy Weekly Status Of Operational Plan Process Pictures PDF
This slide provides an overview of the Gantt chart of operational plan to determine the status and progress. The steps covered are describe the vision, set goals, create budget, develop reporting system and make adjustments. This Strategic And Operational Strategy Weekly Status Of Operational Plan Process Pictures PDF from Slidegeeks makes it easy to present information on your topic with precision. It provides customization options, so you can make changes to the colors, design, graphics, or any other component to create a unique layout. It is also available for immediate download, so you can begin using it right away. Slidegeeks has done good research to ensure that you have everything you need to make your presentation stand out. Make a name out there for a brilliant performance.


 Continue with Email

 Home
Home


