Compare Two
Risk Tracker Template 2 Ppt PowerPoint Presentation Outline Skills
This is a risk tracker template 2 ppt powerpoint presentation outline skills. This is a five stage process. The stages in this process are risk item, monthly ranking, risk resolution progress, inadequate planning.
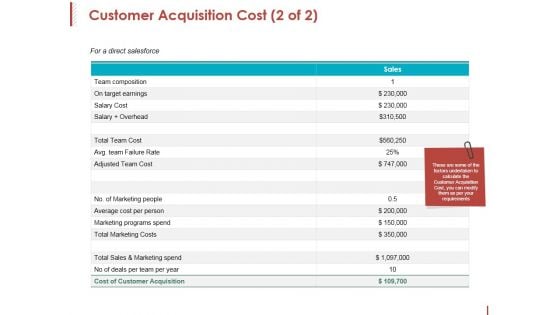
Customer Acquisition Cost Template 2 Ppt PowerPoint Presentation Styles Slide
This is a customer acquisition cost template 2 ppt powerpoint presentation styles slide. This is a one stage process. The stages in this process are team composition, on target earnings, salary cost, total team cost, average cost per person.
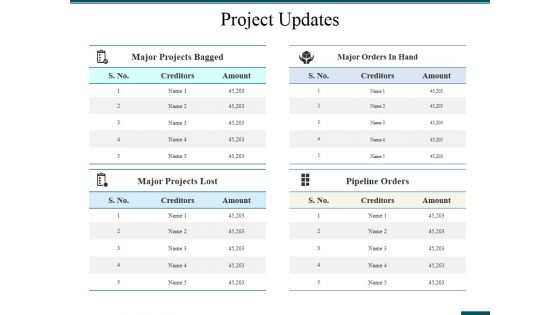
Project Updates Template 2 Ppt PowerPoint Presentation Layouts Display
This is a project updates template 2 ppt powerpoint presentation layouts display. This is a four stage process. The stages in this process are major projects bagged, major projects lost, major orders in hand, pipeline orders.
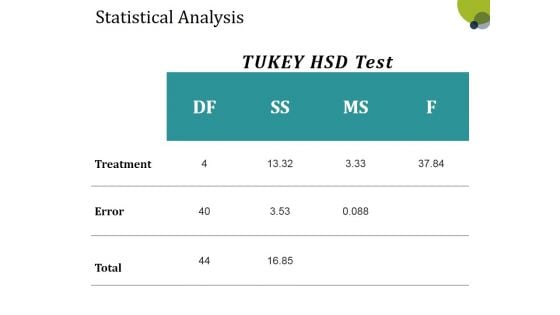
Statistical Analysis Template 2 Ppt PowerPoint Presentation Summary Visuals
This is a statistical analysis template 2 ppt powerpoint presentation summary visuals. This is a three stage process. The stages in this process are treatment, error, total, business, table.
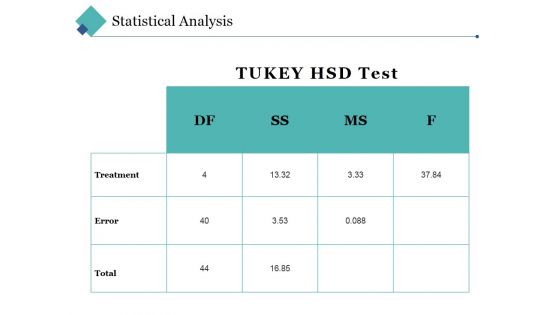
Statistical Analysis Template 2 Ppt PowerPoint Presentation Layouts Background Image
This is a statistical analysis template 2 ppt powerpoint presentation layouts background image. This is a three stage process. The stages in this process are treatment, error, total, table, business.
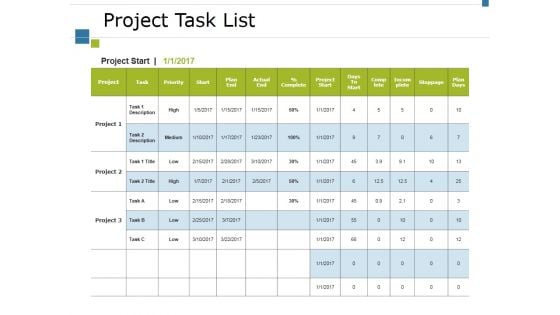
Project Task List Template 2 Ppt PowerPoint Presentation Slides Good
This is a project task list template 2 ppt powerpoint presentation slides good. This is a three stage process. The stages in this process are project, task, priority, start, complete.

Executive Summary Template 2 Ppt PowerPoint Presentation Summary Ideas
This is a executive summary template 2 ppt powerpoint presentation summary ideas. This is a four stage process. The stages in this process are company overview, financials, transaction, particulars, net revenue.
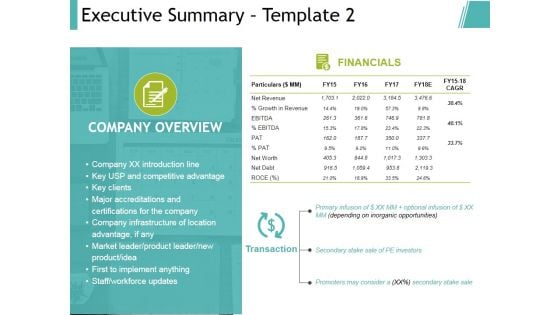
Executive Summary Template 2 Ppt PowerPoint Presentation Model Objects
This is a executive summary template 2 ppt powerpoint presentation model objects. This is a four stage process. The stages in this process are business, management, analysis, strategy, marketing.
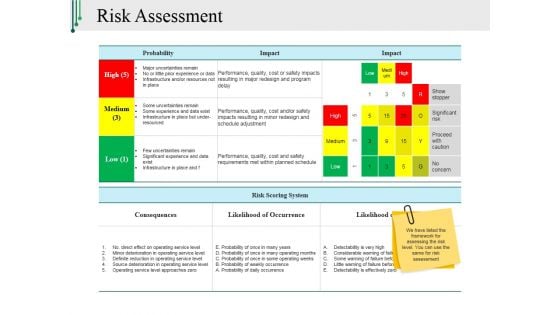
Risk Assessment Template 2 Ppt PowerPoint Presentation Professional Aids
This is a risk assessment template 2 ppt powerpoint presentation professional aids. This is a three stage process. The stages in this process are high, medium, low, probability, impact.
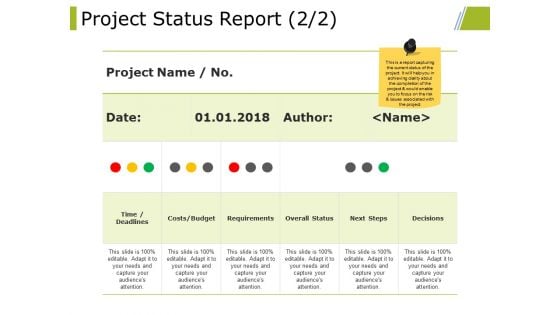
Project Status Report Template 2 Ppt PowerPoint Presentation Model Graphics
This is a project status report template 2 ppt powerpoint presentation model graphics. This is a four stage process. The stages in this process are project status report, management, analysis, strategy, business.
Balance Sheet Kpis Template 2 Ppt PowerPoint Presentation Portfolio Icons
This is a balance sheet kpis template 2 ppt powerpoint presentation portfolio icons. This is a four stage process. The stages in this process are balance sheet, finance, marketing, strategy, business.

Three Batteries As Growth Steps Powerpoint Slides
This PowerPoint template has been designed with graphics of three batteries. Download this PPT slide for data comparisons or it may be used to display growth steps. Add this slide to your presentation and impress your superiors.
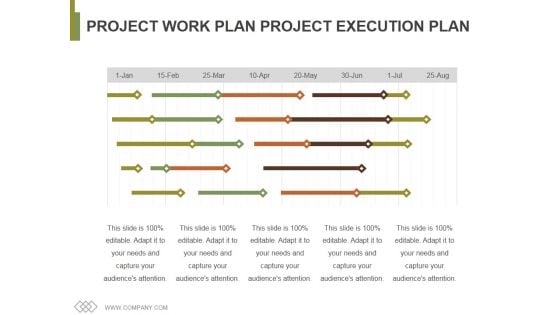
Project Work Plan Project Execution Plan Template 2 Ppt PowerPoint Presentation Slides Graphics Tutorials
This is a project work plan project execution plan template 2 ppt powerpoint presentation slides graphics tutorials. This is a six stage process. The stages in this process are table, business, marketing, planning, management.
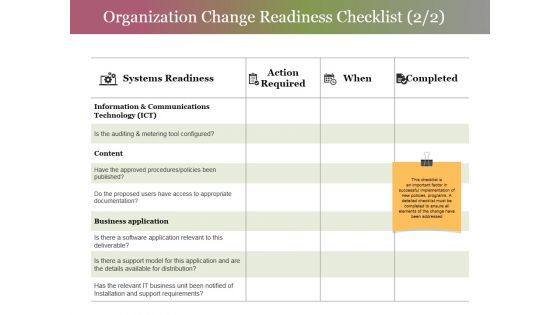
Organization Change Readiness Checklist Template 2 Ppt PowerPoint Presentation File Information
This is a organization change readiness checklist template 2 ppt powerpoint presentation file information. This is a four stage process. The stages in this process are systems readiness, action required, completed, content, business application.
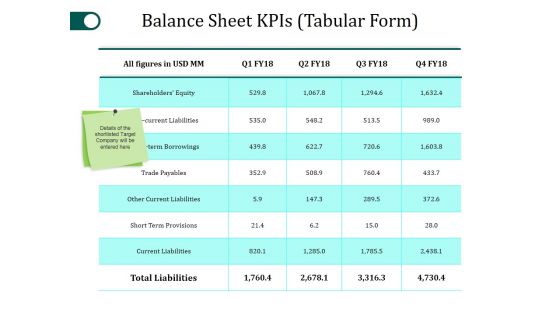
Balance Sheet Kpis Template 2 Ppt PowerPoint Presentation Portfolio Graphics Template
This is a balance sheet kpis template 2 ppt powerpoint presentation portfolio graphics template. This is a four stage process. The stages in this process are shareholders equity, trade payables, other current liabilities, current liabilities, total liabilities.
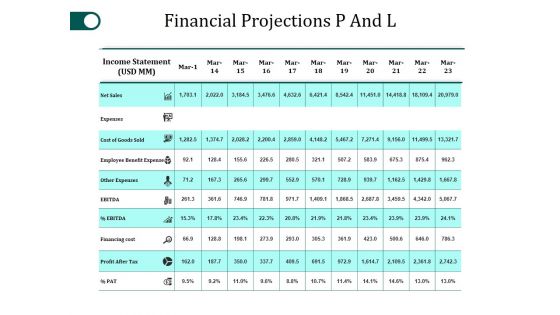
Financial Projections P And L Template 2 Ppt PowerPoint Presentation Portfolio Summary
This is a financial projections p and l template 2 ppt powerpoint presentation portfolio summary. This is a five stage process. The stages in this process are net sales, expenses, ebitda, financing cost, other expenses.
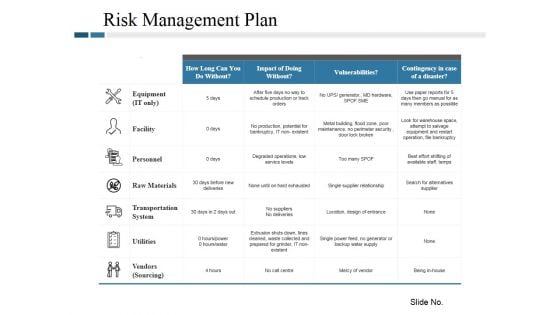
Risk Management Plan Template 2 Ppt PowerPoint Presentation Professional Layout Ideas
This is a risk management plan template 2 ppt powerpoint presentation professional layout ideas. This is a four stage process. The stages in this process are facility, personnel, utilities, raw materials, equipment.

Risk Impact And Probability Analysis Template 2 Ppt PowerPoint Presentation Layouts Rules
This is a risk impact and probability analysis template 2 ppt powerpoint presentation layouts rules. This is a four stage process. The stages in this process are schedule, cost, performance, impact assessment, probability of risk occurring.
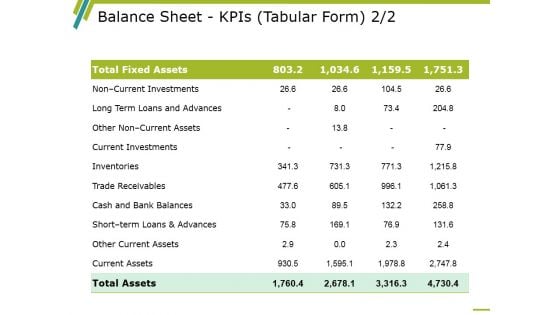
Balance Sheet Kpis Template 2 Ppt PowerPoint Presentation Outline Graphics Pictures
This is a balance sheet kpis template 2 ppt powerpoint presentation outline graphics pictures. This is a four stage process. The stages in this process are balance sheet, finance, marketing, strategy, analysis.
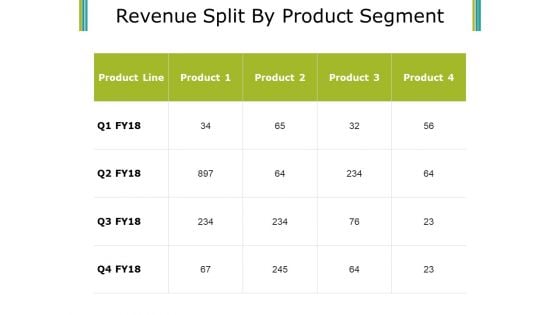
Revenue Split By Product Segment Template 2 Ppt PowerPoint Presentation Professional Show
This is a revenue split by product segment template 2 ppt powerpoint presentation professional show. This is a four stage process. The stages in this process are product, product line, table, business, marketing.

Four Arrow Steps For Business Process Powerpoint Slides
This PowerPoint template has been designed with diagram of four arrow steps. You may download this diagram for business processes. Add this PPT slide to your presentation and impress your superiors.
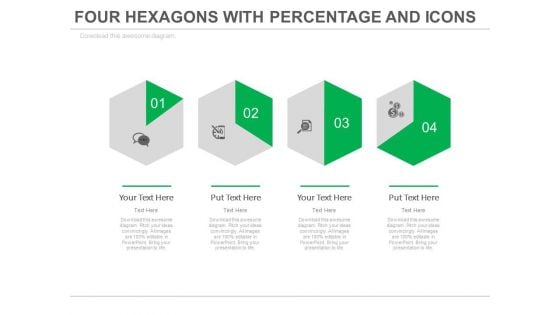
Four Steps Of Financial Growth Analysis Powerpoint Slides
This PowerPoint template with multiple Hexagons can be creatively used to present a timeline in a visual manner. This slide can also help the audience understand a 6 step process in an easier manner. The icons are totally customizable and can be edited to represent the particular process happening at that stage. It can also be used to represent different times or different activities to be carried out at different times in in a day in an office or an organization (e.g. - Medicine schedule) since the hexagon represents a clock and change of shade moves in a clockwise manner. The diagram can be used to represent a comparison or a report or an analysis of the data.
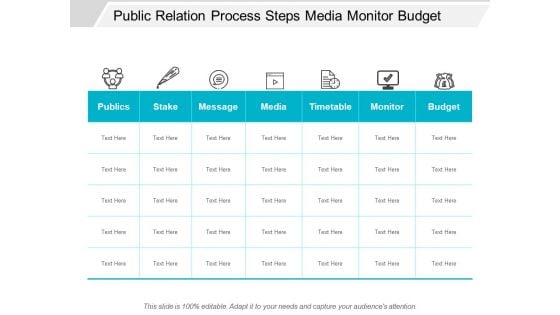
Public Relation Process Steps Media Monitor Budget Ppt Powerpoint Presentation Layouts Portrait
This is a public relation process steps media monitor budget ppt powerpoint presentation layouts portrait. This is a seven stage process. The stages in this process are pr plan, pr strategy, pr idea.
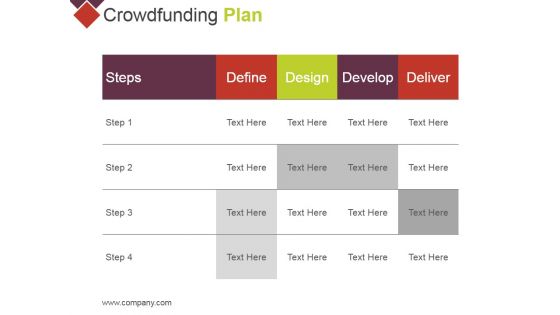
Crowdfunding Plan Ppt PowerPoint Presentation Gallery Design Templates
This is a crowdfunding plan ppt powerpoint presentation gallery design templates. This is a four stage process. The stages in this process are steps, define, design, develop, deliver.
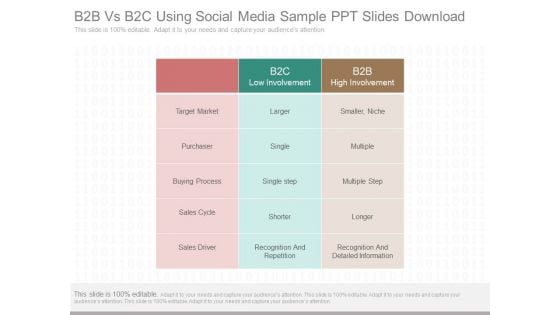
B2b Vs B2c Using Social Media Sample Ppt Slides Download
This is a b2b vs b2c using social media sample ppt slides download. This is a three stage process. The stages in this process are b2c low involvement, b2b high involvement, target market, purchaser, buying process, sales cycle, sales driver, larger, single, single step, shorter, recognition and repetition, smaller, niche, multiple, multiple step, longer, recognition and detailed information.
Four Boxes With Gears Bulb And Target Icons Powerpoint Slides
This PowerPoint template has been designed with infographic chart. You may download this PPT slide to depict linear flow of steps. Add this slide to your presentation and impress your superiors.
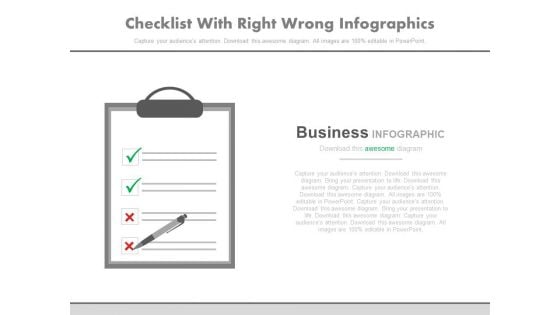
Checklist With Right Wrong Marks Powerpoint Slides
This PowerPoint template has been designed with checklist of right and wrong marks. You may download this PPT slide to depict relevant actions, or steps. Add this slide to your presentation and impress your superiors.
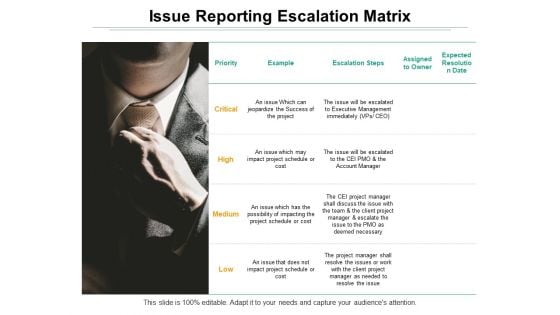
Issue Reporting Escalation Matrix Ppt PowerPoint Presentation Model Guide
This is a issue reporting escalation matrix ppt powerpoint presentation model guide. This is a four stage process. The stages in this process are priority, escalation steps, high, medium, low.
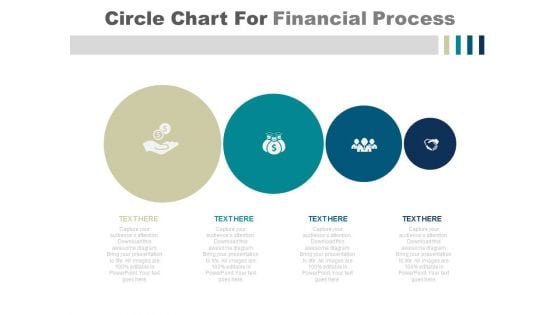
Circle Chart For Financial Planning Process PowerPoint Slides
This PowerPoint template has been created by professionals keeping in mind the need of light slides with more information. The slide uses minimalistic yet impactful visuals to explain a 4 step process. The reducing size of the circles can be creatively used to show that the process or the steps are getting an organization or a business firm closer to its targets or goals. There is ample space available to write text describe the steps involved in the process. This can be an ideal presentation for a company to show its financial plan or sales strategy to its investors or clients to gain their confidence. The icons and colors of the slide are customizable and can be edited to match the theme of the slide or the topic of the presentation.
Circle Chart With Business Icons PowerPoint Slides
Every organization or business has its own process of working. And everyone has to follow this. It is easy to say it this way. But won?t it be much better if your colleagues or teammates see it graphically. Presenting circle chart with icons PPT template which is displaying the complete process in equal forms. This slide is a six step process divided equally among all the colleagues. It can also be taken as the planning. Planning in six different steps in a loop form. All icons are customizable. You can replace the icons as per your choice. Use this PowerPoint template to support your presentation and make it look more perfect.
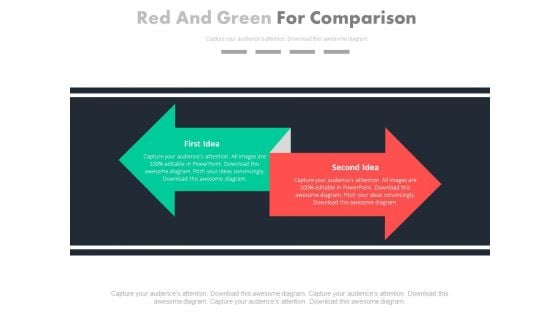
Green Left And Red Right Arrows For Comparison Powerpoint Slides
This professional slide contains graphics of green left and red right arrows. You may use this PowerPoint template to display opposite directions. Add this PPT slide to your presentation and impress your superiors.
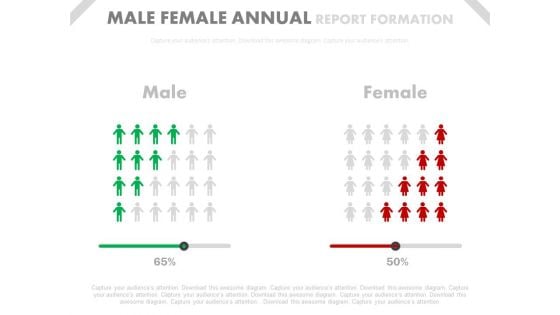
Male Female Ratio Comparison Chart Powerpoint Slides
This PowerPoint template has been designed with graphics of comparison chart. You may download this PPT slide to depict male female ratio comparison chart. Add this slide to your presentation and impress your superiors.
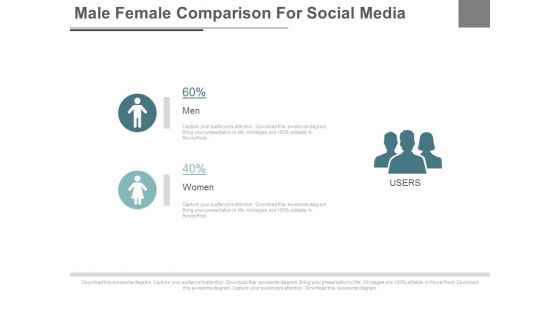
Male Female Social Media Users Powerpoint Slides
This PPT slide displays graphics of male female icons with percentage values. Use this PPT design to display male female ratios of social media users. This PowerPoint template can be customized as per requirements of business presentation.
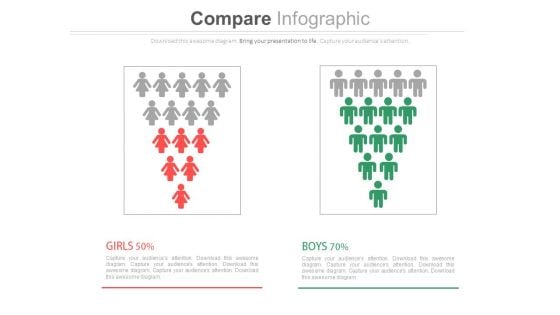
Male Female Gender Ratio Analysis Comparison Chart Powerpoint Slides
This PowerPoint template has been designed with graphics of male and female icons. Download this PPT slide to depict gender ratio analysis. Grab the attention of your team with this eye catching template.
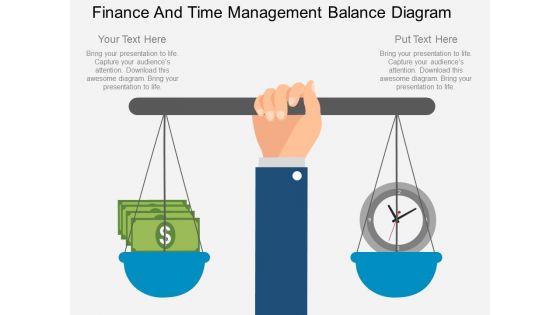
Finance And Time Management Balance Diagram Powerpoint Template
This PowerPoint template contains graphics of scale diagram with money and clock. This PPT slide is suitable to present money and time balance. Visual effect helps in maintaining the flow of the discussion and provides more clarity to the subject.
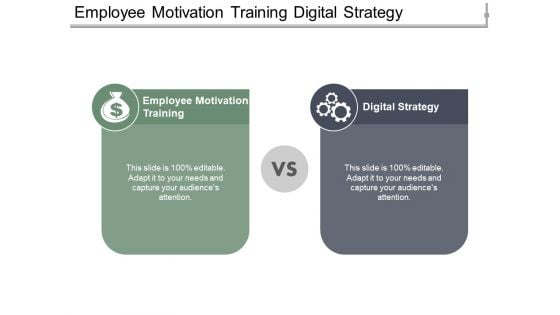
Employee Motivation Training Digital Strategy Employee Turnover Ratio Ppt PowerPoint Presentation Ideas Layout
This is a employee motivation training digital strategy employee turnover ratio ppt powerpoint presentation ideas layout. This is a stage process. The stages in this process are employee motivation training, digital strategy, employee turnover ratio.
Management Planning Business Support System Customer Experience Model Ppt PowerPoint Presentation Clipart
This is a management planning business support system customer experience model ppt powerpoint presentation clipart. This is a stage process. The stages in this process are management planning, business support system, customer experience model.
Work Space Authentication Process Flow Of Verification Factors Icons PDF
Pitch your topic with ease and precision using this work space authentication process flow of verification factors icons pdf. This layout presents information on rust relationship, authentication, corporate data center. It is also available for immediate download and adjustment. So, changes can be made in the color, design, graphics or any other component to create a unique layout.
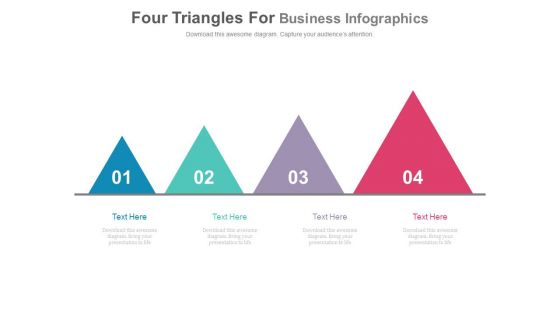
Four Triangles In Progressive Order Powerpoint Slides
The multicolored triangles in this slide can be used for various purposes. The differently sized triangles can be used by a company or an organization to present their growth over the years. The triangles can also be used to portray a comparison between different products or services being offered by a business and the increasing size can portray the added advantages of opting for the next package. The numbers inside the triangles can be used to demonstrate progressive steps involved in a process or a procedure. It can also be used to depict ways to get closer or to achieve a target. The triangles can effectively represent the departments as per their workload or importance.
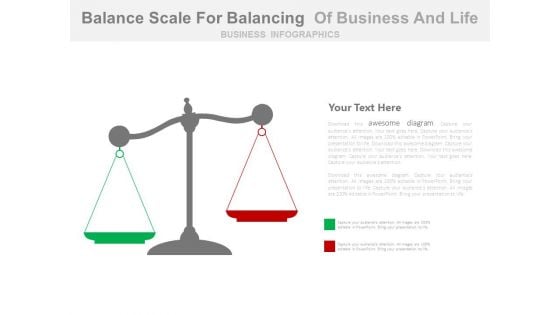
Balance Between Demand And Supply Powerpoint Slides
This PowerPoint template has been designed with graphics of balance scale. You may download this diagram slide to depict balance between demand and supply. Add this slide to your presentation and impress your superiors.
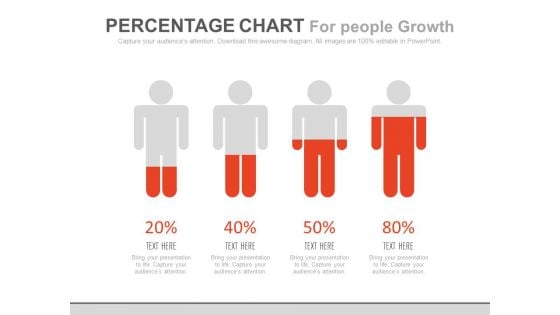
Percentage Chart For Personal Growth Powerpoint Slides
This PowerPoint template has been designed with four men icons with percentage ratios. You may download this diagram slide to depict personal growth. Add this PPT slide to your presentation and impress your superiors.

Twitter Google Plus Facebook Social Media Powerpoint Slides
This professional slide contains graphics of Twitter, Google plus and Face book social media logos. You may use this chart for comparison of social media sites. Add this slide to your presentation and impress your superiors.
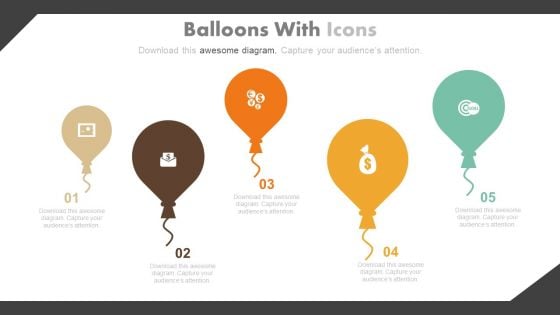
Balloons Diagram For Financial Goal Planning Powerpoint Slides
This PowerPoint template has been designed with graphics of balloons diagram. You may download this diagram slide to depict balance between demand and supply. Add this slide to your presentation and impress your superiors.
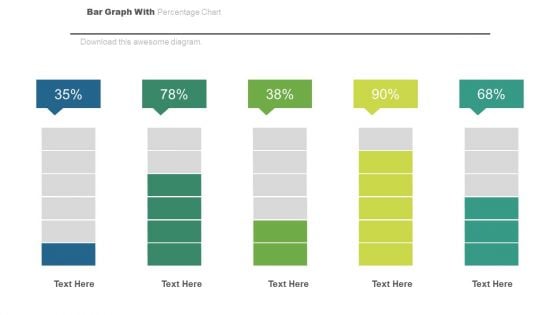
Bar Graph For Statistical Analysis Powerpoint Slides
This PowerPoint template has been designed with bar chart and percentage values. You may download this PPT slide to depict statistical analysis. Add this slide to your presentation and impress your superiors.
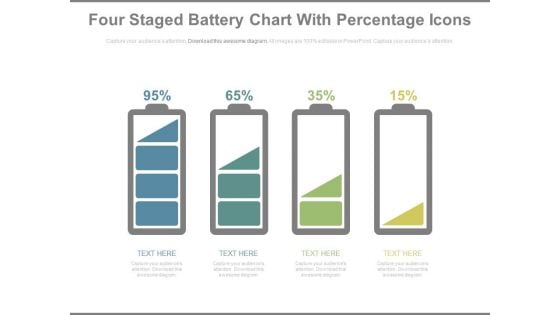
Battery Chart With Percentage Values For Comparison PowerPoint Slides
This year?s sales has matched up with your expectations. Now match this slide with your presentation to show the same. Show your company?s performance or business growth with this four staged battery chart PowerPoint template. With this slide, you can easily convince your colleagues how your company gave a tremendous growth over the years or months. Perfect illustration to show that the targets are achieved. This PPT template is easy to edit. You can choose the color of your choice. Your colleagues are already impressed with the sales growth. Now impress others and choose this PPT innovative designed template.
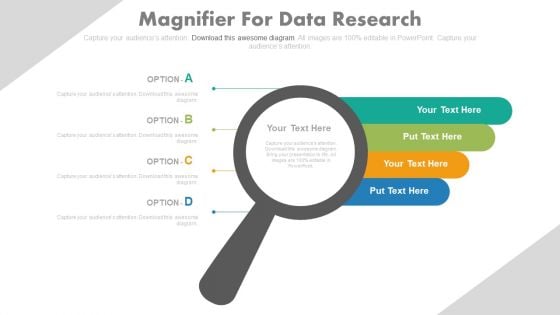
Magnifier With Four Options Tags Powerpoint Slides
The Magnifying glass used in this PowerPoint template can be used for various purposes. This slide can be the perfect answer to business or organizations dealing with investigation or rendering their services as a private detective or other investigation services. The slide can be effectively used to send across a message about verification or double checking of any kind of information. It can be used to imply in depth analysis of a report or minute details about meetings. The colorful tags can further be used to present the results or comparisons between available options or variants of products or services. The slide is customizable and icons and colors can be changed as per needs and convenience.

Three Swings In Numeric Order Powerpoint Slides
Graphics of swings with numbers have been displayed in this business slide. This PowerPoint template may be used to display organizational development strategy. Download this PowerPoint template to build an exclusive presentation.
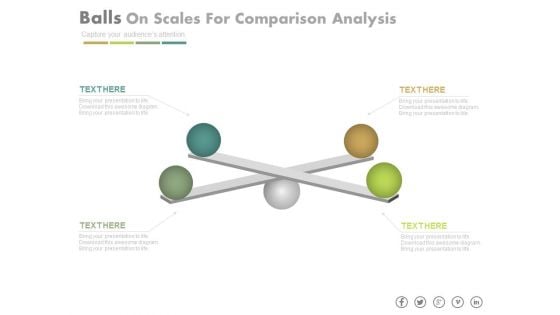
Four Balls On Scales For Comparison And Analysis Powerpoint Slides
This PowerPoint template has been designed with four balls on scales. You may download this PPT slide to depict comparison and analysis. Add this slide to your presentation and impress your superiors.
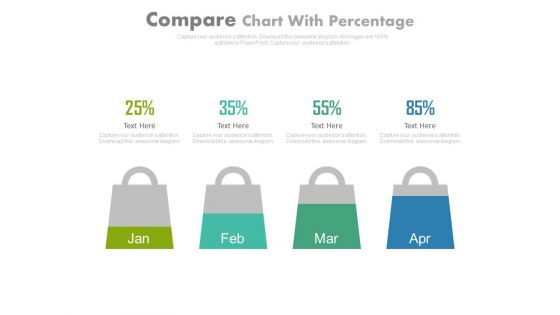
Four Months Sales Statistics Chart Powerpoint Slides
This PowerPoint template has been designed with four shopping bags with percentage values. Download this PPT slide to display four months sales statistics. Add this slide to your presentation and impress your superiors.
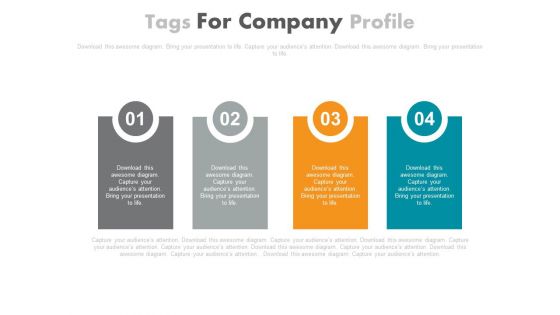
Four Text Tags In Linear Flow Powerpoint Slides
This PowerPoint template has been designed with four text tags in linear flow. You may download this PPT slide to display workflows or business processes. Add this slide to your presentation and impress your superiors.
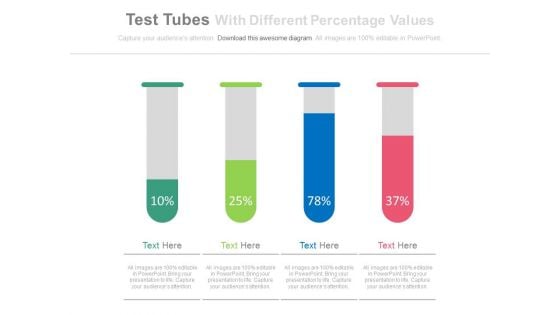
Test Tubes With Percentage Data For Comparison Powerpoint Slides
This PowerPoint template has been designed with test tubes and percentage data. You may download this PPT slide to display data comparison and analysis. Add this slide to your presentation and impress your superiors.
Three Banners With Process Control Icons Powerpoint Slides
This professional slide contains three text tags with icons. You may use this PowerPoint template to display task management and process control. Add this PPT slide to your presentation and impress your superiors.
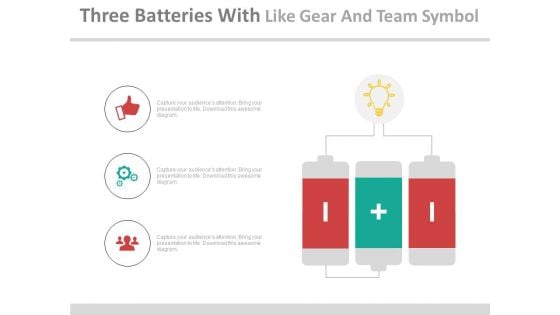
Three Batteries With Positive Negative Signs Powerpoint Slides
This PPT slide displays graphics of three batteries with positive and negative signs. Use this PPT design for visual display of comparison process. This PowerPoint template can be customized as per requirements of business education or any other theme.
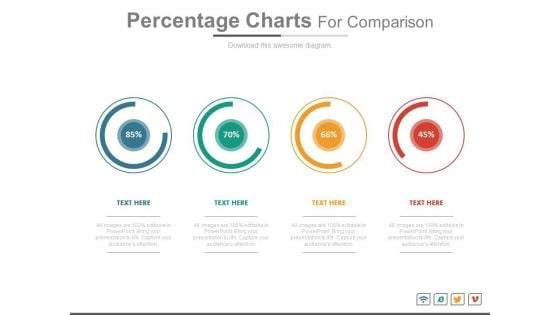
Percentage Charts For Statistical Comparison Powerpoint Slides
This PowerPoint template has been chart of percentage values. You may download this diagram for statistical comparison and analysis. Add this PPT slide to your presentation and impress your superiors.
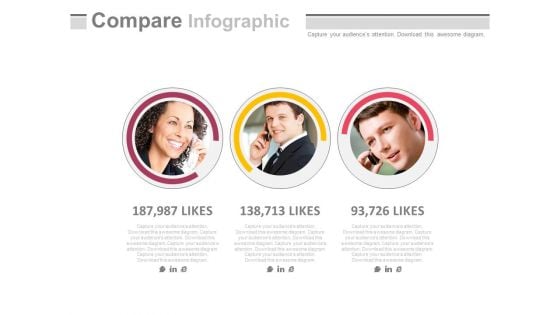
Social Media Management Tools Powerpoint Slides
This PowerPoint template has been designed with pictures of management team with social media icons. You may download this PPT slide to depict social media tools for business management. Add this slide to your presentation and impress your superiors.
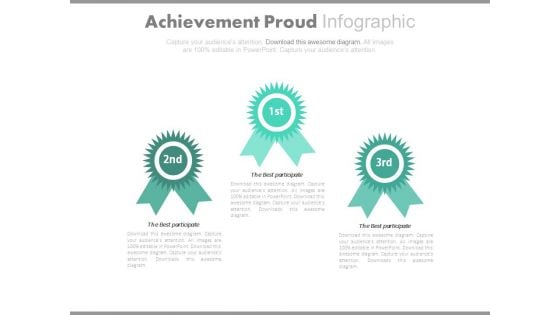
First Second Third Rank Ribbon Design Powerpoint Slides
This PowerPoint template has been designed with first, second and third rank winner ribbons. Download this PPT slide to depict concept of success and achievement. Grab the attention of your team with this eye catching template.
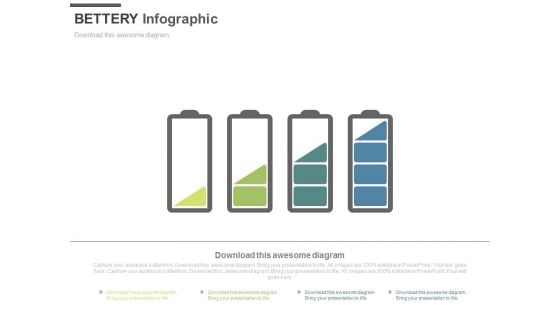
Four Batteries For Power Backup Storage Powerpoint Slides
This PPT slide contains graphics of four batteries. Download this PowerPoint template to depict concepts in informative and descriptive manner. Deliver amazing presentations to mesmerize your audience by using this PPT slide design.

Pyramid Design For Employees Performance Powerpoint Slides
This PPT slide contains graphics of pyramid diagram. Download this PowerPoint template to depict employee?s performance and analysis. Deliver amazing presentations to mesmerize your audience by using this slide design.

Three Tags For Data Comparison Powerpoint Slides
This PPT slide contains graphics of three tags. Download this PowerPoint template to depict data comparison in business presentations. Deliver amazing presentations to mesmerize your audience by using this PPT slide design.
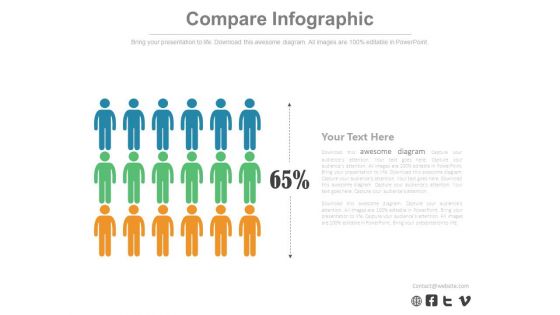
Three Teams Skill Analysis Comparison Chart Powerpoint Slides
Create visually stunning and define your PPT presentations in a unique and inspiring manner using our above template. It contains graphics of comparison chart. This business slide helps to display teams skill analysis. Deliver amazing presentations to mesmerize your audience by using this PPT slide design.


 Continue with Email

 Home
Home


