Compare Two
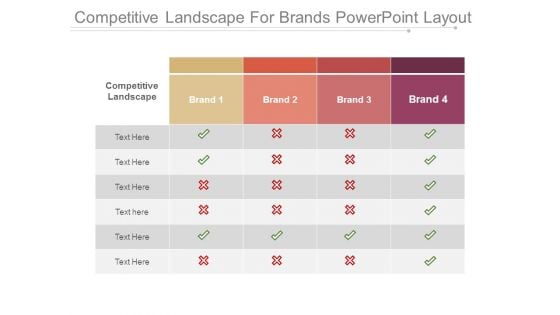
Competitive Landscape For Brands Powerpoint Layout
This is a competitive landscape for brands powerpoint layout. This is a four stage process. The stages in this process are competitive landscape, brand.
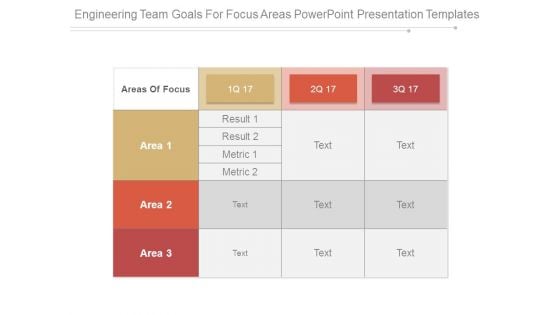
Engineering Team Goals For Focus Areas Powerpoint Presentation Templates
This is a engineering team goals for focus areas powerpoint presentation templates. This is a three stage process. The stages in this process are areas of focus, area, result, metric.
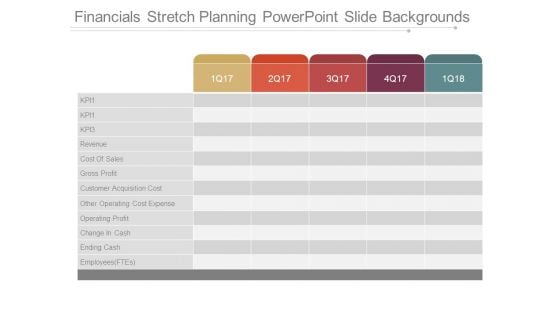
Financials Stretch Planning Powerpoint Slide Backgrounds
This is a financials stretch planning powerpoint slide backgrounds. This is a five stage process. The stages in this process are kp, revenue, cost of sales, gross profit, customer acquisition cost, other operating cost expense, operating profit, change in cash, ending cash, employees ftes.
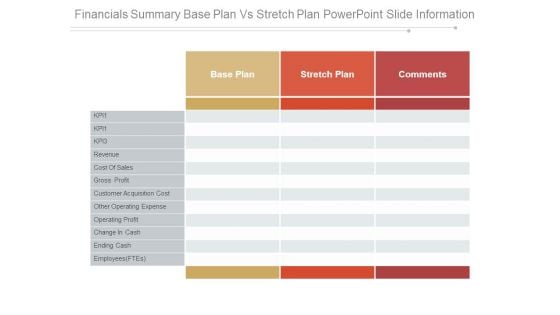
Financials Summary Base Plan Vs Stretch Plan Powerpoint Slide Information
This is a financials summary base plan vs stretch plan powerpoint slide information. This is a three stage process. The stages in this process are base plan, stretch plan, comments, kp, revenue, cost of sales, gross profit, customer acquisition cost, other operating expense, operating profit, change in cash, ending cash, employees ftes.
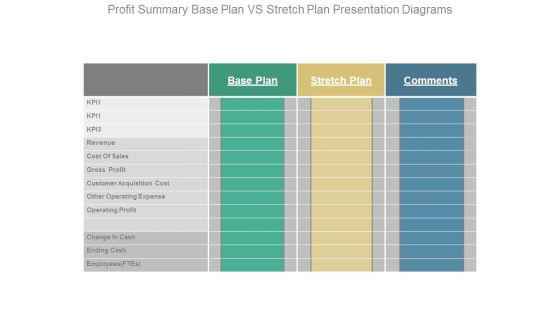
Profit Summary Base Plan Vs Stretch Plan Presentation Diagrams
This is a profit summary base plan vs stretch plan presentation diagrams. This is a three stage process. The stages in this process are base plan, stretch plan, comments, kpi, cost of sales, revenue, gross profit, customer acquisition cost, other operating expense, operating profit, change in cash, ending cash, employees ftes.
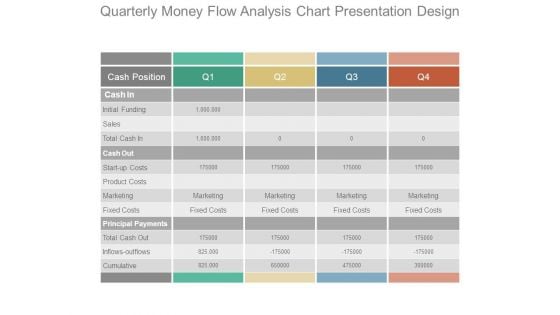
Quarterly Money Flow Analysis Chart Presentation Design
This is a quarterly money flow analysis chart presentation design. This is a four stage process. The stages in this process are cash position, cash in, initial funding, sales, total cash in, cash out, start up costs, product costs, marketing, fixed costs, principal payments, total cash out, inflows outflows, cumulative.
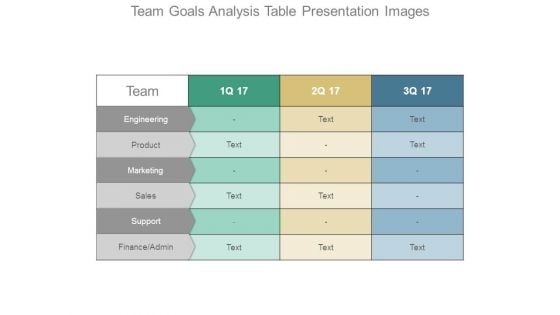
Team Goals Analysis Table Presentation Images
This is a team goals analysis table presentation images. This is a three stage process. The stages in this process are team, engineering, product, marketing, sales, support, finance admin.
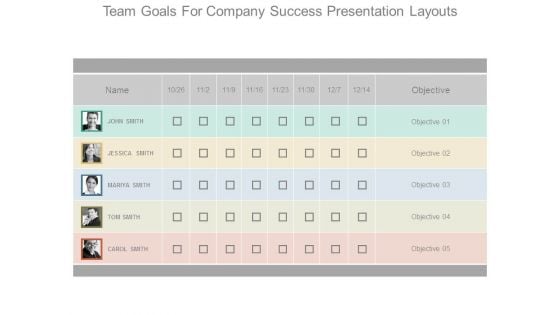
Team Goals For Company Success Presentation Layouts
This is a team goals for company success presentation layouts. This is a five stage process. The stages in this process are name, objective, john smith, jessica smith, mariya smith, tom smith, carol smith.
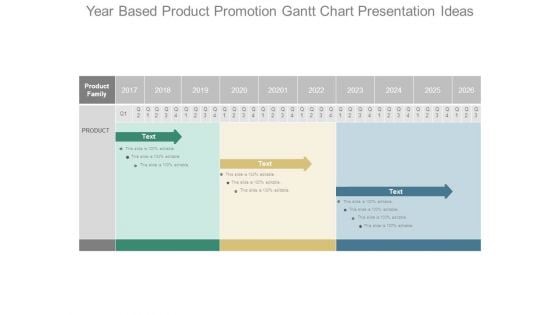
Year Based Product Promotion Gantt Chart Presentation Ideas
This is a year based product promotion gantt chart presentation ideas. This is a three stage process. The stages in this process are product family, product.
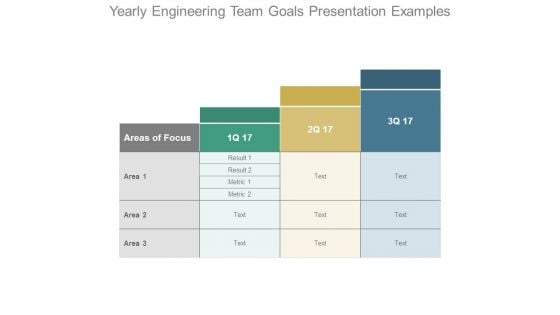
Yearly Engineering Team Goals Presentation Examples
This is a yearly engineering team goals presentation examples. This is a three stage process. The stages in this process are areas of focus, result, matric, area.
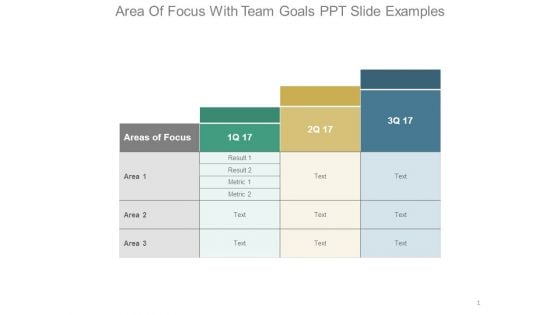
Area Of Focus With Team Goals Ppt Slide Examples
This is a area of focus with team goals ppt slide examples. This is a three stage process. The stages in this process are areas of focus, area, result, matric, text.
Average Calculating Customer Lifetime Value Clv Table Ppt Icon
This is a average calculating customer lifetime value clv table ppt icon. This is a five stage process. The stages in this process are complete clv year, average acquisition cost, average customer revenue, average customer costs, average customer profit, customer retention rate, cumulative retention rate, likely customer profit, discount rate, clv per year, cumulative clv.
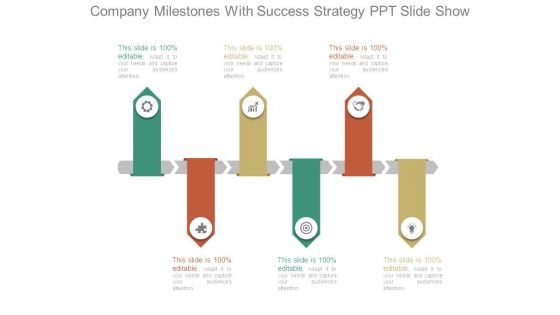
Company Milestones With Success Strategy Ppt Slide Show
This is a company milestones with success strategy ppt slide show. This is a six stage process. The stages in this process are arrows, business, marketing, management, icons.
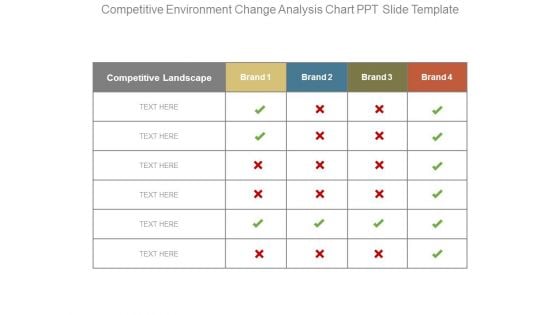
Competitive Environment Change Analysis Chart Ppt Slide Template
This is a competitive environment change analysis chart ppt slide template. This is a four stage process. The stages in this process are competitive landscape, brand.

Financials Base Plan Table Chart Ppt Slide Templates
This is a financials base plan table chart ppt slide templates. This is a five stage process. The stages in this process are kpi, revenue, cost of sales, gross profit, customer acquisition cost, other operating cost expense, operating profit, change in cash, ending cash, employees ftes.
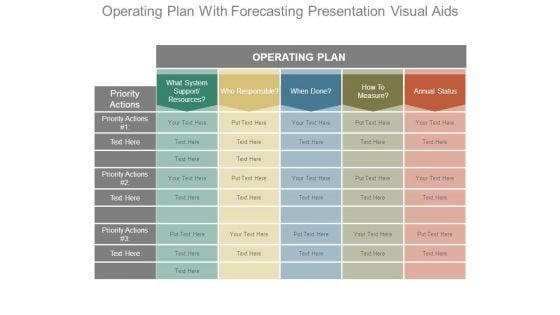
Operating Plan With Forecasting Presentation Visual Aids
This is a operating plan with forecasting presentation visual aids. This is a five stage process. The stages in this process are operating plan, what system support resources, who responsible, when done, how to measure, annual status, priority actions.
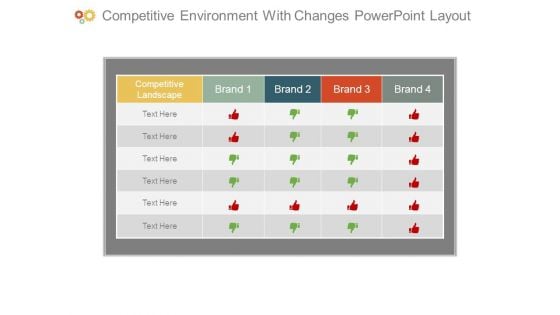
Competitive Environment With Changes Powerpoint Layout
This is a competitive environment with changes powerpoint layout. This is a four stage process. The stages in this process are competitive landscape, brand.
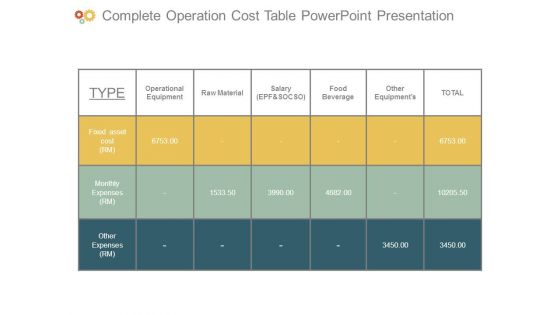
Complete Operation Cost Table Powerpoint Presentation
This is a complete operation cost table powerpoint presentation. This is a six stage process. The stages in this process are type, fixed asset cost rm, monthly expenses rm, other expenses rm, operational equipment, raw material, salary epf and socso, food beverage, other equipments, total.
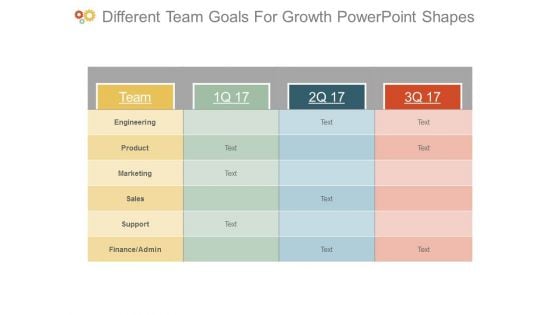
Different Team Goals For Growth Powerpoint Shapes
This is a different team goals for growth powerpoint shapes. This is a three stage process. The stages in this process are team, engineering, product, marketing, sales, support, finance admin.
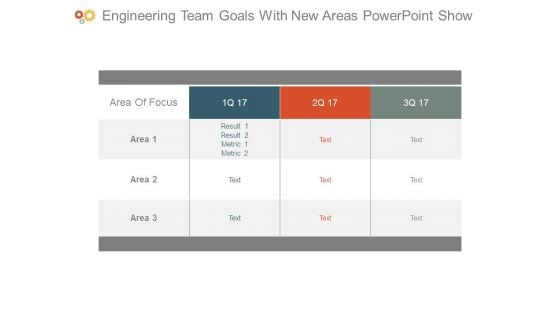
Engineering Team Goals With New Areas Powerpoint Show
This is a engineering team goals with new areas powerpoint show. This is a three stage process. The stages in this process are area of focus, area, result.
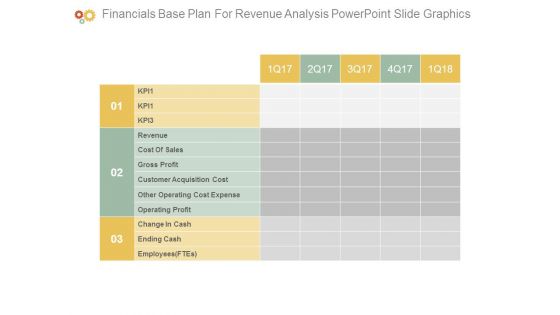
Financials Base Plan For Revenue Analysis Powerpoint Slide Graphics
This is a financials base plan for revenue analysis powerpoint slide graphics. This is a three stage process. The stages in this process are kp, revenue, cost of sales, gross profit, customer acquisition cost, other operating cost expense, operating profit, change in cash, ending cash, employees ftes.

Lifetime Customer Value Lcv Display Table Powerpoint Themes
This is a lifetime customer value lcv display table powerpoint themes. This is a five stage process. The stages in this process are complete clv year, average acquisition cost, average customer revenue, average customer costs, average customer profit, customer retention rate, cumulative retention rate, likely customer profit, discount rate, clv per year, cumulative clv.
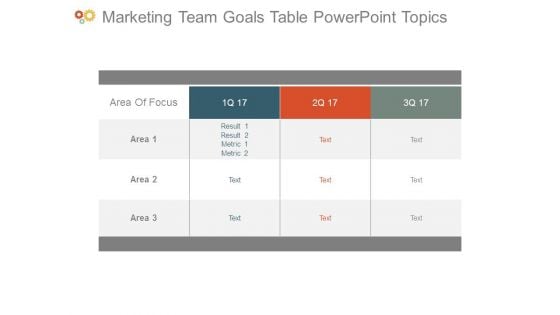
Marketing Team Goals Table Powerpoint Topics
This is a marketing team goals table powerpoint topics. This is a three stage process. The stages in this process are area of focus, area, result, metric.
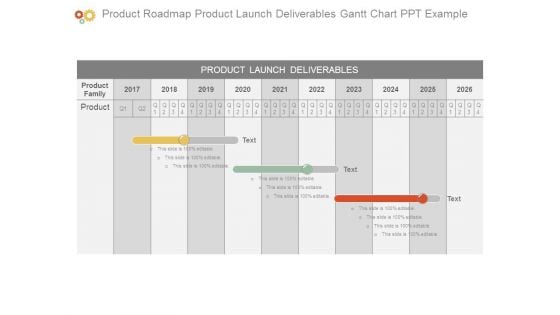
Product Roadmap Product Launch Deliverables Gantt Chart Ppt Example
This is a product roadmap product launch deliverables gantt chart ppt example. This is a three stage process. The stages in this process are product launch deliverables, product family, product.
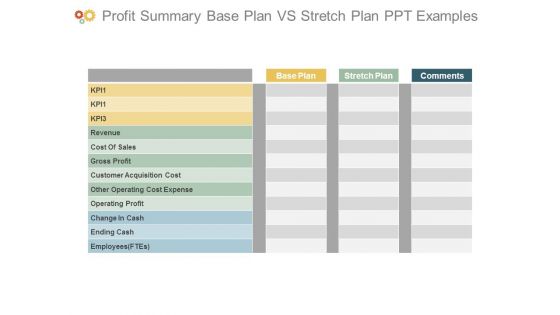
Profit Summary Base Plan Vs Stretch Plan Ppt Examples
This is a profit summary base plan vs stretch plan ppt examples. This is a three stage process. The stages in this process are base plan, kp, revenue, stretch plan, comments, cost of sales, gross profit, customer acquisition cost, other operating cost expense, operating profit, change in cash, ending cash, employees ftes.
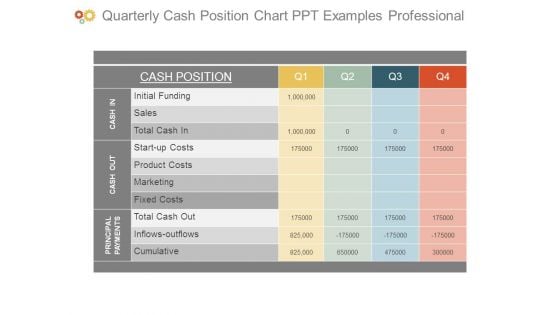
Quarterly Cash Position Chart Ppt Examples Professional
This is a quarterly cash position chart ppt examples professional. This is a four stage process. The stages in this process are cash position, initial funding, sales, total cash in, start up costs, product costs, marketing, fixed costs, total cash out, inflows outflows, cumulative, cash in, cash out, principal payments.
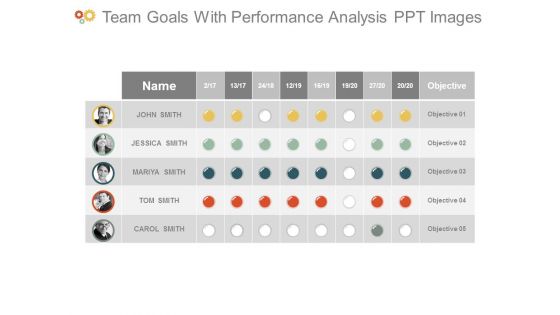
Team Goals With Performance Analysis Ppt Images
This is a team goals with performance analysis ppt images. This is a five stage process. The stages in this process are name, john smith, jessica smith, mariya smith, tom smith, carol smith, objective.
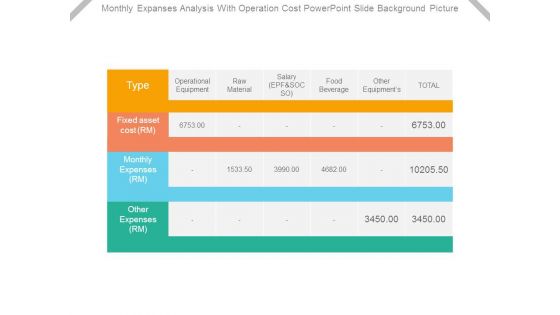
Monthly Expanses Analysis With Operation Cost Powerpoint Slide Background Picture
This is a monthly expanses analysis with operation cost powerpoint slide background picture. This is a six stage process. The stages in this process are type, operational equipment, raw material, salary epf and socso, food beverage, other equipment, total, fixed asset cost rm, monthly expenses rm, other expenses rm.
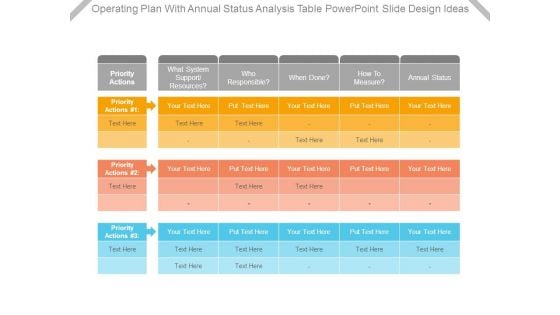
Operating Plan With Annual Status Analysis Table Powerpoint Slide Design Ideas
This is a operating plan with annual status analysis table powerpoint slide design ideas. This is a five stage process. The stages in this process are priority actions, what system support resources, who responsible, when done, how to measure, annual status.
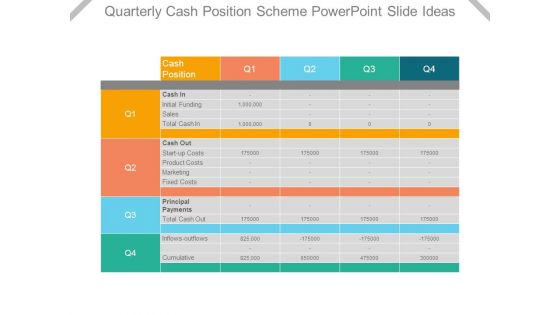
Quarterly Cash Position Scheme Powerpoint Slide Ideas
This is a quarterly cash position scheme powerpoint slide ideas. This is a four stage process. The stages in this process are cash position, initial funding, cash in, sales, total cash in, cash out, start up costs, product costs, marketing, fixed costs, principal, payments, total cash out, inflows outflows, cumulative.
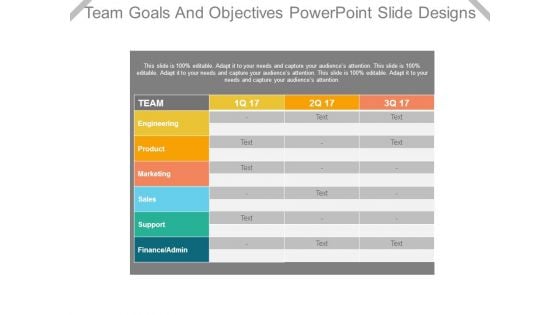
Team Goals And Objectives Powerpoint Slide Designs
This is a team goals and objectives powerpoint slide designs. This is a three stage process. The stages in this process are team, engineering, product, marketing, sales, support, finance admin.
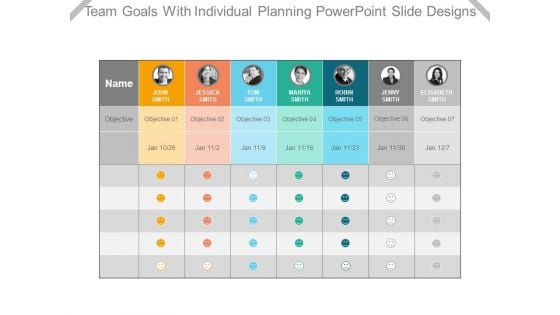
Team Goals With Individual Planning Powerpoint Slide Designs
This is a team goals with individual planning powerpoint slide designs. This is a seven stage process. The stages in this process are john smith, jessica smith, tom smith, mariya smith, robin smith, jenny smith, elisabeth smith, objective, name, jan.
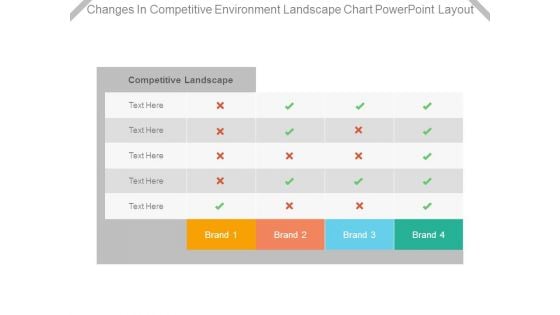
Changes In Competitive Environment Landscape Chart Powerpoint Layout
This is a changes in competitive environment landscape chart powerpoint layout. This is a four stage process. The stages in this process are competitive landscape, brand.
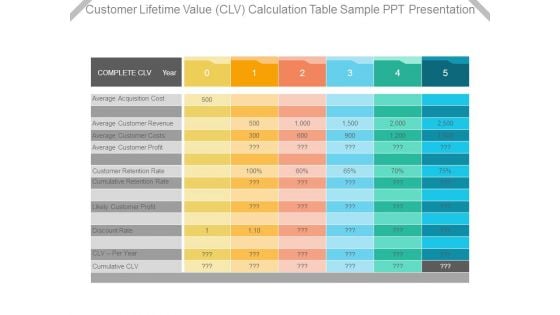
Customer Lifetime Value Clv Calculation Table Sample Ppt Presentation
This is a customer lifetime value clv calculation table sample ppt presentation. This is a five stage process. The stages in this process are complete clv year, average acquisition cost, average customer revenue, average customer costs, average customer profit, customer retention rate, cumulative retention rate, likely customer profit, discount rate, clv per year, cumulative clv.
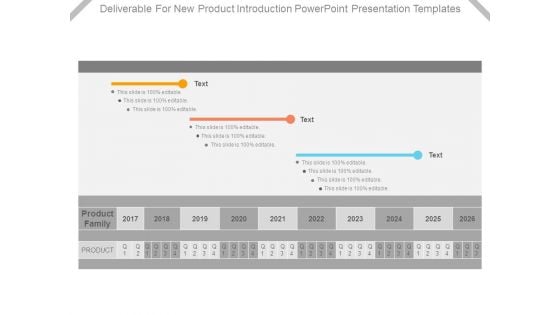
Deliverable For New Product Introduction Powerpoint Presentation Templates
This is a deliverable for new product introduction powerpoint presentation templates. This is a three stage process. The stages in this process are product family, product.
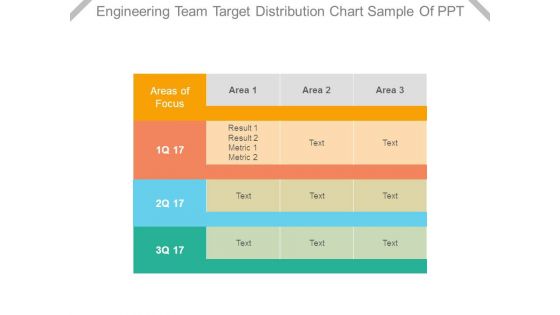
Engineering Team Target Distribution Chart Sample Of Ppt
This is a engineering team target distribution chart sample of ppt. This is a three stage process. The stages in this process are areas of focus, area, result, metric.
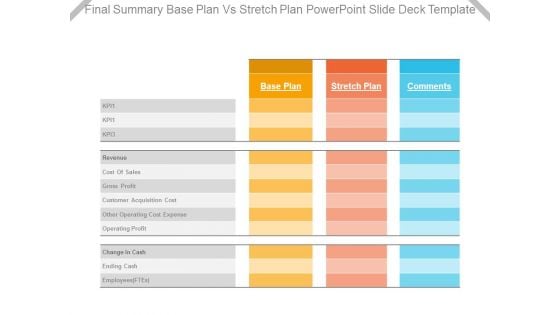
Final Summary Base Plan Vs Stretch Plan Powerpoint Slide Deck Template
This is a final summary base plan vs stretch plan powerpoint slide deck template. This is a three stage process. The stages in this process are kpi, revenue, cost of sales, gross profit, customer acquisition cost, other operating cost expense, operating profit, change in cash, ending cash, employees ftes.
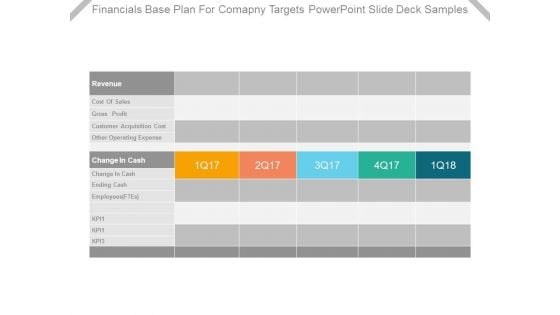
Financials Base Plan For Company Targets Powerpoint Slide Deck Samples
This is a financials base plan for company targets powerpoint slide deck samples. This is a five stage process. The stages in this process are revenue, cost of sales, gross profit, customer acquisition cost, other operating expense, change in cash, change in cash, ending cash, employees ftes, kpi.
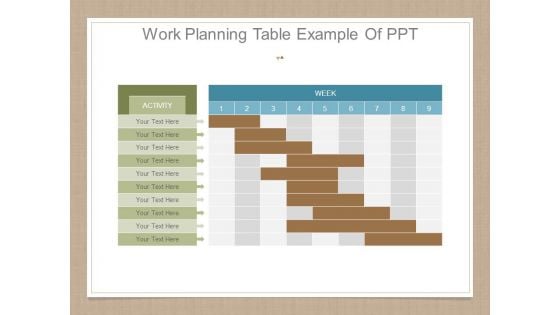
Work Planning Table Example Of Ppt
This is a work planning table example of ppt. This is a nine stage process. The stages in this process are activity, week.
Work Schedule Template 111 Ppt Icon
This is a work schedule template 111 ppt icon. This is a one stage process. The stages in this process are acceptance of the research proposal, talks with local representatives in study area, development of research tools, sample selection and talks with community, training of enumerators.

Effective Work Scheduling Powerpoint Slide Background Picture
This is a effective work scheduling powerpoint slide background picture. This is a nine stage process. The stages in this process are business, marketing, table, scheduling, management.
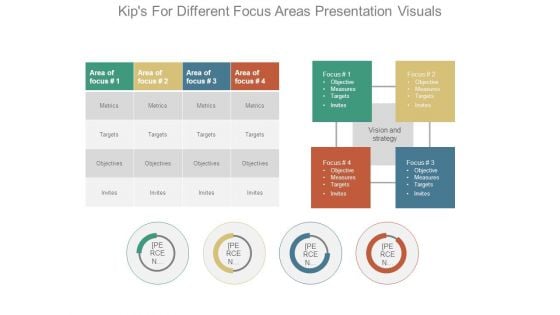
Kips For Different Focus Areas Presentation Visuals
This is a kips for different focus areas presentation visuals. This is a four stage process. The stages in this process are area of focus, metrics, targets, objectives, invites, vision and strategy, focus.
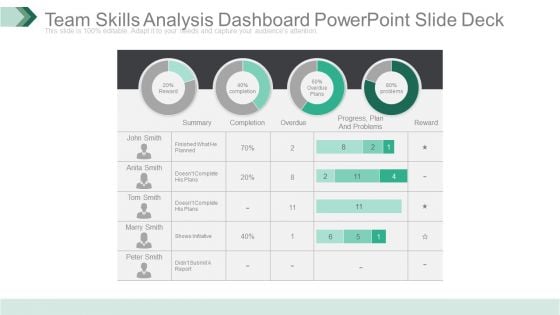
Team Skills Analysis Dashboard Powerpoint Slide Deck
This is a team skills analysis dashboard powerpoint slide deck. This is a four stage process. The stages in this process are reward, summary, completion, overdue, progress plan and problems, problems, reward.
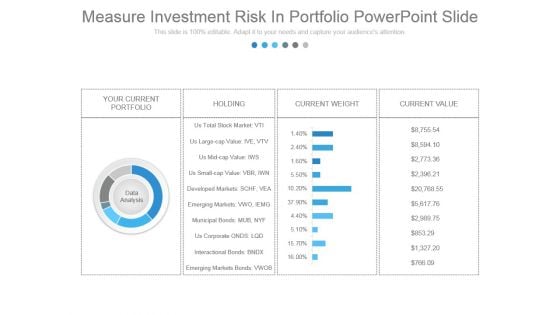
Measure Investment Risk In Portfolio Powerpoint Slide
This is a measure investment risk in portfolio powerpoint slide. This is a four stage process. The stages in this process are your current portfolio, holding, current weight, current value, data analysis, us total stock market vti, us large cap value ive vtv, us mid cap value iws, us small cap value vbr iwn, developed markets schf, vea, emerging markets vwo, iemg, municipal bonds mub, nyf, us corporate onds lqd, interactional bonds bndx, emerging markets bonds vwob.
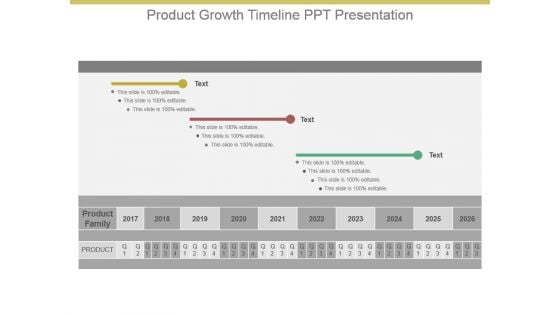
Product Growth Timeline Ppt Presentation
This is a product growth timeline ppt presentation. This is a three stage process. The stages in this process are product family, product, q.
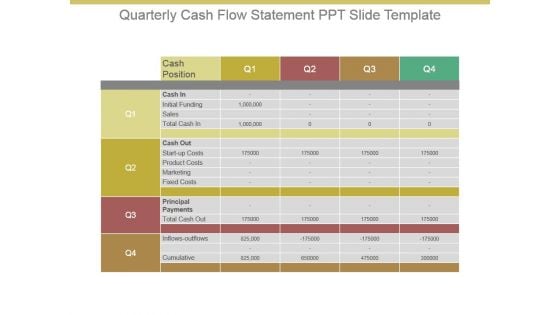
Quarterly Cash Flow Statement Ppt Slide Template
This is a quarterly cash flow statement ppt slide template. This is a four stage process. The stages in this process are cash position, cash in, initial funding, sales, total cash in, cash out, start up costs, product costs, marketing, fixed costs, principal payments, total cash out, inflows outflows, cumulative, q.

Target Objectives For Three Quarters Ppt Model
This is a target objectives for three quarters ppt model. This is a seven stage process. The stages in this process are name, john smith, jessica smith, tom smith, maria smith, robin smith, elizabeth smith, objective, jan.
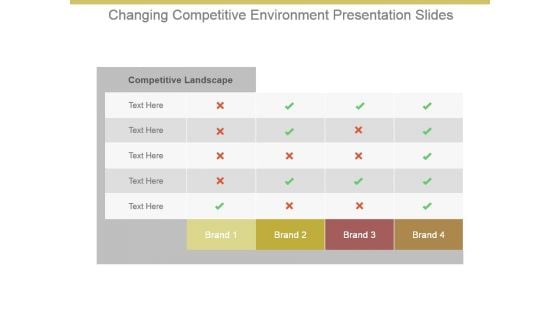
Changing Competitive Environment Presentation Slides
This is a changing competitive environment presentation slides. This is a four stage process. The stages in this process are competitive landscape, brand.
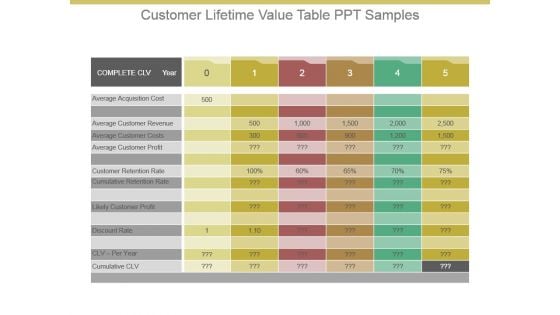
Customer Lifetime Value Table Ppt Samples
This is a customer lifetime value table ppt samples. This is a five stage process. The stages in this process are complete clv year, average acquisition cost, average customer revenue, average customer costs, average customer profit, customer retention rate, likely customer profit, discount rate, clv per year, cumulative clv, cumulative retention rate.
Finance Management Metrics Ppt Slide Templates
This is a finance management metrics ppt slide templates. This is a nine stage process. The stages in this process are business, marketing, management, table.
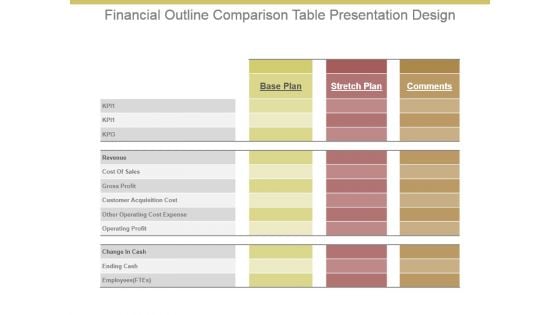
Financial Outline Comparison Table Presentation Design
This is a financial outline comparison table presentation design. This is a three stage process. The stages in this process are base plan, stretch plan, comments, kp, revenue, cost of sales, gross profit, customer acquisition cost, other operating cost expense, operating profit, change in cash, ending cash, employees ftes.
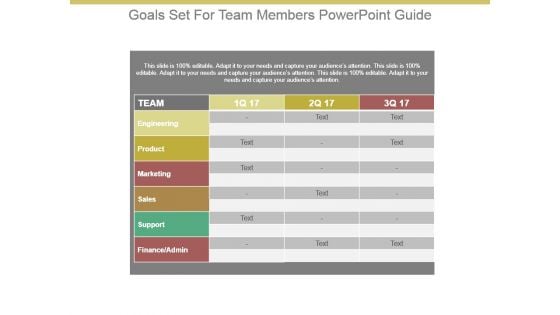
Goals Set For Team Members Powerpoint Guide
This is a goals set for team members powerpoint guide. This is a three stage process. The stages in this process are team, iq, engineering, product, marketing, sales, support, finance admin.
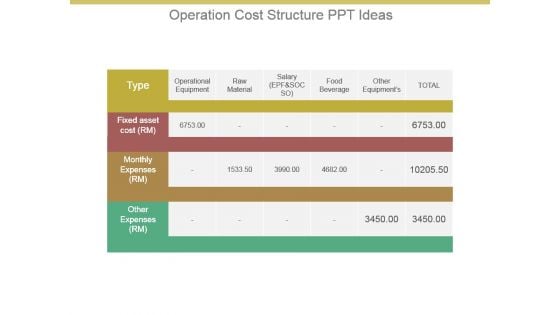
Operation Cost Structure Ppt Ideas
This is a operation cost structure ppt ideas. This is a four stage process. The stages in this process are type, operational equipment, raw material, salary epf and socso, food beverage, other equipments, total, fixed asset cost rm, monthly expenses rm, other expenses rm.
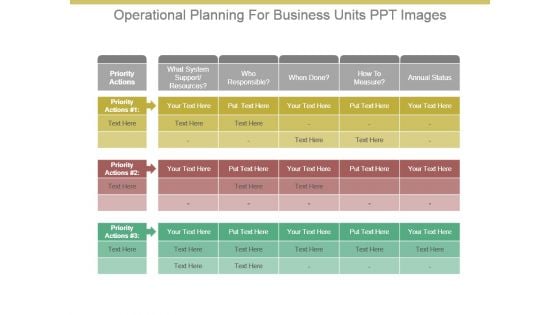
Operational Planning For Business Units Ppt Images
This is a operational planning for business units ppt images. This is a four stage process. The stages in this process are priority actions, what system support resources, who responsible, when done, how to measure, annual status, priority actions.
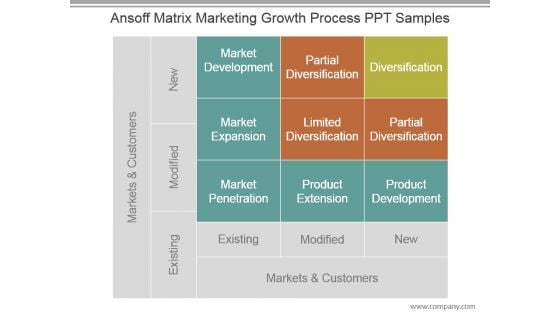
Ansoff Matrix Marketing Growth Process Ppt Samples
This is a ansoff matrix marketing growth process ppt samples. This is a one stage process. The stages in this process are markets and customers, existing, modified, new, market development, partial diversification, diversification, market expansion, limited diversification, market penetration, product extension, product development.

Customer Satisfaction Framework Ppt Slide
This is a customer satisfaction framework ppt slide. This is a seven stage process. The stages in this process are task items, item.
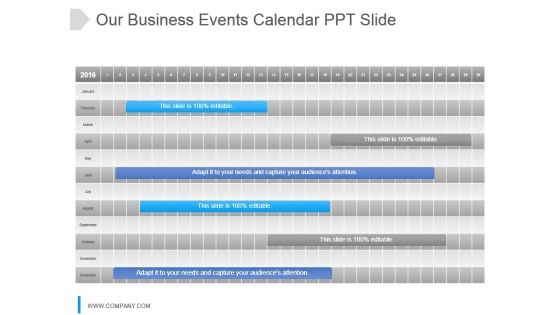
Our Business Events Calendar Ppt Slide
This is a our business events calendar ppt slide. This is a twelve stage process. The stages in this process are january, february, march, april, may, june, july, august, september, october, november, december.
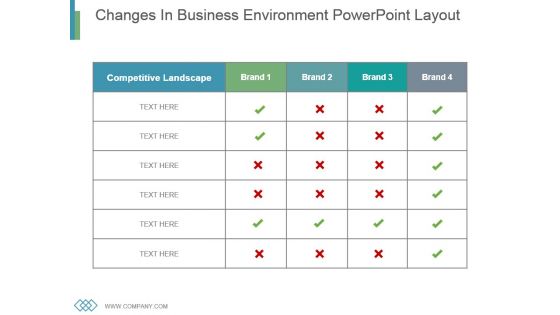
Changes In Business Environment Powerpoint Layout
This is a changes in business environment powerpoint layout. This is a four stage process. The stages in this process are business, marketing, management, competitive, sign.
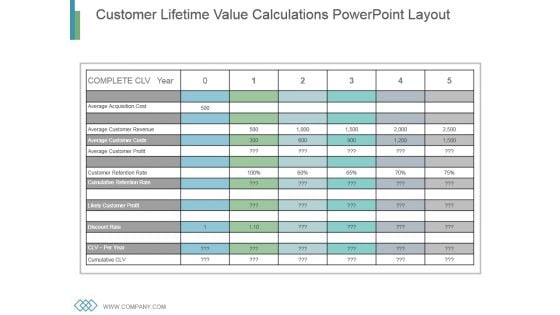
Customer Lifetime Value Calculations Powerpoint Layout
This is a customer lifetime value calculations powerpoint layout. This is a six stage process. The stages in this process are average acquisition cost, average customer revenue, average customer profit, customer retention rate, discount rate.
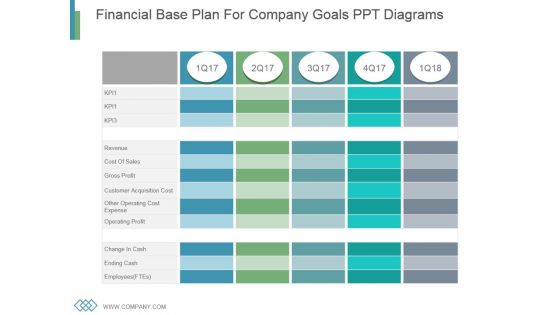
Financial Base Plan For Company Goals Ppt Diagrams
This is a financial base plan for company goals ppt diagrams. This is a five stage process. The stages in this process are revenue, cost of sales, gross profit, customer acquisition cost, other operating cost expense, operating profit, change in cash, ending cash, employees.


 Continue with Email

 Home
Home


