Comparison Dashboard

Financial Performance Pharmaceutical R And D Company Pitch Deck
This slide highlights the financial performance of the biopharmaceutical company. It highlights KPIs such as EV, revenue, EBITDA, net income, total assets, and total debt. Present like a pro with Financial Performance Pharmaceutical R And D Company Pitch Deck. Create beautiful presentations together with your team, using our easy-to-use presentation slides. Share your ideas in real-time and make changes on the fly by downloading our templates. So whether you are in the office, on the go, or in a remote location, you can stay in sync with your team and present your ideas with confidence. With Slidegeeks presentation got a whole lot easier. Grab these presentations today. This slide highlights the financial performance of the biopharmaceutical company. It highlights KPIs such as EV, revenue, EBITDA, net income, total assets, and total debt.
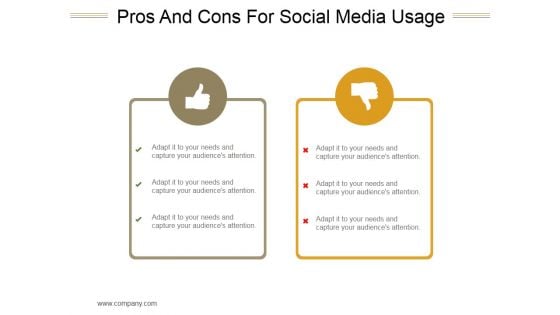
Pros And Cons For Social Media Usage Ppt PowerPoint Presentation Ideas
This is a pros and cons for social media usage ppt powerpoint presentation ideas. This is a two stage process. The stages in this process are social media, business, marketing, management, strategy.
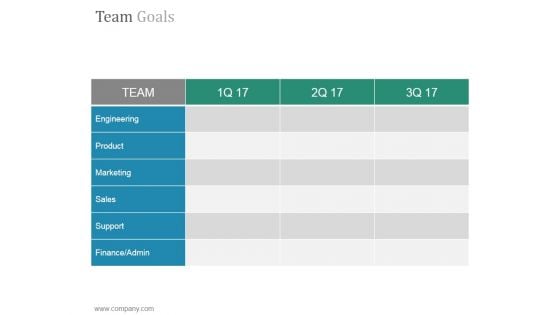
Team Goals Slide Ppt PowerPoint Presentation Tips
This is a team goals slide ppt powerpoint presentation tips. This is a six stage process. The stages in this process are engineering, product, marketing, sales, support, finance admin.
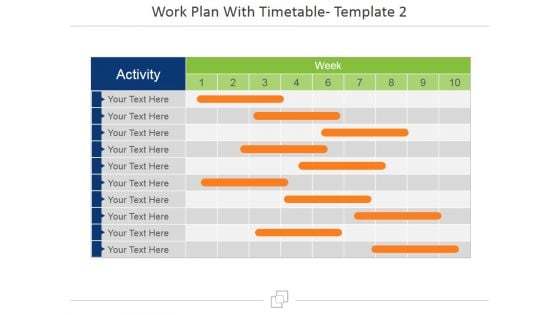
Work Plan With Timetable Template 2 Ppt PowerPoint Presentation Inspiration Graphics
This is a work plan with timetable template 2 ppt powerpoint presentation inspiration graphics. This is a ten stage process. The stages in this process are week, activity, business, marketing, table.
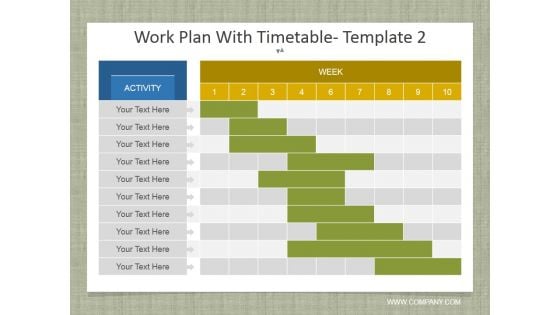
Work Plan With Timetable Template 2 Ppt PowerPoint Presentation File Ideas
This is a work plan with timetable template 2 ppt powerpoint presentation file ideas. This is a ten stage process. The stages in this process are table, activity, business, marketing, plan.
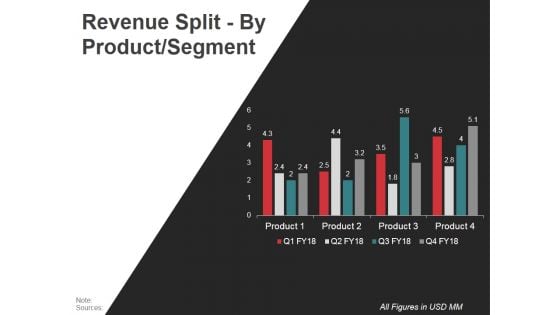
Revenue Split By Product Segment Template Ppt PowerPoint Presentation Graphics
This is a revenue split by product segment template ppt powerpoint presentation graphics. This is a four stage process. The stages in this process are product, business, marketing, planning, process.
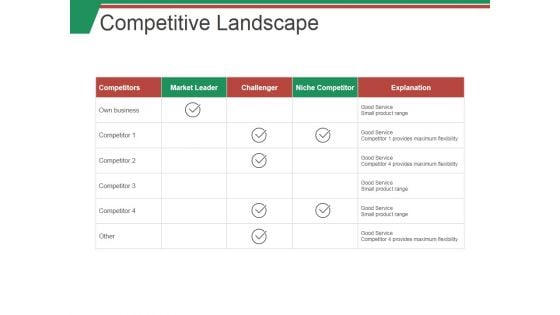
Competitive Landscape Ppt PowerPoint Presentation Pictures Microsoft
This is a competitive landscape ppt powerpoint presentation pictures microsoft. This is a four stage process. The stages in this process are competitors, market leader, challenger, niche competitor, explanation.
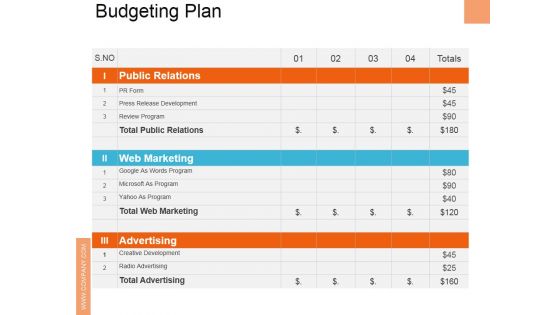
Budgeting Plan Ppt PowerPoint Presentation Show Slide Download
This is a budgeting plan ppt powerpoint presentation show slide download. This is a four stage process. The stages in this process are public relations, web marketing, advertising, press release development, review program.
Evaluating Scores Ppt PowerPoint Presentation Icon Model
This is a evaluating scores ppt powerpoint presentation icon model. This is a eight stage process. The stages in this process are evaluator, strategic, product advantage, market attractiveness, leverage competencies.
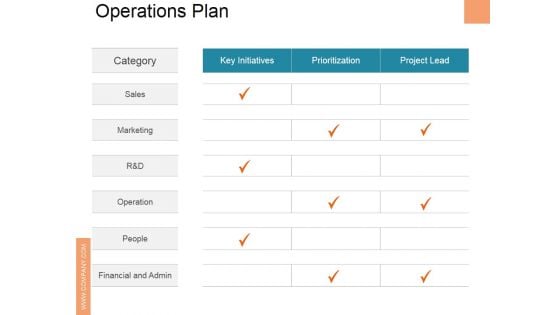
Operations Plan Ppt PowerPoint Presentation Pictures Example
This is a operations plan ppt powerpoint presentation pictures example. This is a three stage process. The stages in this process are key initiatives, prioritization, project lead, sales, marketing.
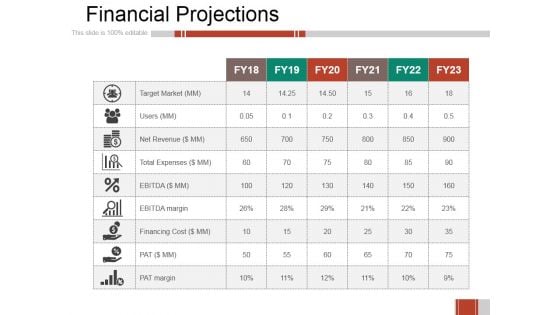
Financial Projections Ppt PowerPoint Presentation Styles Microsoft
This is a financial projections ppt powerpoint presentation styles microsoft. This is a six stage process. The stages in this process are target market, users, net revenue, total expenses, financing cost.
Budgeting Template Ppt PowerPoint Presentation Icon Examples
This is a budgeting template ppt powerpoint presentation icon examples. This is a four stage process. The stages in this process are public relations, web marketing, advertising, press release development, microsoft as program.
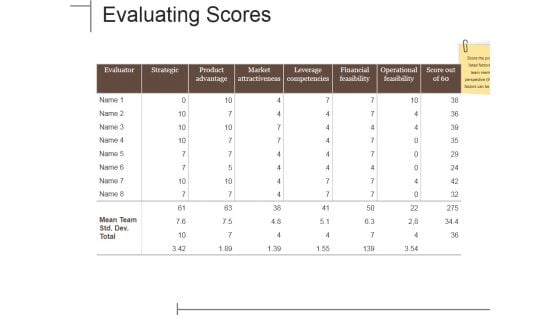
Evaluating Scores Ppt PowerPoint Presentation Infographics Rules
This is a evaluating scores ppt powerpoint presentation infographics rules. This is a seven stage process. The stages in this process are strategic, product advantage, market attractiveness, leverage competencies, financial feasibility, operational feasibility.
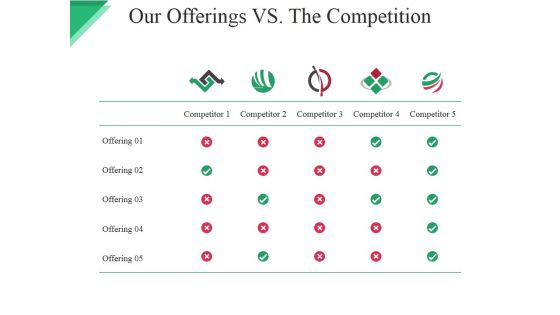
Our Offerings Vs The Competition Ppt PowerPoint Presentation Summary Design Inspiration
This is a our offerings vs the competition ppt powerpoint presentation summary design inspiration. This is a five stage process. The stages in this process are business, marketing, strategy, planning, process.
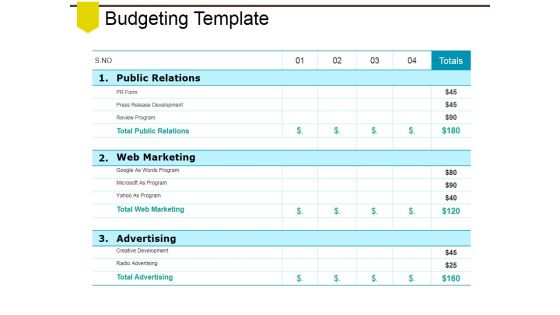
Budgeting Template Ppt PowerPoint Presentation Styles Pictures
This is a budgeting template ppt powerpoint presentation styles pictures. This is a three stage process. The stages in this process are public relations, web marketing, advertising, press release development, review program.
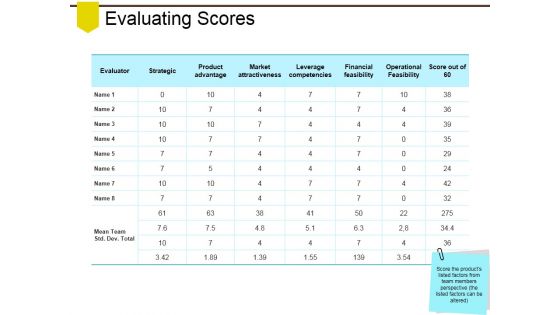
Evaluating Scores Ppt PowerPoint Presentation Summary Portrait
This is a evaluating scores ppt powerpoint presentation summary portrait. This is a three stage process. The stages in this process are evaluator, strategic, product advantage, market attractiveness, leverage competencies.
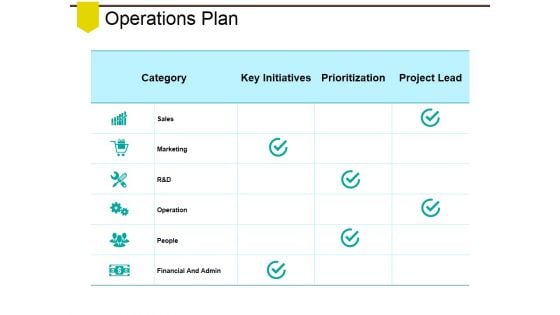
Operations Plan Ppt PowerPoint Presentation Model Samples
This is a operations plan ppt powerpoint presentation model samples. This is a three stage process. The stages in this process are sales, marketing, operation, people, financial and admin.
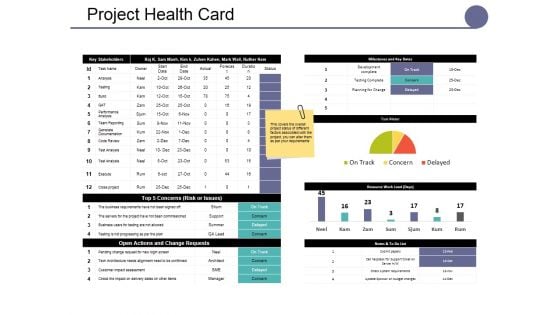
Project Health Card Template Ppt PowerPoint Presentation Summary Smartart
This is a project health card template ppt powerpoint presentation summary smartart. This is a six stage process. The stages in this process are business, marketing, strategy, planning, finance.
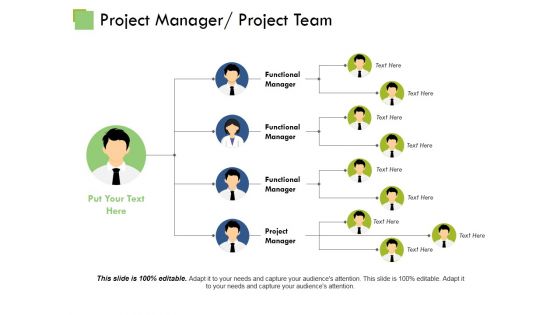
Project Manager Project Team Template Ppt PowerPoint Presentation Layouts Examples
This is a project manager project team template ppt powerpoint presentation layouts examples. This is a five stage process. The stages in this process are table, marketing, strategy, planning, communication.
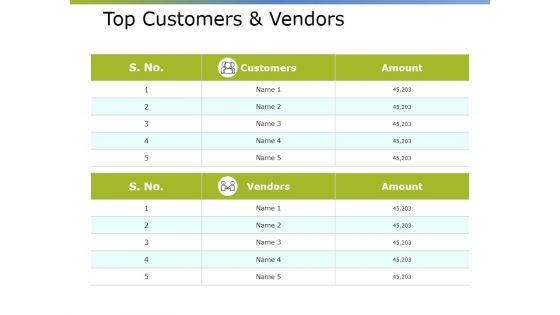
Top Customers And Vendors Ppt PowerPoint Presentation Infographic Template Example 2015
This is a top customers and vendors ppt powerpoint presentation infographic template example 2015. This is a two stage process. The stages in this process are business, marketing, strategy, planning, tables.
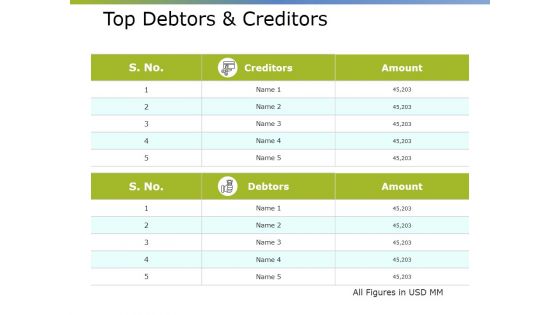
Top Debtors And Creditors Ppt PowerPoint Presentation Professional Design Ideas
This is a top debtors and creditors ppt powerpoint presentation professional design ideas. This is a two stage process. The stages in this process are business, marketing, strategy, planning, tables.
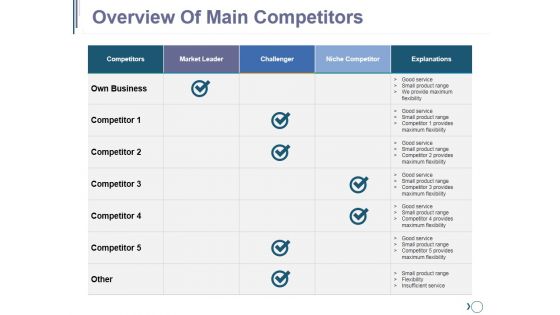
Overview Of Main Competitors Ppt PowerPoint Presentation File Designs
This is a overview of main competitors ppt powerpoint presentation file designs. This is a six stage process. The stages in this process are competitors, market leader, challenger, niche competitor, explanations.
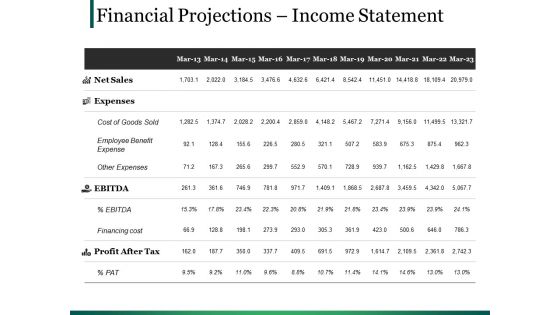
Financial Projections Income Statement Ppt PowerPoint Presentation Model Format
This is a financial projections income statement ppt powerpoint presentation model format. This is a two stage process. The stages in this process are tables, marketing, planning, strategy, finance.

Funding Updates Equity Ppt PowerPoint Presentation Portfolio Graphics Template
This is a funding updates equity ppt powerpoint presentation portfolio graphics template. This is a three stage process. The stages in this process are tables, marketing, planning, strategy, finance.
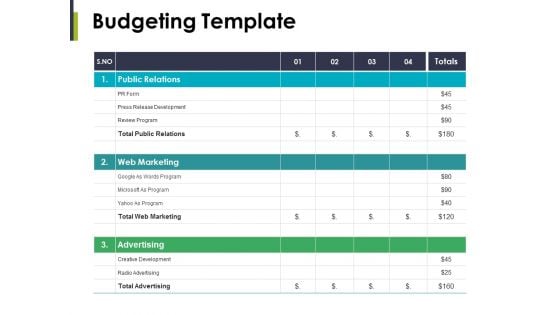
Budgeting Template Ppt PowerPoint Presentation Gallery Inspiration
This is a budgeting template ppt powerpoint presentation gallery inspiration. This is a three stage process. The stages in this process are public relations, web marketing, advertising, press release development, microsoft as program.
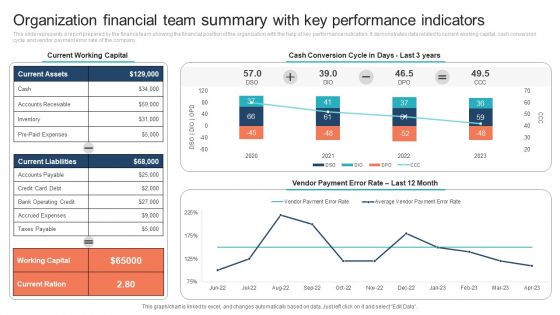
Organization Financial Team Summary With Key Performance Indicators Clipart PDF
This slide represents a report prepared by the finance team showing the financial position of the organization with the help of key performance indicators. It demonstrates data related to current working capital, cash conversion cycle and vendor payment error rate of the company. Pitch your topic with ease and precision using this Organization Financial Team Summary With Key Performance Indicators Clipart PDF. This layout presents information on Current Working Capital, Cash Conversion Cycle. It is also available for immediate download and adjustment. So, changes can be made in the color, design, graphics or any other component to create a unique layout.
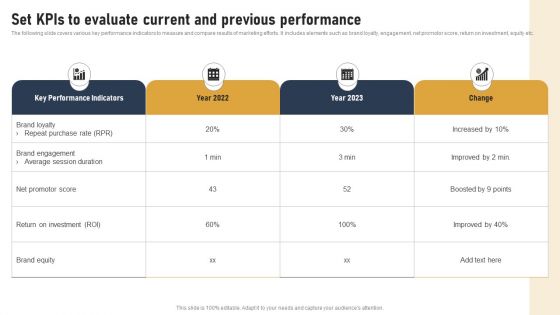
Incorporating Real Time Marketing For Improved Consumer Set Kpis To Evaluate Current And Previous Introduction PDF
The following slide covers various key performance indicators to measure and compare results of marketing efforts. It includes elements such as brand loyalty, engagement, net promotor score, return on investment, equity etc. The Incorporating Real Time Marketing For Improved Consumer Set Kpis To Evaluate Current And Previous Introduction PDF is a compilation of the most recent design trends as a series of slides. It is suitable for any subject or industry presentation, containing attractive visuals and photo spots for businesses to clearly express their messages. This template contains a variety of slides for the user to input data, such as structures to contrast two elements, bullet points, and slides for written information. Slidegeeks is prepared to create an impression.

Incorporating HIS To Enhance Healthcare Services Comparative Analysis Of Health Management Information System Tools Summary PDF
This slide covers comparative assessment of health management information tool to select suitable one. It involves features such as clinical database, data compliance, enhanced security and healthcare analytics. Do you have to make sure that everyone on your team knows about any specific topic I yes, then you should give Incorporating HIS To Enhance Healthcare Services Comparative Analysis Of Health Management Information System Tools Summary PDF a try. Our experts have put a lot of knowledge and effort into creating this impeccable Incorporating HIS To Enhance Healthcare Services Comparative Analysis Of Health Management Information System Tools Summary PDF. You can use this template for your upcoming presentations, as the slides are perfect to represent even the tiniest detail. You can download these templates from the Slidegeeks website and these are easy to edit. So grab these today.
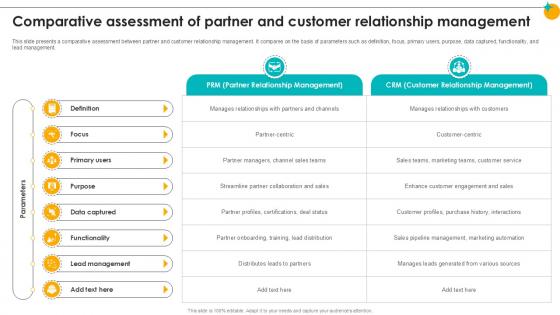
Comparative Assessment Of Partner And Customer Partner Relationship Ppt Example
This slide presents a comparative assessment between partner and customer relationship management. It compares on the basis of parameters such as definition, focus, primary users, purpose, data captured, functionality, and lead management. Are you in need of a template that can accommodate all of your creative concepts This one is crafted professionally and can be altered to fit any style. Use it with Google Slides or PowerPoint. Include striking photographs, symbols, depictions, and other visuals. Fill, move around, or remove text boxes as desired. Test out color palettes and font mixtures. Edit and save your work, or work with colleagues. Download Comparative Assessment Of Partner And Customer Partner Relationship Ppt Example and observe how to make your presentation outstanding. Give an impeccable presentation to your group and make your presentation unforgettable. This slide presents a comparative assessment between partner and customer relationship management. It compares on the basis of parameters such as definition, focus, primary users, purpose, data captured, functionality, and lead management.
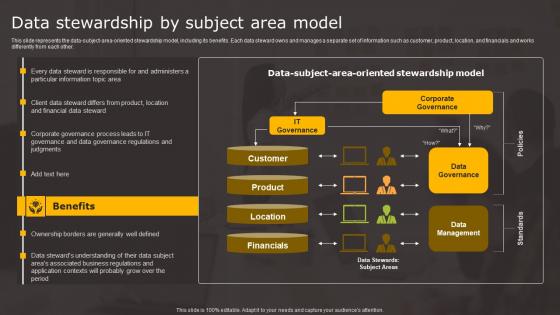
Data Stewardship By Subject Area Data Stewardship In Business Processes Information Pdf
This slide represents the data subject area oriented stewardship model, including its benefits. Each data steward owns and manages a separate set of information such as customer, product, location, and financials and works differently from each other. Crafting an eye catching presentation has never been more straightforward. Let your presentation shine with this tasteful yet straightforward Data Stewardship By Subject Area Data Stewardship In Business Processes Information Pdf template. It offers a minimalistic and classy look that is great for making a statement. The colors have been employed intelligently to add a bit of playfulness while still remaining professional. Construct the ideal Data Stewardship By Subject Area Data Stewardship In Business Processes Information Pdf that effortlessly grabs the attention of your audience Begin now and be certain to wow your customers This slide represents the data subject area oriented stewardship model, including its benefits. Each data steward owns and manages a separate set of information such as customer, product, location, and financials and works differently from each other.
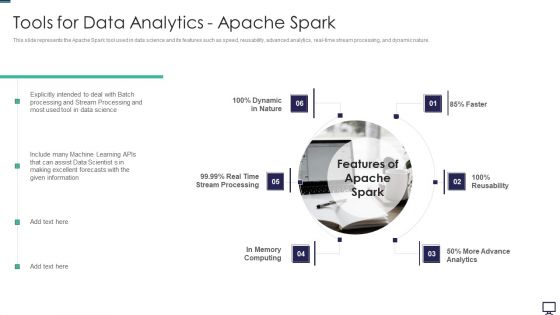
Tools For Data Analytics Apache Spark Ppt Infographics Influencers PDF
This slide represents the Apache Spark tool used in data science and its features such as speed, reusability, advanced analytics, real time stream processing, and dynamic nature. Presenting tools for data analytics apache spark ppt infographics influencers pdf to provide visual cues and insights. Share and navigate important information on six stages that need your due attention. This template can be used to pitch topics like tools for data analytics apache spark. In addtion, this PPT design contains high resolution images, graphics, etc, that are easily editable and available for immediate download.

Most Common Predictive Analytics Software Developing Strategic Insights Using Big Data Analytics SS V
This slide showcases major software providers for predictive analytics based on company revenue. It provides information regarding companies such as microsoft, siemens, IBM corporation, oracle , google cloud and SAS institute inc. Make sure to capture your audiences attention in your business displays with our gratis customizable Most Common Predictive Analytics Software Developing Strategic Insights Using Big Data Analytics SS V. These are great for business strategies, office conferences, capital raising or task suggestions. If you desire to acquire more customers for your tech business and ensure they stay satisfied, create your own sales presentation with these plain slides. This slide showcases major software providers for predictive analytics based on company revenue. It provides information regarding companies such as microsoft, siemens, IBM corporation, oracle , google cloud and SAS institute inc.
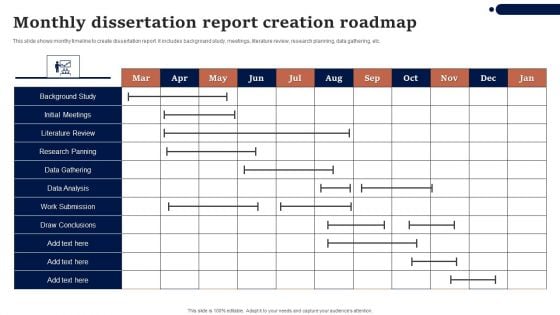
Monthly Dissertation Report Creation Roadmap Background PDF
This slide shows monthy timeline to create dissertation report. it includes background study, meetings, literature review, research planning, data gathering, etc. Pitch your topic with ease and precision using this Monthly Dissertation Report Creation Roadmap Background PDF. This layout presents information on Data Gathering, Data Analysis, Research Panning. It is also available for immediate download and adjustment. So, changes can be made in the color, design, graphics or any other component to create a unique layout.
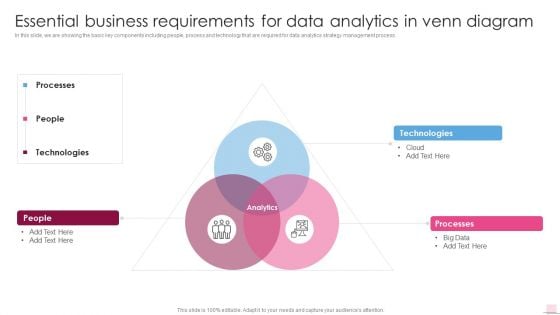
Essential Business Requirements For Data Analytics Business Analysis Modification Toolkit Topics PDF
In this slide, we are showing the basic key components including people, process and technology that are required for data analytics strategy management process.This is a Essential Business Requirements For Data Analytics Business Analysis Modification Toolkit Topics PDF template with various stages. Focus and dispense information on three stages using this creative set, that comes with editable features. It contains large content boxes to add your information on topics like Technologies, Processes, Technologies. You can also showcase facts, figures, and other relevant content using this PPT layout. Grab it now.
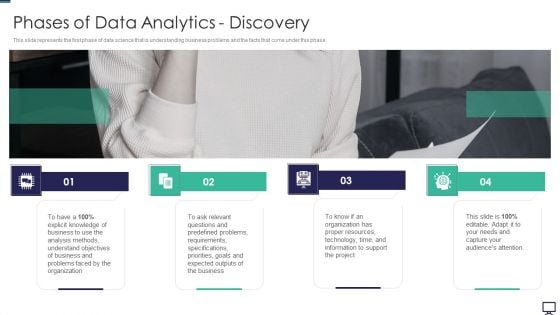
Phases Of Data Analytics Discovery Ppt Infographic Template Outfit PDF
This slide represents the first phase of data science that is understanding business problems and the facts that come under this phase. This is a phases of data analytics discovery ppt infographic template outfit pdf template with various stages. Focus and dispense information on four stages using this creative set, that comes with editable features. It contains large content boxes to add your information on topics like business, analysis, organization, requirements. You can also showcase facts, figures, and other relevant content using this PPT layout. Grab it now.
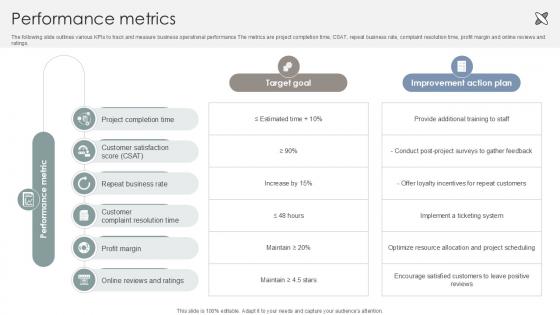
Performance Metrics Interior Design Company Market Entry Plan PPT PowerPoint GTM SS V
The following slide outlines various KPIs to track and measure business operational performance The metrics are project completion time, CSAT, repeat business rate, complaint resolution time, profit margin and online reviews and ratings. Crafting an eye-catching presentation has never been more straightforward. Let your presentation shine with this tasteful yet straightforward Performance Metrics Interior Design Company Market Entry Plan PPT PowerPoint GTM SS V template. It offers a minimalistic and classy look that is great for making a statement. The colors have been employed intelligently to add a bit of playfulness while still remaining professional. Construct the ideal Performance Metrics Interior Design Company Market Entry Plan PPT PowerPoint GTM SS V that effortlessly grabs the attention of your audience Begin now and be certain to wow your customers The following slide outlines various KPIs to track and measure business operational performance The metrics are project completion time, CSAT, repeat business rate, complaint resolution time, profit margin and online reviews and ratings.
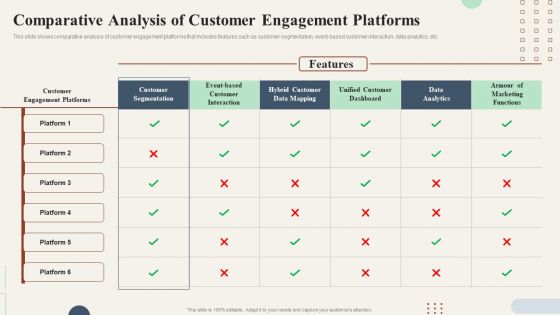
Action Plan To Enhance Comparative Analysis Of Customer Engagement Platforms Themes PDF
This slide shows comparative analysis of customer engagement platforms that includes features such as customer segmentation, event-based customer interaction, data analytics, etc. Do you have to make sure that everyone on your team knows about any specific topic I yes, then you should give Action Plan To Enhance Comparative Analysis Of Customer Engagement Platforms Themes PDF a try. Our experts have put a lot of knowledge and effort into creating this impeccable Action Plan To Enhance Comparative Analysis Of Customer Engagement Platforms Themes PDF. You can use this template for your upcoming presentations, as the slides are perfect to represent even the tiniest detail. You can download these templates from the Slidegeeks website and these are easy to edit. So grab these today
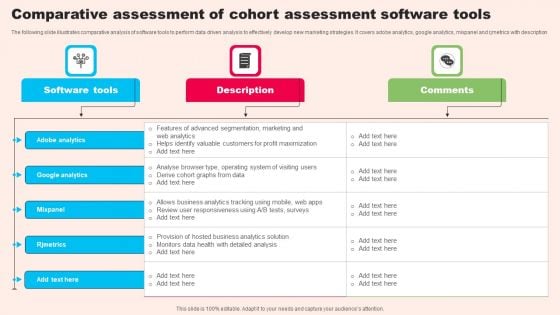
Comparative Assessment Of Cohort Assessment Software Tools Introduction PDF
The following slide illustrates comparative analysis of software tools to perform data driven analysis to effectively develop new marketing strategies. It covers adobe analytics, google analytics, mixpanel and rjmetrics with description. Pitch your topic with ease and precision using this Comparative Assessment Of Cohort Assessment Software Tools Introduction PDF. This layout presents information on Adobe Analytics, Google Analytics, Software Tools. It is also available for immediate download and adjustment. So, changes can be made in the color, design, graphics or any other component to create a unique layout.

Customer Behavioral Data And Analytics Email Engagement Metrics Mockup PDF
This is a customer behavioral data and analytics email engagement metrics mockup pdf template with various stages. Focus and dispense information on four stages using this creative set, that comes with editable features. It contains large content boxes to add your information on topics like email engagement metrics. You can also showcase facts, figures, and other relevant content using this PPT layout. Grab it now.
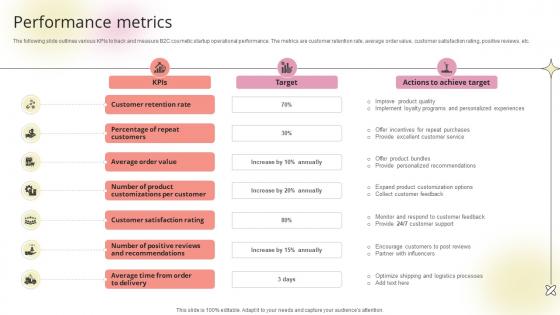
Performance Metrics Beauty Product Company Go To Market Strategy GTM SS V
The following slide outlines various KPIs to track and measure B2C cosmetic startup operational performance. The metrics are customer retention rate, average order value, customer satisfaction rating, positive reviews, etc.The best PPT templates are a great way to save time, energy, and resources. Slidegeeks have 100 percent editable powerpoint slides making them incredibly versatile. With these quality presentation templates, you can create a captivating and memorable presentation by combining visually appealing slides and effectively communicating your message. Download Performance Metrics Beauty Product Company Go To Market Strategy GTM SS V from Slidegeeks and deliver a wonderful presentation. The following slide outlines various KPIs to track and measure B2C cosmetic startup operational performance. The metrics are customer retention rate, average order value, customer satisfaction rating, positive reviews, etc.
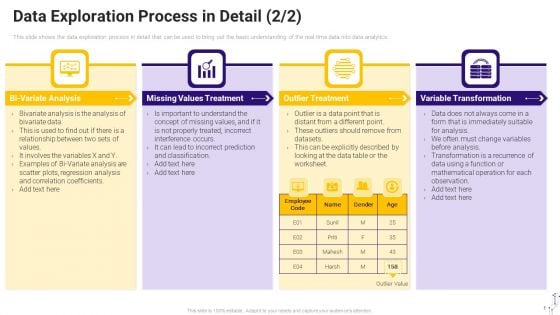
Effective Data Arrangement For Data Accessibility And Processing Readiness Data Exploration Process In Detail Analysis Ideas PDF
This slide shows the data exploration process in detail that can be used to bring out the basic understanding of the real time data into data analytics. This is a effective data arrangement for data accessibility and processing readiness data exploration process in detail analysis ideas pdf template with various stages. Focus and dispense information on four stages using this creative set, that comes with editable features. It contains large content boxes to add your information on topics like treatment, outlier treatment, variable transformation. You can also showcase facts, figures, and other relevant content using this PPT layout. Grab it now.
Critical Components Of Data Analytics Ppt Icon Rules PDF
This slide depicts the critical components of data science such as data, programming, statistics and probability, development tools, machine learning, and big data. This is a critical components of data analytics ppt icon rules pdf template with various stages. Focus and dispense information on four stages using this creative set, that comes with editable features. It contains large content boxes to add your information on topics like data, programming, statistics and probability, big data. You can also showcase facts, figures, and other relevant content using this PPT layout. Grab it now.
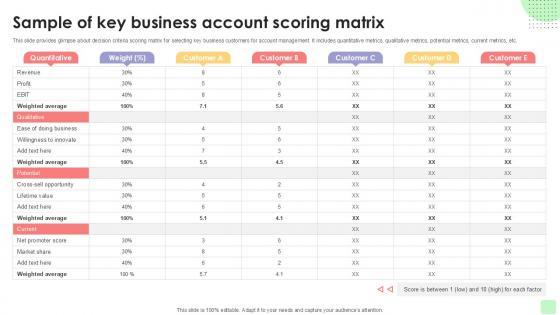
Sample Of Key Business Account Detailed Business Account PPT Presentation Strategy SS V
This slide provides glimpse about decision criteria scoring matrix for selecting key business customers for account management. It includes quantitative metrics, qualitative metrics, potential metrics, current metrics, etc. Step up your game with our enchanting Sample Of Key Business Account Detailed Business Account PPT Presentation Strategy SS V deck, guaranteed to leave a lasting impression on your audience. Crafted with a perfect balance of simplicity, and innovation, our deck empowers you to alter it to your specific needs. You can also change the color theme of the slide to mold it to your companys specific needs. Save time with our ready-made design, compatible with Microsoft versions and Google Slides. Additionally, its available for download in various formats including JPG, JPEG, and PNG. Outshine your competitors with our fully editable and customized deck. This slide provides glimpse about decision criteria scoring matrix for selecting key business customers for account management. It includes quantitative metrics, qualitative metrics, potential metrics, current metrics, etc.
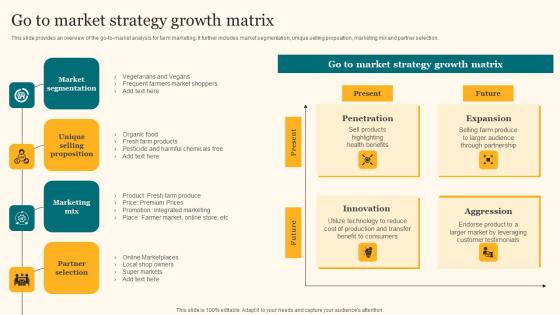
Go To Market Strategy Growth Matrix Agricultural Product Promotion Summary Pdf
This slide provides an overview of the go-to-market analysis for farm marketing. It further includes market segmentation, unique selling proposition, marketing mix and partner selection. The Go To Market Strategy Growth Matrix Agricultural Product Promotion Summary Pdf is a compilation of the most recent design trends as a series of slides. It is suitable for any subject or industry presentation, containing attractive visuals and photo spots for businesses to clearly express their messages. This template contains a variety of slides for the user to input data, such as structures to contrast two elements, bullet points, and slides for written information. Slidegeeks is prepared to create an impression. This slide provides an overview of the go-to-market analysis for farm marketing. It further includes market segmentation, unique selling proposition, marketing mix and partner selection.
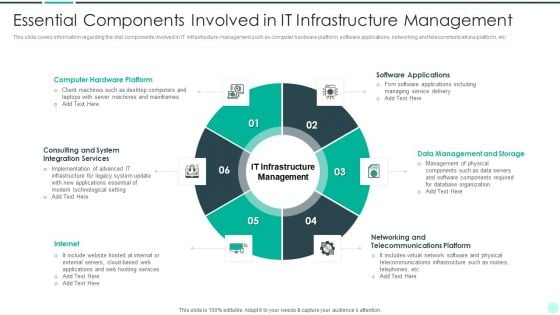
Executing Advance Data Analytics At Workspace Essential Components Designs PDF
This slide covers information regarding the vital components involved in IT infrastructure management such as computer hardware platform, software applications, networking and telecommunications platform, etc. This is a executing advance data analytics at workspace essential components designs pdf template with various stages. Focus and dispense information on six stages using this creative set, that comes with editable features. It contains large content boxes to add your information on topics like essential components involved in it infrastructure management . You can also showcase facts, figures, and other relevant content using this PPT layout. Grab it now.
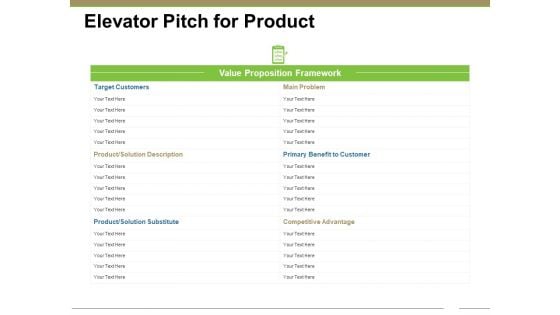
Elevator Pitch For Product Ppt PowerPoint Presentation Infographic Template Infographic Template
This is a elevator pitch for product ppt powerpoint presentation infographic template infographic template. This is a three stage process. The stages in this process are target customers, main problem, primary benefit to customer, competitive advantage, product solution description.
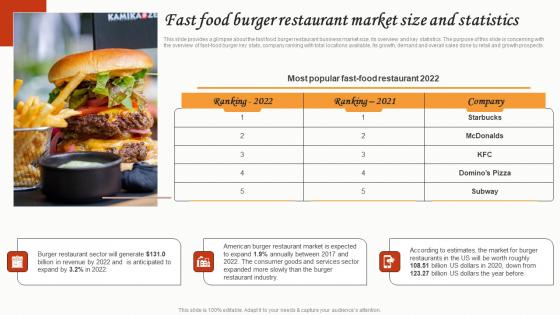
Fast Food Burger Restaurant Market Size And Statistics Small Restaurant Business Slides Pdf
This slide provides a glimpse about the fast food burger restaurant business market size, its overview and key statistics. The purpose of this slide is concerning with the overview of fast-food burger key stats, company ranking with total locations available, its growth, demand and overall sales done by retail and growth prospects. The Fast Food Burger Restaurant Market Size And Statistics Small Restaurant Business Slides Pdf is a compilation of the most recent design trends as a series of slides. It is suitable for any subject or industry presentation, containing attractive visuals and photo spots for businesses to clearly express their messages. This template contains a variety of slides for the user to input data, such as structures to contrast two elements, bullet points, and slides for written information. Slidegeeks is prepared to create an impression. This slide provides a glimpse about the fast food burger restaurant business market size, its overview and key statistics. The purpose of this slide is concerning with the overview of fast-food burger key stats, company ranking with total locations available, its growth, demand and overall sales done by retail and growth prospects.

Project Conclusion Report Performance Analysis Ppt PowerPoint Presentation Outline Infographics
This is a project conclusion report performance analysis ppt powerpoint presentation outline infographics. This is a two stage process. The stages in this process are business, management, marketing, compare.
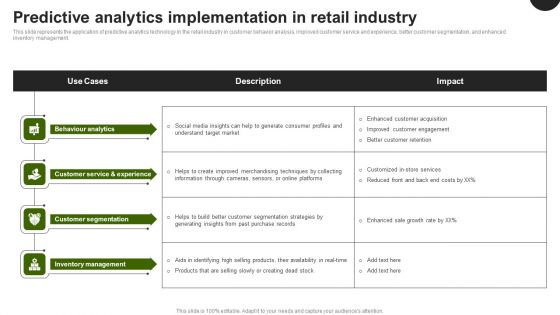
Predictive Analytics In The Age Of Big Data Predictive Analytics Implementation In Retail Industry Themes PDF
This slide represents the application of predictive analytics technology in the retail industry in customer behavior analysis, improved customer service and experience, better customer segmentation, and enhanced inventory management. Coming up with a presentation necessitates that the majority of the effort goes into the content and the message you intend to convey. The visuals of a PowerPoint presentation can only be effective if it supplements and supports the story that is being told. Keeping this in mind our experts created Predictive Analytics In The Age Of Big Data Predictive Analytics Implementation In Retail Industry Themes PDF to reduce the time that goes into designing the presentation. This way, you can concentrate on the message while our designers take care of providing you with the right template for the situation.
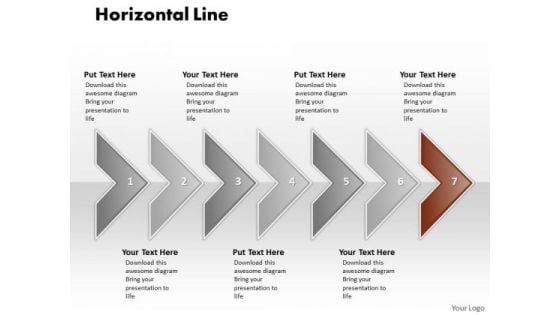
Ppt Correlated Circular Arrows PowerPoint 2010 Horizontal Line 7 Stages Templates
PPT correlated circular arrows powerpoint 2010 horizontal line 7 stages Templates-This Diagram is used to illustrate how information will move between interrelated systems in the accomplishment of a given function, task or process. The visual description of this information flow with each given level showing how data is fed into a given process step and subsequently passed along at the completion of that step.-PPT correlated circular arrows powerpoint 2010 horizontal line 7 stages Templates-Aim, Arrow, Badge, Border, Color, Connection, Curve, Design, Direction, Download, Icon, Illustration, Indicator, Internet, Label, Link, Magenta, Mark, Next, Object, Orientation, Paper, Peeling, Pointer, Rounded, Set, Shadow, Shape, Sign Pioneer changes with our Ppt Correlated Circular Arrows PowerPoint 2010 Horizontal Line 7 Stages Templates. Download without worries with our money back guaranteee.
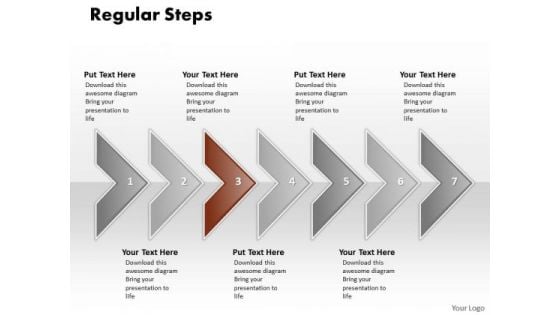
Ppt Correlated Curved Arrows PowerPoint 2010 Regular Line 7 Stages Templates
PPT correlated curved arrows powerpoint 2010 regular line 7 stages Templates-This Diagram is used to illustrate how information will move between interrelated systems in the accomplishment of a given function, task or process. The visual description of this information flow with each given level showing how data is fed into a given process step and subsequently passed along at the completion of that step.-PPT correlated curved arrows powerpoint 2010 regular line 7 stages Templates-Aim, Arrow, Badge, Border, Color, Connection, Curve, Design, Direction, Download, Icon, Illustration, Indicator, Internet, Label, Link, Magenta, Mark, Next, Object, Orientation, Paper, Peeling, Pointer, Rounded, Set, Shadow, Shape, Sign Examine every deatail with our Ppt Correlated Curved Arrows PowerPoint 2010 Regular Line 7 Stages Templates. Put each element to the test.
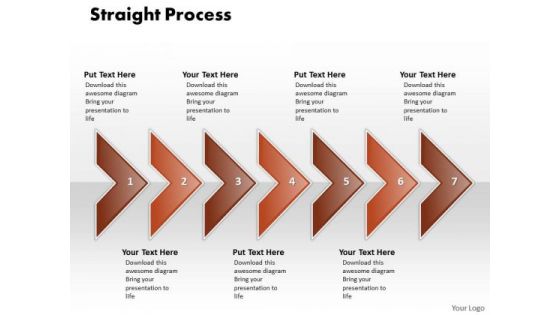
Ppt Correlated Shapes Arrows PowerPoint Straight Line 7 Phase Diagram Templates
PPT correlated shapes arrows powerpoint straight line 7 phase diagram Templates-This Diagram is used to illustrate how information will move between interrelated systems in the accomplishment of a given function, task or process. The visual description of this information flow with each given level showing how data is fed into a given process step and subsequently passed along at the completion of that step.-PPT correlated shapes arrows powerpoint straight line 7 phase diagram Templates-Aim, Arrow, Badge, Border, Color, Connection, Curve, Design, Direction, Download, Icon, Illustration, Indicator, Internet, Label, Link, Magenta, Mark, Next, Object, Orientation, Paper, Peeling, Pointer, Rounded, Set, Shadow, Shape, Sign Give your audience a feast for their eyes. Our brightly colored Ppt Correlated Shapes Arrows PowerPoint Straight Line 7 Phase Diagram Templates will hold their fascnation.
Data Analysis For Assessing Business Information Icon Ideas PDF
Pitch your topic with ease and precision using this data analysis for assessing business information icon ideas pdf. This layout presents information on data analysis for assessing business information icon. It is also available for immediate download and adjustment. So, changes can be made in the color, design, graphics or any other component to create a unique layout.
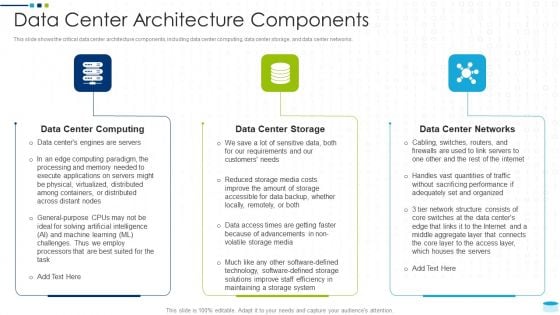
Data Center Infrastructure Management IT Data Center Architecture Components Professional PDF
This slide shows the critical data center architecture components, including data center computing, data center storage, and data center networks. This is a data center infrastructure management it data center architecture components professional pdf template with various stages. Focus and dispense information on three stages using this creative set, that comes with editable features. It contains large content boxes to add your information on topics like data center computing, data center storage, data center networksf. You can also showcase facts, figures, and other relevant content using this PPT layout. Grab it now.
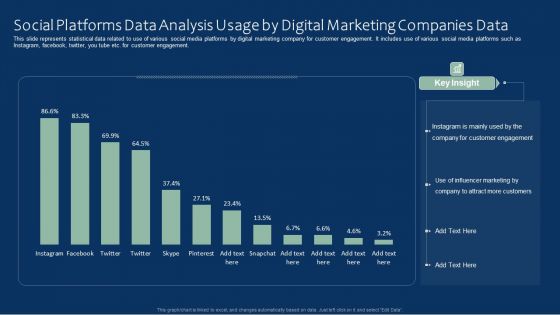
Social Platforms Data Analysis Usage By Digital Marketing Companies Data Clipart PDF
This slide represents statistical data related to use of various social media platforms by digital marketing company for customer engagement. It includes use of various social media platforms such as Instagram, facebook, twitter, you tube etc. for customer engagement. Pitch your topic with ease and precision using this Social Platforms Data Analysis Usage By Digital Marketing Companies Data Clipart PDF. This layout presents information on Social Platforms Data Analysis, Digital Marketing Companies Data. It is also available for immediate download and adjustment. So, changes can be made in the color, design, graphics or any other component to create a unique layout.
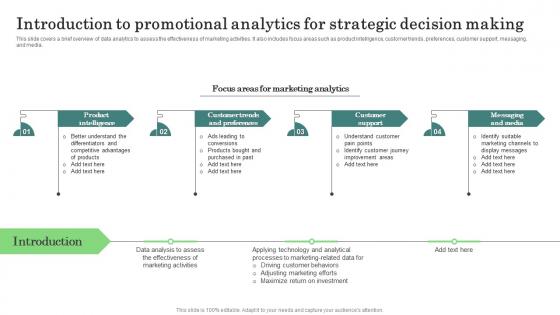
Introduction To Promotional Major Promotional Analytics Future Trends Guidelines Pdf
This slide covers a brief overview of data analytics to assess the effectiveness of marketing activities. It also includes focus areas such as product intelligence, customer trends, preferences, customer support, messaging, and media. This Introduction To Promotional Major Promotional Analytics Future Trends Guidelines Pdf is perfect for any presentation, be it in front of clients or colleagues. It is a versatile and stylish solution for organizing your meetings. The Introduction To Promotional Major Promotional Analytics Future Trends Guidelines Pdf features a modern design for your presentation meetings. The adjustable and customizable slides provide unlimited possibilities for acing up your presentation. Slidegeeks has done all the homework before launching the product for you. So, do not wait, grab the presentation templates today This slide covers a brief overview of data analytics to assess the effectiveness of marketing activities. It also includes focus areas such as product intelligence, customer trends, preferences, customer support, messaging, and media.

Enhanced Sensing Technologies Biomedical Data Science And Health Informatics Introduction Pdf
This slide talks about the advanced sensing technology apps for early predictions of diseases such as Alzheimers and mental health disorders. The mental health disorder apps offer analysis of behavioral health problems such as interest, social isolation, mood, and energy level. This Enhanced Sensing Technologies Biomedical Data Science And Health Informatics Introduction Pdf is perfect for any presentation, be it in front of clients or colleagues. It is a versatile and stylish solution for organizing your meetings. The Enhanced Sensing Technologies Biomedical Data Science And Health Informatics Introduction Pdf features a modern design for your presentation meetings. The adjustable and customizable slides provide unlimited possibilities for acing up your presentation. Slidegeeks has done all the homework before launching the product for you. So, do not wait, grab the presentation templates today This slide talks about the advanced sensing technology apps for early predictions of diseases such as Alzheimers and mental health disorders. The mental health disorder apps offer analysis of behavioral health problems such as interest, social isolation, mood, and energy level.
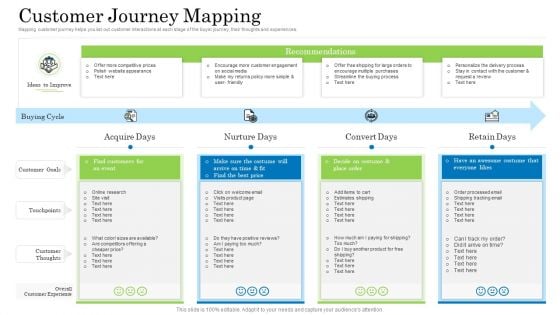
Customer Behavioral Data And Analytics Customer Journey Mapping Themes PDF
Mapping customer journey helps you list out customer interactions at each stage of the buyer journey, their thoughts and experiences. This is a customer behavioral data and analytics customer journey mapping themes pdf template with various stages. Focus and dispense information on four stages using this creative set, that comes with editable features. It contains large content boxes to add your information on topics like customer journey mapping. You can also showcase facts, figures, and other relevant content using this PPT layout. Grab it now.
Statistical Data On Social Platforms Data Analysis Services Offered By Marketing Agencies Icons PDF
This slide shows the statistics related to social media services provided by the marketing agencies to their clients. It includes various services such as content creation, social media monitoring, strategy building, campaign analysis etc. Pitch your topic with ease and precision using this Statistical Data On Social Platforms Data Analysis Services Offered By Marketing Agencies Icons PDF. This layout presents information on Statistical Data, Social Platforms Data, Analysis Services, Marketing Agencies. It is also available for immediate download and adjustment. So, changes can be made in the color, design, graphics or any other component to create a unique layout.
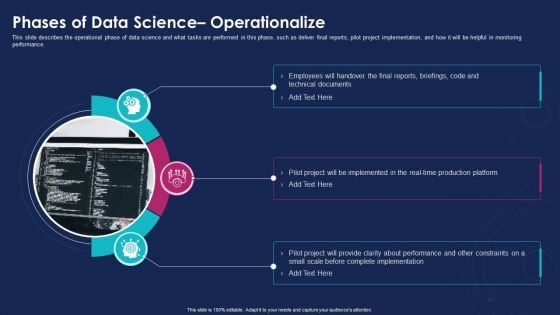
Data Analytics IT Phases Of Data Science Operationalize Ppt Summary Clipart PDF
This slide describes the operational phase of data science and what tasks are performed in this phase, such as deliver final reports, pilot project implementation, and how it will be helpful in monitoring performance. This is a data analytics it phases of data science operationalize ppt summary clipart pdf template with various stages. Focus and dispense information on three stages using this creative set, that comes with editable features. It contains large content boxes to add your information on topics like technical, implemented, performance. You can also showcase facts, figures, and other relevant content using this PPT layout. Grab it now.


 Continue with Email

 Home
Home


