Comparison Dashboard
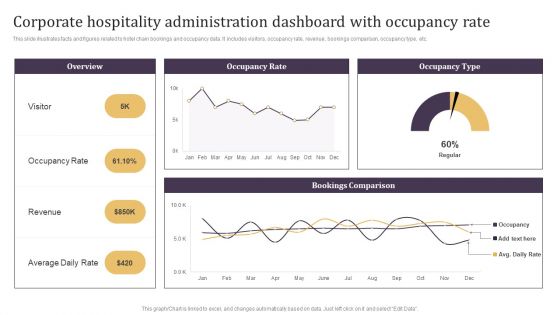
Corporate Hospitality Administration Dashboard With Occupancy Rate Guidelines PDF
This slide illustrates facts and figures related to hotel chain bookings and occupancy data. It includes visitors, occupancy rate, revenue, bookings comparison, occupancy type, etc.Pitch your topic with ease and precision using this Corporate Hospitality Administration Dashboard With Occupancy Rate Guidelines PDF. This layout presents information on Occupancy Rate, Average Daily Rate, Bookings Comparison. It is also available for immediate download and adjustment. So, changes can be made in the color, design, graphics or any other component to create a unique layout.
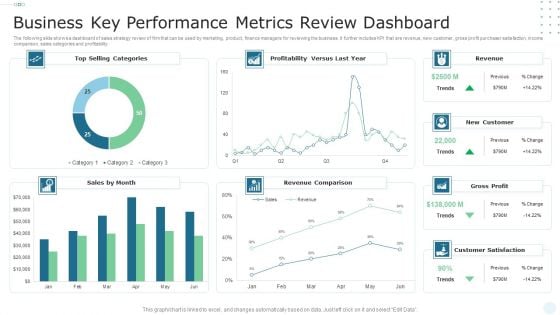
Business Key Performance Metrics Review Dashboard Portrait PDF
The following slide shows a dashboard of sales strategy review of firm that can be used by marketing, product, finance managers for reviewing the business. It further includes KPI that are revenue, new customer, gross profit purchaser satisfaction, income comparison, sales categories and profitability. Showcasing this set of slides titled Business Key Performance Metrics Review Dashboard Portrait PDF. The topics addressed in these templates are Sales, Revenue Comparison, Profitability. All the content presented in this PPT design is completely editable. Download it and make adjustments in color, background, font etc. as per your unique business setting.
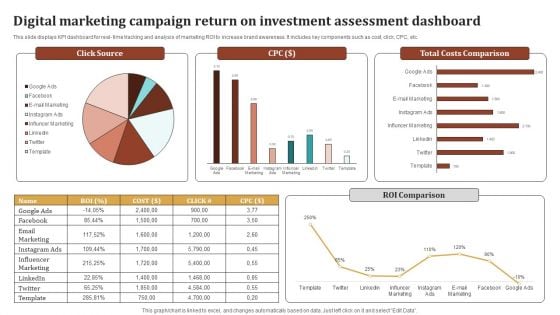
Digital Marketing Campaign Return On Investment Assessment Dashboard Ideas PDF
This slide displays KPI dashboard for real- time tracking and analysis of marketing ROI to increase brand awareness. It includes key components such as cost, click, CPC, etc. Showcasing this set of slides titled Digital Marketing Campaign Return On Investment Assessment Dashboard Ideas PDF. The topics addressed in these templates are Influencer Marketing, Email Marketing, Total Costs Comparison, Roi Comparison. All the content presented in this PPT design is completely editable. Download it and make adjustments in color, background, font etc. as per your unique business setting.
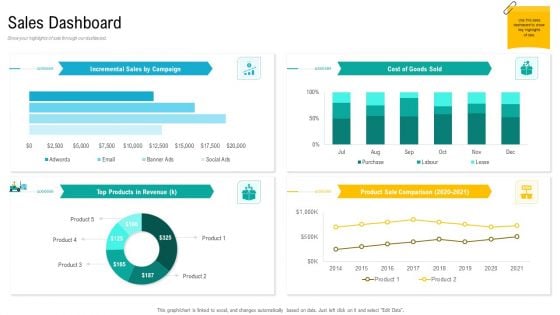
Product USP Sales Dashboard Ppt Inspiration Background Designs PDF
Show your highlights of sale through our dashboard. Deliver and pitch your topic in the best possible manner with this product usp sales dashboard ppt inspiration background designs pdf. Use them to share invaluable insights on product sale comparison, products in revenue, cost of goods sold and impress your audience. This template can be altered and modified as per your expectations. So, grab it now.
Fixed Asset Management Dashboard For Tracking Equipment Performance Inspiration PDF
This slide represents fixed asset management dashboard for tracking equipment performance. It includes work management, downtime, work orders etc.Deliver an awe inspiring pitch with this creative Fixed Asset Management Dashboard For Tracking Equipment Performance Inspiration PDF bundle. Topics like Asset Comparison, Labour Analysis, Purchasing Spend can be discussed with this completely editable template. It is available for immediate download depending on the needs and requirements of the user.
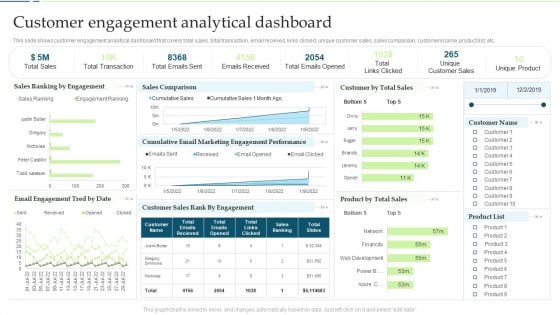
Customer Engagement And Experience Customer Engagement Analytical Dashboard Slides PDF
This slide shows customer engagement analytical dashboard that covers total sales, total transaction, email received, links clicked, unique customer sales, sales comparison, customers name, product list, etc.Deliver an awe inspiring pitch with this creative Customer Engagement And Experience Customer Engagement Analytical Dashboard Slides PDF bundle. Topics like Total Transaction, Emails Received, Unique Customer can be discussed with this completely editable template. It is available for immediate download depending on the needs and requirements of the user.
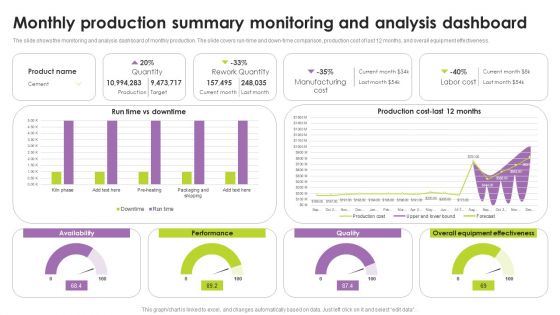
Monthly Production Summary Monitoring And Analysis Dashboard Guidelines PDF
The slide shows the monitoring and analysis dashboard of monthly production. The slide covers run-time and down time comparison, production cost of last 12 months, and overall equipment effectiveness. Showcasing this set of slides titled Monthly Production Summary Monitoring And Analysis Dashboard Guidelines PDF. The topics addressed in these templates are Availability, Rework Quantity, Manufacturing Cost. All the content presented in this PPT design is completely editable. Download it and make adjustments in color, background, font etc. as per your unique business setting.
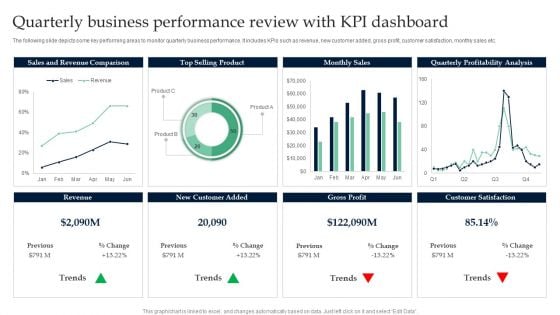
Quarterly Business Performance Review With KPI Dashboard Infographics PDF
Pitch your topic with ease and precision using this Quarterly Business Performance Review With KPI Dashboard Infographics PDF. This layout presents information on Sales And Revenue Comparison, Top Selling Product. It is also available for immediate download and adjustment. So, changes can be made in the color, design, graphics or any other component to create a unique layout.
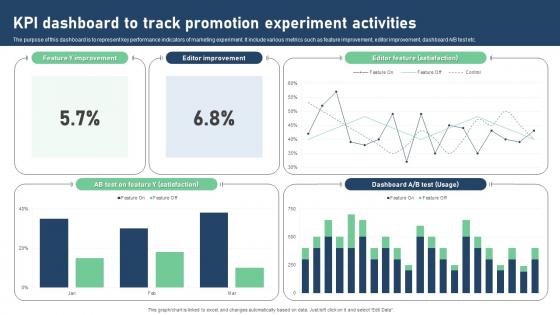
Kpi Dashboard To Track Promotion Experiment Activities Portrait Pdf
The purpose of this dashboard is to represent key performance indicators of marketing experiment. It include various metrics such as feature improvement, editor improvement, dashboard A or B test etc. Pitch your topic with ease and precision using this Kpi Dashboard To Track Promotion Experiment Activities Portrait Pdf. This layout presents information on KPI Dashboard, Track Promotion, Experiment Activities, Editor Improvement. It is also available for immediate download and adjustment. So, changes can be made in the color, design, graphics or any other component to create a unique layout. The purpose of this dashboard is to represent key performance indicators of marketing experiment. It include various metrics such as feature improvement, editor improvement, dashboard A or B test etc.

Boosting Efficiency In ABC Inventory Management Dashboard Analysis
This slide illustrates ABC inventory management dashboard analysis includes elements such as product name, stock keeping unit, grade etc. Boost your pitch with our creative Boosting Efficiency In ABC Inventory Management Dashboard Analysis. Deliver an awe-inspiring pitch that will mesmerize everyone. Using these presentation templates you will surely catch everyones attention. You can browse the ppts collection on our website. We have researchers who are experts at creating the right content for the templates. So you do not have to invest time in any additional work. Just grab the template now and use them. This slide illustrates ABC inventory management dashboard analysis includes elements such as product name, stock keeping unit, grade etc.
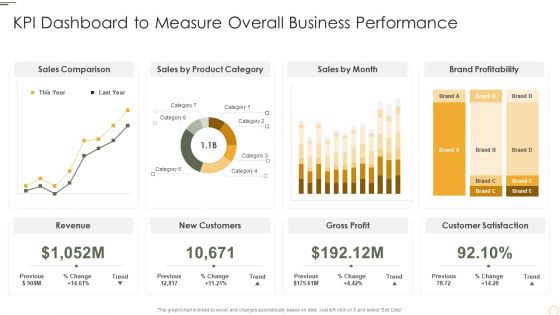
KPI Dashboard To Measure Overall Business Performance Themes PDF
Deliver and pitch your topic in the best possible manner with this KPI Dashboard To Measure Overall Business Performance Themes PDF. Use them to share invaluable insights on Sales Comparison, Product Category, Brand Profitability and impress your audience. This template can be altered and modified as per your expectations. So, grab it now.
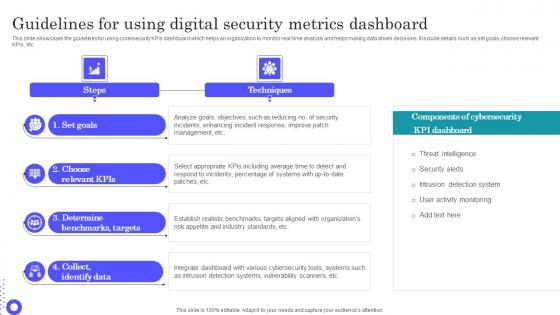
Guidelines For Using Digital Security Metrics Dashboard Introduction Pdf
Pitch your topic with ease and precision using this Guidelines For Using Digital Security Metrics Dashboard Introduction Pdf This layout presents information on Benchmarks Targets, Integrate Dashboard, Incidents Enhancing It is also available for immediate download and adjustment. So, changes can be made in the color, design, graphics or any other component to create a unique layout. This slide showcases the guidelines for using cybersecurity KPIs dashboard which helps an organization to monitor real time analysis and helps making data driven decisions. It include details such as set goals, choose relevant KPIs, etc.
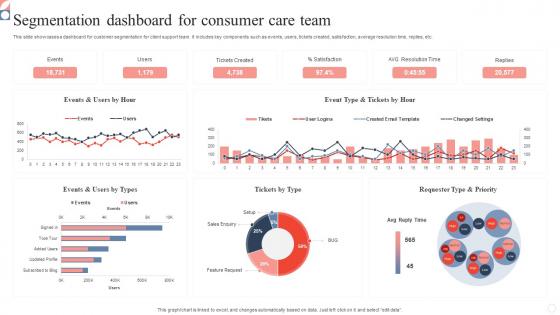
Segmentation Dashboard For Consumer Care Team Slides Pdf
This slide showcases a dashboard for customer segmentation for client support team. It includes key components such as events, users, tickets created, satisfaction, average resolution time, replies, etc. Showcasing this set of slides titled Segmentation Dashboard For Consumer Care Team Slides Pdf. The topics addressed in these templates are Segmentation Dashboard, Consumer Care Team, Satisfaction. All the content presented in this PPT design is completely editable. Download it and make adjustments in color, background, font etc. as per your unique business setting. This slide showcases a dashboard for customer segmentation for client support team. It includes key components such as events, users, tickets created, satisfaction, average resolution time, replies, etc.
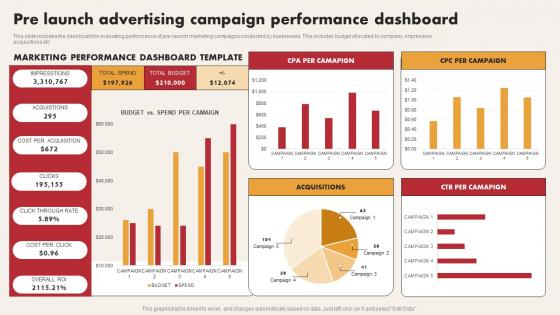
Pre Launch Advertising Campaign Performance Dashboard Graphics Pdf
This slide includes the dashboard for evaluating performance of pre launch marketing campaigns conducted by businesses. This includes budget allocated by company, impression, acquisitions etc Pitch your topic with ease and precision using this Pre Launch Advertising Campaign Performance Dashboard Graphics Pdf. This layout presents information on Pre Launch Advertising Campaign, Performance Dashboard. It is also available for immediate download and adjustment. So, changes can be made in the color, design, graphics or any other component to create a unique layout. This slide includes the dashboard for evaluating performance of pre launch marketing campaigns conducted by businesses. This includes budget allocated by company, impression, acquisitions etc
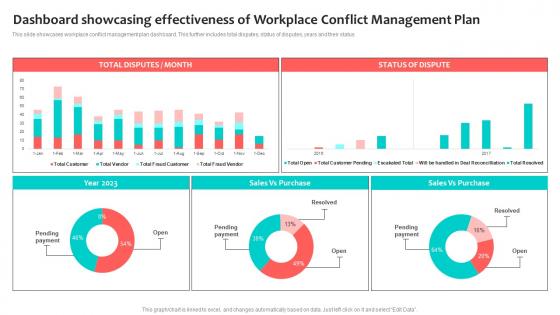
Dashboard Showcasing Effectiveness Of Workplace Conflict Management Plan Formats Pdf
This slide showcases workplace conflict management plan dashboard. This further includes total disputes, status of disputes, years and their status Pitch your topic with ease and precision using this Dashboard Showcasing Effectiveness Of Workplace Conflict Management Plan Formats Pdf. This layout presents information on Dashboard Showcasing Effectiveness, Workplace Conflict Management Plan. It is also available for immediate download and adjustment. So, changes can be made in the color, design, graphics or any other component to create a unique layout. This slide showcases workplace conflict management plan dashboard. This further includes total disputes, status of disputes, years and their status
Cybernetics Implant Performance Tracking Dashboard Cybernetic Integration Icons Pdf
This slide shows the Cybernetics implant performance tracking dashboard. The purpose of this slide is to represent the Information related to the status of Cybernetics implant graphically. Presenting this PowerPoint presentation, titled Cybernetics Implant Performance Tracking Dashboard Cybernetic Integration Icons Pdf with topics curated by our researchers after extensive research. This editable presentation is available for immediate download and provides attractive features when used. Download now and captivate your audience. Presenting this Cybernetics Implant Performance Tracking Dashboard Cybernetic Integration Icons Pdf Our researchers have carefully researched and created these slides with all aspects taken into consideration. This is a completely customizable Cybernetics Implant Performance Tracking Dashboard Cybernetic Integration Icons Pdf that is available for immediate downloading. Download now and make an impact on your audience. Highlight the attractive features available with our PPTs. This slide shows the Cybernetics implant performance tracking dashboard. The purpose of this slide is to represent the Information related to the status of Cybernetics implant graphically.
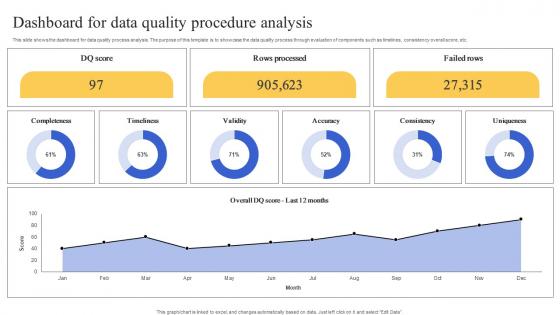
Dashboard For Data Quality Procedure Analysis Demonstration Pdf
This slide shows the dashboard for data quality process analysis. The purpose of this template is to showcase the data quality process through evaluation of components such as timelines, consistency overall score, etc. Showcasing this set of slides titled Dashboard For Data Quality Procedure Analysis Demonstration Pdf. The topics addressed in these templates are Dashboard For Data Quality, Procedure Analysis, Timelines. All the content presented in this PPT design is completely editable. Download it and make adjustments in color, background, font etc. as per your unique business setting. This slide shows the dashboard for data quality process analysis. The purpose of this template is to showcase the data quality process through evaluation of components such as timelines, consistency overall score, etc.
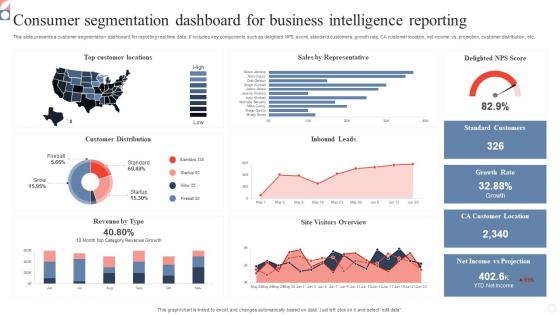
Consumer Segmentation Dashboard For Business Intelligence Reporting Topics Pdf
This slide presents a customer segmentation dashboard for reporting real time data. It includes key components such as delighted NPS score, standard customers, growth rate, CA customer location, net income vs. projection, customer distribution, etc. Pitch your topic with ease and precision using this Consumer Segmentation Dashboard For Business Intelligence Reporting Topics Pdf. This layout presents information on Consumer Segmentation Dashboard, Business Intelligence Reporting, Growth Rate. It is also available for immediate download and adjustment. So, changes can be made in the color, design, graphics or any other component to create a unique layout. This slide presents a customer segmentation dashboard for reporting real time data. It includes key components such as delighted NPS score, standard customers, growth rate, CA customer location, net income vs. projection, customer distribution, etc.

KPI Dashboard For Estimating Monthly Cash Flow Infographics Pdf
Following slide demonstrates KPI dashboard to forecast monthly business money flow for cash flow management planning. It includes components such as projected profit before tax, net operating cash flow, net financial cash flow, net investing cash flow, etc. Showcasing this set of slides titled KPI Dashboard For Estimating Monthly Cash Flow Infographics Pdf. The topics addressed in these templates are KPI Dashboard, Estimating Monthly Cash Flow, Net Financial Cash Flow. All the content presented in this PPT design is completely editable. Download it and make adjustments in color, background, font etc. as per your unique business setting. Following slide demonstrates KPI dashboard to forecast monthly business money flow for cash flow management planning. It includes components such as projected profit before tax, net operating cash flow, net financial cash flow, net investing cash flow, etc.
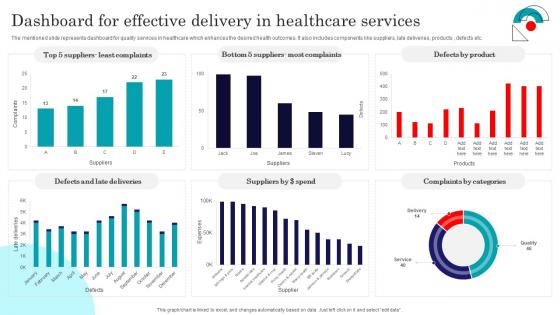
Dashboard For Effective Delivery In Healthcare Services Introduction Pdf
The mentioned slide represents dashboard for quality services in healthcare which enhances the desired health outcomes. It also includes components like suppliers, late deliveries, products , defects etc. Showcasing this set of slides titled Dashboard For Effective Delivery In Healthcare Services Introduction Pdf. The topics addressed in these templates are Late Deliveries, Complaints By Categories. All the content presented in this PPT design is completely editable. Download it and make adjustments in color, background, font etc. as per your unique business setting. The mentioned slide represents dashboard for quality services in healthcare which enhances the desired health outcomes. It also includes components like suppliers, late deliveries, products , defects etc.
A136 Vendor Management Audit KPI Dashboard For Tracking Supplier Compliance
Mentioned slide demonstrates KPI dashboard for evaluating supplier compliance and performance. It includes key components such as total suppliers, contracts, unlisted, contact compliance rate. Find a pre-designed and impeccable A136 Vendor Management Audit KPI Dashboard For Tracking Supplier Compliance. The templates can ace your presentation without additional effort. You can download these easy-to-edit presentation templates to make your presentation stand out from others. So, what are you waiting for Download the template from Slidegeeks today and give a unique touch to your presentation. Mentioned slide demonstrates KPI dashboard for evaluating supplier compliance and performance. It includes key components such as total suppliers, contracts, unlisted, contact compliance rate.
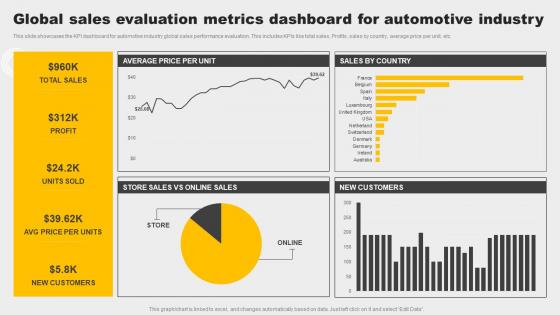
Global Sales Evaluation Metrics Dashboard For Automotive Industry Demonstration Pdf
This slide showcases the KPI dashboard for automotive industry global sales performance evaluation. This includes KPIs like total sales, Profits, sales by country, average price per unit, etc. Pitch your topic with ease and precision using this Global Sales Evaluation Metrics Dashboard For Automotive Industry Demonstration Pdf. This layout presents information on Customers, Profit, Sales. It is also available for immediate download and adjustment. So, changes can be made in the color, design, graphics or any other component to create a unique layout. This slide showcases the KPI dashboard for automotive industry global sales performance evaluation. This includes KPIs like total sales, Profits, sales by country, average price per unit, etc.
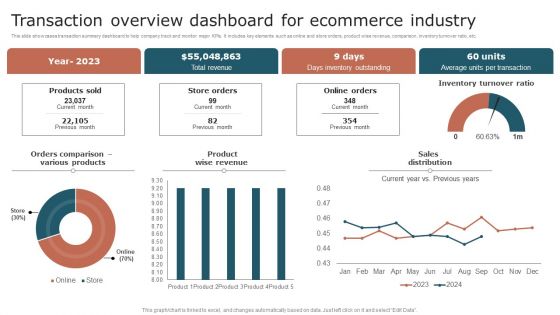
Transaction Overview Dashboard For Ecommerce Industry Summary PDF
This slide showcases transaction summary dashboard to help company track and monitor major KPIs. It includes key elements such as online and store orders, product wise revenue, comparison, inventory turnover ratio, etc. Pitch your topic with ease and precision using this Transaction Overview Dashboard For Ecommerce Industry Summary PDF. This layout presents information on Revenue, Inventory Outstanding, Transaction. It is also available for immediate download and adjustment. So, changes can be made in the color, design, graphics or any other component to create a unique layout.
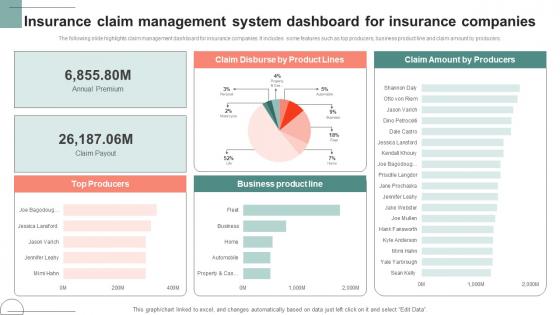
Insurance Claim Management System Dashboard For Insurance Companies Demonstration Pdf
The following slide highlights claim management dashboard for insurance companies. It includes some features such as top producers, business product line and claim amount by producers. Showcasing this set of slides titled Insurance Claim Management System Dashboard For Insurance Companies Demonstration Pdf The topics addressed in these templates are Claim Disburse, Product Lines, Business Product All the content presented in this PPT design is completely editable. Download it and make adjustments in color, background, font etc. as per your unique business setting. The following slide highlights claim management dashboard for insurance companies. It includes some features such as top producers, business product line and claim amount by producers.
Learning And Improvement KPI Training Dashboard Icon Graphics Pdf
Pitch your topic with ease and precision using this Learning And Improvement KPI Training Dashboard Icon Graphics Pdf. This layout presents information on Learning And Improvement KPI, Training Dashboard Icon. It is also available for immediate download and adjustment. So, changes can be made in the color, design, graphics or any other component to create a unique layout. Our Learning And Improvement KPI Training Dashboard Icon Graphics Pdf are topically designed to provide an attractive backdrop to any subject. Use them to look like a presentation pro.
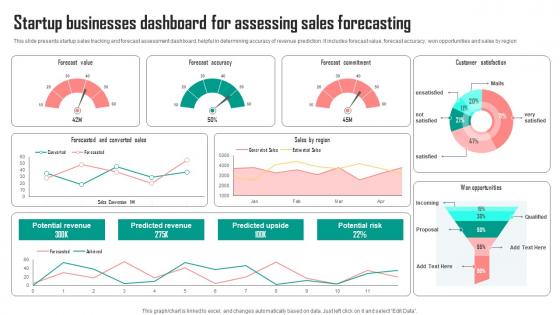
Startup Businesses Dashboard For Assessing Sales Forecasting Background Pdf
This slide presents startup sales tracking and forecast assessment dashboard, helpful in determining accuracy of revenue prediction. It includes forecast value, forecast accuracy, won opportunities and sales by region Pitch your topic with ease and precision using this Startup Businesses Dashboard For Assessing Sales Forecasting Background Pdf. This layout presents information on Forecast Value, Accuracy, Commitment. It is also available for immediate download and adjustment. So, changes can be made in the color, design, graphics or any other component to create a unique layout. This slide presents startup sales tracking and forecast assessment dashboard, helpful in determining accuracy of revenue prediction. It includes forecast value, forecast accuracy, won opportunities and sales by region
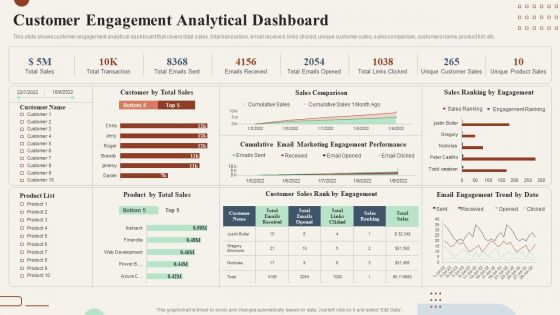
Action Plan To Enhance Customer Engagement Analytical Dashboard Elements PDF
This slide shows customer engagement analytical dashboard that covers total sales, total transaction, email received, links clicked, unique customer sales, sales comparison, customers name, product list. Present like a pro with Action Plan To Enhance Customer Engagement Analytical Dashboard Elements PDF Create beautiful presentations together with your team, using our easy-to-use presentation slides. Share your ideas in real-time and make changes on the fly by downloading our templates. So whether youre in the office, on the go, or in a remote location, you can stay in sync with your team and present your ideas with confidence. With Slidegeeks presentation got a whole lot easier. Grab these presentations today.
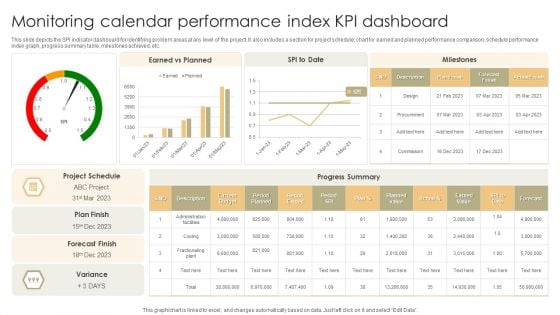
Monitoring Calendar Performance Index KPI Dashboard Slides PDF
This slide depicts the SPI indicator dashboard for identifying problem areas at any level of the project. It also includes a section for project schedule, chart for earned and planned performance comparison, schedule performance index graph, progress summary table, milestones achieved, etc. Pitch your topic with ease and precision using this Monitoring Calendar Performance Index KPI Dashboard Slides PDF. This layout presents information on Current Budget, Planned Value, Earned Value. It is also available for immediate download and adjustment. So, changes can be made in the color, design, graphics or any other component to create a unique layout.
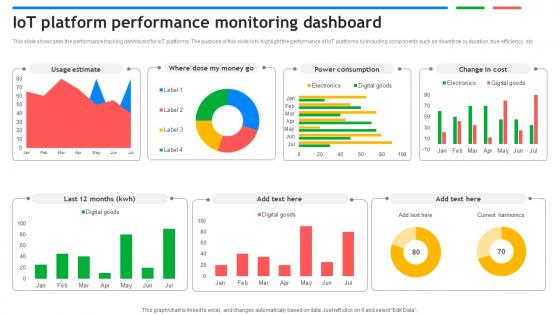
IoT Platform Performance Monitoring Dashboard Exploring Google Cloud IoT Platform
This slide showcases the performance tracking dashboard for IoT platforms. The purpose of this slide is to highlight the performance of IoT platforms by including components such as downtime by duration, true efficiency, etc. Are you searching for a IoT Platform Performance Monitoring Dashboard Exploring Google Cloud IoT Platform that is uncluttered, straightforward, and original Its easy to edit, and you can change the colors to suit your personal or business branding. For a presentation that expresses how much effort you have put in, this template is ideal With all of its features, including tables, diagrams, statistics, and lists, its perfect for a business plan presentation. Make your ideas more appealing with these professional slides. Download IoT Platform Performance Monitoring Dashboard Exploring Google Cloud IoT Platform from Slidegeeks today. This slide showcases the performance tracking dashboard for IoT platforms. The purpose of this slide is to highlight the performance of IoT platforms by including components such as downtime by duration, true efficiency, etc.
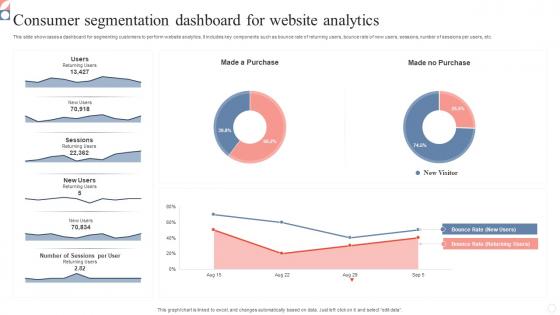
Consumer Segmentation Dashboard For Website Analytics Infographics Pdf
This slide showcases a dashboard for segmenting customers to perform website analytics. It includes key components such as bounce rate of returning users, bounce rate of new users, sessions, number of sessions per users, etc. Pitch your topic with ease and precision using this Consumer Segmentation Dashboard For Website Analytics Infographics Pdf. This layout presents information on Consumer Segmentation Dashboard, Website Analytics, Segmenting Customers. It is also available for immediate download and adjustment. So, changes can be made in the color, design, graphics or any other component to create a unique layout. This slide showcases a dashboard for segmenting customers to perform website analytics. It includes key components such as bounce rate of returning users, bounce rate of new users, sessions, number of sessions per users, etc.
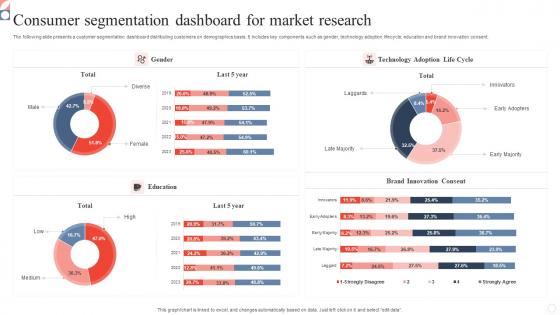
Consumer Segmentation Dashboard For Market Research Formats Pdf
The following slide presents a customer segmentation dashboard distributing customers on demographics basis. It includes key components such as gender, technology adoption lifecycle, education and brand innovation consent. Pitch your topic with ease and precision using this Consumer Segmentation Dashboard For Market Research Formats Pdf. This layout presents information on Consumer Segmentation Dashboard, Market Research, Technology Adoption Lifecycle. It is also available for immediate download and adjustment. So, changes can be made in the color, design, graphics or any other component to create a unique layout. The following slide presents a customer segmentation dashboard distributing customers on demographics basis. It includes key components such as gender, technology adoption lifecycle, education and brand innovation consent.
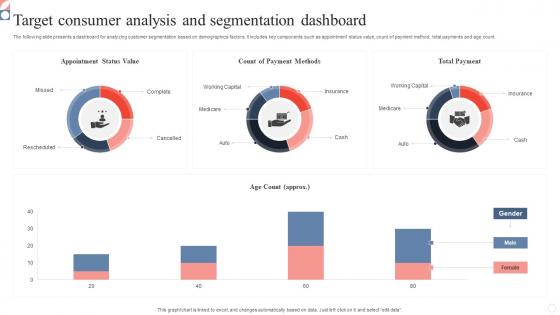
Target Consumer Analysis And Segmentation Dashboard Inspiration Pdf
The following slide presents a dashboard for analyzing customer segmentation based on demographics factors. It includes key components such as appointment status value, count of payment method, total payments and age count. Pitch your topic with ease and precision using this Target Consumer Analysis And Segmentation Dashboard Inspiration Pdf. This layout presents information on Target Consumer Analysis, Segmentation Dashboard, Appointment Status Value. It is also available for immediate download and adjustment. So, changes can be made in the color, design, graphics or any other component to create a unique layout. The following slide presents a dashboard for analyzing customer segmentation based on demographics factors. It includes key components such as appointment status value, count of payment method, total payments and age count.
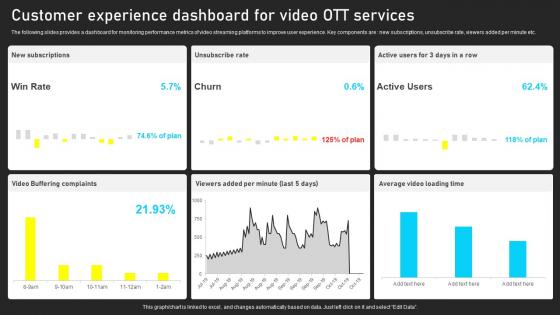
Customer Experience Dashboard For Video OTT Ervices Introduction Pdf
The following slides provides a dashboard for monitoring performance metrics of video streaming platforms to improve user experience. Key components are new subscriptions, unsubscribe rate, viewers added per minute etc. Pitch your topic with ease and precision using this Customer Experience Dashboard For Video OTT Ervices Introduction Pdf. This layout presents information on Customer Experience Dashboard, Video OTT Services. It is also available for immediate download and adjustment. So, changes can be made in the color, design, graphics or any other component to create a unique layout. The following slides provides a dashboard for monitoring performance metrics of video streaming platforms to improve user experience. Key components are new subscriptions, unsubscribe rate, viewers added per minute etc.
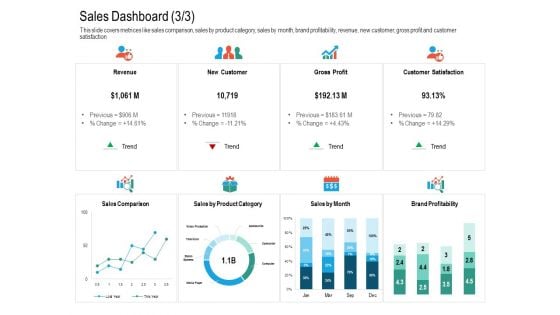
Upselling Strategies For Business Sales Dashboard Trend Guidelines PDF
This slide covers metrices like sales comparison, sales by product category, sales by month, brand profitability, revenue, new customer, gross profit and customer satisfaction. Deliver and pitch your topic in the best possible manner with this upselling strategies for business sales dashboard trend guidelines pdf. Use them to share invaluable insights on revenue, gross profit, customer satisfaction, new customer and impress your audience. This template can be altered and modified as per your expectations. So, grab it now.
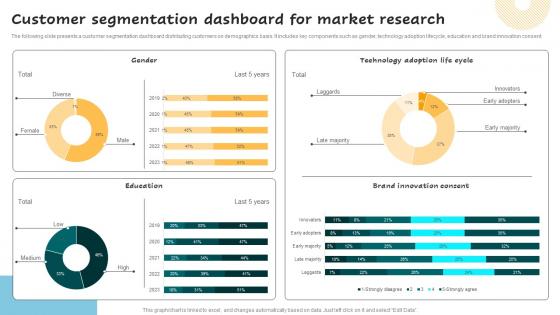
Customer Segmentation Dashboard Successful Guide For Market Segmentation Background Pdf
The following slide presents a customer segmentation dashboard distributing customers on demographics basis. It includes key components such as gender, technology adoption lifecycle, education and brand innovation consent. Do you have to make sure that everyone on your team knows about any specific topic I yes, then you should give Customer Segmentation Dashboard Successful Guide For Market Segmentation Background Pdf a try. Our experts have put a lot of knowledge and effort into creating this impeccable Customer Segmentation Dashboard Successful Guide For Market Segmentation Background Pdf. You can use this template for your upcoming presentations, as the slides are perfect to represent even the tiniest detail. You can download these templates from the Slidegeeks website and these are easy to edit. So grab these today. The following slide presents a customer segmentation dashboard distributing customers on demographics basis. It includes key components such as gender, technology adoption lifecycle, education and brand innovation consent.
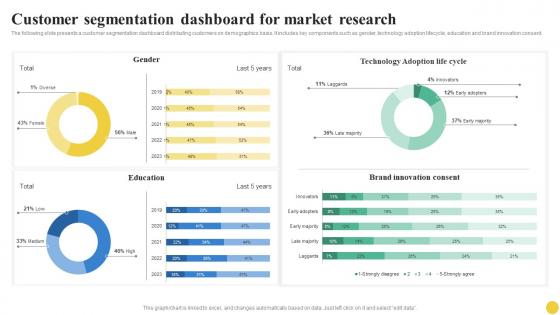
Customer Segmentation Dashboard For Market Research User Segmentation Themes Pdf
The following slide presents a customer segmentation dashboard distributing customers on demographics basis. It includes key components such as gender, technology adoption lifecycle, education and brand innovation consent. Do you have to make sure that everyone on your team knows about any specific topic I yes, then you should give Customer Segmentation Dashboard For Market Research User Segmentation Themes Pdf a try. Our experts have put a lot of knowledge and effort into creating this impeccable Customer Segmentation Dashboard For Market Research User Segmentation Themes Pdf. You can use this template for your upcoming presentations, as the slides are perfect to represent even the tiniest detail. You can download these templates from the Slidegeeks website and these are easy to edit. So grab these today The following slide presents a customer segmentation dashboard distributing customers on demographics basis. It includes key components such as gender, technology adoption lifecycle, education and brand innovation consent.
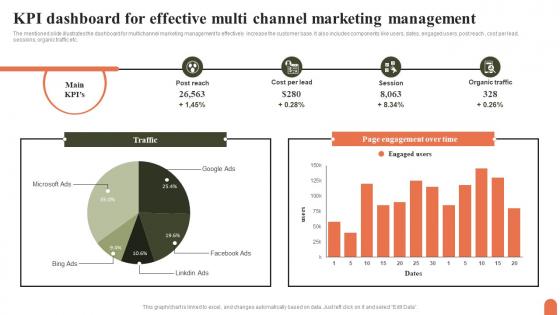
KPI Dashboard For Effective Multi Channel Marketing Management Topics Pdf
The mentioned slide illustrates the dashboard for multichannel marketing management to effectively increase the customer base. It also includes components like users, dates, engaged users, post reach , cost per lead, sessions, organic traffic etc. Showcasing this set of slides titled KPI Dashboard For Effective Multi Channel Marketing Management Topics Pdf. The topics addressed in these templates are KPI Dashboard, Effective Multi Channel, Marketing Management. All the content presented in this PPT design is completely editable. Download it and make adjustments in color, background, font etc. as per your unique business setting. The mentioned slide illustrates the dashboard for multichannel marketing management to effectively increase the customer base. It also includes components like users, dates, engaged users, post reach , cost per lead, sessions, organic traffic etc.
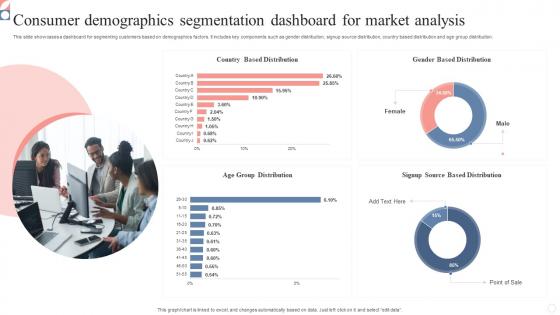
Consumer Demographics Segmentation Dashboard For Market Analysis Demonstration Pdf
This slide showcases a dashboard for segmenting customers based on demographics factors. It includes key components such as gender distribution, signup source distribution, country based distribution and age group distribution. Showcasing this set of slides titled Consumer Demographics Segmentation Dashboard For Market Analysis Demonstration Pdf. The topics addressed in these templates are Consumer Demographics, Segmentation Dashboard, Market Analysis. All the content presented in this PPT design is completely editable. Download it and make adjustments in color, background, font etc. as per your unique business setting. This slide showcases a dashboard for segmenting customers based on demographics factors. It includes key components such as gender distribution, signup source distribution, country based distribution and age group distribution.
Strategic Supplier Evaluation For KPI Dashboard For Tracking Supplier Compliance
Mentioned slide demonstrates KPI dashboard for evaluating supplier compliance and performance. It includes key components such as total suppliers, contracts, unlisted, contact compliance rate. Whether you have daily or monthly meetings, a brilliant presentation is necessary. Strategic Supplier Evaluation For KPI Dashboard For Tracking Supplier Compliance can be your best option for delivering a presentation. Represent everything in detail using Strategic Supplier Evaluation For KPI Dashboard For Tracking Supplier Compliance and make yourself stand out in meetings. The template is versatile and follows a structure that will cater to your requirements. All the templates prepared by Slidegeeks are easy to download and edit. Our research experts have taken care of the corporate themes as well. So, give it a try and see the results. Mentioned slide demonstrates KPI dashboard for evaluating supplier compliance and performance. It includes key components such as total suppliers, contracts, unlisted, contact compliance rate,
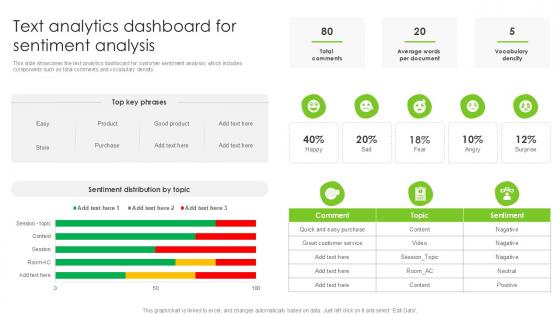
Text Analytics Dashboard For Sentiment Analysis PPT Template SS
This slide showcases the text analytics dashboard for customer sentiment analysis, which includes components such as total comments and vocabulary density. Here you can discover an assortment of the finest PowerPoint and Google Slides templates. With these templates, you can create presentations for a variety of purposes while simultaneously providing your audience with an eye-catching visual experience. Download Text Analytics Dashboard For Sentiment Analysis PPT Template SS to deliver an impeccable presentation. These templates will make your job of preparing presentations much quicker, yet still, maintain a high level of quality. Slidegeeks has experienced researchers who prepare these templates and write high-quality content for you. Later on, you can personalize the content by editing the Text Analytics Dashboard For Sentiment Analysis PPT Template SS. This slide showcases the text analytics dashboard for customer sentiment analysis, which includes components such as total comments and vocabulary density.

B2B Marketing Techniques Dashboard To Evaluate Top Performing Sales Representative
This slide showcases dashboard which helps track sales representatives performance by assessing cold calling KPIs. it provides information regarding KPIs such as conversion rates, no. of items sold. No. of deals converted, value generated etc. This B2B Marketing Techniques Dashboard To Evaluate Top Performing Sales Representative is perfect for any presentation, be it in front of clients or colleagues. It is a versatile and stylish solution for organizing your meetings. The B2B Marketing Techniques Dashboard To Evaluate Top Performing Sales Representative features a modern design for your presentation meetings. The adjustable and customizable slides provide unlimited possibilities for acing up your presentation. Slidegeeks has done all the homework before launching the product for you. So, do not wait, grab the presentation templates today This slide showcases dashboard which helps track sales representatives performance by assessing cold calling KPIs. it provides information regarding KPIs such as conversion rates, no. of items sold. No. of deals converted, value generated etc.
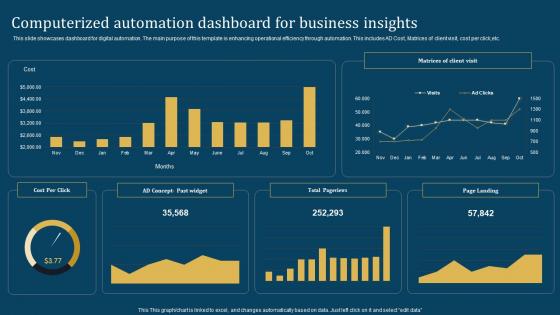
Computerized Automation Dashboard For Business Insights Graphics Pdf
This slide showcases dashboard for digital automation. The main purpose of this template is enhancing operational efficiency through automation. This includes AD Cost, Matrices of client visit, cost per click,etc.Pitch your topic with ease and precision using this Computerized Automation Dashboard For Business Insights Graphics Pdf This layout presents information on Computerized Automation, Dashboard Business Insights It is also available for immediate download and adjustment. So, changes can be made in the color, design, graphics or any other component to create a unique layout. This slide showcases dashboard for digital automation. The main purpose of this template is enhancing operational efficiency through automation. This includes AD Cost, Matrices of client visit, cost per click,etc.
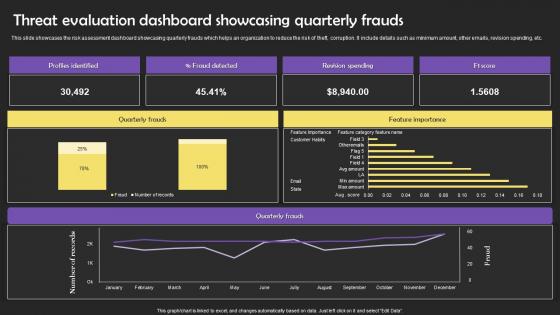
Threat Evaluation Dashboard Showcasing Quarterly Frauds Slides Pdf
This slide showcases the risk assessment dashboard showcasing quarterly frauds which helps an organization to reduce the risk of theft, corruption. It include details such as minimum amount, other emails, revision spending, etc. Pitch your topic with ease and precision using this Threat Evaluation Dashboard Showcasing Quarterly Frauds Slides Pdf This layout presents information on Threat Evaluation Dashboard Showcasing Quarterly Frauds Slides Pdf It is also available for immediate download and adjustment. So, changes can be made in the color, design, graphics or any other component to create a unique layout. This slide showcases the risk assessment dashboard showcasing quarterly frauds which helps an organization to reduce the risk of theft, corruption. It include details such as minimum amount, other emails, revision spending, etc.
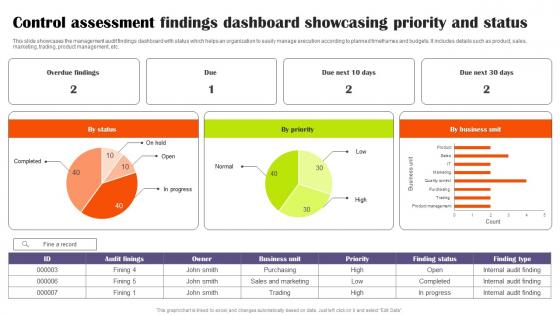
Control Assessment Findings Dashboard Showcasing Priority And Status Sample Pdf
This slide showcases the management audit findings dashboard with status which helps an organization to easily manage execution according to planned timeframes and budgets. It includes details such as product, sales, marketing, trading, product management, etc. Pitch your topic with ease and precision using this Control Assessment Findings Dashboard Showcasing Priority And Status Sample Pdf This layout presents information on Control Assessment, Findings Dashboard, Showcasing Priority It is also available for immediate download and adjustment. So, changes can be made in the color, design, graphics or any other component to create a unique layout. This slide showcases the management audit findings dashboard with status which helps an organization to easily manage execution according to planned timeframes and budgets. It includes details such as product, sales, marketing, trading, product management, etc.
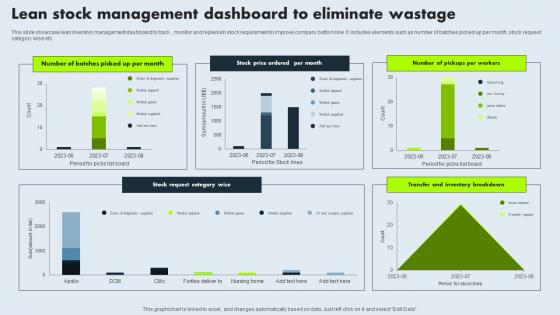
Lean Stock Management Dashboard To Eliminate Wastage Mockup Pdf
This slide showcase lean inventory management dashboard to track , monitor and replenish stock requirement to improve company bottom line. It includes elements such as number of batches picked up per month, stock request category wise etc. Pitch your topic with ease and precision using this Lean Stock Management Dashboard To Eliminate Wastage Mockup Pdf. This layout presents information on Lean Stock, Management Dashboard, Eliminate Wastage, Stock Request Category. It is also available for immediate download and adjustment. So, changes can be made in the color, design, graphics or any other component to create a unique layout. This slide showcase lean inventory management dashboard to track , monitor and replenish stock requirement to improve company bottom line. It includes elements such as number of batches picked up per month, stock request category wise etc.
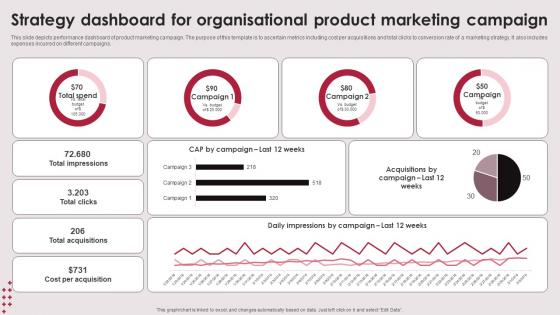
Strategy Dashboard For Organisational Product Marketing Campaign Elements Pdf
This slide depicts performance dashboard of product marketing campaign. The purpose of this template is to ascertain metrics including cost per acquisitions and total clicks to conversion rate of a marketing strategy. It also includes expenses incurred on different campaigns. Pitch your topic with ease and precision using this Strategy Dashboard For Organisational Product Marketing Campaign Elements PDF. This layout presents information on Strategy Dashboard, Organisational Product, Marketing Campaign. It is also available for immediate download and adjustment. So, changes can be made in the color, design, graphics or any other component to create a unique layout. This slide depicts performance dashboard of product marketing campaign. The purpose of this template is to ascertain metrics including cost per acquisitions and total clicks to conversion rate of a marketing strategy. It also includes expenses incurred on different campaigns.
Dashboard For Tracking Employee Satisfaction Rate Detailed Personnel Slides Pdf
This slide covers KPI dashboard to measure employee satisfaction due to effective internal communication. It includes indicators such as net promoter score, retention rate, absenteeism etc. This Dashboard For Tracking Employee Satisfaction Rate Detailed Personnel Slides Pdf is perfect for any presentation, be it in front of clients or colleagues. It is a versatile and stylish solution for organizing your meetings. The Dashboard For Tracking Employee Satisfaction Rate Detailed Personnel Slides Pdf features a modern design for your presentation meetings. The adjustable and customizable slides provide unlimited possibilities for acing up your presentation. Slidegeeks has done all the homework before launching the product for you. So, do not wait, grab the presentation templates today This slide covers KPI dashboard to measure employee satisfaction due to effective internal communication. It includes indicators such as net promoter score, retention rate, absenteeism etc.
Product Branding Performance Tracking Dashboard Strategies For Achieving Pictures Pdf
This slide provides information regarding product branding performance tracking dashboard in terms of revenues, new customers, customer satisfaction rate. This Product Branding Performance Tracking Dashboard Strategies For Achieving Pictures Pdf is perfect for any presentation, be it in front of clients or colleagues. It is a versatile and stylish solution for organizing your meetings. The Product Branding Performance Tracking Dashboard Strategies For Achieving Pictures Pdf features a modern design for your presentation meetings. The adjustable and customizable slides provide unlimited possibilities for acing up your presentation. Slidegeeks has done all the homework before launching the product for you. So, do not wait, grab the presentation templates today This slide provides information regarding product branding performance tracking dashboard in terms of revenues, new customers, customer satisfaction rate.
Cybernetics Implant Performance Tracking Dashboard Cybernetic Systems Template Pdf
This slide shows the Cybernetics implant performance tracking dashboard. The purpose of this slide is to represent the Information related to the status of Cybernetics implant graphically. This Cybernetics Implant Performance Tracking Dashboard Cybernetic Systems Template Pdf is perfect for any presentation, be it in front of clients or colleagues. It is a versatile and stylish solution for organizing your meetings. The Cybernetics Implant Performance Tracking Dashboard Cybernetic Systems Template Pdf features a modern design for your presentation meetings. The adjustable and customizable slides provide unlimited possibilities for acing up your presentation. Slidegeeks has done all the homework before launching the product for you. So, do not wait, grab the presentation templates today This slide shows the Cybernetics implant performance tracking dashboard. The purpose of this slide is to represent the Information related to the status of Cybernetics implant graphically.
Product And Customer Performance Tracking Dashboard Summary PDF
This slide provides information regarding dashboard utilized by firm to monitor performance of products offered and customer associated. The performance is tracked through revenues generated, new customer acquired, customer satisfaction, sales comparison, etc. If you are looking for a format to display your unique thoughts, then the professionally designed Product And Customer Performance Tracking Dashboard Summary PDF is the one for you. You can use it as a Google Slides template or a PowerPoint template. Incorporate impressive visuals, symbols, images, and other charts. Modify or reorganize the text boxes as you desire. Experiment with shade schemes and font pairings. Alter, share or cooperate with other people on your work. Download Product And Customer Performance Tracking Dashboard Summary PDF and find out how to give a successful presentation. Present a perfect display to your team and make your presentation unforgettable.
Product And Customer Performance Tracking Dashboard Portrait PDF
This slide provides information regarding dashboard utilized by firm to monitor performance of products offered and customer associated. The performance is tracked through revenues generated, new customer acquired, customer satisfaction, sales comparison, etc. Do you have an important presentation coming up Are you looking for something that will make your presentation stand out from the rest Look no further than Product And Customer Performance Tracking Dashboard Portrait PDF. With our professional designs, you can trust that your presentation will pop and make delivering it a smooth process. And with Slidegeeks, you can trust that your presentation will be unique and memorable. So why wait Grab Product And Customer Performance Tracking Dashboard Portrait PDF today and make your presentation stand out from the rest.
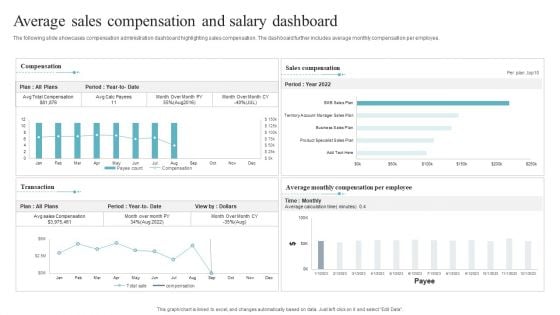
Average Sales Compensation And Salary Dashboard Introduction PDF
The following slide showcases compensation administration dashboard highlighting sales compensation. The dashboard further includes average monthly compensation per employee. Pitch your topic with ease and precision using this Average Sales Compensation And Salary Dashboard Introduction PDF. This layout presents information on Salary Dashboard, Average Sales Compensation. It is also available for immediate download and adjustment. So, changes can be made in the color, design, graphics or any other component to create a unique layout.
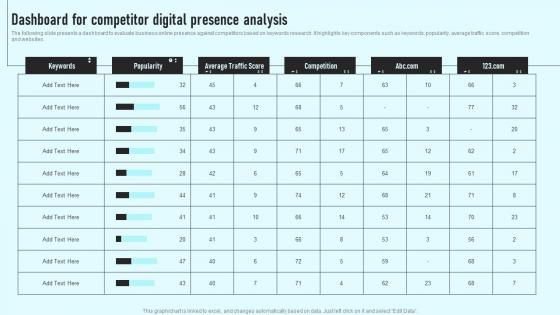
Dashboard For Competitor Digital Presence Analysis Comprehensive Guide Topics Pdf
The following slide presents a dashboard to evaluate business online presence against competitors based on keywords research. It highlights key components such as keywords, popularity, average traffic score, competition and websites. The Dashboard For Competitor Digital Presence Analysis Comprehensive Guide Topics Pdf is a compilation of the most recent design trends as a series of slides. It is suitable for any subject or industry presentation, containing attractive visuals and photo spots for businesses to clearly express their messages. This template contains a variety of slides for the user to input data, such as structures to contrast two elements, bullet points, and slides for written information. Slidegeeks is prepared to create an impression. The following slide presents a dashboard to evaluate business online presence against competitors based on keywords research. It highlights key components such as keywords, popularity, average traffic score, competition and websites.
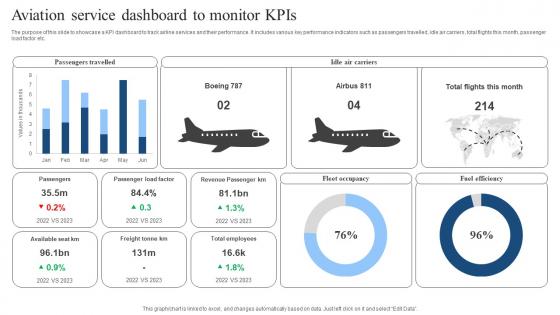
Aviation Service Dashboard To Monitor KPIs Download Pdf
The purpose of this slide to showcase a KPI dashboard to track airline services and their performance. It includes various key performance indicators such as passengers travelled, idle air carriers, total flights this month, passenger load factor etc. Pitch your topic with ease and precision using this Aviation Service Dashboard To Monitor KPIs Download Pdf. This layout presents information on Fleet Occupancy, Fuel Efficiency, Passengers Travelled. It is also available for immediate download and adjustment. So, changes can be made in the color, design, graphics or any other component to create a unique layout. The purpose of this slide to showcase a KPI dashboard to track airline services and their performance. It includes various key performance indicators such as passengers travelled, idle air carriers, total flights this month, passenger load factor etc.
Project Dashboard For Tracking Schedule Management Techniques PPT Presentation
This slide presents project dashboard for tracking task status or phases of project, that would help to monitor progress. It includes information on ongoing phase, budget, risks, pending tasks etc. Presenting this PowerPoint presentation, titled Project Dashboard For Tracking Schedule Management Techniques PPT Presentation, with topics curated by our researchers after extensive research. This editable presentation is available for immediate download and provides attractive features when used. Download now and captivate your audience. Presenting this Project Dashboard For Tracking Schedule Management Techniques PPT Presentation. Our researchers have carefully researched and created these slides with all aspects taken into consideration. This is a completely customizable Project Dashboard For Tracking Schedule Management Techniques PPT Presentation that is available for immediate downloading. Download now and make an impact on your audience. Highlight the attractive features available with our PPTs. This slide presents project dashboard for tracking task status or phases of project, that would help to monitor progress. It includes information on ongoing phase, budget, risks, pending tasks etc
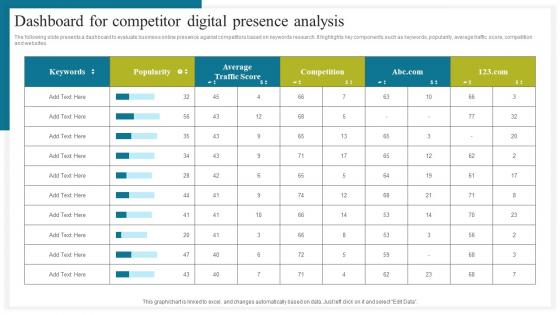
Dashboard For Competitor How To Conduct Competitive Assessment Formats Pdf
The following slide presents a dashboard to evaluate business online presence against competitors based on keywords research. It highlights key components such as keywords, popularity, average traffic score, competition and websites. The Dashboard For Competitor How To Conduct Competitive Assessment Formats Pdf is a compilation of the most recent design trends as a series of slides. It is suitable for any subject or industry presentation, containing attractive visuals and photo spots for businesses to clearly express their messages. This template contains a variety of slides for the user to input data, such as structures to contrast two elements, bullet points, and slides for written information. Slidegeeks is prepared to create an impression. The following slide presents a dashboard to evaluate business online presence against competitors based on keywords research. It highlights key components such as keywords, popularity, average traffic score, competition and websites.
Paid Media Advertising Marketing Performance Tracking Dashboard Clipart Pdf
This slide illustrates dashboard measuring performance of paid media advertising aimed at making quicker marketing decisions, boost sales by increasing brand value. It covers performance of key marketing metrics with graphs and data from ads Pitch your topic with ease and precision using this Paid Media Advertising Marketing Performance Tracking Dashboard Clipart Pdf. This layout presents information on Cost, Impressions, Clicks . It is also available for immediate download and adjustment. So, changes can be made in the color, design, graphics or any other component to create a unique layout. This slide illustrates dashboard measuring performance of paid media advertising aimed at making quicker marketing decisions, boost sales by increasing brand value. It covers performance of key marketing metrics with graphs and data from ads
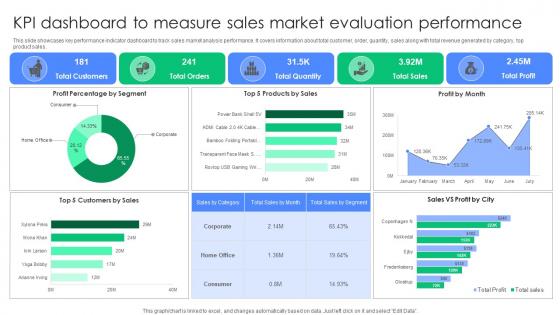
KPI Dashboard To Measure Sales Market Evaluation Performance Summary Pdf
This slide showcases key performance indicator dashboard to track sales market analysis performance. It covers information about total customer, order, quantity, sales along with total revenue generated by category, top product sales. Pitch your topic with ease and precision using this KPI Dashboard To Measure Sales Market Evaluation Performance Summary Pdf. This layout presents information on Profit Percentage Segment, Products Sales, Profit Month. It is also available for immediate download and adjustment. So, changes can be made in the color, design, graphics or any other component to create a unique layout. This slide showcases key performance indicator dashboard to track sales market analysis performance. It covers information about total customer, order, quantity, sales along with total revenue generated by category, top product sales.
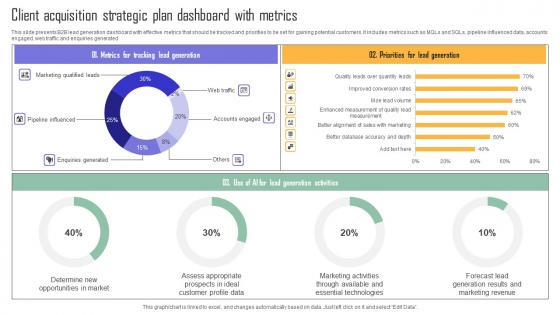
Client Acquisition Strategic Plan Dashboard With Metrics Clipart Pdf
This slide presents B2B lead generation dashboard with effective metrics that should be tracked and priorities to be set for gaining potential customers. It includes metrics such as MQLs and SQLs, pipeline influenced data, accounts engaged, web traffic and enquiries generated. Pitch your topic with ease and precision using this Client Acquisition Strategic Plan Dashboard With Metrics Clipart Pdf. This layout presents information on Priorities For Lead Generation, Tracking Lead Generation. It is also available for immediate download and adjustment. So, changes can be made in the color, design, graphics or any other component to create a unique layout. This slide presents B2B lead generation dashboard with effective metrics that should be tracked and priorities to be set for gaining potential customers. It includes metrics such as MQLs and SQLs, pipeline influenced data, accounts engaged, web traffic and enquiries generated.

Unlocking Potential Enhancing Team Management Dashboard To Track Task Completion
This slide depicts dashboard intended to track task completion rate within teams and its management. It includes data about team roles, planned vs actual tasks, task by status, total utilized work hours and task summary. This Unlocking Potential Enhancing Team Management Dashboard To Track Task Completion from Slidegeeks makes it easy to present information on your topic with precision. It provides customization options, so you can make changes to the colors, design, graphics, or any other component to create a unique layout. It is also available for immediate download, so you can begin using it right away. Slidegeeks has done good research to ensure that you have everything you need to make your presentation stand out. Make a name out there for a brilliant performance. This slide depicts dashboard intended to track task completion rate within teams and its management. It includes data about team roles, planned vs actual tasks, task by status, total utilized work hours and task summary.


 Continue with Email

 Home
Home


