Comparison Icon
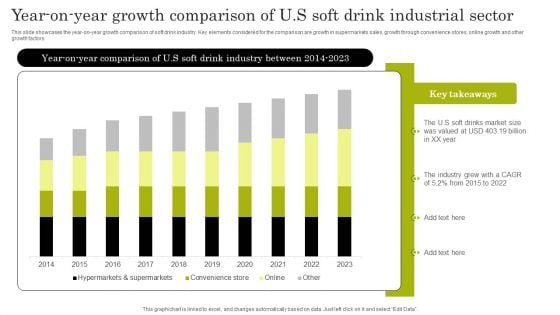
Year On Year Growth Comparison Of U S Soft Drink Industrial Sector Topics PDF
This slide showcases the year-on-year growth comparison of soft drink industry. Key elements considered for the comparison are growth in supermarkets sales, growth through convenience stores, online growth and other growth factors. Showcasing this set of slides titled Year On Year Growth Comparison Of U S Soft Drink Industrial Sector Topics PDF. The topics addressed in these templates are The Industry Grew, Soft Drinks, Market Size. All the content presented in this PPT design is completely editable. Download it and make adjustments in color, background, font etc. as per your unique business setting.
Web Hosting Comparison Chart Ppt PowerPoint Presentation Gallery Themes Cpb Pdf
Presenting this set of slides with name web hosting comparison chart ppt powerpoint presentation gallery themes cpb pdf. This is an editable Powerpoint eight stages graphic that deals with topics like web hosting comparison chart to help convey your message better graphically. This product is a premium product available for immediate download and is 100 percent editable in Powerpoint. Download this now and use it in your presentations to impress your audience.
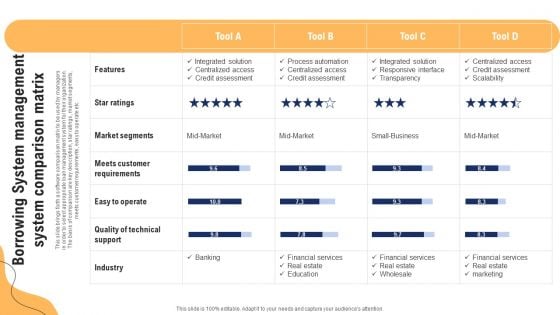
Borrowing System Management System Comparison Matrix Ppt Layouts Clipart Images PDF
This slide brings forth a software comparison matrix to be used by managers in order to select appropriate loan management system for their organization. The basis of comparison are key description, star ratings, market segments, meets customer requirements, easy to operate etc. Pitch your topic with ease and precision using this Borrowing System Management System Comparison Matrix Ppt Layouts Clipart Images PDF. This layout presents information on Market Segments, Meets Customer Requirements, Easy To Operate. It is also available for immediate download and adjustment. So, changes can be made in the color, design, graphics or any other component to create a unique layout.
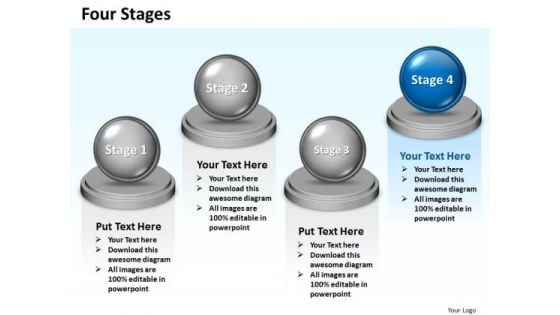
Ppt Comparison Swim Lane Diagram PowerPoint Template Of 4 State Templates
PPT comparison swim lane diagram powerpoint template of 4 state Templates-This image has been professionally designed to emphasize the concept of business strategy. Use this Swim Lane Diagram to map and improve the processes between departments and teams in your organization. This template is carefully considered and implemented with objectives of beauty, consistency, clarity, and most important, audience impact. Our template will make your presentation look impressive and stunning.-PPT comparison swim lane diagram powerpoint template of 4 state Templates-3d, Balance, Ball, Best, Board, Business, Clipart, Color, Compare, Comparison, Concept, Graphic, Heavy, Illustration, Isolated, Level, Nobody, Opposite, Orange, Parity, Render, Rendered, Reverse, Scale, Simple, Sphere Our Ppt Comparison Swim Lane Diagram PowerPoint Template Of 4 State Templates are cent per cent adaptable. They conform to all conditions.
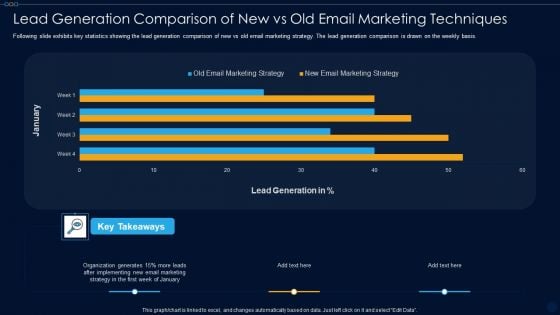
Lead Generation Comparison Of New Vs Old Email Marketing Techniques Ppt PowerPoint Presentation File Slides PDF
Following slide exhibits key statistics showing the lead generation comparison of new vs old email marketing strategy. The lead generation comparison is drawn on the weekly basis. Pitch your topic with ease and precision using this lead generation comparison of new vs old email marketing techniques ppt powerpoint presentation file slides pdf. This layout presents information on lead generation, organization generates, new email marketing strategy, old email marketing strategy. It is also available for immediate download and adjustment. So, changes can be made in the color, design, graphics or any other component to create a unique layout.
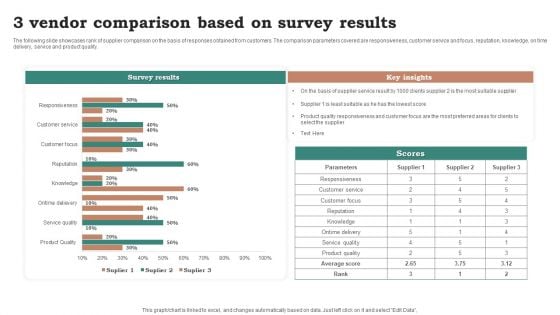
3 Vendor Comparison Based On Survey Results Ppt Ideas Graphic Tips PDF
The following slide showcases rank of supplier comparison on the basis of responses obtained from customers. The comparison parameters covered are responsiveness, customer service and focus, reputation, knowledge, on time delivery, service and product quality. Pitch your topic with ease and precision using this 3 Vendor Comparison Based On Survey Results Ppt Ideas Graphic Tips PDF. This layout presents information on Survey Results, Key Insights, Parameters. It is also available for immediate download and adjustment. So, changes can be made in the color, design, graphics or any other component to create a unique layout.
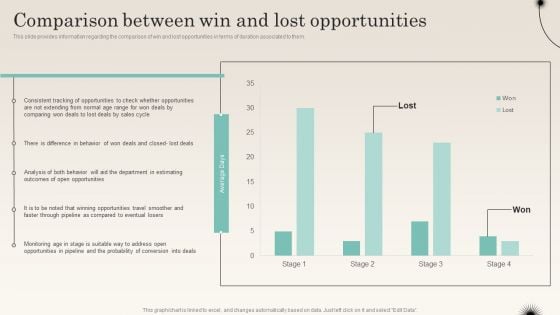
Comparison Between Win And Lost Opportunities Improving Distribution Channel Themes PDF
This slide provides information regarding the comparison of win and lost opportunities in terms of duration associated to them. Deliver an awe inspiring pitch with this creative Comparison Between Win And Lost Opportunities Improving Distribution Channel Themes PDF bundle. Topics like Tracking Opportunities, Winning Opportunities, Probability Conversion can be discussed with this completely editable template. It is available for immediate download depending on the needs and requirements of the user.

Comparison Chart Return On Capital Employed Ppt PowerPoint Presentation Portfolio Templates
This is a comparison chart return on capital employed ppt powerpoint presentation portfolio templates. This is a two stage process. The stages in this process are accounting ratio, roce, return on capital employed.
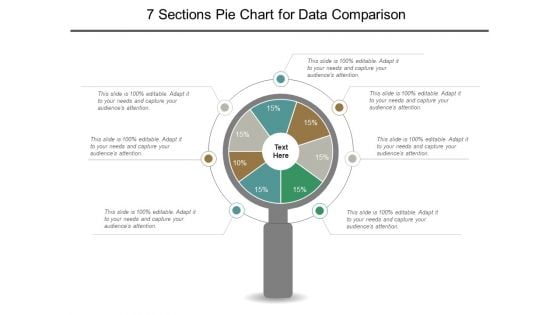
7 Sections Pie Chart For Data Comparison Ppt PowerPoint Presentation File Graphics Template
This is a 7 sections pie chart for data comparison ppt powerpoint presentation file graphics template. This is a seven stage process. The stages in this process are 6 piece pie chart, 6 segment pie chart, 6 parts pie chart.
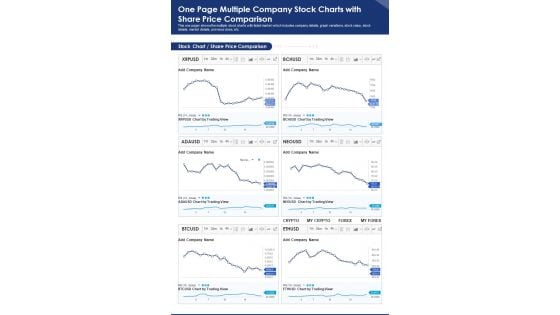
One Page Multiple Company Stock Charts With Share Price Comparison PDF Document PPT Template
Presenting you an exemplary One Page Multiple Company Stock Charts With Share Price Comparison PDF Document PPT Template. Our one-pager template comprises all the must-have essentials of an inclusive document. You can edit it with ease, as its layout is completely editable. With such freedom, you can tweak its design and other elements to your requirements. Download this One Page Multiple Company Stock Charts With Share Price Comparison PDF Document PPT Template Download now.
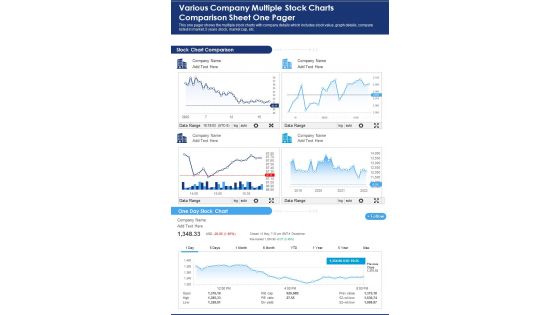
Various Company Multiple Stock Charts Comparison Sheet One Pager PDF Document PPT Template
Presenting you a fantastic Various Company Multiple Stock Charts Comparison Sheet One Pager PDF Document PPT Template. This one-pager document is crafted on hours of research and professional design efforts to ensure you have the best resource. It is completely editable and its design allow you to rehash its elements to suit your needs. Get this Various Company Multiple Stock Charts Comparison Sheet One Pager PDF Document PPT Template Download now.
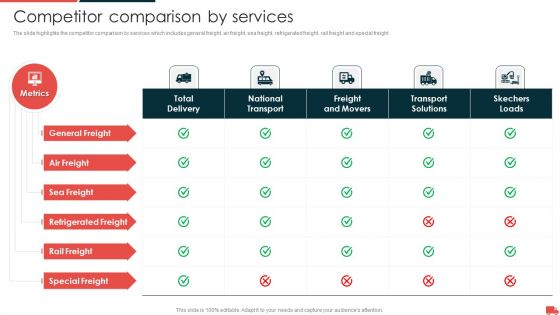
Transportation And Logistics Services Company Profile Competitor Comparison By Services Themes PDF
The slide highlights the competitor comparison by services which includes general freight, air freight, sea freight, refrigerated freight, rail freight and special freight. Deliver an awe inspiring pitch with this creative Transportation And Logistics Services Company Profile Competitor Comparison By Services Themes PDF bundle. Topics like General Freight, Air Freight, Sea Freight, Refrigerated Freight can be discussed with this completely editable template. It is available for immediate download depending on the needs and requirements of the user.
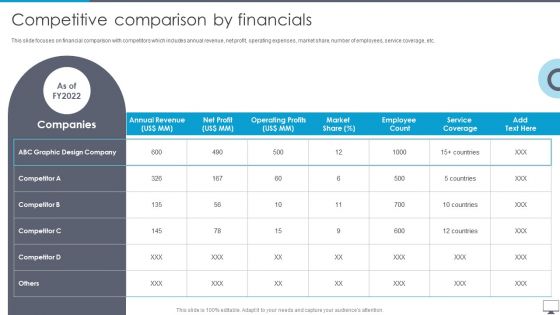
Graphic Designing And Visual Arts Company Profile Competitive Comparison By Financials Themes PDF
This slide focuses on financial comparison with competitors which includes annual revenue, net profit, operating expenses, market share, number of employees, service coverage, etc. Deliver an awe inspiring pitch with this creative Graphic Designing And Visual Arts Company Profile Competitive Comparison By Financials Themes PDF bundle. Topics like Annual Revenue, Operating Profits, Service Coverage can be discussed with this completely editable template. It is available for immediate download depending on the needs and requirements of the user.
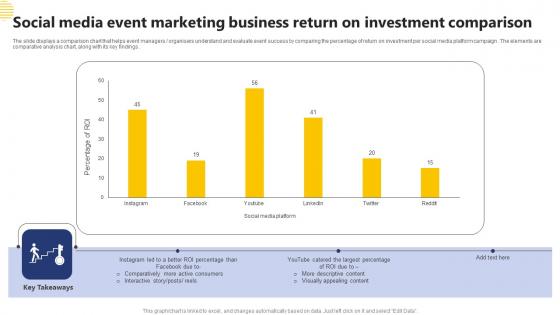
Social Media Event Marketing Business Return On Investment Comparison Microsoft Pdf
The slide displays a comparison chart that helps event managers organisers understand and evaluate event success by comparing the percentage of return on investment per social media platform campaign. The elements are comparative analysis chart, along with its key findings. Showcasing this set of slides titled Social Media Event Marketing Business Return On Investment Comparison Microsoft Pdf The topics addressed in these templates are Social Media Event, Marketing Business, Investment Comparison All the content presented in this PPT design is completely editable. Download it and make adjustments in color, background, font etc. as per your unique business setting. The slide displays a comparison chart that helps event managers organisers understand and evaluate event success by comparing the percentage of return on investment per social media platform campaign. The elements are comparative analysis chart, along with its key findings.
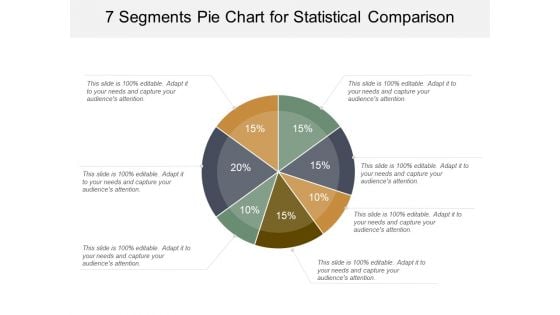
7 Segments Pie Chart For Statistical Comparison Ppt PowerPoint Presentation Gallery Visual Aids
This is a 7 segments pie chart for statistical comparison ppt powerpoint presentation gallery visual aids. This is a seven stage process. The stages in this process are 6 piece pie chart, 6 segment pie chart, 6 parts pie chart.
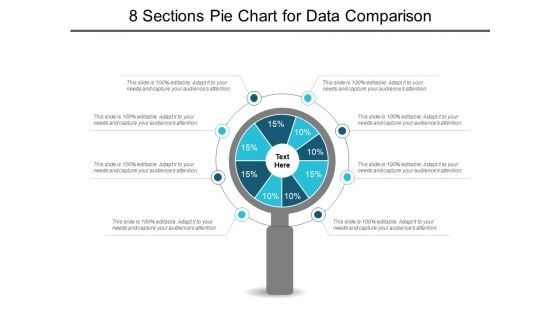
8 Sections Pie Chart For Data Comparison Ppt PowerPoint Presentation Show Slideshow
This is a 8 sections pie chart for data comparison ppt powerpoint presentation show slideshow. This is a eight stage process. The stages in this process are 6 piece pie chart, 6 segment pie chart, 6 parts pie chart.
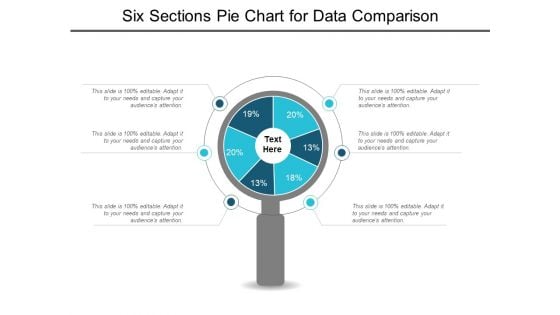
Six Sections Pie Chart For Data Comparison Ppt PowerPoint Presentation Styles Graphics Example
This is a six sections pie chart for data comparison ppt powerpoint presentation styles graphics example. This is a six stage process. The stages in this process are 6 piece pie chart, 6 segment pie chart, 6 parts pie chart.
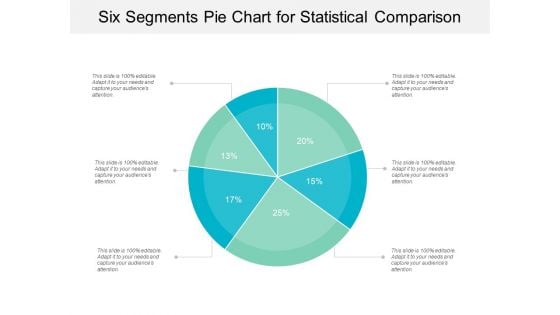
Six Segments Pie Chart For Statistical Comparison Ppt PowerPoint Presentation Gallery Background
This is a six segments pie chart for statistical comparison ppt powerpoint presentation gallery background. This is a six stage process. The stages in this process are 6 piece pie chart, 6 segment pie chart, 6 parts pie chart.
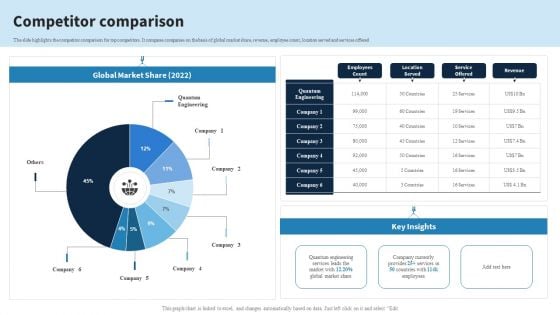
Engineering Services Company Report Competitor Comparison Ppt PowerPoint Presentation File Professional PDF
The slide highlights the competitor comparison for top competitors. It compares companies on the basis of global market share, revenue, employee count, location served and services offered. There are so many reasons you need a Engineering Services Company Report Competitor Comparison Ppt PowerPoint Presentation File Professional PDF. The first reason is you cant spend time making everything from scratch, Thus, Slidegeeks has made presentation templates for you too. You can easily download these templates from our website easily.
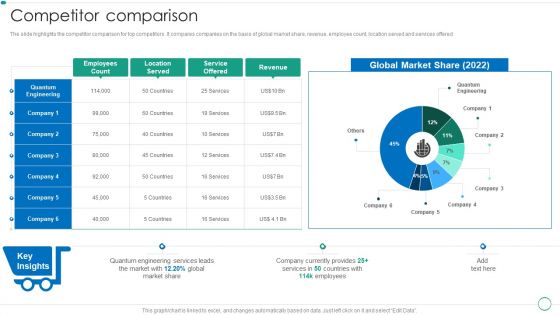
Real Estate Construction And Engineering Company Profile Competitor Comparison Slides PDF
The slide highlights the competitor comparison for top competitors. It compares companies on the basis of global market share, revenue, employee count, location served and services offered.Deliver an awe inspiring pitch with this creative Real Estate Construction And Engineering Company Profile Competitor Comparison Slides PDF bundle. Topics like Quantum Engineering, Company Currently, Market Share can be discussed with this completely editable template. It is available for immediate download depending on the needs and requirements of the user.
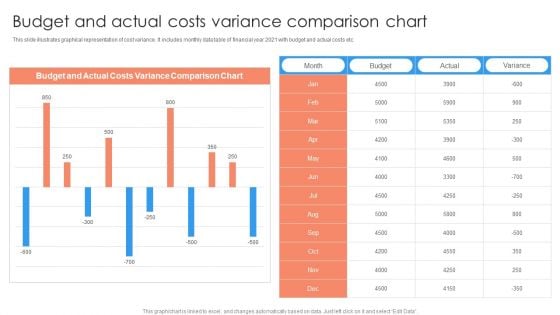
Budget And Actual Costs Variance Comparison Chart Ppt PowerPoint Presentation Show Graphics Example PDF
This slide illustrates graphical representation of cost variance. It includes monthly data table of financial year 2021 with budget and actual costs etc.Showcasing this set of slides titled Budget And Actual Costs Variance Comparison Chart Ppt PowerPoint Presentation Show Graphics Example PDF. The topics addressed in these templates are Budget And Actual, Costs Variance, Comparison Chart. All the content presented in this PPT design is completely editable. Download it and make adjustments in color, background, font etc. as per your unique business setting.
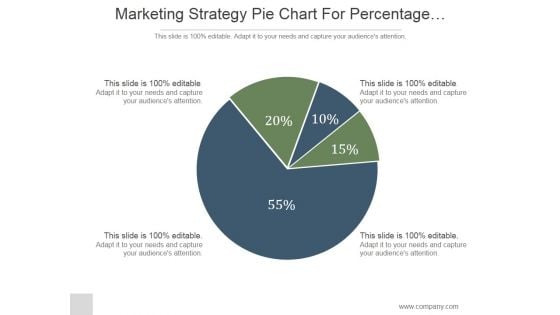
Marketing Strategy Pie Chart For Percentage Comparison Ppt PowerPoint Presentation Ideas
This is a marketing strategy pie chart for percentage comparison ppt powerpoint presentation ideas. This is a four stage process. The stages in this process are marketing, pie, strategy, finance, percentage.
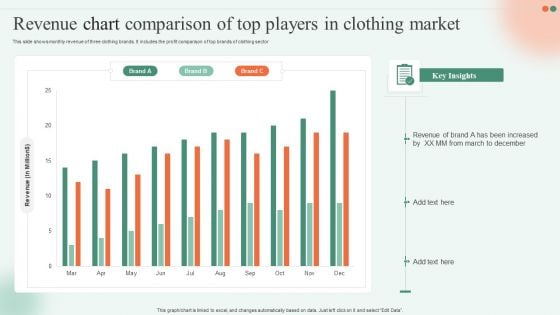
Revenue Chart Comparison Of Top Players In Clothing Market Ppt Infographics Skills PDF
This slide shows monthly revenue of three clothing brands. It includes the profit comparison of top brands of clothing sector Showcasing this set of slides titled Revenue Chart Comparison Of Top Players In Clothing Market Ppt Infographics Skills PDF. The topics addressed in these templates are Revenue, Brand, Key Insights. All the content presented in this PPT design is completely editable. Download it and make adjustments in color, background, font etc. as per your unique business setting.
Strategy PowerPoint Template Pros And Cons Business Comparison Chart Ppt Templates
Our strategy powerpoint template pros and cons business comparison chart ppt templates are quick on the draw. They immediately catch the drift of your thoughts. Drink to the success of your campaign. Our Marketing PowerPoint Templates will raise a toast. Pass it around on our Finance PowerPoint Templates. Your audience will lap it up. Get the best backing available. It'll be difficult to beat your thoughts and our Strategy PowerPoint Template Pros And Cons Business Comparison Chart Ppt Templates.
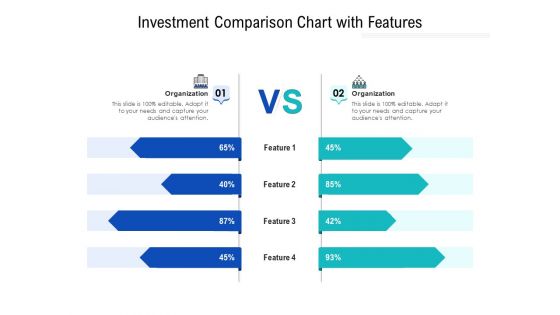
Investment Comparison Chart With Features Ppt PowerPoint Presentation File Structure PDF
Persuade your audience using this investment comparison chart with features ppt powerpoint presentation file structure pdf. This PPT design covers two stages, thus making it a great tool to use. It also caters to a variety of topics including investment comparison chart with features. Download this PPT design now to present a convincing pitch that not only emphasizes the topic but also showcases your presentation skills.

Two Product Comparison Chart With Features Ppt PowerPoint Presentation File Formats PDF
Persuade your audience using this two product comparison chart with features ppt powerpoint presentation file formats pdf. This PPT design covers two stages, thus making it a great tool to use. It also caters to a variety of topics including two product comparison chart with features. Download this PPT design now to present a convincing pitch that not only emphasizes the topic but also showcases your presentation skills.
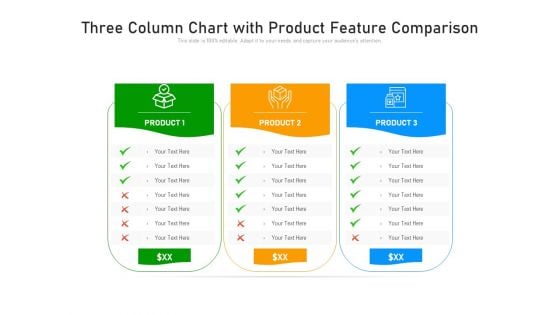
Three Column Chart With Product Feature Comparison Ppt PowerPoint Presentation Gallery Layouts PDF
Persuade your audience using this three column chart with product feature comparison ppt powerpoint presentation gallery layouts pdf. This PPT design covers three stages, thus making it a great tool to use. It also caters to a variety of topics including three column chart with product feature comparison. Download this PPT design now to present a convincing pitch that not only emphasizes the topic but also showcases your presentation skills.
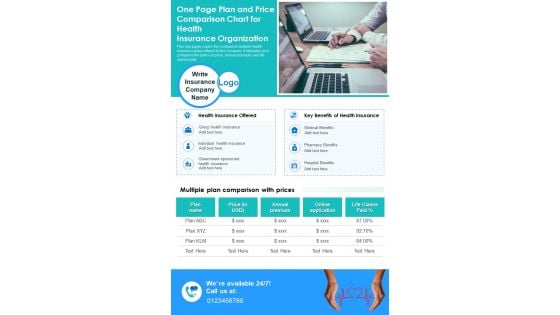
One Page Plan And Price Comparison Chart For Health Insurance Organization PDF Document PPT Template
Heres a predesigned One Page Plan And Price Comparison Chart For Health Insurance Organization PDF Document PPT Template for you. Built on extensive research and analysis, this one-pager template has all the centerpieces of your specific requirements. This temple exudes brilliance and professionalism. Being completely editable, you can make changes to suit your purpose. Get this One Page Plan And Price Comparison Chart For Health Insurance Organization PDF Document PPT Template Download now.
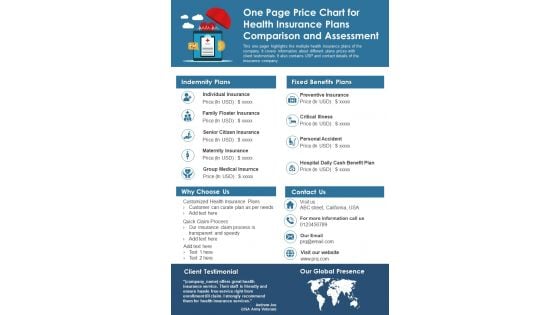
One Page Price Chart For Health Insurance Plans Comparison And Assessment PDF Document PPT Template
Presenting you an exemplary One Page Price Chart For Health Insurance Plans Comparison And Assessment PDF Document PPT Template. Our one-pager template comprises all the must-have essentials of an inclusive document. You can edit it with ease, as its layout is completely editable. With such freedom, you can tweak its design and other elements to your requirements. Download this One Page Price Chart For Health Insurance Plans Comparison And Assessment PDF Document PPT Template Download now.
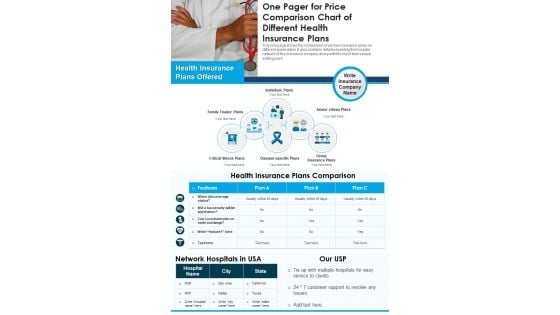
One Pager For Price Comparison Chart Of Different Health Insurance Plans PDF Document PPT Template
Looking for a predesigned One Pager For Price Comparison Chart Of Different Health Insurance Plans PDF Document PPT Template Heres the perfect piece for you It has everything that a well-structured one-pager template should have. Besides, it is 100 percent editable, which offers you the cushion to make adjustments according to your preferences. Grab this One Pager For Price Comparison Chart Of Different Health Insurance Plans PDF Document PPT Template Download now.
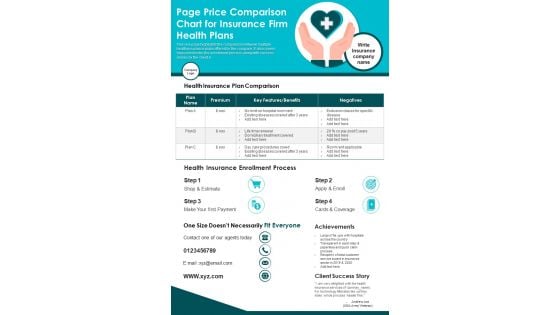
Page Price Comparison Chart For Insurance Firm Health Plans PDF Document PPT Template
Presenting you a fantastic Page Price Comparison Chart For Insurance Firm Health Plans PDF Document PPT Template. This one-pager document is crafted on hours of research and professional design efforts to ensure you have the best resource. It is completely editable and its design allow you to rehash its elements to suit your needs. Get this Page Price Comparison Chart For Insurance Firm Health Plans PDF Document PPT Template Download now.
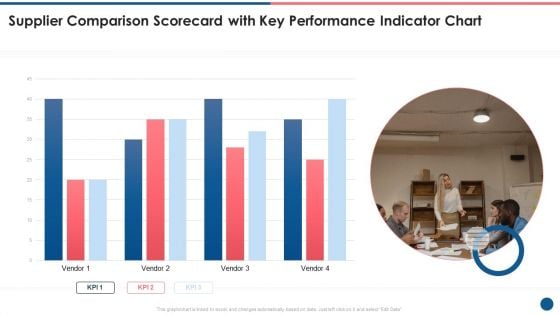
Supplier Scorecard Supplier Comparison Scorecard With Key Performance Indicator Chart Formats PDF
This is a supplier scorecard supplier comparison scorecard with key performance indicator chart formats pdf template with various stages. Focus and dispense information on one stages using this creative set, that comes with editable features. It contains large content boxes to add your information on topics like supplier comparison scorecard, key performance, indicator chart. You can also showcase facts, figures, and other relevant content using this PPT layout. Grab it now.
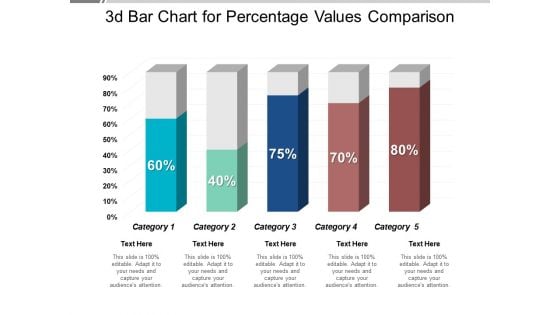
3D Bar Chart For Percentage Values Comparison Ppt PowerPoint Presentation Professional Visual Aids
This is a 3d bar chart for percentage values comparison ppt powerpoint presentation professional visual aids. This is a five stage process. The stages in this process are art, colouring, paint brush.
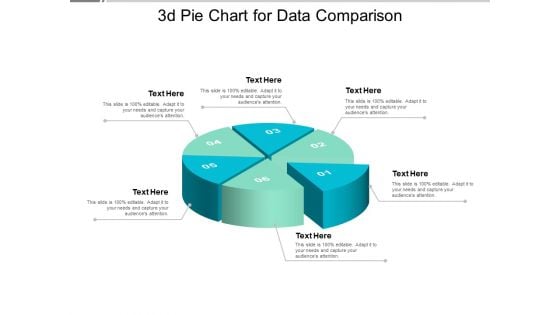
3D Pie Chart For Data Comparison Ppt PowerPoint Presentation Model Design Ideas
This is a 3d pie chart for data comparison ppt powerpoint presentation model design ideas. This is a six stage process. The stages in this process are art, colouring, paint brush.
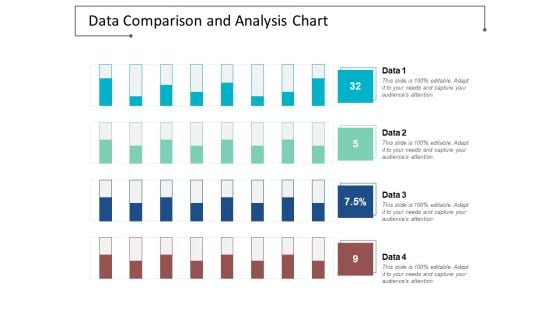
Data Comparison And Analysis Chart Ppt Powerpoint Presentation File Background Images
This is a data comparison and analysis chart ppt powerpoint presentation file background images. This is a four stage process. The stages in this process are data presentation, content presentation, information presentation.
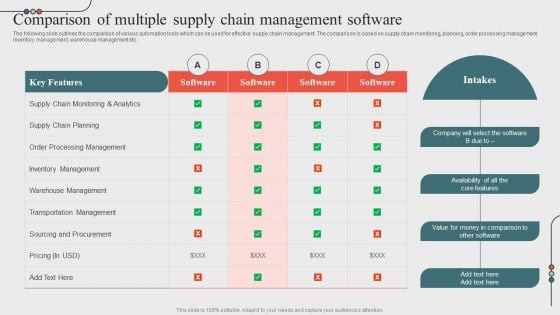
Comparison Of Multiple Supply Chain Managementoptimizing Business Processes Through Automation Themes PDF
The following slide outlines the comparison of various automation tools which can be used for effective supply chain management. The comparison is based on supply chain monitoring, planning, order processing management, inventory management, warehouse management etc. Crafting an eye catching presentation has never been more straightforward. Let your presentation shine with this tasteful yet straightforward Comparison Of Multiple Supply Chain Managementoptimizing Business Processes Through Automation Themes PDF template. It offers a minimalistic and classy look that is great for making a statement. The colors have been employed intelligently to add a bit of playfulness while still remaining professional. Construct the ideal Comparison Of Multiple Supply Chain Managementoptimizing Business Processes Through Automation Themes PDF that effortlessly grabs the attention of your audience. Begin now and be certain to wow your customers.
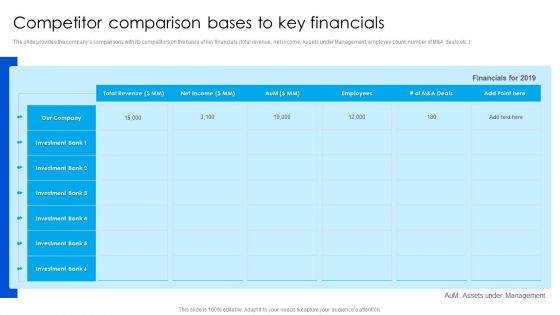
Strategy To Raise Funds Competitor Comparison Bases To Key Financials Diagrams PDF
The slide provides the companys comparisons with its competitors on the basis of key financials total revenue, net income, Assets under Management, employee count, number of MandA deals etc. There are so many reasons you need a Strategy To Raise Funds Competitor Comparison Bases To Key Financials Diagrams PDF. The first reason is you cant spend time making everything from scratch, Thus, Slidegeeks has made presentation templates for you too. You can easily download these templates from our website easily.
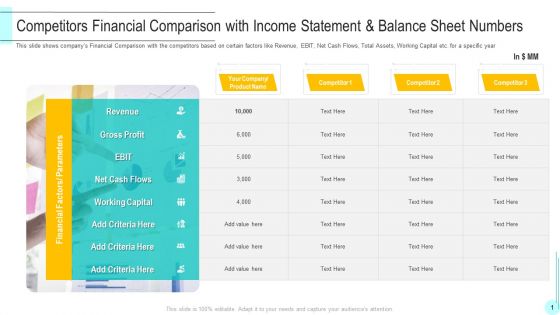
Competitors Financial Comparison With Income Statement And Balance Sheet Numbers Diagrams PDF
This slide shows companys Financial Comparison with the competitors based on certain factors like Revenue, EBIT, Net Cash Flows, Total Assets, Working Capital etc. for a specific year. Deliver an awe inspiring pitch with this creative competitors financial comparison with income statement and balance sheet numbers diagrams pdf bundle. Topics like gross profit, net cash flows, working capital can be discussed with this completely editable template. It is available for immediate download depending on the needs and requirements of the user.
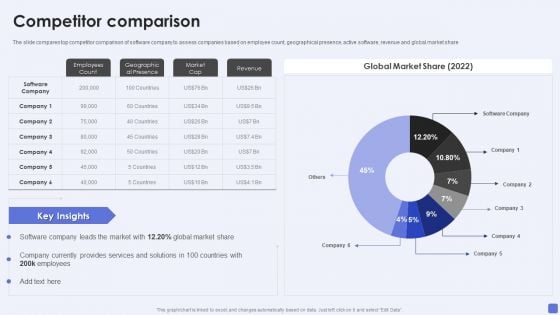
Software Services Business Profile Competitor Comparison Ppt PowerPoint Presentation File Inspiration PDF
The slide compares top competitor comparison of software company to assess companies based on employee count, geographical presence, active software, revenue and global market share. Deliver an awe inspiring pitch with this creative Software Services Business Profile Competitor Comparison Ppt PowerPoint Presentation File Inspiration PDF bundle. Topics like Employees Count, Geographical Presence, Market Cap can be discussed with this completely editable template. It is available for immediate download depending on the needs and requirements of the user.
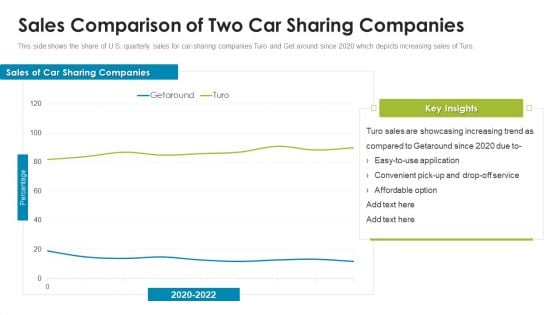
Turo Investor Capital Fundraising Pitch Deck Sales Comparison Of Two Car Sharing Companies Elements PDF
This side shows the share of U.S. quarterly sales for car-sharing companies Turo and Get around since 2020 which depicts increasing sales of Turo. Deliver an awe inspiring pitch with this creative turo investor capital fundraising pitch deck sales comparison of two car sharing companies elements pdf bundle. Topics like sales comparison of two car sharing companies can be discussed with this completely editable template. It is available for immediate download depending on the needs and requirements of the user.
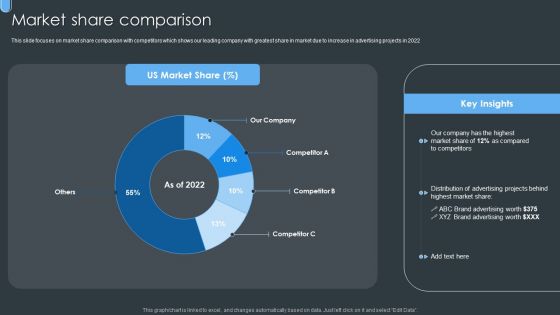
Digital Ad Marketing Services Company Profile Market Share Comparison Clipart PDF
This slide focuses on market share comparison with competitors which shows our leading company with greatest share in market due to increase in advertising projects in 2022. Deliver an awe inspiring pitch with this creative Digital Ad Marketing Services Company Profile Market Share Comparison Clipart PDF bundle. Topics like Market Share, Advertising Projects can be discussed with this completely editable template. It is available for immediate download depending on the needs and requirements of the user.
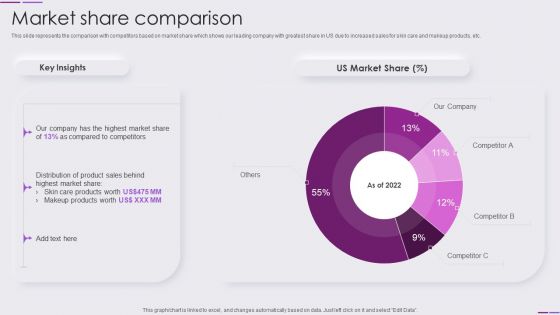
Beauty And Skincare Products Company Profile Market Share Comparison Guidelines PDF
This slide represents the comparison with competitors based on market share which shows our leading company with greatest share in US due to increased sales for skin care and makeup products, etc. Deliver an awe inspiring pitch with this creative Beauty And Skincare Products Company Profile Market Share Comparison Guidelines PDF bundle. Topics like Care Products, Distribution Product, Highest Market can be discussed with this completely editable template. It is available for immediate download depending on the needs and requirements of the user.

Advertising Solutions Company Details Market Share Comparison Ppt PowerPoint Presentation Gallery Guidelines PDF
This slide focuses on market share comparison with competitors which shows our leading company with greatest share in market due to increase in advertising projects in 2022. Deliver an awe inspiring pitch with this creative Advertising Solutions Company Details Market Share Comparison Ppt PowerPoint Presentation Gallery Guidelines PDF bundle. Topics like Key Insights, US Market Share, Competitor can be discussed with this completely editable template. It is available for immediate download depending on the needs and requirements of the user.
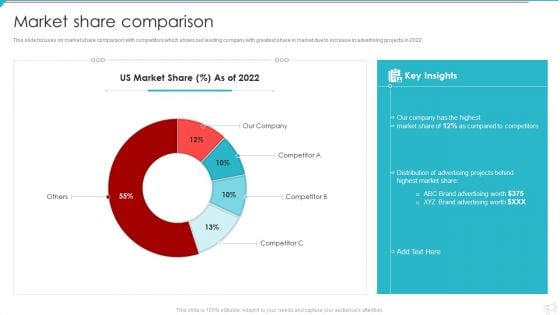
Advertisement And Marketing Agency Company Profile Market Share Comparison Graphics PDF
This slide focuses on market share comparison with competitors which shows our leading company with greatest share in market due to increase in advertising projects in 2022. Deliver an awe inspiring pitch with this creative Advertisement And Marketing Agency Company Profile Market Share Comparison Graphics PDF bundle. Topics like US Market Share, Distribution Advertising, Projects Behind, Highest Market Share can be discussed with this completely editable template. It is available for immediate download depending on the needs and requirements of the user.
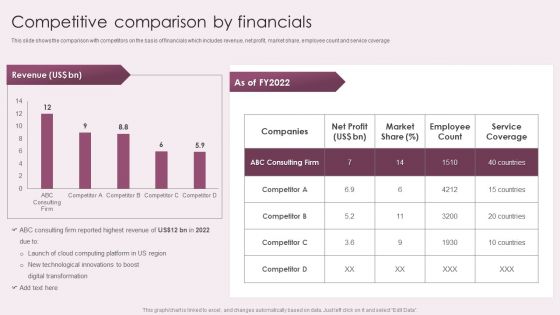
Business Advisory Solutions Company Profile Competitive Comparison By Financials Rules PDF
This slide shows the comparison with competitors on the basis of financials which includes revenue, net profit, market share, employee count and service coverage. Deliver an awe inspiring pitch with this creative Business Advisory Solutions Company Profile Competitive Comparison By Financials Rules PDF bundle. Topics like Highest Revenue, Net Profit, Market Share can be discussed with this completely editable template. It is available for immediate download depending on the needs and requirements of the user.
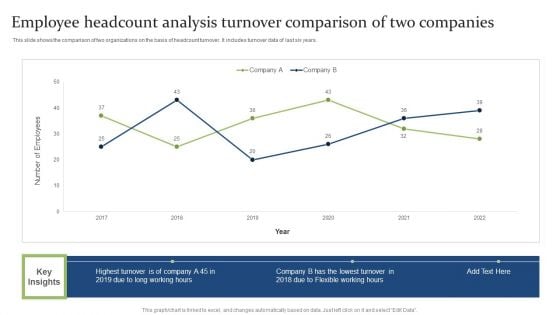
Employee Headcount Analysis Turnover Comparison Of Two Companies Ppt PowerPoint Presentation Infographics Smartart PDF
This slide shows the comparison of two organizations on the basis of headcount turnover. It includes turnover data of last six years. Showcasing this set of slides titled Employee Headcount Analysis Turnover Comparison Of Two Companies Ppt PowerPoint Presentation Infographics Smartart PDF. The topics addressed in these templates are Highest Turnover, Flexible Working, Lowest. All the content presented in this PPT design is completely editable. Download it and make adjustments in color, background, font etc. as per your unique business setting.
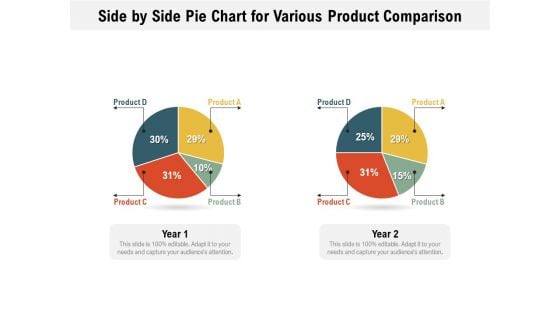
Side By Side Pie Chart For Various Product Comparison Ppt PowerPoint Presentation File Infographics PDF
Pitch your topic with ease and precision using this side by side pie chart for various product comparison ppt powerpoint presentation file infographics pdf. This layout presents information on side by side pie chart for various product comparison. It is also available for immediate download and adjustment. So, changes can be made in the color, design, graphics or any other component to create a unique layout.
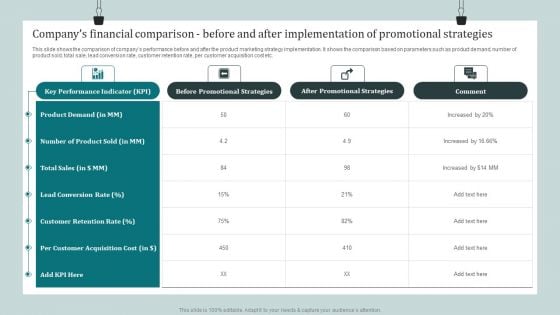
Companys Financial Comparison Before And After Implementation Of Promotional Strategies Introduction PDF
This slide shows the comparison of companys performance before and after the product marketing strategy implementation. It shows the comparison based on parameters such as product demand, number of product sold, total sale, lead conversion rate, customer retention rate, per customer acquisition cost etc. If you are looking for a format to display your unique thoughts, then the professionally designed Companys Financial Comparison Before And After Implementation Of Promotional Strategies Introduction PDF is the one for you. You can use it as a Google Slides template or a PowerPoint template. Incorporate impressive visuals, symbols, images, and other charts. Modify or reorganize the text boxes as you desire. Experiment with shade schemes and font pairings. Alter, share or cooperate with other people on your work. Download Companys Financial Comparison Before And After Implementation Of Promotional Strategies Introduction PDF and find out how to give a successful presentation. Present a perfect display to your team and make your presentation unforgettable.
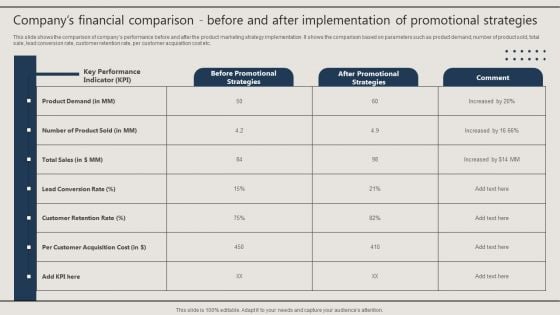
Companys Financial Comparison Before And After Implementation Of Promotional Strategies Infographics PDF
This slide shows the comparison of companys performance before and after the product marketing strategy implementation. It shows the comparison based on parameters such as product demand, number of product sold, total sale, lead conversion rate, customer retention rate, per customer acquisition cost etc. If you are looking for a format to display your unique thoughts, then the professionally designed Companys Financial Comparison Before And After Implementation Of Promotional Strategies Infographics PDF is the one for you. You can use it as a Google Slides template or a PowerPoint template. Incorporate impressive visuals, symbols, images, and other charts. Modify or reorganize the text boxes as you desire. Experiment with shade schemes and font pairings. Alter, share or cooperate with other people on your work. Download Companys Financial Comparison Before And After Implementation Of Promotional Strategies Infographics PDF and find out how to give a successful presentation. Present a perfect display to your team and make your presentation unforgettable.
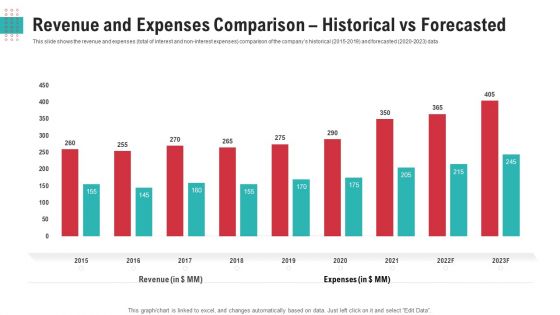
Revenue And Expenses Comparison Historical Vs Forecasted Ppt Show Outfit PDF
This slide shows the revenue and expenses total of interest and non-interest expenses comparison of the companys historical 2015 to 2019 and forecasted 2020 to 2023 data.Deliver an awe-inspiring pitch with this creative revenue and expenses comparison historical vs forecasted ppt show outfit pdf. bundle. Topics like 2015 to 2024, revenue can be discussed with this completely editable template. It is available for immediate download depending on the needs and requirements of the user
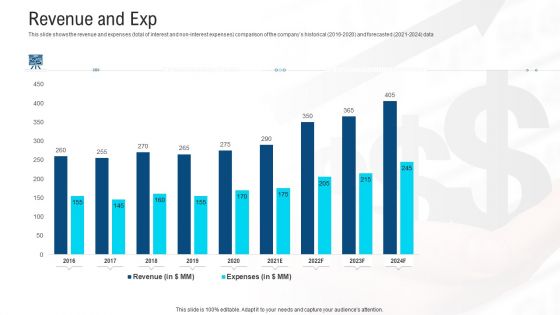
Revenue And Expenses Comparison Historical Vs Forecasted Ppt Show Deck PDF
This slide shows the revenue and expenses total of interest and non interest expenses comparison of the companys historical 2016 to2020 and forecasted 2021 to2024 data.Deliver and pitch your topic in the best possible manner with this revenue and expenses comparison historical vs forecasted ppt show deck pdf. Use them to share invaluable insights on 2015 to 2024, revenue and impress your audience. This template can be altered and modified as per your expectations. So, grab it now.
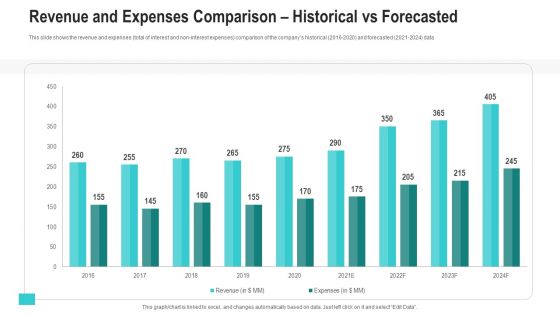
Revenue And Expenses Comparison Historical Vs Forecasted Ppt Show Tips PDF
This slide shows the revenue and expenses total of interest and non-interest expenses comparison of the companys historical 2016-2020 and forecasted 2021-2024 data. Deliver and pitch your topic in the best possible manner with this revenue and expenses comparison historical vs forecasted ppt show tips pdf. Use them to share invaluable insights on revenue, expenses and impress your audience. This template can be altered and modified as per your expectations. So, grab it now.
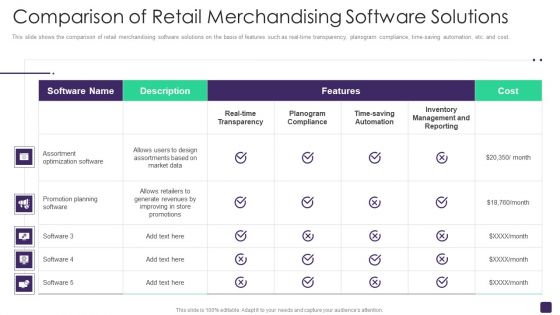
Retail Merchandising Program Comparison Of Retail Merchandising Software Solutions Themes PDF
This slide shows the comparison of retail merchandising software solutions on the basis of features such as real-time transparency, planogram compliance, time-saving automation, etc. and cost. Deliver an awe inspiring pitch with this creative Retail Merchandising Program Comparison Of Retail Merchandising Software Solutions Themes PDF bundle. Topics like Assortment, Optimization Software, Promotion Planning, Planogram Compliance can be discussed with this completely editable template. It is available for immediate download depending on the needs and requirements of the user.
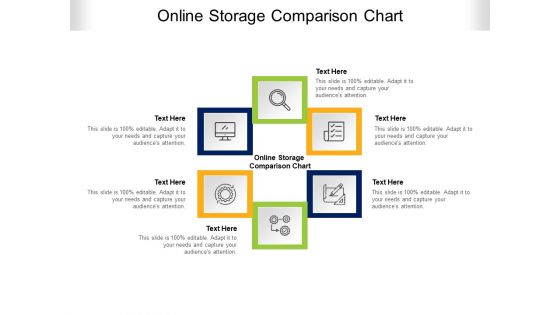
Online Storage Comparison Chart Ppt PowerPoint Presentation Show Topics Cpb Pdf
Presenting this set of slides with name online storage comparison chart ppt powerpoint presentation show topics cpb pdf. This is an editable Powerpoint six stages graphic that deals with topics like online storage comparison chart to help convey your message better graphically. This product is a premium product available for immediate download and is 100 percent editable in Powerpoint. Download this now and use it in your presentations to impress your audience.
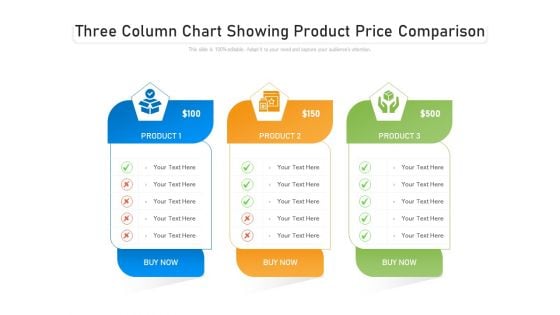
Three Column Chart Showing Product Price Comparison Ppt PowerPoint Presentation Ideas Deck PDF
Persuade your audience using this three column chart showing product price comparison ppt powerpoint presentation ideas deck pdf. This PPT design covers three stages, thus making it a great tool to use. It also caters to a variety of topics including three column chart showing product price comparison. Download this PPT design now to present a convincing pitch that not only emphasizes the topic but also showcases your presentation skills.
Vector Showing Statistics Comparison Bar Chart Ppt Visual Aids Styles PDF
Persuade your audience using this Vector Showing Statistics Comparison Bar Chart Ppt Visual Aids Styles PDF. This PPT design covers three stages, thus making it a great tool to use. It also caters to a variety of topics including vector showing statistics comparison bar chart. Download this PPT design now to present a convincing pitch that not only emphasizes the topic but also showcases your presentation skills.
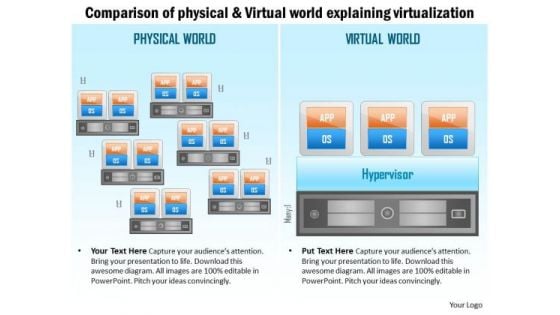
Business Diagram Comparison Of Physical And Virtual World Explaining Virtualization Ppt Slide
Concept of comparison in between virtual and physical world has been displayed in this diagram. To display this concept we have used graphic of servers in sequential order. Download this editable diagram slide to create an impact on your viewers.
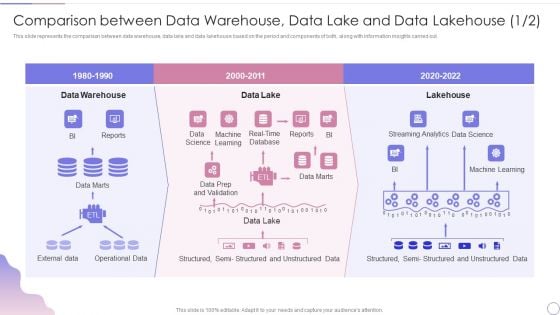
Data Lake Architecture Future Of Data Analysis Comparison Between Data Warehouse Diagrams PDF
This slide represents the comparison between data warehouse, data lake and data lakehouse based on the period and components of both, along with information insights carried out.Deliver and pitch your topic in the best possible manner with this Data Lake Architecture Future Of Data Analysis Comparison Between Data Warehouse Diagrams PDF. Use them to share invaluable insights on Data Warehouse, Unstructured Data, Streaming Analytics and impress your audience. This template can be altered and modified as per your expectations. So, grab it now.
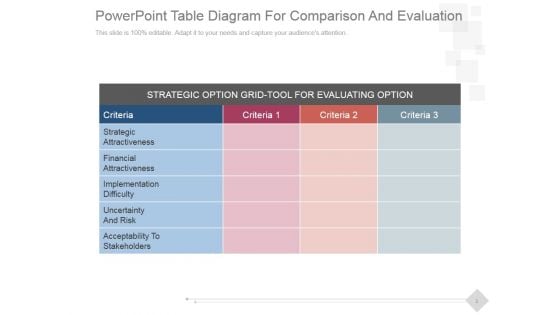
PowerPoint Table Diagram For Comparison And Evaluation Ppt PowerPoint Presentation Microsoft
This is a powerpoint table diagram for comparison and evaluation ppt powerpoint presentation microsoft. This is a three stage process. The stages in this process are financial, attractiveness, strategic, implementation, difficulty.
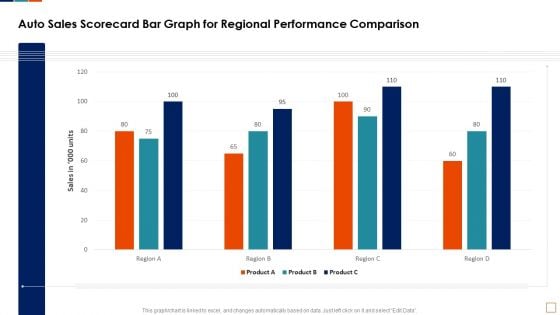
Auto Sales Scorecard Bar Graph For Regional Performance Comparison Infographics PDF
This graph or chart is linked to excel, and changes automatically based on data. Just left click on it and select Edit Data. Deliver an awe inspiring pitch with this creative Auto Sales Scorecard Bar Graph For Regional Performance Comparison Infographics PDF bundle. Topics like Auto Sales Scorecard, Bar Graph Regional, Performance Comparison Product can be discussed with this completely editable template. It is available for immediate download depending on the needs and requirements of the user.


 Continue with Email

 Home
Home


