Comparison Icon
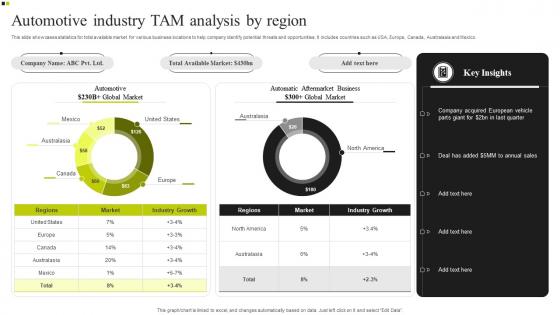
Automotive Industry Tam Analysis By Region Download Pdf
This slide showcases statistics for total available market for various business locations to help company identify potential threats and opportunities. It includes countries such as USA, Europe, Canada, Australasia and Mexico. Pitch your topic with ease and precision using this Automotive Industry Tam Analysis By Region Download Pdf. This layout presents information on Total Available Market, Business Locations, Threats And Opportunities, Automotive Industry. It is also available for immediate download and adjustment. So, changes can be made in the color, design, graphics or any other component to create a unique layout. This slide showcases statistics for total available market for various business locations to help company identify potential threats and opportunities. It includes countries such as USA, Europe, Canada, Australasia and Mexico.
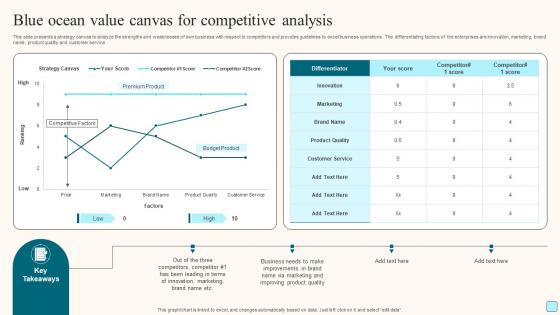
Blue Ocean Value Canvas For Competitive Analysis Mockup Pdf
This slide presents a strategy canvas to analyze the strengths and weaknesses of own business with respect to competitors and provides guidelines to excel business operations. The differentiating factors of the enterprises are innovation, marketing, brand name, product quality and customer service. Pitch your topic with ease and precision using this Blue Ocean Value Canvas For Competitive Analysis Mockup Pdf. This layout presents information on Blue Ocean Value Canvas, Competitive Analysis, Product Quality. It is also available for immediate download and adjustment. So, changes can be made in the color, design, graphics or any other component to create a unique layout. This slide presents a strategy canvas to analyze the strengths and weaknesses of own business with respect to competitors and provides guidelines to excel business operations. The differentiating factors of the enterprises are innovation, marketing, brand name, product quality and customer service.
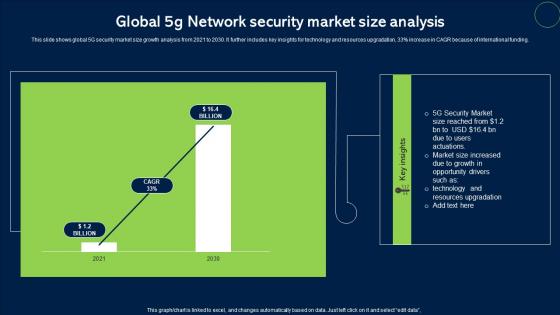
Global 5G Network Security Market Size Analysis Topics Pdf
This slide shows global 5G security market size growth analysis from 2021 to 2030. It further includes key insights for technology and resources upgradation, 33percent increase in CAGR because of international funding. Pitch your topic with ease and precision using this Global 5G Network Security Market Size Analysis Topics Pdf. This layout presents information on Network Security, Market Size. It is also available for immediate download and adjustment. So, changes can be made in the color, design, graphics or any other component to create a unique layout. This slide shows global 5G security market size growth analysis from 2021 to 2030. It further includes key insights for technology and resources upgradation, 33percent increase in CAGR because of international funding.
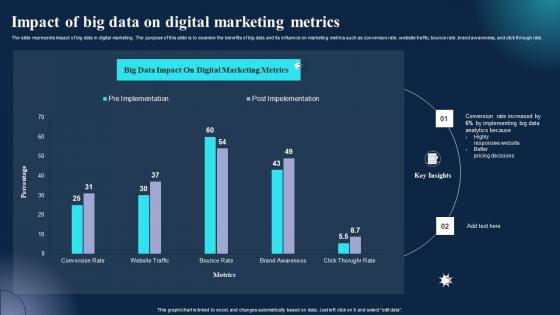
Impact Of Big Data On Digital Marketing Metrics Information Pdf
The slide represents impact of big data in digital marketing. The purpose of this slide is to examine the benefits of big data and its influence on marketing metrics such as conversion rate, website traffic, bounce rate, brand awareness, and click through rate. Pitch your topic with ease and precision using this Impact Of Big Data On Digital Marketing Metrics Information Pdf. This layout presents information on Marketing Metrics, Pricing Decisions, Impact. It is also available for immediate download and adjustment. So, changes can be made in the color, design, graphics or any other component to create a unique layout. The slide represents impact of big data in digital marketing. The purpose of this slide is to examine the benefits of big data and its influence on marketing metrics such as conversion rate, website traffic, bounce rate, brand awareness, and click through rate.
Cost Control Plan Performance Dashboard Pictures Pdf
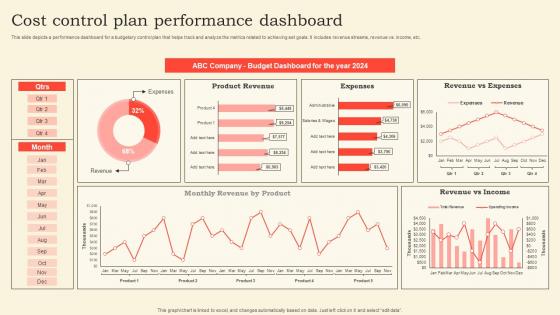
This slide depicts a performance dashboard for a budgetary control plan that helps track and analyze the metrics related to achieving set goals. It includes revenue streams, revenue vs. income, etc. Pitch your topic with ease and precision using this Cost Control Plan Performance Dashboard Pictures Pdf. This layout presents information on Dashboard, Expenses, Income. It is also available for immediate download and adjustment. So, changes can be made in the color, design, graphics or any other component to create a unique layout. This slide depicts a performance dashboard for a budgetary control plan that helps track and analyze the metrics related to achieving set goals. It includes revenue streams, revenue vs. income, etc.
Devices Used To Open Email Marketing Stats Data Brochure Pdf
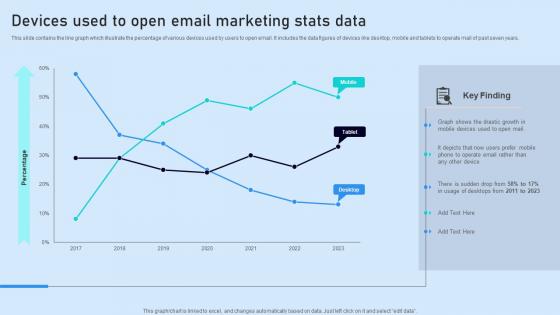
This slide contains the line graph which illustrate the percentage of various devices used by users to open email. It includes the data figures of devices like desktop, mobile and tablets to operate mail of past seven years. Pitch your topic with ease and precision using this Devices Used To Open Email Marketing Stats Data Brochure Pdf. This layout presents information on Key Finding, Stats Data, Devices. It is also available for immediate download and adjustment. So, changes can be made in the color, design, graphics or any other component to create a unique layout. This slide contains the line graph which illustrate the percentage of various devices used by users to open email. It includes the data figures of devices like desktop, mobile and tablets to operate mail of past seven years.
Statistical Data Of Email Sent And Received Annually Pictures Pdf
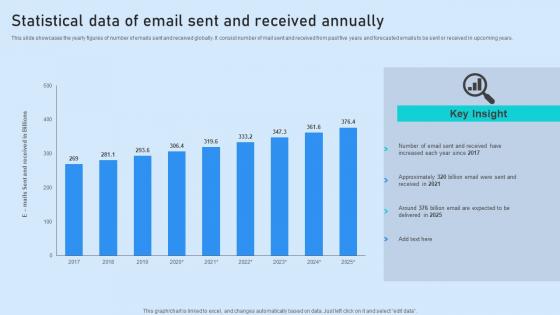
This slide showcases the yearly figures of number of emails sent and received globally. It consist number of mail sent and received from past five years and forecasted emails to be sent or received in upcoming years. Pitch your topic with ease and precision using this Statistical Data Of Email Sent And Received Annually Pictures Pdf. This layout presents information on Key Insight, Annually, Statistical. It is also available for immediate download and adjustment. So, changes can be made in the color, design, graphics or any other component to create a unique layout. This slide showcases the yearly figures of number of emails sent and received globally. It consist number of mail sent and received from past five years and forecasted emails to be sent or received in upcoming years.
Mass Media Marketing Communication Budget Strategy Microsoft Pdf
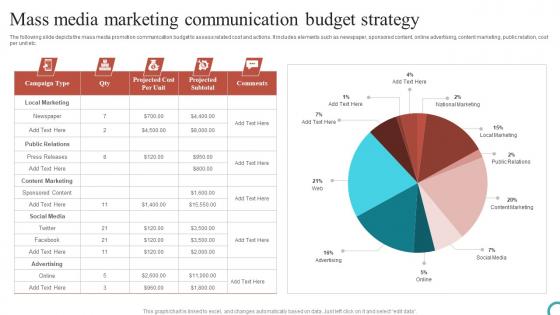
The following slide depicts the mass media promotion communication budget to assess related cost and actions. It includes elements such as newspaper, sponsored content, online advertising, content marketing, public relation, cost per unit etc. Pitch your topic with ease and precision using this Mass Media Marketing Communication Budget Strategy Microsoft Pdf. This layout presents information on Budget Strategy, Mass, Marketing. It is also available for immediate download and adjustment. So, changes can be made in the color, design, graphics or any other component to create a unique layout. The following slide depicts the mass media promotion communication budget to assess related cost and actions. It includes elements such as newspaper, sponsored content, online advertising, content marketing, public relation, cost per unit etc.
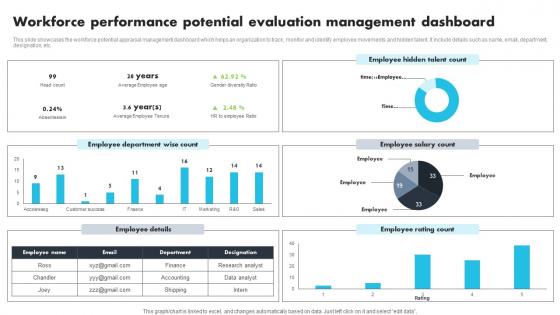
Workforce Performance Potential Evaluation Management Dashboard Clipart Pdf
This slide showcases the workforce potential appraisal management dashboard which helps an organization to track, monitor and identify employee movements and hidden talent. It include details such as name, email, department, designation, etc. Pitch your topic with ease and precision using this Workforce Performance Potential Evaluation Management Dashboard Clipart Pdf. This layout presents information on Employee Department, Employee Salary Count. It is also available for immediate download and adjustment. So, changes can be made in the color, design, graphics or any other component to create a unique layout. This slide showcases the workforce potential appraisal management dashboard which helps an organization to track, monitor and identify employee movements and hidden talent. It include details such as name, email, department, designation, etc.
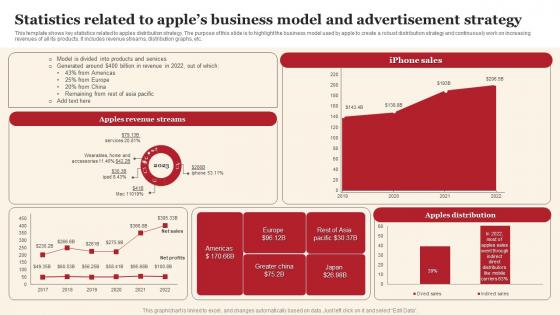
Statistics Related To Apples Business Model And Advertisement Strategy Introduction Pdf
This template shows key statistics related to apples distribution strategy. The purpose of this slide is to highlight the business model used by apple to create a robust distribution strategy and continuously work on increasing revenues of all its products. It includes revenue streams, distribution graphs, etc. Pitch your topic with ease and precision using this Statistics Related To Apples Business Model And Advertisement Strategy Introduction Pdf This layout presents information on Apples Revenue Streams, Iphone Sales, Apples Distribution It is also available for immediate download and adjustment. So, changes can be made in the color, design, graphics or any other component to create a unique layout. This template shows key statistics related to apples distribution strategy. The purpose of this slide is to highlight the business model used by apple to create a robust distribution strategy and continuously work on increasing revenues of all its products. It includes revenue streams, distribution graphs, etc.
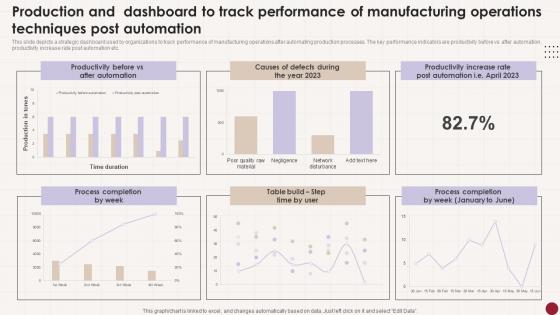
Production And Dashboard To Track Performance Of Manufacturing Operations Techniques Post Automation Tips Pdf
This slide depicts a strategic dashboard used by organizations to track performance of manufacturing operations after automating production processes. The key performance indicators are productivity before vs after automation, productivity increase rate post automation etc. Pitch your topic with ease and precision using this Production And Dashboard To Track Performance Of Manufacturing Operations Techniques Post Automation Tips Pdf This layout presents information on Productivity Before, After Automation, Process Completion It is also available for immediate download and adjustment. So, changes can be made in the color, design, graphics or any other component to create a unique layout. This slide depicts a strategic dashboard used by organizations to track performance of manufacturing operations after automating production processes. The key performance indicators are productivity before vs after automation, productivity increase rate post automation etc.
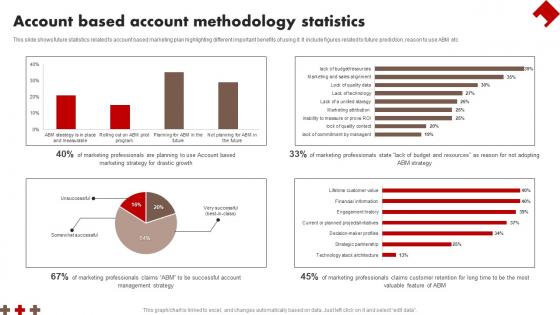
Account Based Account Methodology Statistics Demonstration Pdf
This slide shows future statistics related to account based marketing plan highlighting different important benefits of using it. It include figures related to future prediction, reason to use ABM etc Pitch your topic with ease and precision using this Account Based Account Methodology Statistics Demonstration Pdf This layout presents information on Account Based Account, Methodology Statistics It is also available for immediate download and adjustment. So, changes can be made in the color, design, graphics or any other component to create a unique layout. This slide shows future statistics related to account based marketing plan highlighting different important benefits of using it. It include figures related to future prediction, reason to use ABM etc
Yearly Revenue Forecasting From Startup Businesses Sales Graphics Pdf
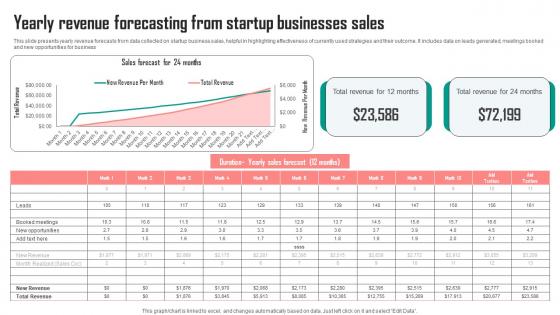
This slide presents yearly revenue forecasts from data collected on startup business sales, helpful in highlighting effectiveness of currently used strategies and their outcome. It includes data on leads generated, meetings booked and new opportunities for business Pitch your topic with ease and precision using this Yearly Revenue Forecasting From Startup Businesses Sales Graphics Pdf. This layout presents information on Sales, Total Revenue, Months. It is also available for immediate download and adjustment. So, changes can be made in the color, design, graphics or any other component to create a unique layout. This slide presents yearly revenue forecasts from data collected on startup business sales, helpful in highlighting effectiveness of currently used strategies and their outcome. It includes data on leads generated, meetings booked and new opportunities for business
Methods For Identifying Customer Challenges With Digital Experience Introduction Pdf
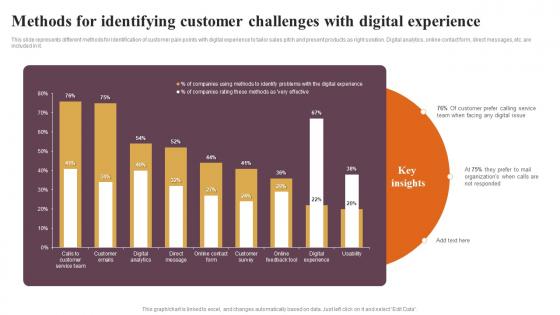
This slide represents different methods for identification of customer pain points with digital experience to tailor sales pitch and present products as right solution. Digital analytics, online contact form, direct messages, etc. are included in it. Pitch your topic with ease and precision using this Methods For Identifying Customer Challenges With Digital Experience Introduction Pdf This layout presents information on Methods For Identifying, Customer Challenges, Digital Experience It is also available for immediate download and adjustment. So, changes can be made in the color, design, graphics or any other component to create a unique layout. This slide represents different methods for identification of customer pain points with digital experience to tailor sales pitch and present products as right solution. Digital analytics, online contact form, direct messages, etc. are included in it.
Apparel Retail Management Sales Dashboard Professional Pdf
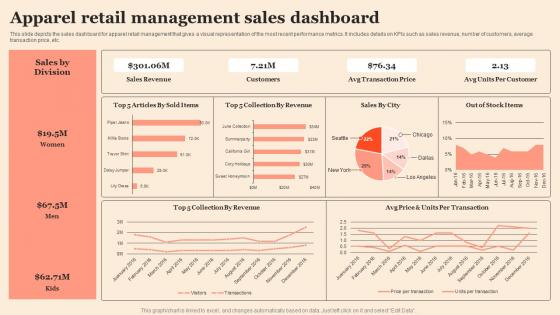
This slide depicts the sales dashboard for apparel retail management that gives a visual representation of the most recent performance metrics. It includes details on KPIs such as sales revenue, number of customers, average transaction price, etc.Pitch your topic with ease and precision using this Apparel Retail Management Sales Dashboard Professional Pdf This layout presents information on Sales Revenue, Transaction Price, Units Per Customer It is also available for immediate download and adjustment. So, changes can be made in the color, design, graphics or any other component to create a unique layout. This slide depicts the sales dashboard for apparel retail management that gives a visual representation of the most recent performance metrics. It includes details on KPIs such as sales revenue, number of customers, average transaction price, etc.
Survey Result Of Various Internal Human Assets Management Techniques Microsoft Pdf
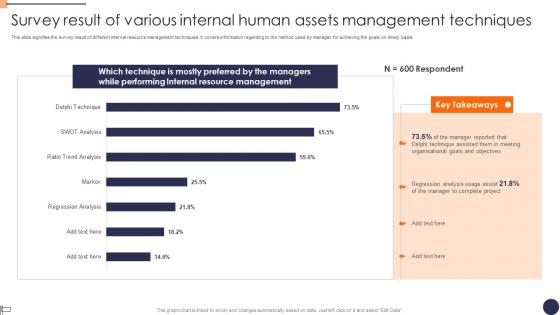
This slide signifies the survey result of different internal resource management techniques. It covers information regarding to the method used by manager for achieving the goals on timely basis. Pitch your topic with ease and precision using this Survey Result Of Various Internal Human Assets Management Techniques Microsoft Pdf. This layout presents information on Regression Analysis, Goals And Objectives, Delphi Technique. It is also available for immediate download and adjustment. So, changes can be made in the color, design, graphics or any other component to create a unique layout. This slide signifies the survey result of different internal resource management techniques. It covers information regarding to the method used by manager for achieving the goals on timely basis.
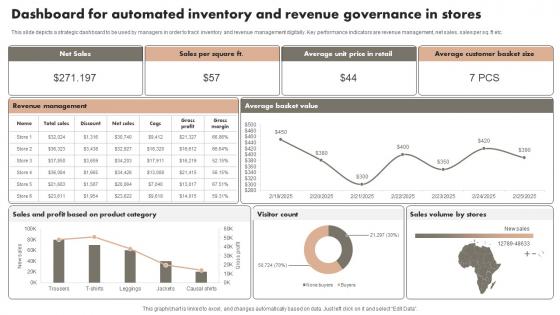
Dashboard For Automated Inventory And Revenue Governance In Stores Microsoft Pdf
This slide depicts a strategic dashboard to be used by managers in order to track inventory and revenue management digitally. Key performance indicators are revenue management, net sales, sales per sq. ft etc. Pitch your topic with ease and precision using this Dashboard For Automated Inventory And Revenue Governance In Stores Microsoft Pdf. This layout presents information on Net Sales, Stores, Category. It is also available for immediate download and adjustment. So, changes can be made in the color, design, graphics or any other component to create a unique layout. This slide depicts a strategic dashboard to be used by managers in order to track inventory and revenue management digitally. Key performance indicators are revenue management, net sales, sales per sq. ft etc.
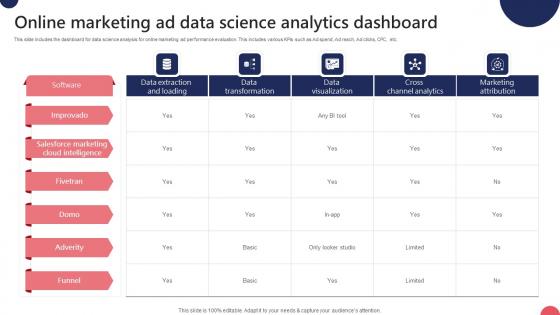
Online Marketing Ad Data Science Analytics Dashboard Ppt Inspiration Guidelines Pdf
This slide includes the dashboard for data science analysis for online marketing ad performance evaluation. This includes various KPIs such as Ad spend, Ad reach, Ad clicks, CPC, etc. Pitch your topic with ease and precision using this Online Marketing Ad Data Science Analytics Dashboard Ppt Inspiration Guidelines Pdf. This layout presents information on Ad Spend, Cost Per Thousand, Cost Per Click. It is also available for immediate download and adjustment. So, changes can be made in the color, design, graphics or any other component to create a unique layout. This slide includes the dashboard for data science analysis for online marketing ad performance evaluation. This includes various KPIs such as Ad spend, Ad reach, Ad clicks, CPC, etc.
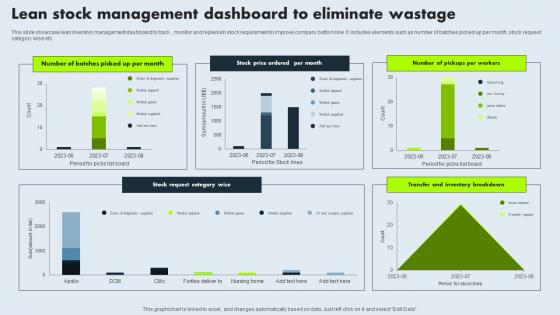
Lean Stock Management Dashboard To Eliminate Wastage Mockup Pdf
This slide showcase lean inventory management dashboard to track , monitor and replenish stock requirement to improve company bottom line. It includes elements such as number of batches picked up per month, stock request category wise etc. Pitch your topic with ease and precision using this Lean Stock Management Dashboard To Eliminate Wastage Mockup Pdf. This layout presents information on Lean Stock, Management Dashboard, Eliminate Wastage, Stock Request Category. It is also available for immediate download and adjustment. So, changes can be made in the color, design, graphics or any other component to create a unique layout. This slide showcase lean inventory management dashboard to track , monitor and replenish stock requirement to improve company bottom line. It includes elements such as number of batches picked up per month, stock request category wise etc.
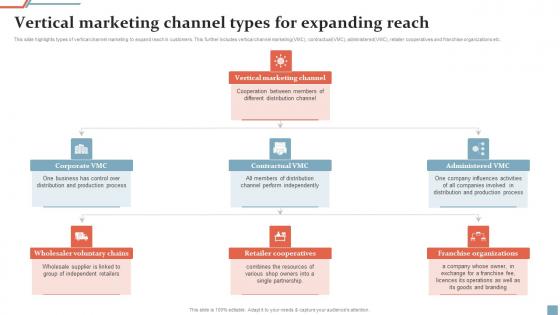
Vertical Marketing Channel Types For Expanding Reach Ppt Ideas Examples Pdf
This slide highlights types of vertical channel marketing to expand reach in customers. This further includes vertical channel marketing VMC, contractual VMC, administered VMC, retailer cooperatives and franchise organizations etc. Pitch your topic with ease and precision using this Vertical Marketing Channel Types For Expanding Reach Ppt Ideas Examples Pdf. This layout presents information on Vertical Marketing Channel, Contractual VMC, Administered VMC. It is also available for immediate download and adjustment. So, changes can be made in the color, design, graphics or any other component to create a unique layout. This slide highlights types of vertical channel marketing to expand reach in customers. This further includes vertical channel marketing VMC, contractual VMC, administered VMC, retailer cooperatives and franchise organizations etc.
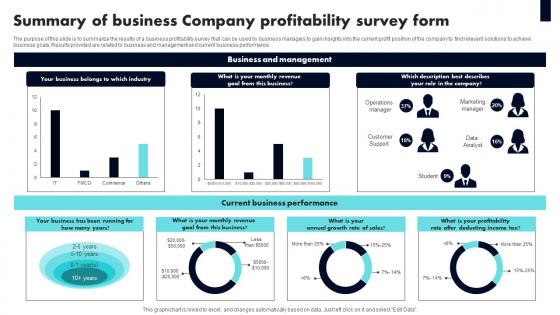
Summary Of Business Company Profitability Survey Form Survey Ss
The purpose of this slide is to summarize the results of a business profitability survey that can be used by business managers to gain insights into the current profit position of the company to find relevant solutions to achieve business goals. Results provided are related to business and management and current business performance Pitch your topic with ease and precision using this Summary Of Business Company Profitability Survey Form Survey Ss This layout presents information on Business Belongs, Revenue, Company It is also available for immediate download and adjustment. So, changes can be made in the color, design, graphics or any other component to create a unique layout. The purpose of this slide is to summarize the results of a business profitability survey that can be used by business managers to gain insights into the current profit position of the company to find relevant solutions to achieve business goals. Results provided are related to business and management and current business performance
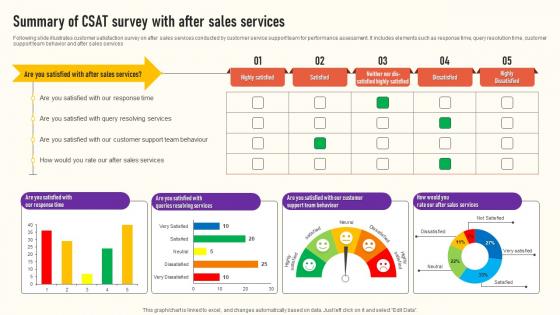
Summary Of CSAT Survey With After Sales Services Survey Ss
Following slide illustrates customer satisfaction survey on after sales services conducted by customer service support team for performance assessment. It includes elements such as response time, query resolution time, customer support team behavior and after sales services Pitch your topic with ease and precision using this Summary Of CSAT Survey With After Sales Services Survey Ss This layout presents information on Highly Satisfied, Dissatisfied, Highly Dissatisfied It is also available for immediate download and adjustment. So, changes can be made in the color, design, graphics or any other component to create a unique layout. Following slide illustrates customer satisfaction survey on after sales services conducted by customer service support team for performance assessment. It includes elements such as response time, query resolution time, customer support team behavior and after sales services
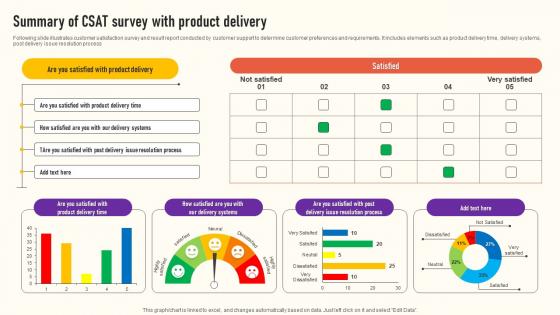
Summary Of CSAT Survey With Product Delivery Survey Ss
Following slide illustrates customer satisfaction survey and result report conducted by customer support to determine customer preferences and requirements. It includes elements such as product delivery time, delivery systems, post delivery issue resolution process Pitch your topic with ease and precision using this Summary Of CSAT Survey With Product Delivery Survey Ss This layout presents information on Delivery Systems, Resolution Process, Satisfied It is also available for immediate download and adjustment. So, changes can be made in the color, design, graphics or any other component to create a unique layout. Following slide illustrates customer satisfaction survey and result report conducted by customer support to determine customer preferences and requirements. It includes elements such as product delivery time, delivery systems, post delivery issue resolution process
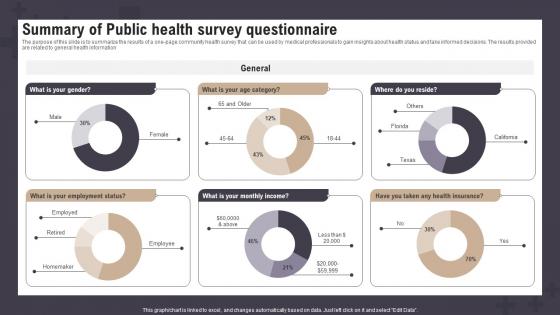
Summary Of Public Health Survey Questionnaire Survey Ss
The purpose of this slide is to summarize the results of a one-page community health survey that can be used by medical professionals to gain insights about health status and take informed decisions. The results provided are related to general health information Pitch your topic with ease and precision using this Summary Of Public Health Survey Questionnaire Survey Ss This layout presents information on Age Category, Health Insurance, Survey Questionnaire It is also available for immediate download and adjustment. So, changes can be made in the color, design, graphics or any other component to create a unique layout. The purpose of this slide is to summarize the results of a one-page community health survey that can be used by medical professionals to gain insights about health status and take informed decisions. The results provided are related to general health information
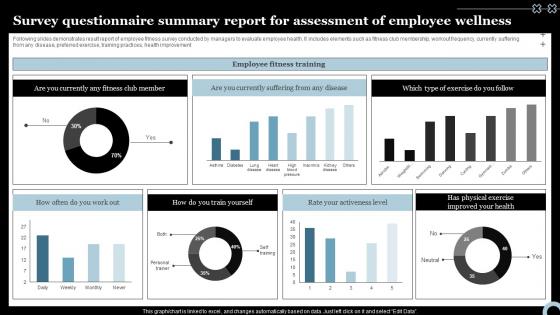
Survey Questionnaire Summary Report For Assessment Of Employee Wellness Survey Ss
Following slides demonstrates result report of employee fitness survey conducted by managers to evaluate employee health. It includes elements such as fitness club membership, workout frequency, currently suffering from any disease, preferred exercise, training practices, health improvement Pitch your topic with ease and precision using this Survey Questionnaire Summary Report For Assessment Of Employee Wellness Survey Ss This layout presents information on Currently Any Fitness, Physical Exercise, Survey Questionnaire It is also available for immediate download and adjustment. So, changes can be made in the color, design, graphics or any other component to create a unique layout. Following slides demonstrates result report of employee fitness survey conducted by managers to evaluate employee health. It includes elements such as fitness club membership, workout frequency, currently suffering from any disease, preferred exercise, training practices, health improvement
Tracking Working Of Employees In Software Companies Summary Pdf
Following slide shows tracking employees hours worked in software companies which assist in to check productivity of employee on daily basis. It includes various KPI such as email received, actual response , average working hours, etc. Pitch your topic with ease and precision using this Tracking Working Of Employees In Software Companies Summary Pdf This layout presents information on Tracking Traffic, Tracking Working, Software Companies It is also available for immediate download and adjustment. So, changes can be made in the color, design, graphics or any other component to create a unique layout. Following slide shows tracking employees hours worked in software companies which assist in to check productivity of employee on daily basis. It includes various KPI such as email received, actual response , average working hours, etc.
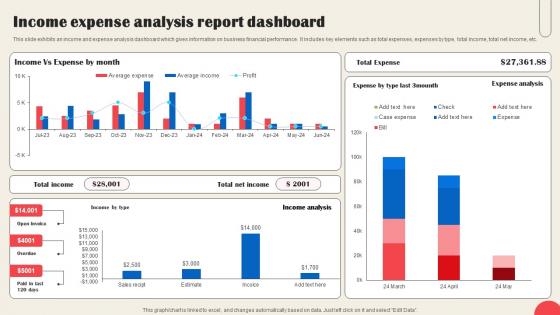
Income Expense Analysis Report Dashboard Sample Pdf
This slide exhibits an income and expense analysis dashboard which gives information on business financial performance. It includes key elements such as total expenses, expenses by type, total income, total net income, etc. Pitch your topic with ease and precision using this Income Expense Analysis Report Dashboard Sample Pdf This layout presents information on Income Expense, Analysis Report Dashboard It is also available for immediate download and adjustment. So, changes can be made in the color, design, graphics or any other component to create a unique layout. This slide exhibits an income and expense analysis dashboard which gives information on business financial performance. It includes key elements such as total expenses, expenses by type, total income, total net income, etc.
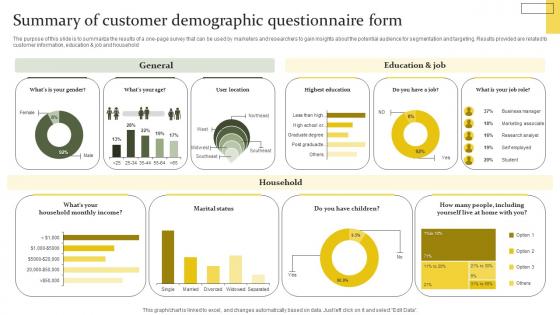
Summary Of Customer Demographic Questionnaire Form Microsoft Pdf
The purpose of this slide is to summarize the results of a one-page survey that can be used by marketers and researchers to gain insights about the potential audience for segmentation and targeting. Results provided are related to customer information, education and job and household Pitch your topic with ease and precision using this Summary Of Customer Demographic Questionnaire Form Microsoft Pdf This layout presents information on Household, Education And Job, General It is also available for immediate download and adjustment. So, changes can be made in the color, design, graphics or any other component to create a unique layout. The purpose of this slide is to summarize the results of a one-page survey that can be used by marketers and researchers to gain insights about the potential audience for segmentation and targeting. Results provided are related to customer information, education and job and household
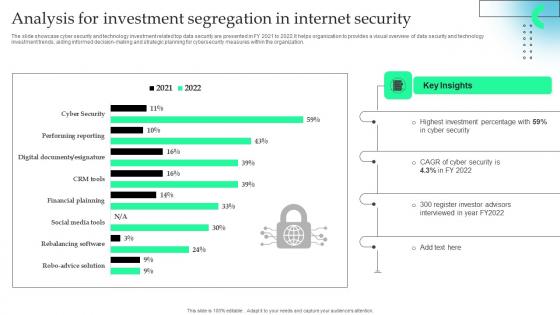
Analysis For Investment Segregation In Internet Security Formats Pdf
The slide showcase cyber security and technology investment related top data security are presented in FY 2021 to 2022.It helps organization to provides a visual overview of data security and technology investment trends, aiding informed decision making and strategic planning for cybersecurity measures within the organization.Pitch your topic with ease and precision using this Analysis For Investment Segregation In Internet Security Formats Pdf This layout presents information on Highest Investment, Register Investor Advisors, Key Insights It is also available for immediate download and adjustment. So, changes can be made in the color, design, graphics or any other component to create a unique layout. The slide showcase cyber security and technology investment related top data security are presented in FY 2021 to 2022.It helps organization to provides a visual overview of data security and technology investment trends, aiding informed decision making and strategic planning for cybersecurity measures within the organization.
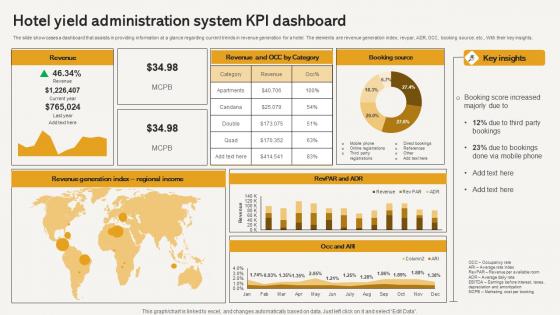
Hotel Yield Administration System Kpi Dashboard Elements Pdf
The slide showcases a dashboard that assists in providing information at a glance regarding current trends in revenue generation for a hotel. The elements are revenue generation index, revpar, ADR, OCC, booking source, etc., With their key insights. Pitch your topic with ease and precision using this Hotel Yield Administration System Kpi Dashboard Elements Pdf This layout presents information on Revenue, Booking Source, Regional Income, Key Insights It is also available for immediate download and adjustment. So, changes can be made in the color, design, graphics or any other component to create a unique layout. The slide showcases a dashboard that assists in providing information at a glance regarding current trends in revenue generation for a hotel. The elements are revenue generation index, revpar, ADR, OCC, booking source, etc., With their key insights.
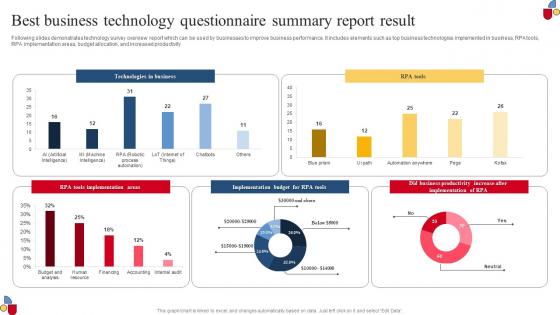
Best Business Technology Questionnaire Summary Report Result Summary Pdf
Following slides demonstrates technology survey overview report which can be used by businesses to improve business performance. It includes elements such as top business technologies implemented in business, RPA tools, RPA implementation areas, budget allocation, and increased productivity Pitch your topic with ease and precision using this Best Business Technology Questionnaire Summary Report Result Summary Pdf This layout presents information on Technologies In Business, Implementation Areas, Business Productivity It is also available for immediate download and adjustment. So, changes can be made in the color, design, graphics or any other component to create a unique layout. Following slides demonstrates technology survey overview report which can be used by businesses to improve business performance. It includes elements such as top business technologies implemented in business, RPA tools, RPA implementation areas, budget allocation, and increased productivity
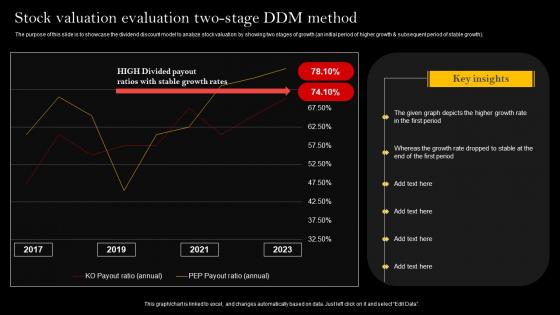
Stock Valuation Evaluation Two Stage DDM Method Sample Pdf
The purpose of this slide is to showcase the dividend discount model to analyze stock valuation by showing two stages of growth an initial period of higher growth and subsequent period of stable growth. Pitch your topic with ease and precision using this Stock Valuation Evaluation Two Stage DDM Method Sample Pdf This layout presents information on Stock Valuation, Evaluation Two Stage, DDM Method It is also available for immediate download and adjustment. So, changes can be made in the color, design, graphics or any other component to create a unique layout. The purpose of this slide is to showcase the dividend discount model to analyze stock valuation by showing two stages of growth an initial period of higher growth and subsequent period of stable growth.
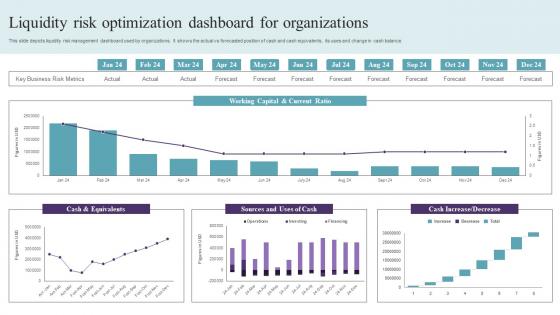
Liquidity Risk Optimization Dashboard For Organizations Graphics Pdf
This slide depicts liquidity risk management dashboard used by organizations. It shows the actual vs forecasted position of cash and cash equivalents, its uses and change in cash balance. Pitch your topic with ease and precision using this Liquidity Risk Optimization Dashboard For Organizations Graphics Pdf. This layout presents information on Cash And Equivalents, Working Capital, Current Ratio. It is also available for immediate download and adjustment. So, changes can be made in the color, design, graphics or any other component to create a unique layout. This slide depicts liquidity risk management dashboard used by organizations. It shows the actual vs forecasted position of cash and cash equivalents, its uses and change in cash balance.
Paid Media Advertising Marketing Performance Tracking Dashboard Clipart Pdf
This slide illustrates dashboard measuring performance of paid media advertising aimed at making quicker marketing decisions, boost sales by increasing brand value. It covers performance of key marketing metrics with graphs and data from ads Pitch your topic with ease and precision using this Paid Media Advertising Marketing Performance Tracking Dashboard Clipart Pdf. This layout presents information on Cost, Impressions, Clicks . It is also available for immediate download and adjustment. So, changes can be made in the color, design, graphics or any other component to create a unique layout. This slide illustrates dashboard measuring performance of paid media advertising aimed at making quicker marketing decisions, boost sales by increasing brand value. It covers performance of key marketing metrics with graphs and data from ads
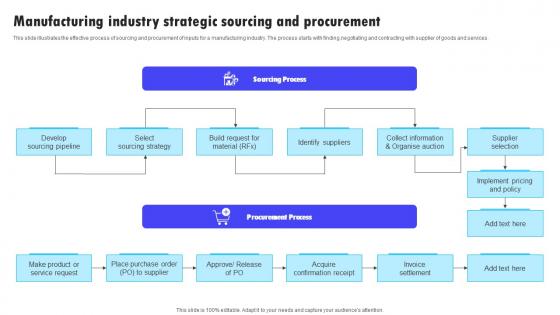
Manufacturing Industry Strategic Sourcing And Procurement Microsoft Pdf
This slide illustrates the effective process of sourcing and procurement of inputs for a manufacturing industry. The process starts with finding,negotiating and contracting with supplier of goods and services. Pitch your topic with ease and precision using this Manufacturing Industry Strategic Sourcing And Procurement Microsoft Pdf. This layout presents information on Sourcing Process, Procurement Process, Invoice Settlement. It is also available for immediate download and adjustment. So, changes can be made in the color, design, graphics or any other component to create a unique layout. This slide illustrates the effective process of sourcing and procurement of inputs for a manufacturing industry. The process starts with finding,negotiating and contracting with supplier of goods and services.
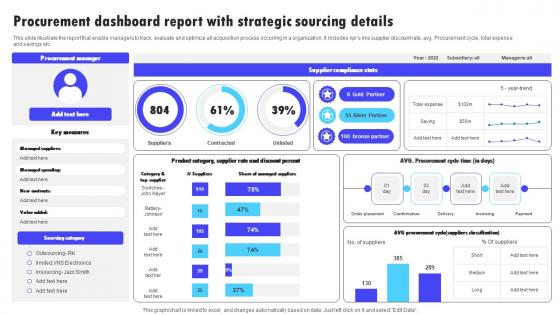
Procurement Dashboard Report With Strategic Sourcing Details Information Pdf
This slide illustrate the report that enable managers to track, evaluate and optimize all acquisition process occurring in a organization. It includes kpis like supplier discount rate, avg. Procurement cycle, total expense and savings etc. Pitch your topic with ease and precision using this Procurement Dashboard Report With Strategic Sourcing Details Information Pdf. This layout presents information on Supplier Compliance Stats, Procurement Manager, Sourcing Category. It is also available for immediate download and adjustment. So, changes can be made in the color, design, graphics or any other component to create a unique layout. This slide illustrate the report that enable managers to track, evaluate and optimize all acquisition process occurring in a organization. It includes kpis like supplier discount rate, avg. Procurement cycle, total expense and savings etc.
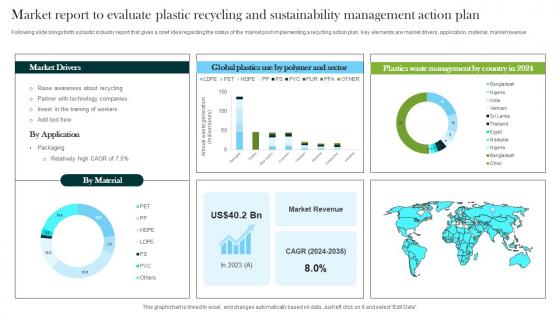
Market Report To Evaluate Plastic Recycling And Sustainability Management Action Plan Information Pdf
Following slide brings forth a plastic industry report that gives a brief idea regarding the status of the market post implementing a recycling action plan. Key elements are market drivers, application, material, market revenue Pitch your topic with ease and precision using this Market Report To Evaluate Plastic Recycling And Sustainability Management Action Plan Information Pdf. This layout presents information on Action Plan, Market, Material. It is also available for immediate download and adjustment. So, changes can be made in the color, design, graphics or any other component to create a unique layout. Following slide brings forth a plastic industry report that gives a brief idea regarding the status of the market post implementing a recycling action plan. Key elements are market drivers, application, material, market revenue
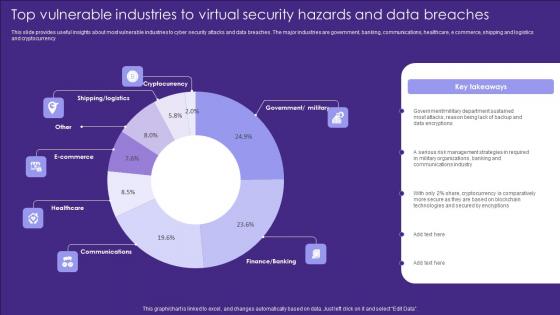
Top Vulnerable Industries To Virtual Security Hazards And Data Breaches Introduction Pdf
This slide provides useful insights about most vulnerable industries to cyber security attacks and data breaches. The major industries are government, banking, communications, healthcare, e commerce, shipping and logistics and cryptocurrency Pitch your topic with ease and precision using this Top Vulnerable Industries To Virtual Security Hazards And Data Breaches Introduction Pdf. This layout presents information on Cryptocurrency, Ecommerce, Healthcare. It is also available for immediate download and adjustment. So, changes can be made in the color, design, graphics or any other component to create a unique layout. This slide provides useful insights about most vulnerable industries to cyber security attacks and data breaches. The major industries are government, banking, communications, healthcare, e commerce, shipping and logistics and cryptocurrency
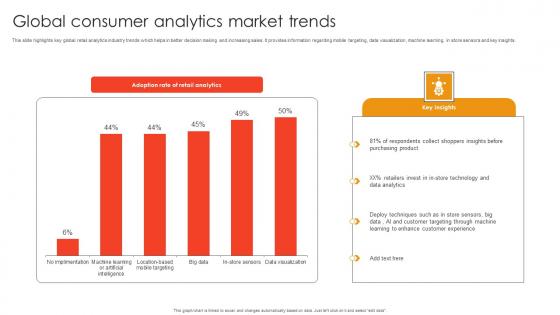
Global Consumer Analytics Market Trends Template Pdf
This slide highlights key global retail analytics industry trends which helps in better decision making and increasing sales. It provides information regarding mobile targeting, data visualization, machine learning, in store sensors and key insights. Pitch your topic with ease and precision using this Global Consumer Analytics Market Trends Template Pdf. This layout presents information on Respondents Collect Shoppers, Retailers Invest Store, Deploy Techniques Store Sensors. It is also available for immediate download and adjustment. So, changes can be made in the color, design, graphics or any other component to create a unique layout. This slide highlights key global retail analytics industry trends which helps in better decision making and increasing sales. It provides information regarding mobile targeting, data visualization, machine learning, in store sensors and key insights.
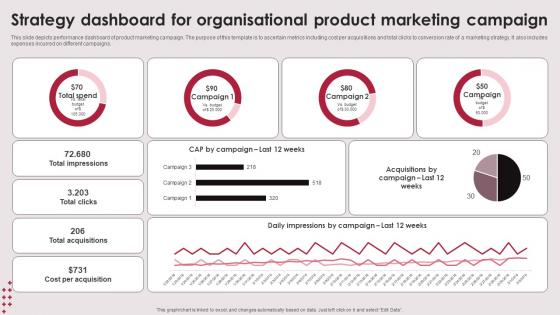
Strategy Dashboard For Organisational Product Marketing Campaign Elements Pdf
This slide depicts performance dashboard of product marketing campaign. The purpose of this template is to ascertain metrics including cost per acquisitions and total clicks to conversion rate of a marketing strategy. It also includes expenses incurred on different campaigns. Pitch your topic with ease and precision using this Strategy Dashboard For Organisational Product Marketing Campaign Elements PDF. This layout presents information on Strategy Dashboard, Organisational Product, Marketing Campaign. It is also available for immediate download and adjustment. So, changes can be made in the color, design, graphics or any other component to create a unique layout. This slide depicts performance dashboard of product marketing campaign. The purpose of this template is to ascertain metrics including cost per acquisitions and total clicks to conversion rate of a marketing strategy. It also includes expenses incurred on different campaigns.
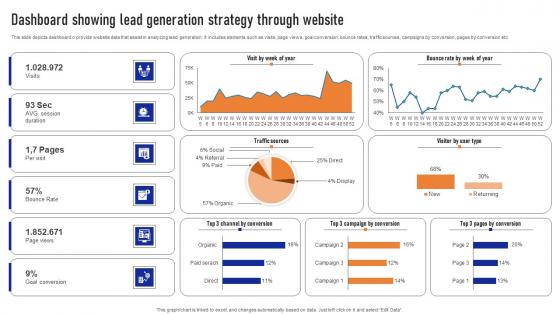
Dashboard Showing Lead Generation Strategy Through Website Ppt Infographic Template Rules Pdf
This slide depicts dashboard o provide website data that assist in analyzing lead generation. It includes elements such as visits, page views, goal conversion, bounce rates, traffic sources, campaigns by conversion, pages by conversion etc. Pitch your topic with ease and precision using this Dashboard Showing Lead Generation Strategy Through Website Ppt Infographic Template Rules Pdf. This layout presents information on Goal Conversion, Bounce Rates, Traffic Sources. It is also available for immediate download and adjustment. So, changes can be made in the color, design, graphics or any other component to create a unique layout. This slide depicts dashboard o provide website data that assist in analyzing lead generation. It includes elements such as visits, page views, goal conversion, bounce rates, traffic sources, campaigns by conversion, pages by conversion etc.
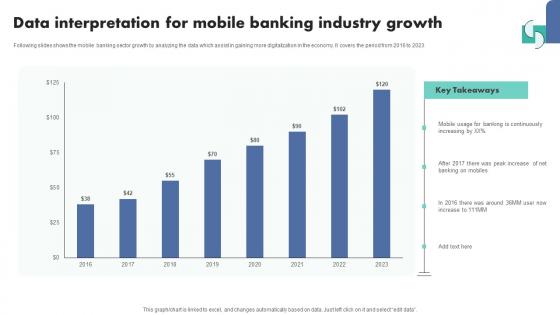
Data Interpretation For Mobile Banking Industry Growth Template Pdf
Following slides shows the mobile banking sector growth by analyzing the data which assist in gaining more digitalization in the economy. It covers the period from 2016 to 2023.Pitch your topic with ease and precision using this Data Interpretation For Mobile Banking Industry Growth Template Pdf This layout presents information on Banking Continuously, Banking Mobiles, Key Takeaways It is also available for immediate download and adjustment. So, changes can be made in the color, design, graphics or any other component to create a unique layout. Following slides shows the mobile banking sector growth by analyzing the data which assist in gaining more digitalization in the economy. It covers the period from 2016 to 2023.
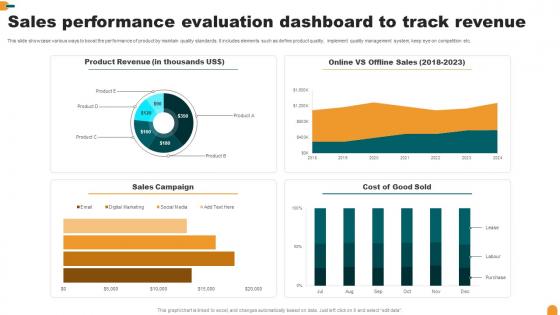
Sales Performance Evaluation Dashboard To Track Revenue Summary Pdf
This slide showcase various ways to boost the performance of product by maintain quality standards. It includes elements such as define product quality, implement quality management system, keep eye on competition etc.Pitch your topic with ease and precision using this Sales Performance Evaluation Dashboard To Track Revenue Summary Pdf This layout presents information on Sales Campaign, Product Revenue, Cost Good Sold It is also available for immediate download and adjustment. So, changes can be made in the color, design, graphics or any other component to create a unique layout. This slide showcase various ways to boost the performance of product by maintain quality standards. It includes elements such as define product quality, implement quality management system, keep eye on competition etc.
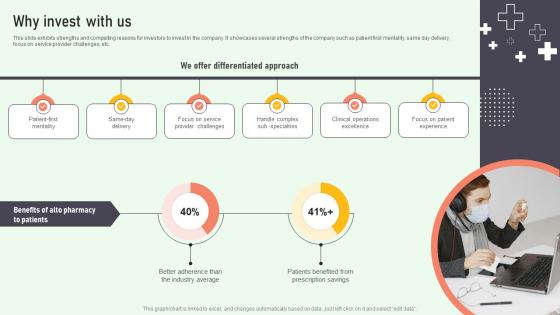
Why Invest With Us Online Medication Management Platform Pitch Deck
This slide exhibits strengths and compelling reasons for investors to invest in the company. It showcases several strengths of the company such as patient first mentality, same day delivery, focus on service provider challenges, etc. This Why Invest With Us Online Medication Management Platform Pitch Deck from Slidegeeks makes it easy to present information on your topic with precision. It provides customization options, so you can make changes to the colors, design, graphics, or any other component to create a unique layout. It is also available for immediate download, so you can begin using it right away. Slidegeeks has done good research to ensure that you have everything you need to make your presentation stand out. Make a name out there for a brilliant performance. This slide exhibits strengths and compelling reasons for investors to invest in the company. It showcases several strengths of the company such as patient first mentality, same day delivery, focus on service provider challenges, etc.
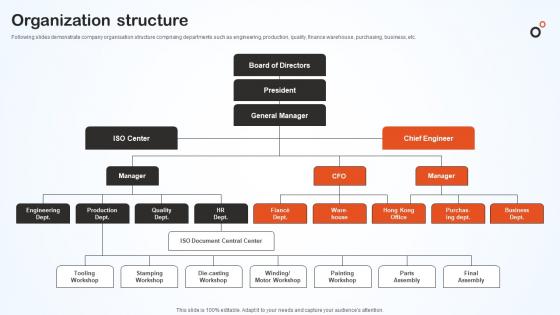
Organization Structure Hero Bike Company Profile CP SS V
Following slides demonstrate company organisation structure comprising departments such as engineering, production, quality, finance warehouse, purchasing, business, etc. This Organization Structure Hero Bike Company Profile CP SS V from Slidegeeks makes it easy to present information on your topic with precision. It provides customization options, so you can make changes to the colors, design, graphics, or any other component to create a unique layout. It is also available for immediate download, so you can begin using it right away. Slidegeeks has done good research to ensure that you have everything you need to make your presentation stand out. Make a name out there for a brilliant performance. Following slides demonstrate company organisation structure comprising departments such as engineering, production, quality, finance warehouse, purchasing, business, etc.
Kpi Dashboard For Tracking Social Media Campaign Results Powerful Marketing Techniques Strategy SS V
This slide covers the dashboard for analyzing social media marketing campaigns. It includes metrics such as tweets, followers, followings, listed favorites, reach, views, Facebook engagement, clicks, likes, Instagram photos, etc. This Kpi Dashboard For Tracking Social Media Campaign Results Powerful Marketing Techniques Strategy SS V from Slidegeeks makes it easy to present information on your topic with precision. It provides customization options, so you can make changes to the colors, design, graphics, or any other component to create a unique layout. It is also available for immediate download, so you can begin using it right away. Slidegeeks has done good research to ensure that you have everything you need to make your presentation stand out. Make a name out there for a brilliant performance. This slide covers the dashboard for analyzing social media marketing campaigns. It includes metrics such as tweets, followers, followings, listed favorites, reach, views, Facebook engagement, clicks, likes, Instagram photos, etc.
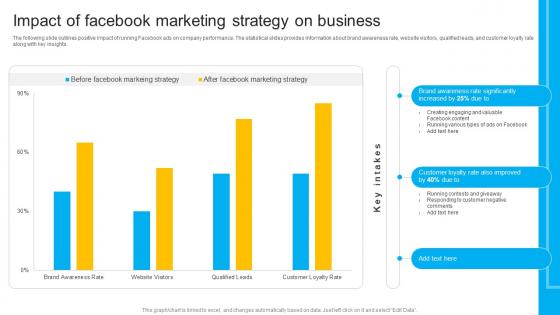
How To Create Cost Effective Impact Of Facebook Marketing Strategy SS V
The following slide outlines positive impact of running Facebook ads on company performance. The statistical slides provides information about brand awareness rate, website visitors, qualified leads, and customer loyalty rate along with key insights. This How To Create Cost Effective Impact Of Facebook Marketing Strategy SS V from Slidegeeks makes it easy to present information on your topic with precision. It provides customization options, so you can make changes to the colors, design, graphics, or any other component to create a unique layout. It is also available for immediate download, so you can begin using it right away. Slidegeeks has done good research to ensure that you have everything you need to make your presentation stand out. Make a name out there for a brilliant performance. The following slide outlines positive impact of running Facebook ads on company performance. The statistical slides provides information about brand awareness rate, website visitors, qualified leads, and customer loyalty rate along with key insights.

Erp Management Dashboard To Optimize Marketing Erp And Digital Transformation For Maximizing DT SS V
This slide present an ERP management dashboard to help monitor the sales and marketing initiatives and boost business performance. It tracks sales overview, visitors, and campaign performance.This Erp Management Dashboard To Optimize Marketing Erp And Digital Transformation For Maximizing DT SS V from Slidegeeks makes it easy to present information on your topic with precision. It provides customization options, so you can make changes to the colors, design, graphics, or any other component to create a unique layout. It is also available for immediate download, so you can begin using it right away. Slidegeeks has done good research to ensure that you have everything you need to make your presentation stand out. Make a name out there for a brilliant performance. This slide present an ERP management dashboard to help monitor the sales and marketing initiatives and boost business performance. It tracks sales overview, visitors, and campaign performance.
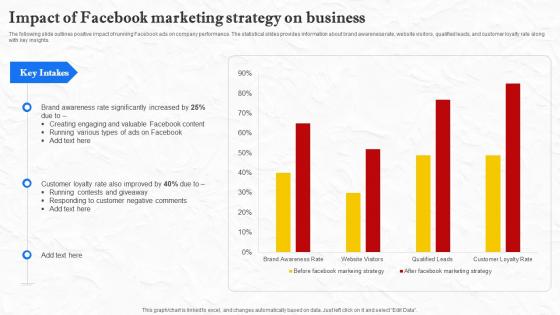
Facebook Marketing Techniques Impact Of Facebook Marketing Strategy On Business Strategy SS V
The following slide outlines positive impact of running Facebook ads on company performance. The statistical slides provides information about brand awareness rate, website visitors, qualified leads, and customer loyalty rate along with key insights. This Facebook Marketing Techniques Impact Of Facebook Marketing Strategy On Business Strategy SS V from Slidegeeks makes it easy to present information on your topic with precision. It provides customization options, so you can make changes to the colors, design, graphics, or any other component to create a unique layout. It is also available for immediate download, so you can begin using it right away. Slidegeeks has done good research to ensure that you have everything you need to make your presentation stand out. Make a name out there for a brilliant performance. The following slide outlines positive impact of running Facebook ads on company performance. The statistical slides provides information about brand awareness rate, website visitors, qualified leads, and customer loyalty rate along with key insights.
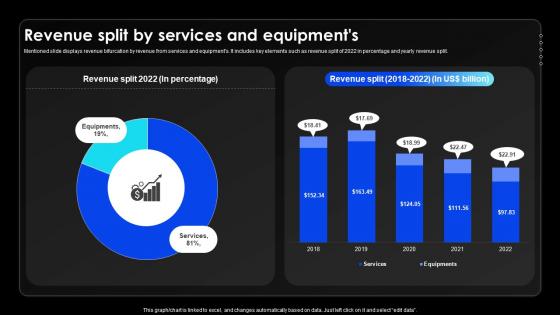
Revenue Split By Services And Equipments Wireless Communication Services Provider Company Profile CP SS V
Mentioned slide displays revenue bifurcation by revenue from services and equipments. It includes key elements such as revenue split of 2022 in percentage and yearly revenue split.This Revenue Split By Services And Equipments Wireless Communication Services Provider Company Profile CP SS V from Slidegeeks makes it easy to present information on your topic with precision. It provides customization options, so you can make changes to the colors, design, graphics, or any other component to create a unique layout. It is also available for immediate download, so you can begin using it right away. Slidegeeks has done good research to ensure that you have everything you need to make your presentation stand out. Make a name out there for a brilliant performance. Mentioned slide displays revenue bifurcation by revenue from services and equipments. It includes key elements such as revenue split of 2022 in percentage and yearly revenue split.

Increasing Business Awareness Introducing Search Engine Optimization Strategy SS V
This slide presents an overview of search engine optimization techniques for enhancing the ranking of websites. It also discusses various SEO techniques, such as keyword research, on-page optimization, link building, and content creation. This Increasing Business Awareness Introducing Search Engine Optimization Strategy SS V from Slidegeeks makes it easy to present information on your topic with precision. It provides customization options, so you can make changes to the colors, design, graphics, or any other component to create a unique layout. It is also available for immediate download, so you can begin using it right away. Slidegeeks has done good research to ensure that you have everything you need to make your presentation stand out. Make a name out there for a brilliant performance. This slide presents an overview of search engine optimization techniques for enhancing the ranking of websites. It also discusses various SEO techniques, such as keyword research, on-page optimization, link building, and content creation.

Smart Home Dashboard For Appliance Monitoring Smart Grid Working
This slide represents the smart home dashboard for monitoring total electricity consumption by rooms and appliances such as lights, microwave heating, room cooling temperature, home security, television and computers. This Smart Home Dashboard For Appliance Monitoring Smart Grid Working from Slidegeeks makes it easy to present information on your topic with precision. It provides customization options, so you can make changes to the colors, design, graphics, or any other component to create a unique layout. It is also available for immediate download, so you can begin using it right away. Slidegeeks has done good research to ensure that you have everything you need to make your presentation stand out. Make a name out there for a brilliant performance. This slide represents the smart home dashboard for monitoring total electricity consumption by rooms and appliances such as lights, microwave heating, room cooling temperature, home security, television and computers.

The Digital Project Managers Project Change Management Kpi Dashboard
This slide represents KPI dashboard to effectively track and monitor effectiveness of changes implemented in organizational projects. It includes details related to KPIs such as changes investigated, submitted, approved, declined, etc. This The Digital Project Managers Project Change Management Kpi Dashboard from Slidegeeks makes it easy to present information on your topic with precision. It provides customization options, so you can make changes to the colors, design, graphics, or any other component to create a unique layout. It is also available for immediate download, so you can begin using it right away. Slidegeeks has done good research to ensure that you have everything you need to make your presentation stand out. Make a name out there for a brilliant performance. This slide represents KPI dashboard to effectively track and monitor effectiveness of changes implemented in organizational projects. It includes details related to KPIs such as changes investigated, submitted, approved, declined, etc.

Unlocking Potential Enhancing Team Management Dashboard To Track Task Completion
This slide depicts dashboard intended to track task completion rate within teams and its management. It includes data about team roles, planned vs actual tasks, task by status, total utilized work hours and task summary. This Unlocking Potential Enhancing Team Management Dashboard To Track Task Completion from Slidegeeks makes it easy to present information on your topic with precision. It provides customization options, so you can make changes to the colors, design, graphics, or any other component to create a unique layout. It is also available for immediate download, so you can begin using it right away. Slidegeeks has done good research to ensure that you have everything you need to make your presentation stand out. Make a name out there for a brilliant performance. This slide depicts dashboard intended to track task completion rate within teams and its management. It includes data about team roles, planned vs actual tasks, task by status, total utilized work hours and task summary.

Introduction Of New Human Resource Management Analysing Hr Data For Effective Decision Making
Following slide showcases the development of a new human resource management process aimed at increasing employee performance. It includes internal recruitment, external recruitment, selection, training, assessing performance, motivating, This Introduction Of New Human Resource Management Analysing Hr Data For Effective Decision Making from Slidegeeks makes it easy to present information on your topic with precision. It provides customization options, so you can make changes to the colors, design, graphics, or any other component to create a unique layout. It is also available for immediate download, so you can begin using it right away. Slidegeeks has done good research to ensure that you have everything you need to make your presentation stand out. Make a name out there for a brilliant performance. Following slide showcases the development of a new human resource management process aimed at increasing employee performance. It includes internal recruitment, external recruitment, selection, training, assessing performance, motivating,
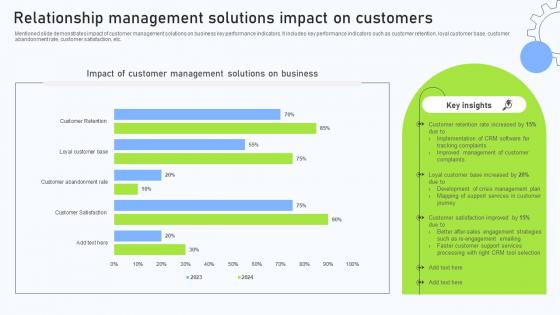
Relationship Management Automation Relationship Management Solutions Impact
Mentioned slide demonstrates impact of customer management solutions on business key performance indicators. It includes key performance indicators such as customer retention, loyal customer base, customer abandonment rate, customer satisfaction, etc. This Relationship Management Automation Relationship Management Solutions Impact from Slidegeeks makes it easy to present information on your topic with precision. It provides customization options, so you can make changes to the colors, design, graphics, or any other component to create a unique layout. It is also available for immediate download, so you can begin using it right away. Slidegeeks has done good research to ensure that you have everything you need to make your presentation stand out. Make a name out there for a brilliant performance. Mentioned slide demonstrates impact of customer management solutions on business key performance indicators. It includes key performance indicators such as customer retention, loyal customer base, customer abandonment rate, customer satisfaction, etc.
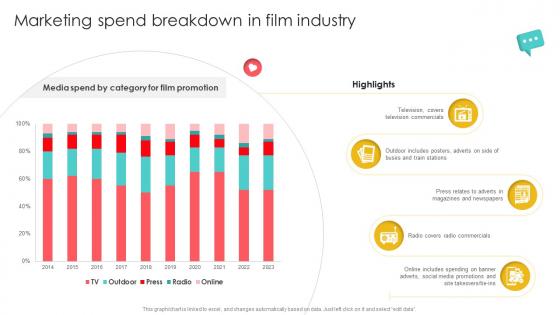
Marketing Channels For Movie Marketing Spend Breakdown In Film Industry Strategy SS V
This Marketing Channels For Movie Marketing Spend Breakdown In Film Industry Strategy SS V from Slidegeeks makes it easy to present information on your topic with precision. It provides customization options, so you can make changes to the colors, design, graphics, or any other component to create a unique layout. It is also available for immediate download, so you can begin using it right away. Slidegeeks has done good research to ensure that you have everything you need to make your presentation stand out. Make a name out there for a brilliant performance. Our Marketing Channels For Movie Marketing Spend Breakdown In Film Industry Strategy SS V are topically designed to provide an attractive backdrop to any subject. Use them to look like a presentation pro.
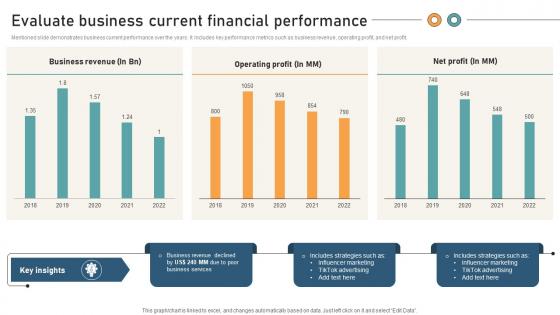
Comprehensive Guide For Website Evaluate Business Current Financial Performance
Mentioned slide demonstrates business current performance over the years. It includes key performance metrics such as business revenue, operating profit, and net profit. This Comprehensive Guide For Website Evaluate Business Current Financial Performance from Slidegeeks makes it easy to present information on your topic with precision. It provides customization options, so you can make changes to the colors, design, graphics, or any other component to create a unique layout. It is also available for immediate download, so you can begin using it right away. Slidegeeks has done good research to ensure that you have everything you need to make your presentation stand out. Make a name out there for a brilliant performance. Mentioned slide demonstrates business current performance over the years. It includes key performance metrics such as business revenue, operating profit, and net profit.
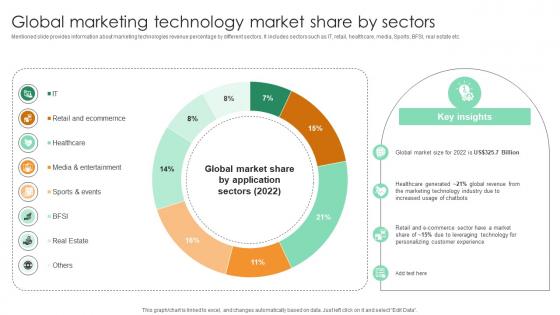
Global Marketing Technology Market Share By Sectors Comprehensive Guide For Marketing Technology
Mentioned slide provides information about marketing technologies revenue percentage by different sectors. It includes sectors such as IT, retail, healthcare, media, Sports, BFSI, real estate etc. This Global Marketing Technology Market Share By Sectors Comprehensive Guide For Marketing Technology from Slidegeeks makes it easy to present information on your topic with precision. It provides customization options, so you can make changes to the colors, design, graphics, or any other component to create a unique layout. It is also available for immediate download, so you can begin using it right away. Slidegeeks has done good research to ensure that you have everything you need to make your presentation stand out. Make a name out there for a brilliant performance. Mentioned slide provides information about marketing technologies revenue percentage by different sectors. It includes sectors such as IT, retail, healthcare, media, Sports, BFSI, real estate etc.
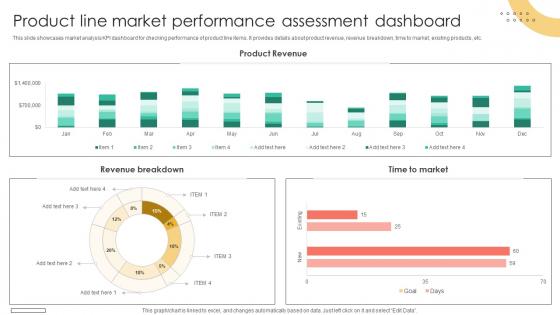
Brand Extension Techniques Product Line Market Performance Assessment Dashboard Strategy SS V
This slide showcases market analysis KPI dashboard for checking performance of product line items. It provides details about product revenue, revenue breakdown, time to market, existing products, etc. This Brand Extension Techniques Product Line Market Performance Assessment Dashboard Strategy SS V from Slidegeeks makes it easy to present information on your topic with precision. It provides customization options, so you can make changes to the colors, design, graphics, or any other component to create a unique layout. It is also available for immediate download, so you can begin using it right away. Slidegeeks has done good research to ensure that you have everything you need to make your presentation stand out. Make a name out there for a brilliant performance. This slide showcases market analysis KPI dashboard for checking performance of product line items. It provides details about product revenue, revenue breakdown, time to market, existing products, etc.


 Continue with Email

 Home
Home


