Comparison Icon
Processor Comparison Chart In Powerpoint And Google Slides Cpb
Introducing our well-designed Processor Comparison Chart In Powerpoint And Google Slides Cpb. This PowerPoint design presents information on topics like Processor Comparison Chart. As it is predesigned it helps boost your confidence level. It also makes you a better presenter because of its high-quality content and graphics. This PPT layout can be downloaded and used in different formats like PDF, PNG, and JPG. Not only this, it is available in both Standard Screen and Widescreen aspect ratios for your convenience. Therefore, click on the download button now to persuade and impress your audience. Our Processor Comparison Chart In Powerpoint And Google Slides Cpb are topically designed to provide an attractive backdrop to any subject. Use them to look like a presentation pro.
Comparison Analysis Of Bounce And Conversion Rate Topics Pdf
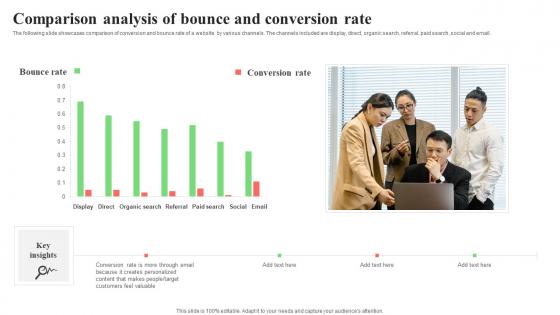
The following slide showcases comparison of conversion and bounce rate of a website by various channels. The channels included are display, direct, organic search, referral, paid search, social and email. Pitch your topic with ease and precision using this Comparison Analysis Of Bounce And Conversion Rate Topics Pdf. This layout presents information on Organic Search, Referral, Paid Search. It is also available for immediate download and adjustment. So, changes can be made in the color, design, graphics or any other component to create a unique layout. The following slide showcases comparison of conversion and bounce rate of a website by various channels. The channels included are display, direct, organic search, referral, paid search, social and email.
Smartwatch Comparison Chart In Powerpoint And Google Slides Cpb
Presenting our innovatively designed set of slides titled Smartwatch Comparison Chart In Powerpoint And Google Slides Cpb. This completely editable PowerPoint graphic exhibits Smartwatch Comparison Chart that will help you convey the message impactfully. It can be accessed with Google Slides and is available in both standard screen and widescreen aspect ratios. Apart from this, you can download this well structured PowerPoint template design in different formats like PDF, JPG, and PNG. So, click the download button now to gain full access to this PPT design. Our Smartwatch Comparison Chart In Powerpoint And Google Slides Cpb are topically designed to provide an attractive backdrop to any subject. Use them to look like a presentation pro.

Before Vs After Two Years Comparison Charts PPT Sample SS
Retrieve professionally designed Before Vs After Two Years Comparison Charts PPT Sample SS to effectively convey your message and captivate your listeners. Save time by selecting pre-made slideshows that are appropriate for various topics, from business to educational purposes. These themes come in many different styles, from creative to corporate, and all of them are easily adjustable and can be edited quickly. Access them as PowerPoint templates or as Google Slides themes. You do not have to go on a hunt for the perfect presentation because Slidegeeks got you covered from everywhere. Our Before Vs After Two Years Comparison Charts PPT Sample SS are topically designed to provide an attractive backdrop to any subject. Use them to look like a presentation pro.
Business Structure Comparison Chart Ppt PowerPoint Presentation Infographic Template Vector
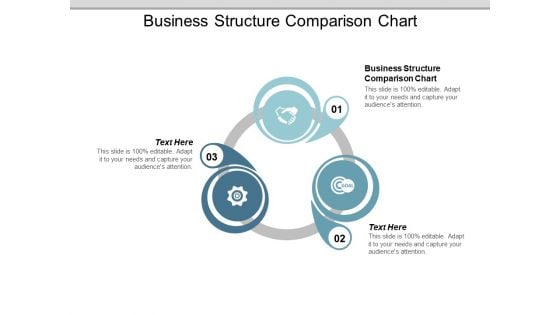
This is a business structure comparison chart ppt powerpoint presentation infographic template vector. This is a three stage process. The stages in this process are business structure comparison chart.
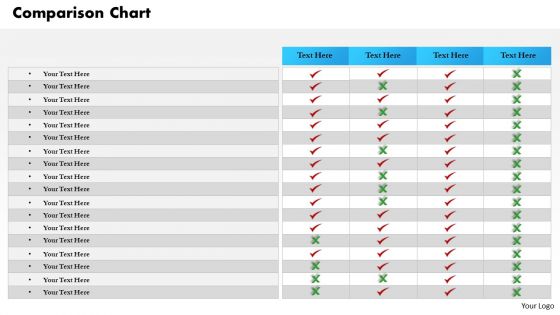
Business Diagram Comparison Of Product Features Strategy Diagram
Be The Doer With Our Business Diagram Comparison Of Product Features Strategy Diagram Powerpoint Templates. Put Your Thoughts Into Practice.
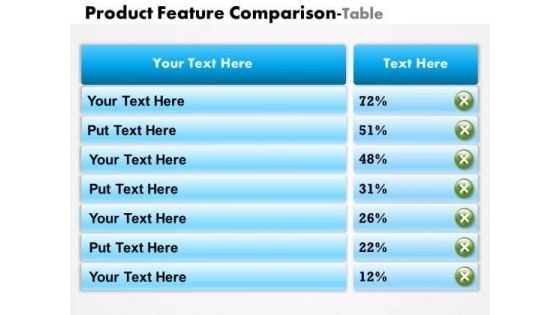
Business Diagram Product Features Comparison Table Consulting Diagram
Get The Doers Into Action. Activate Them With Our Business Diagram Product Features Comparison Table Consulting Diagram Powerpoint Templates.
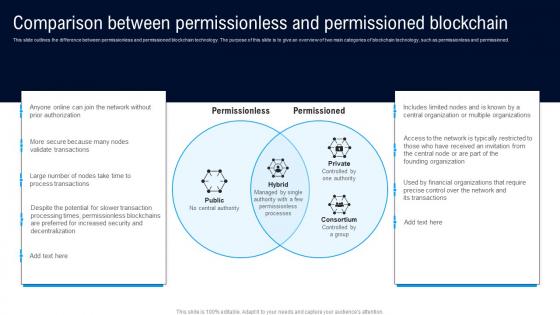
Comparison Between Permissionless Different Architectures Of Blockchain Mockup Pdf
This slide outlines the difference between permissionless and permissioned blockchain technology. The purpose of this slide is to give an overview of two main categories of blockchain technology, such as permissionless and permissioned. Boost your pitch with our creative Comparison Between Permissionless Different Architectures Of Blockchain Mockup Pdf. Deliver an awe inspiring pitch that will mesmerize everyone. Using these presentation templates you will surely catch everyones attention. You can browse the ppts collection on our website. We have researchers who are experts at creating the right content for the templates. So you do not have to invest time in any additional work. Just grab the template now and use them. This slide outlines the difference between permissionless and permissioned blockchain technology. The purpose of this slide is to give an overview of two main categories of blockchain technology, such as permissionless and permissioned.
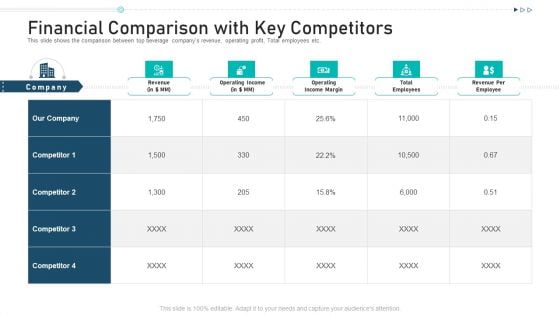
Financial Comparison With Key Competitors Ppt Portfolio Diagrams PDF
This slide shows the comparison between top beverage companys revenue, operating profit, Total employees etc. Deliver an awe inspiring pitch with this creative financial comparison with key competitors ppt portfolio diagrams pdf bundle. Topics like financial comparison with key competitors can be discussed with this completely editable template. It is available for immediate download depending on the needs and requirements of the user.
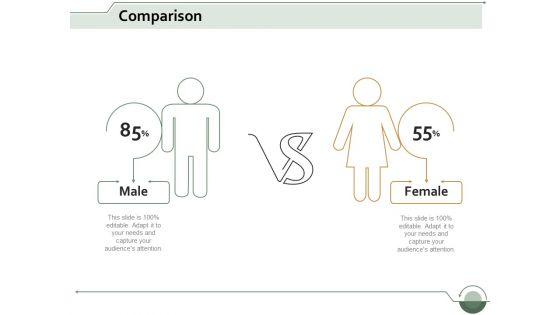
Comparison Marketing Ppt Powerpoint Presentation Visual Aids Diagrams
This is a comparison marketing ppt powerpoint presentation visual aids diagrams. This is a two stage process. The stages in this process are comparison, male, female, marketing, strategy .
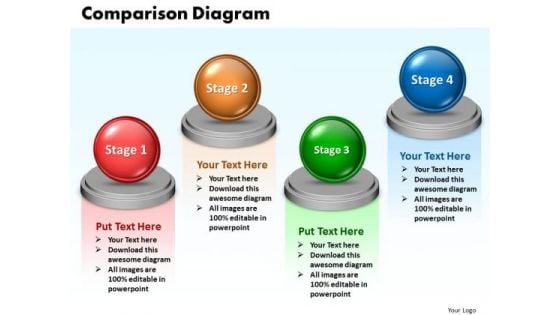
Ppt Comparison Network Diagram PowerPoint Template 4 Phase Templates
PPT comparison network diagram powerpoint template 4 phase Templates-This PowerPoint diagram slide shows four opposing views. You can use the This PowerPoint diagram slide to represent views from different functions on an issue.-PPT comparison network diagram powerpoint template 4 phase Templates-Abstract, Achievement, Business, Chart, Comparison, Concepts, Data, Descriptive, Design, Development, Diagram, Element, Figure, Finance, Financial, Graph, Graphic, Growth, Icon, Ideas, Improvement, Investment, Market, Money, Progress, Raise, Real, Report, Revenue, Sale, Shape, Sign, Silhouette, Stock, Success, Symbol, Technology Reveal the depth of your knowledge. Showcase your erudition on our Ppt Comparison Network Diagram PowerPoint Template 4 Phase Templates.
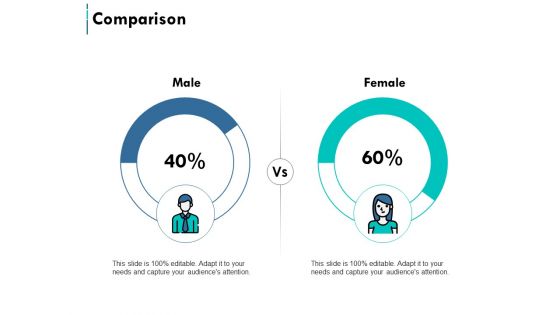
Comparison Male And Female Ppt PowerPoint Presentation Styles Infographic Template
This is a comparison male and female ppt powerpoint presentation styles infographic template. This is a two stage process. The stages in this process are business, management, marketing, comparison.

Comparison Slide Male Female Marketing Ppt PowerPoint Presentation File Slideshow
This is a comparison slide male female marketing ppt powerpoint presentation file slideshow. This is a three stage process. The stages in this process are finance, marketing, management, comparison.
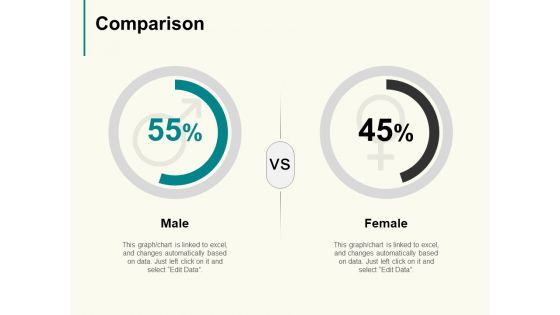
Comparison Male Female Marketing Ppt PowerPoint Presentation Outline Structure
This is a comparison male female marketing ppt powerpoint presentation outline structure. This is a two stage process. The stages in this process are comparison, male, female, marketing, strategy.
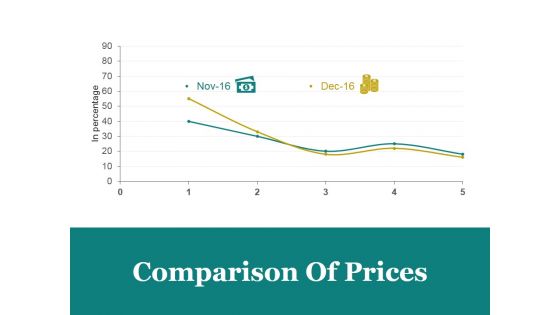
Comparison Of Prices Ppt PowerPoint Presentation Designs Download
This is a comparison of prices ppt powerpoint presentation designs download. This is a two stage process. The stages in this process are comparison of prices, marketing, in percentage, bar graph, business.
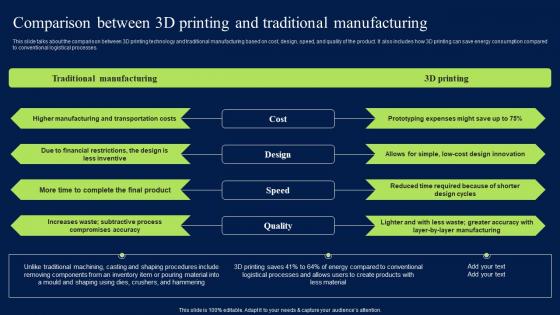
Comparison Between 3D Printing And Traditional Manufacturing Professional PDF
This slide talks about the comparison between 3D printing technology and traditional manufacturing based on cost, design, speed, and quality of the product. It also includes how 3D printing can save energy consumption compared to conventional logistical processes. Are you searching for a Comparison Between 3D Printing And Traditional Manufacturing Professional PDF that is uncluttered, straightforward, and original Its easy to edit, and you can change the colors to suit your personal or business branding. For a presentation that expresses how much effort you have put in, this template is ideal With all of its features, including tables, diagrams, statistics, and lists, its perfect for a business plan presentation. Make your ideas more appealing with these professional slides. Download Comparison Between 3D Printing And Traditional Manufacturing Professional PDF from Slidegeeks today. This slide talks about the comparison between 3D printing technology and traditional manufacturing based on cost, design, speed, and quality of the product. It also includes how 3D printing can save energy consumption compared to conventional logistical processes.
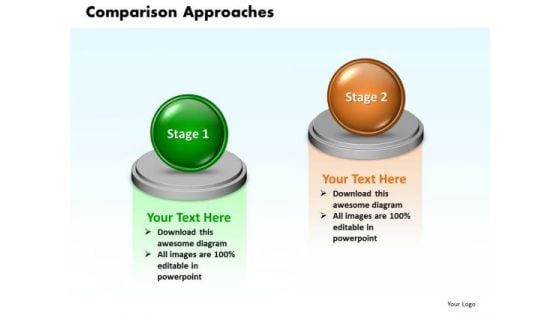
Ppt 3d Animated 2 Circular Approaches Comparison PowerPoint Templates
PPT 3d animated 2 circular approaches comparison PowerPoint Templates-This 3D animated Circular approaches diagram allows presenters to illustrate two approaches.-PPT 3d animated 2 circular approaches comparison PowerPoint Templates-3d, Abstract, Backgrounds, Ball, Business, Choice, Comparison, Concept, Descriptive, Equilibrium, Grow, Illustrations, Instrument, Measurement, Metallic, Part, Partnership, Pattern, Progress, Reflections, Scales, Several, Sphere, Strategy, Success Innovate and succeed with our Ppt 3d Animated 2 Circular Approaches Comparison PowerPoint Templates. Download without worries with our money back guaranteee.
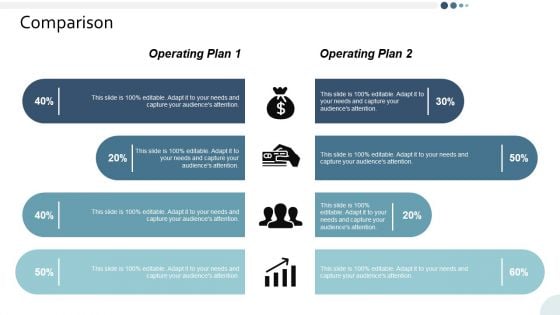
Comparison Yearly Operating Plan Ppt PowerPoint Presentation Professional Model
This is a comparison yearly operating plan ppt powerpoint presentation professional model. This is a two stage process. The stages in this process are business, management, strategy, analysis, icons.
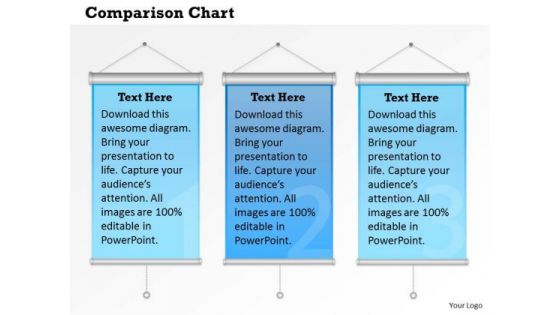
Marketing Diagram Comparison Chart Business Design Business Cycle Diagram
Get Out Of The Dock With Our Marketing Diagram Comparison Chart Business Design Business Cycle Diagram Powerpoint Templates. Your Mind Will Be Set Free.
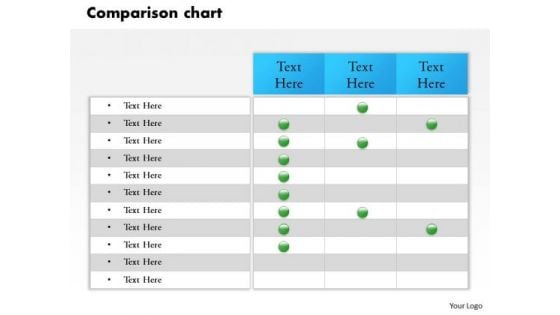
Business Cycle Diagram Product Description And Comparison Chart Sales Diagram
Document Your Views On Our Business Cycle Diagram Product Description And Comparison Chart Sales Diagram Powerpoint Templates. They Will Create A Strong Impression.
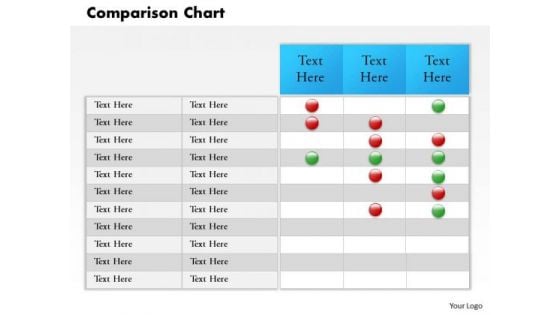
Business Diagram Comparison Chart And Business Report Consulting Diagram
Document The Process On Our Business Diagram Comparison Chart And Business Report Consulting Diagram Powerpoint Templates. Make A Record Of Every Detail.
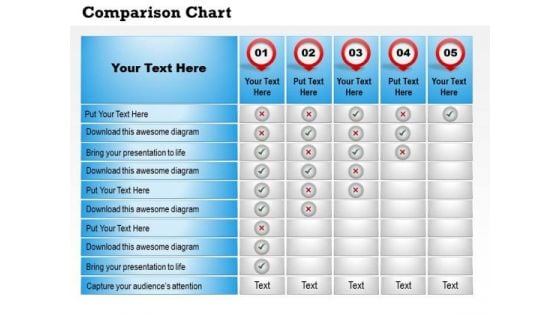
Consulting Diagram Comparison Chart For Effective Reports Business Cycle Diagram
Establish The Dominance Of Your Ideas. Our Consulting Diagram Comparison Chart For Effective Reports Business Cycle Diagram Powerpoint Templates Will Put Them On Top.
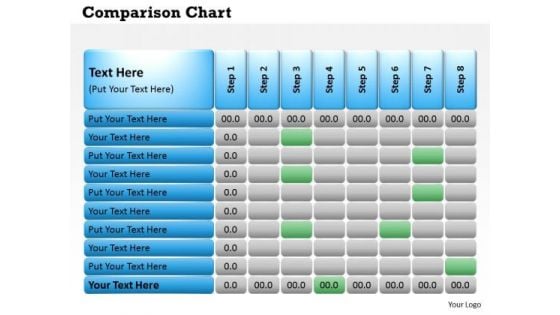
Consulting Diagram Comparison Chart With Eight Steps Marketing Diagram
Dominate Proceedings With Your Ideas. Our Consulting Diagram Comparison Chart With Eight Steps Marketing Diagram Powerpoint Templates Will Empower Your Thoughts.
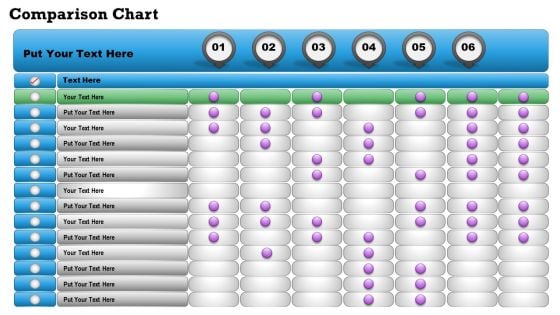
Strategy Diagram Comparison Chart For Business Data Consulting Diagram
Double Up Our Strategy Diagram Comparison Chart For Business Data Consulting Diagram Powerpoint Templates With Your Thoughts. They Will Make An Awesome Pair.
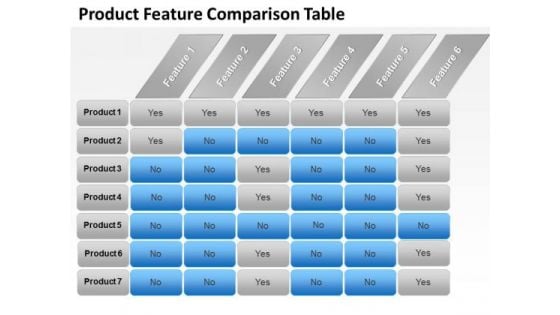
Strategic Management Product Features Comparison Chart Marketing Diagram
Double Your Chances With Our Strategic Management Product Features Comparison Chart Marketing Diagram Powerpoint Templates. The Value Of Your Thoughts Will Increase Two-Fold.
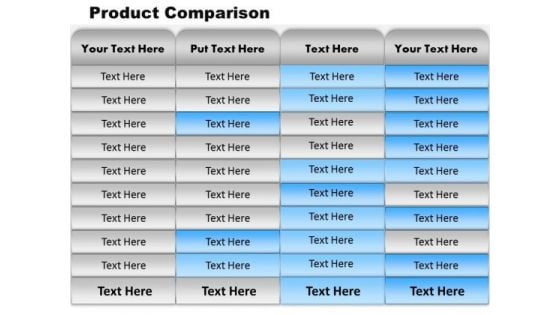
Business Framework Model Comparison Chart Of Business Product Business Diagram
Put In A Dollop Of Our Business Framework Model Comparison Chart Of Business Product Business Diagram Powerpoint Templates. Give Your Thoughts A Distinctive Flavor.
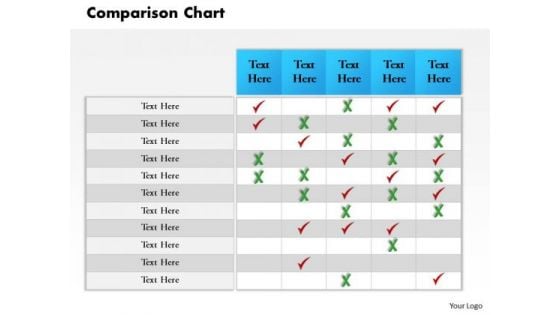
Business Framework Model Product Comparison Business Chart Marketing Diagram
Doll Up Your Thoughts With Our Business Framework Model Product Comparison Business Chart Marketing Diagram Powerpoint Templates. They Will Make A Pretty Picture.
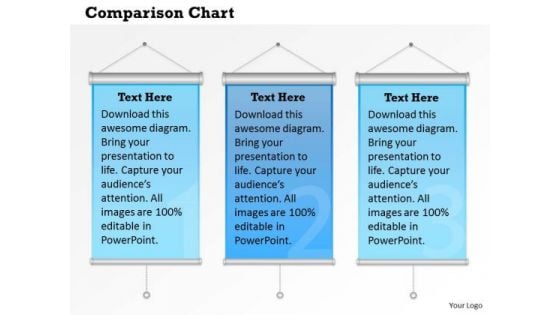
Strategic Management Comparison Chart Business Design Sales Diagram
Open Up Doors That Lead To Success. Our Strategic Management Comparison Chart Business Design Sales Diagram Powerpoint Templates Provide The Handles.
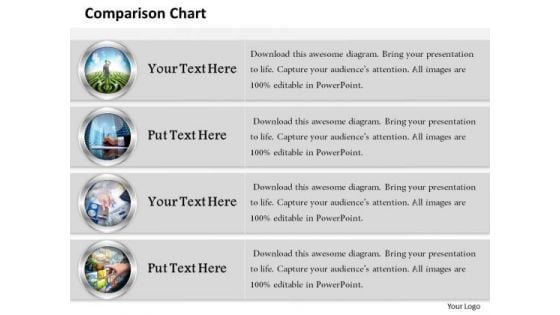
Strategic Management Comparison Chart With Pictures Business Diagram
Deliver The Right Dose With Our Strategic Management Comparison Chart With Pictures Business Diagram Powerpoint Templates. Your Ideas Will Get The Correct Illumination.
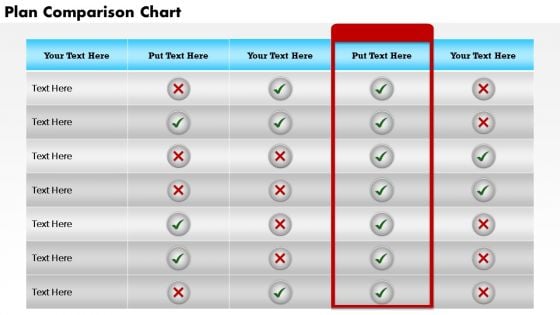
Strategic Management Plan Description And Comparison Chart Marketing Diagram
Connect The Dots With Our Strategic Management Plan Description And Comparison Chart Marketing Diagram Powerpoint Templates. Watch The Whole Picture Clearly Emerge.
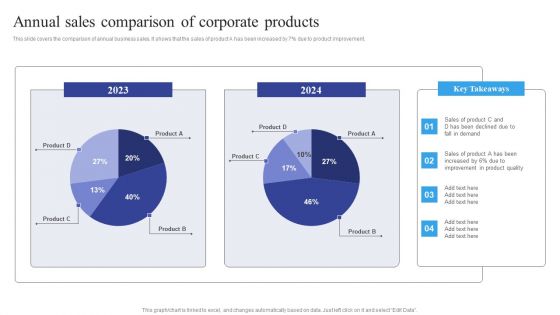
Annual Sales Comparison Of Corporate Products Themes PDF
This slide covers the comparison of annual business sales. It shows that the sales of product A has been increased by 7 percent due to product improvement. Pitch your topic with ease and precision using this Annual Sales Comparison Of Corporate Products Themes PDF. This layout presents information on Annual Sales, Comparison Of Corporate Products. It is also available for immediate download and adjustment. So, changes can be made in the color, design, graphics or any other component to create a unique layout.
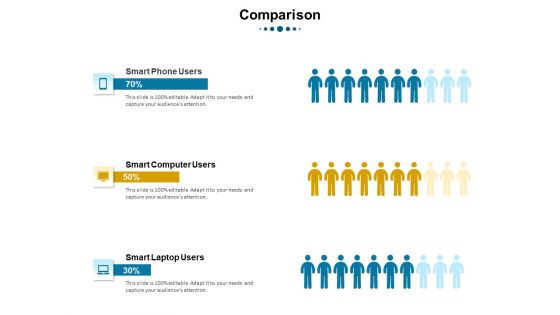
Phases Of Strategic Leadership Maturity Model Comparison Template PDF
Deliver an awe inspiring pitch with this creative phases of strategic leadership maturity model comparison template pdf bundle. Topics like smart phone users, comparison can be discussed with this completely editable template. It is available for immediate download depending on the needs and requirements of the user.
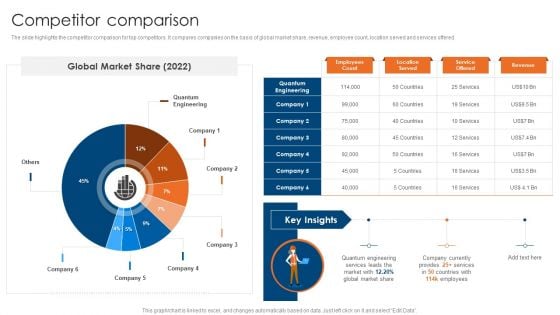
Engineering Consultancy Works Company Profile Competitor Comparison Designs PDF
The slide highlights the competitor comparison for top competitors. It compares companies on the basis of global market share, revenue, employee count, location served and services offered. Deliver an awe inspiring pitch with this creative Engineering Consultancy Works Company Profile Competitor Comparison Designs PDF bundle. Topics like Competitor, Comparison, Global Market can be discussed with this completely editable template. It is available for immediate download depending on the needs and requirements of the user.
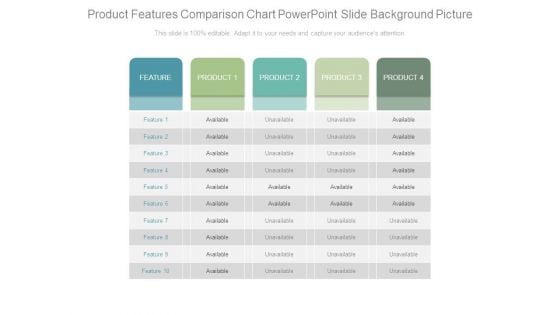
Product Features Comparison Chart Powerpoint Slide Background Picture
This is a product features comparison chart powerpoint slide background picture. This is a four stage process. The stages in this process are feature, product, available, unavailable.
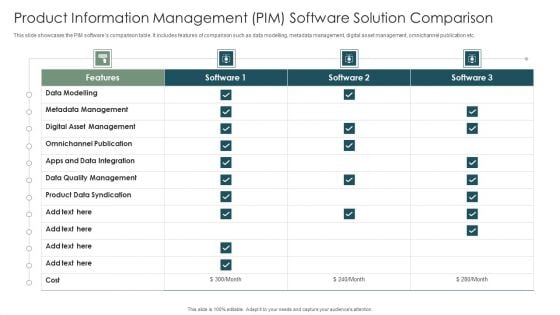
Product Information Management PIM Software Solution Comparison Themes PDF
This slide showcases the PIM softwares comparison table. It includes features of comparison such as data modelling, metadata management, digital asset management, omnichannel publication etc. Showcasing this set of slides titled Product Information Management PIM Software Solution Comparison Themes PDF. The topics addressed in these templates are Metadata Management, Omnichannel Publication. All the content presented in this PPT design is completely editable. Download it and make adjustments in color, background, font etc. as per your unique business setting.
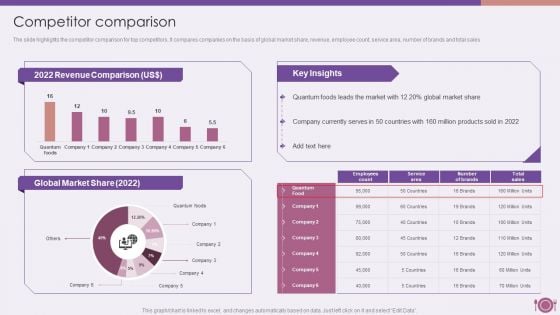
Packaged Food Firm Description Competitor Comparison Rules PDF
The slide highlights the competitor comparison for top competitors. It compares companies on the basis of global market share, revenue, employee count, service area, number of brands and total sales.Deliver and pitch your topic in the best possible manner with this Packaged Food Firm Description Competitor Comparison Rules PDF. Use them to share invaluable insights on Revenue Comparison, Key Insights, Quantum Foods and impress your audience. This template can be altered and modified as per your expectations. So, grab it now.
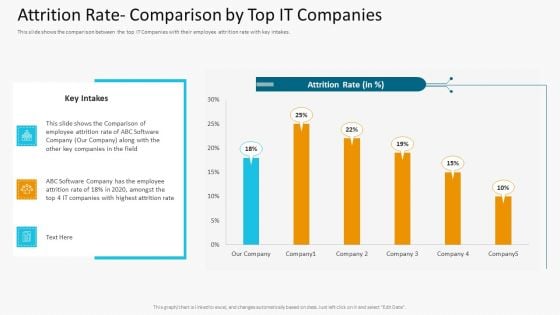
Attrition Rate Comparison By Top IT Companies Information PDF
This slide shows the comparison between the top IT Companies with their employee attrition rate with key intakes. Deliver and pitch your topic in the best possible manner with this attrition rate comparison by top it companies information pdf. Use them to share invaluable insights on attrition rate comparison by top it companies and impress your audience. This template can be altered and modified as per your expectations. So, grab it now.
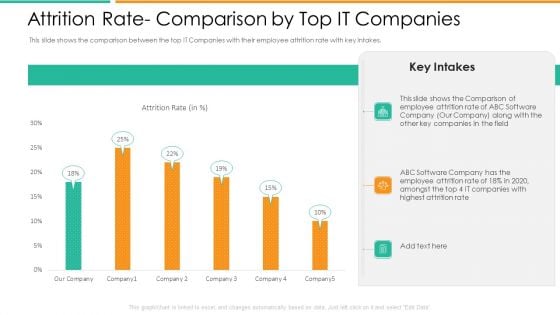
Attrition Rate Comparison By Top It Companies Background PDF
This slide shows the comparison between the top IT Companies with their employee attrition rate with key intakes. Deliver and pitch your topic in the best possible manner with this attrition rate comparison by top it companies background pdf. Use them to share invaluable insights on attrition rate comparison by top it companies and impress your audience. This template can be altered and modified as per your expectations. So, grab it now.
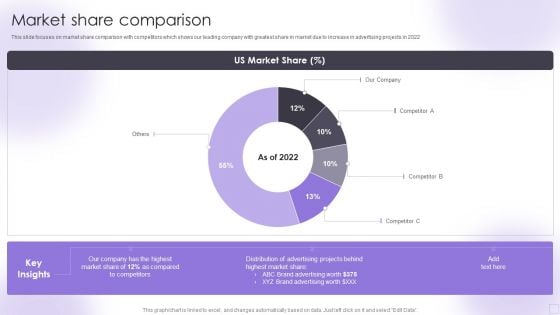
Advertising Services Company Profile Market Share Comparison Rules PDF
This slide focuses on market share comparison with competitors which shows our leading company with greatest share in market due to increase in advertising projects in 2022. Deliver an awe inspiring pitch with this creative Advertising Services Company Profile Market Share Comparison Rules PDF bundle. Topics like Market Share Comparison can be discussed with this completely editable template. It is available for immediate download depending on the needs and requirements of the user.
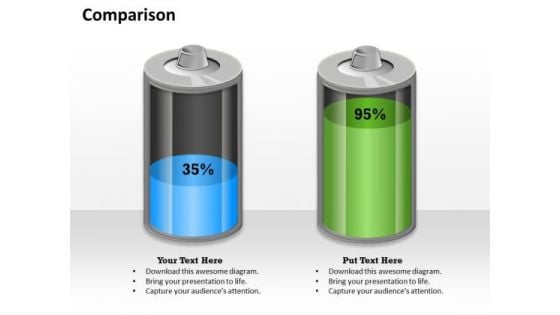
Business Cycle Diagram Percentage Comparison Business Design Strategy Diagram
Get Out Of The Dock With Our Business Cycle Diagram Percentage Comparison Business Design Strategy Diagram Powerpoint Templates. Your Mind Will Be Set Free.
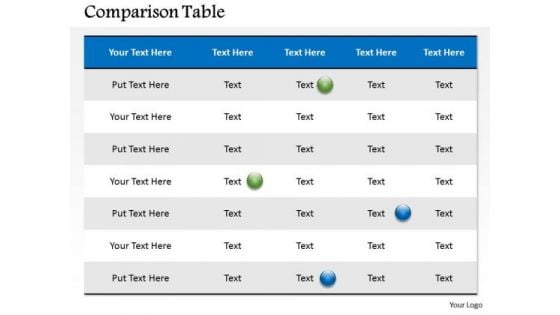
Marketing Diagram Comparison Table For Business Data Sales Diagram
Establish Your Dominion With Our Marketing Diagram Comparison Table For Business Data Sales Diagram Powerpoint Templates. Rule The Stage With Your Thoughts.
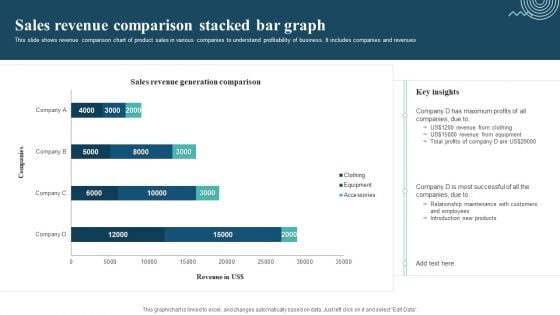
Sales Revenue Comparison Stacked Bar Graph Mockup PDF
This slide shows revenue comparison chart of product sales in various companies to understand profitability of business. It includes companies and revenues. Showcasing this set of slides titled Sales Revenue Comparison Stacked Bar Graph Mockup PDF. The topics addressed in these templates are Sales Revenue Comparison, Revenue From Clothing, Revenue From Equipment. All the content presented in this PPT design is completely editable. Download it and make adjustments in color, background, font etc. as per your unique business setting.
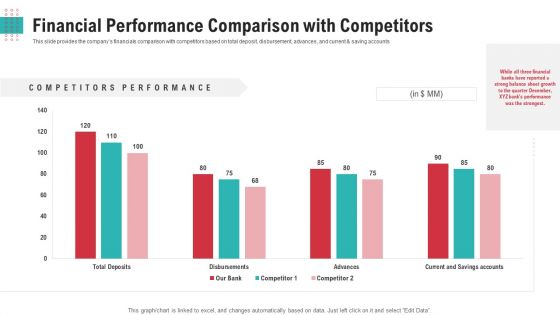
Financial Performance Comparison With Competitors Ppt Outline Gallery PDF
This slide provides the companys financials comparison with competitors based on total deposit, disbursement, advances, and current and saving accounts.Deliver an awe-inspiring pitch with this creative financial performance comparison with competitors ppt outline gallery pdf. bundle. Topics like financial performance comparison with competitors can be discussed with this completely editable template. It is available for immediate download depending on the needs and requirements of the user
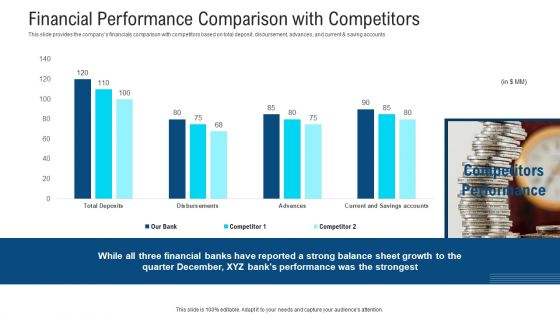
Financial Performance Comparison With Competitors Ppt Show Graphics Tutorials PDF
This slide provides the companys financials comparison with competitors based on total deposit, disbursement, advances, and current and saving accounts.Deliver and pitch your topic in the best possible manner with this financial performance comparison with competitors ppt show graphics tutorials pdf. Use them to share invaluable insights on financial performance comparison with competitors and impress your audience. This template can be altered and modified as per your expectations. So, grab it now.
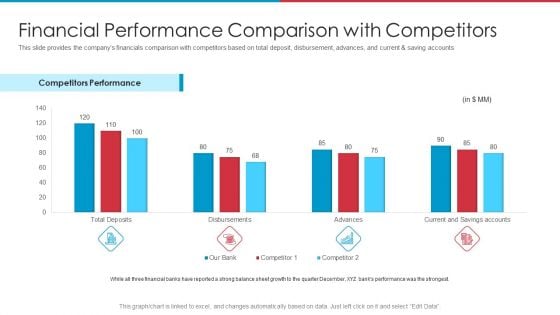
After IPO Equity Financial Performance Comparison With Competitors Brochure PDF
This slide provides the companys financials comparison with competitors based on total deposit, disbursement, advances, and current and saving accounts. Deliver an awe-inspiring pitch with this creative after ipo equity financial performance comparison with competitors brochure pdf bundle. Topics like competitors performance, growth, performance, financial, comparison can be discussed with this completely editable template. It is available for immediate download depending on the needs and requirements of the user.
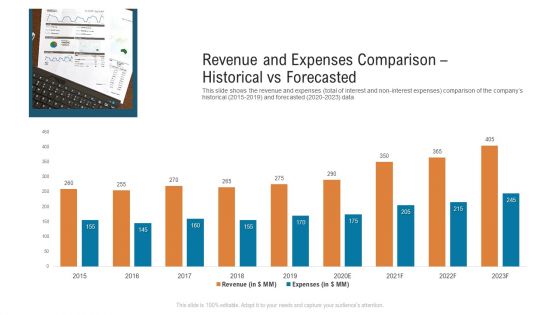
Revenue And Expenses Comparison Historical Vs Forecasted Microsoft PDF
This slide shows the revenue and expenses total of interest and non interest expenses comparison of the companys historical 2015 2019 and forecasted 2020 2023 data. Deliver and pitch your topic in the best possible manner with this revenue and expenses comparison historical vs forecasted microsoft pdf. Use them to share invaluable insights on revenue and expenses comparison historical vs forecasted and impress your audience. This template can be altered and modified as per your expectations. So, grab it now.
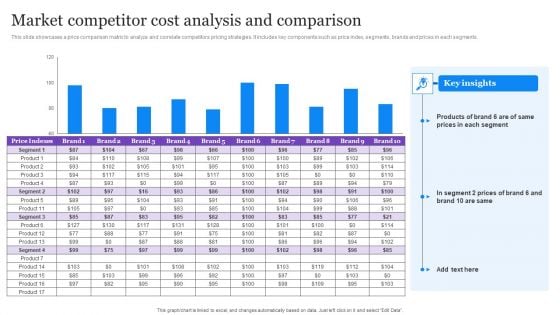
Market Competitor Cost Analysis And Comparison Demonstration PDF
This slide showcases a price comparison matrix to analyze and correlate competitors pricing strategies. It includes key components such as price index, segments, brands and prices in each segments. Showcasing this set of slides titled Market Competitor Cost Analysis And Comparison Demonstration PDF. The topics addressed in these templates are Market Competitor, Cost Analysis And Comparison. All the content presented in this PPT design is completely editable. Download it and make adjustments in color, background, font etc. as per your unique business setting.

Business Cycle Diagram Data Driven Comparison Chart Business Diagram
Analyze Ailments On Our Business Cycle Diagram Data Driven Comparison Chart Business Diagram Powerpoint Templates. Bring Out The Thinking Doctor In You. Dock Your Thoughts With Our Business Cycle Diagram Data Driven Comparison Chart Business Diagram Powerpoint Templates. They Will Launch Them Into Orbit.
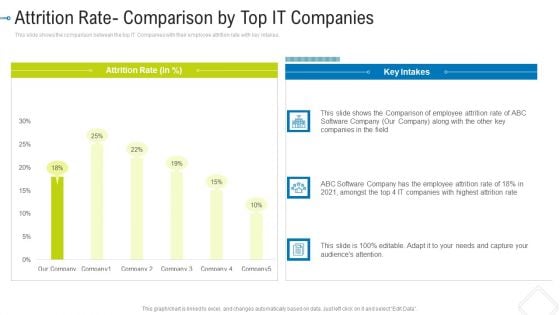
Attrition Rate Comparison By Top IT Companies Professional PDF
This slide shows the comparison between the top IT Companies with their employee attrition rate with key intakes.Deliver and pitch your topic in the best possible manner with this attrition rate comparison by top it companies professional pdf. Use them to share invaluable insights on capture your audiences attention, comparison of employee, attrition rate and impress your audience. This template can be altered and modified as per your expectations. So, grab it now.
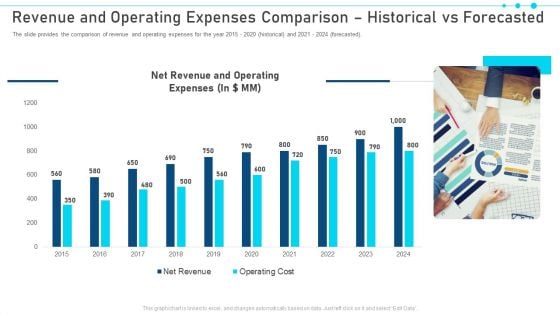
Revenue And Operating Expenses Comparison Historical Vs Forecasted Pictures PDF
The slide provides the comparison of revenue and operating expenses for the year 2015 2020 historical and 2021 2024 forecasted. Deliver an awe-inspiring pitch with this creative revenue and operating expenses comparison historical vs forecasted pictures pdf. bundle. Topics like revenue and operating expenses comparison historical vs forecasted can be discussed with this completely editable template. It is available for immediate download depending on the needs and requirements of the user.
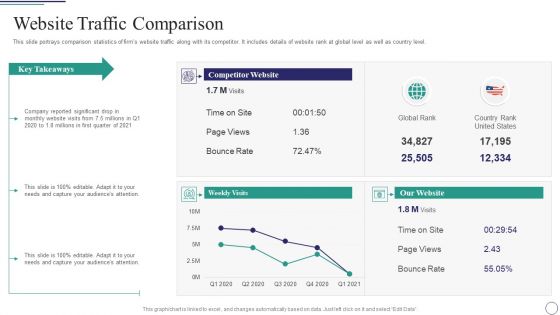
Successful Brand Development Plan Website Traffic Comparison Guidelines PDF
This slide portrays comparison statistics of firms website traffic along with its competitor. It includes details of website rank at global level as well as country level.Deliver an awe inspiring pitch with this creative successful brand development plan website traffic comparison guidelines pdf bundle. Topics like website traffic comparison can be discussed with this completely editable template. It is available for immediate download depending on the needs and requirements of the user.
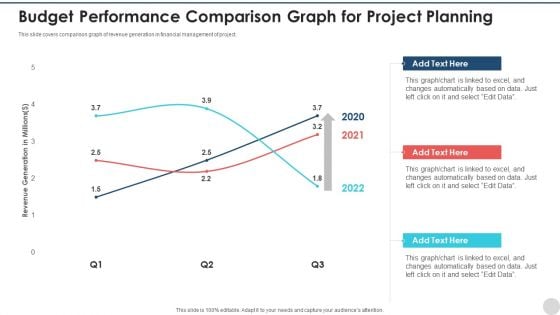
Budget Performance Comparison Graph For Project Planning Pictures PDF
This slide covers comparison graph of revenue generation in financial management of project. Showcasing this set of slides titled budget performance comparison graph for project planning pictures pdf. The topics addressed in these templates are budget performance comparison graph for project planning. All the content presented in this PPT design is completely editable. Download it and make adjustments in color, background, font etc. as per your unique business setting.
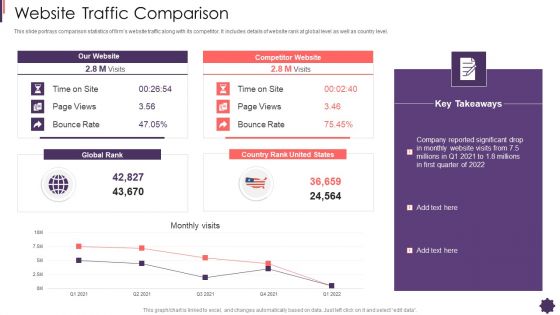
Website Traffic Comparison Brand Techniques Structure Microsoft PDF
This slide portrays comparison statistics of firms website traffic along with its competitor. It includes details of website rank at global level as well as country level. Deliver and pitch your topic in the best possible manner with this website traffic comparison brand techniques structure microsoft pdf. Use them to share invaluable insights on website traffic comparison and impress your audience. This template can be altered and modified as per your expectations. So, grab it now.
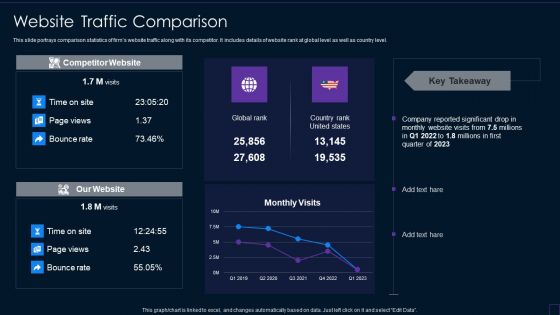
Brand Development Manual Website Traffic Comparison Professional PDF
This slide portrays comparison statistics of firms website traffic along with its competitor. It includes details of website rank at global level as well as country level.Deliver an awe inspiring pitch with this creative Brand Development Manual Website Traffic Comparison Professional PDF bundle. Topics like Website Traffic Comparison can be discussed with this completely editable template. It is available for immediate download depending on the needs and requirements of the user.
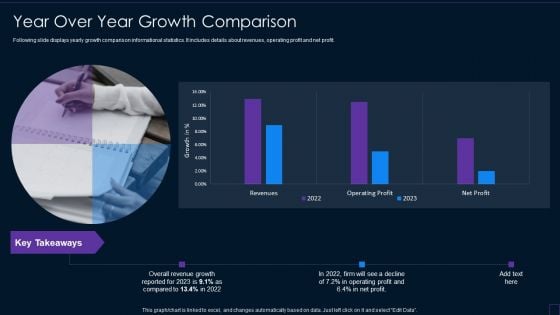
Brand Development Manual Year Over Year Growth Comparison Ideas PDF
Following slide displays yearly growth comparison informational statistics. It includes details about revenues, operating profit and net profit. Deliver and pitch your topic in the best possible manner with this Brand Development Manual Year Over Year Growth Comparison Ideas PDF Use them to share invaluable insights on Year Over Year Growth Comparison and impress your audience. This template can be altered and modified as per your expectations. So, grab it now.
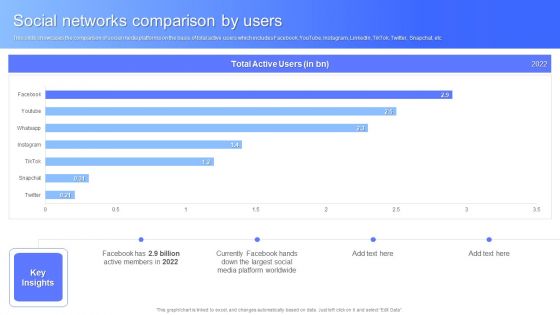
Social Networks Comparison By Users Facebook Business Outline Formats PDF
This slide showcases the comparison of social media platforms on the basis of total active users which includes Facebook, YouTube, Instagram, LinkedIn, TikTok, Twitter, Snapchat, etc. Deliver and pitch your topic in the best possible manner with this Social Networks Comparison By Users Facebook Business Outline Formats PDF. Use them to share invaluable insights on Social Networks Comparison and impress your audience. This template can be altered and modified as per your expectations. So, grab it now.
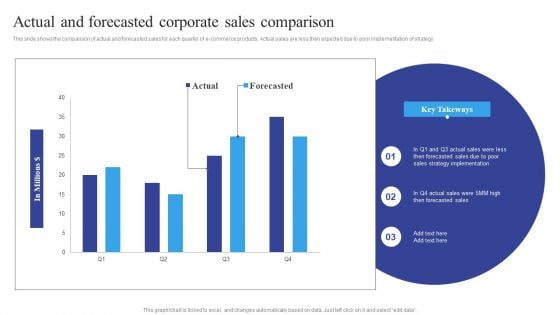
Actual And Forecasted Corporate Sales Comparison Brochure PDF
This slide shows the comparison of actual and forecasted sales for each quarter of e-commerce products. Actual sales are less then expected due to poor implementation of strategy. Showcasing this set of slides titled Actual And Forecasted Corporate Sales Comparison Brochure PDF. The topics addressed in these templates are Actual And Forecasted, Corporate Sales Comparison. All the content presented in this PPT design is completely editable. Download it and make adjustments in color, background, font etc. as per your unique business setting.
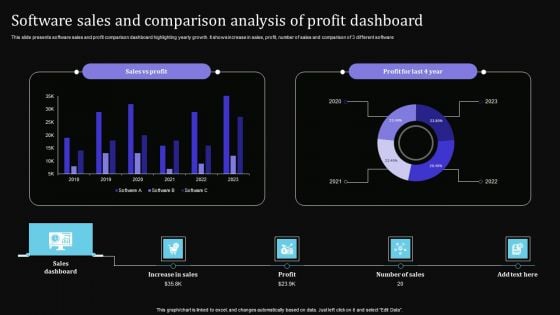
Software Sales And Comparison Analysis Of Profit Dashboard Sample PDF
This slide presents software sales and profit comparison dashboard highlighting yearly growth. It shows increase in sales, profit, number of sales and comparison of 3 different software. Showcasing this set of slides titled Software Sales And Comparison Analysis Of Profit Dashboard Sample PDF. The topics addressed in these templates are Increase Sales, Profit, Sales Dashboard. All the content presented in this PPT design is completely editable. Download it and make adjustments in color, background, font etc. as per your unique business setting.
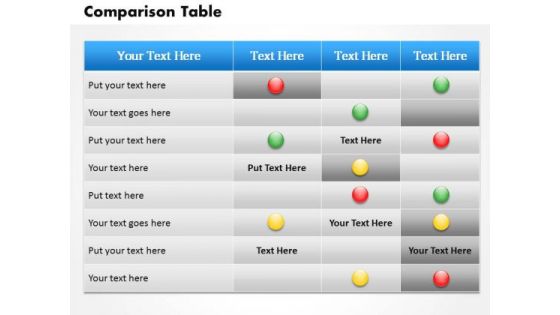
Business Diagram Comparison Of Work Information Strategic Management
Our Business Diagram Comparison Of Work Information Strategic Management Powerpoint Templates Team Are A Dogged Lot. They Keep At It Till They Get It Right.
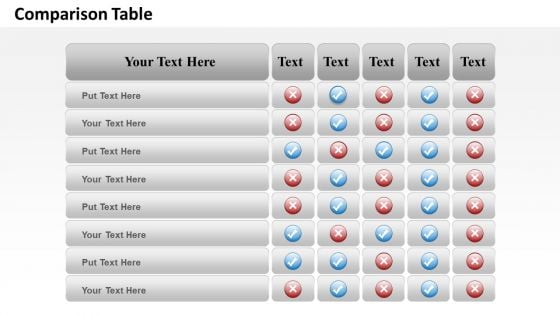
Strategic Management Comparison Table Of Business Information Sales Diagram
Our Strategic Management Comparison Table Of Business Information Sales Diagram Powerpoint Templates Deliver At Your Doorstep. Let Them In For A Wonderful Experience.


 Continue with Email

 Home
Home


