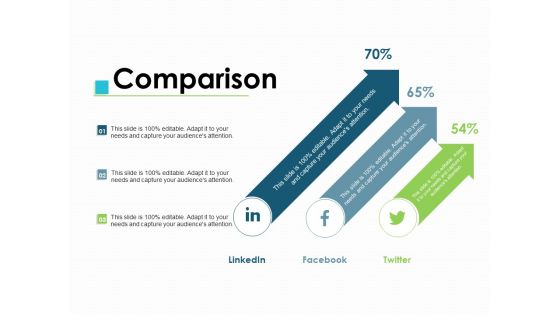
Comparison Infographic
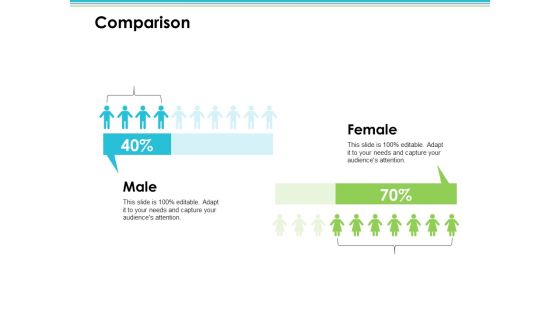
Comparison Male And Female Ppt PowerPoint Presentation Infographics Format
This is a comparison male and female ppt powerpoint presentation infographics format. This is a three stage process. The stages in this process are marketing, business, management, compare.
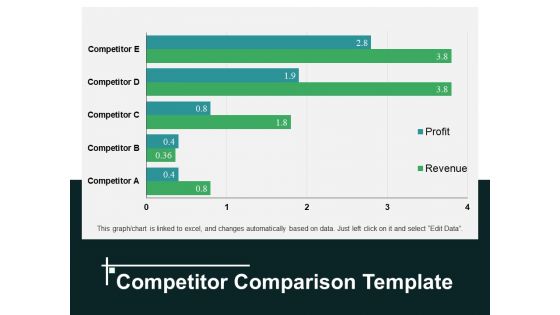
Competitor Comparison Template 1 Ppt PowerPoint Presentation Pictures Infographics
This is a competitor comparison template 1 ppt powerpoint presentation pictures infographics. This is a five stage process. The stages in this process are competitor, profit, revenue.
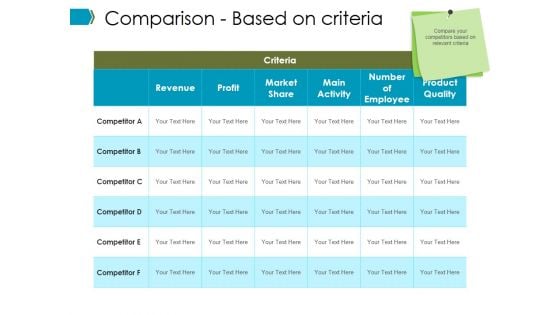
Comparison Based On Criteria Ppt PowerPoint Presentation Infographics Graphics Download
This is a comparison based on criteria ppt powerpoint presentation infographics graphics download. This is a six stage process. The stages in this process are high value, low value, low trust, high trust.
Comparison Employee Value Proposition Ppt PowerPoint Presentation Infographics Master Slide
This is a comparison employee value proposition ppt powerpoint presentation infographics master slide. This is a two stage process. The stages in this process are business, management, strategy, analysis, marketing.
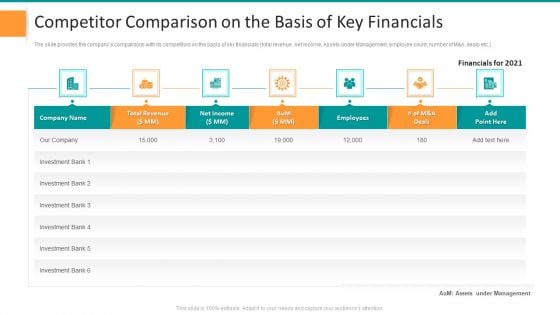
Competitor Comparison On The Basis Of Key Financials Infographics PDF
The slide provides the companys comparisons with its competitors on the basis of key financials total revenue, net income, Assets under Management, employee count, number of M and A deals etc. Deliver an awe inspiring pitch with this creative competitor comparison on the basis of key financials infographics pdf bundle. Topics like competitor comparison on the basis of key financials can be discussed with this completely editable template. It is available for immediate download depending on the needs and requirements of the user.
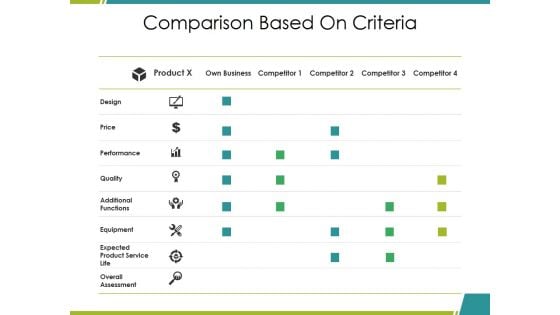
Comparison Based On Criteria Ppt PowerPoint Presentation Infographics Elements
This is a comparison based on criteria ppt powerpoint presentation infographics elements. This is a four stage process. The stages in this process are design, price, performance, product, competitor.
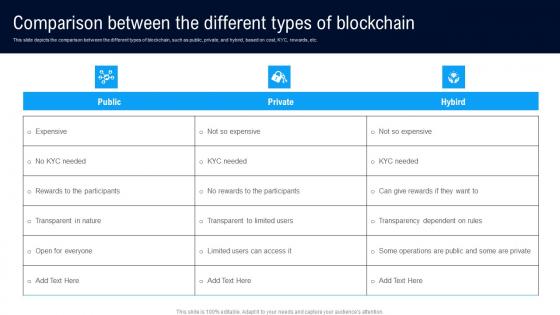
Comparison Between The Different Architectures Of Blockchain Infographics Pdf
This slide depicts the comparison between the different types of blockchain, such as public, private, and hybrid, based on cost, KYC, rewards, etc. Create an editable Comparison Between The Different Architectures Of Blockchain Infographics Pdf that communicates your idea and engages your audience. Whether you are presenting a business or an educational presentation, pre designed presentation templates help save time. Comparison Between The Different Architectures Of Blockchain Infographics Pdf is highly customizable and very easy to edit, covering many different styles from creative to business presentations. Slidegeeks has creative team members who have crafted amazing templates. So, go and get them without any delay. This slide depicts the comparison between the different types of blockchain, such as public, private, and hybrid, based on cost, KYC, rewards, etc.
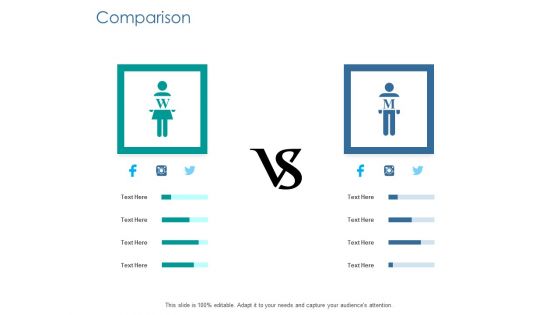
Comparison Female Male Ppt PowerPoint Presentation Inspiration Infographics
Presenting this set of slides with name comparison female male ppt powerpoint presentation inspiration infographics. This is a two stage process. The stages in this process are comparison, male, female, marketing, strategy. This is a completely editable PowerPoint presentation and is available for immediate download. Download now and impress your audience.
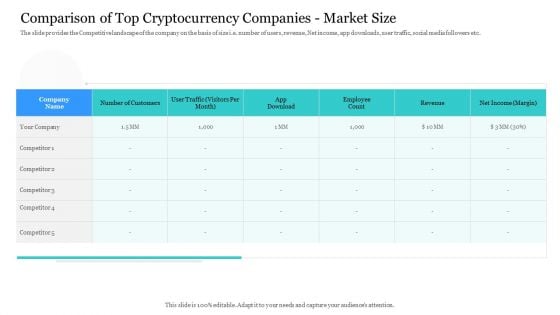
Comparison Of Top Cryptocurrency Companies Market Size Infographics PDF
The slide provides the Competitive landscape of the company on the basis of size i.e. number of users, revenue, Net income, app downloads, user traffic, social media followers etc.Deliver an awe-inspiring pitch with this creative comparison of top cryptocurrency companies market size infographics pdf. bundle. Topics like employee count, revenue, net income margin can be discussed with this completely editable template. It is available for immediate download depending on the needs and requirements of the user.

Comparison Of Key Outsourcing Digital Marketing Agencies Infographics PDF
Are you in need of a template that can accommodate all of your creative concepts This one is crafted professionally and can be altered to fit any style. Use it with Google Slides or PowerPoint. Include striking photographs, symbols, depictions, and other visuals. Fill, move around, or remove text boxes as desired. Test out color palettes and font mixtures. Edit and save your work, or work with colleagues. Download Comparison Of Key Outsourcing Digital Marketing Agencies Infographics PDF and observe how to make your presentation outstanding. Give an impeccable presentation to your group and make your presentation unforgettable.
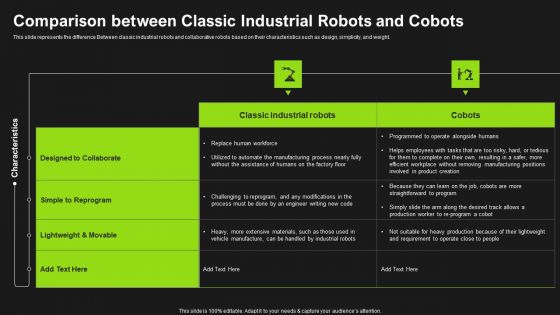
Comparison Between Classic Industrial Robots And Cobots Infographics PDF
This slide represents the difference Between classic industrial robots and collaborative robots based on their characteristics such as design, simplicity, and weight. Make sure to capture your audiences attention in your business displays with our gratis customizable Comparison Between Classic Industrial Robots And Cobots Infographics PDF. These are great for business strategies, office conferences, capital raising or task suggestions. If you desire to acquire more customers for your tech business and ensure they stay satisfied, create your own sales presentation with these plain slides.
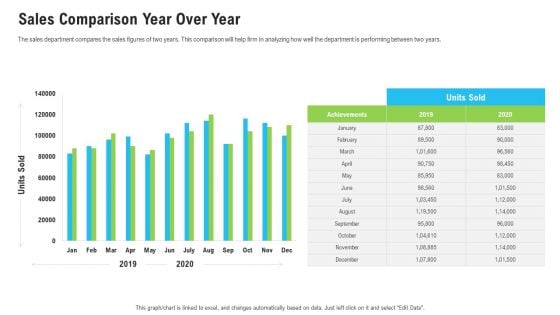
Sales Department Strategies Increase Revenues Sales Comparison Year Over Year Infographics PDF
The sales department compares the sales figures of two years. This comparison will help firm in analyzing how well the department is performing between two years. Deliver an awe-inspiring pitch with this creative sales department strategies increase revenues sales comparison year over year infographics pdf bundle. Topics like sales comparison year over year can be discussed with this completely editable template. It is available for immediate download depending on the needs and requirements of the user.

Cloud Kitchen And Dine In Restaurant Sales Comparison Global Virtual Restaurant Infographics Pdf
The following slide highlights comparison of cloud kitchen and dine in restaurants based on gross food sales of previous years. It presents yearly sales growth of cloud kitchen and direct restaurant. Find highly impressive Cloud Kitchen And Dine In Restaurant Sales Comparison Global Virtual Restaurant Infographics Pdf on Slidegeeks to deliver a meaningful presentation. You can save an ample amount of time using these presentation templates. No need to worry to prepare everything from scratch because Slidegeeks experts have already done a huge research and work for you. You need to download Cloud Kitchen And Dine In Restaurant Sales Comparison Global Virtual Restaurant Infographics Pdf for your upcoming presentation. All the presentation templates are 100 percent editable and you can change the color and personalize the content accordingly. Download now. The following slide highlights comparison of cloud kitchen and dine in restaurants based on gross food sales of previous years. It presents yearly sales growth of cloud kitchen and direct restaurant.
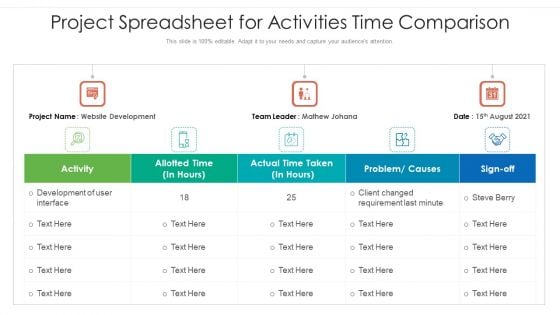
Project Spreadsheet For Activities Time Comparison Ppt PowerPoint Presentation Infographics Backgrounds PDF
Showcasing this set of slides titled project spreadsheet for activities time comparison ppt powerpoint presentation infographics backgrounds pdf. The topics addressed in these templates are project spreadsheet for activities time comparison. All the content presented in this PPT design is completely editable. Download it and make adjustments in color, background, font etc. as per your unique business setting.
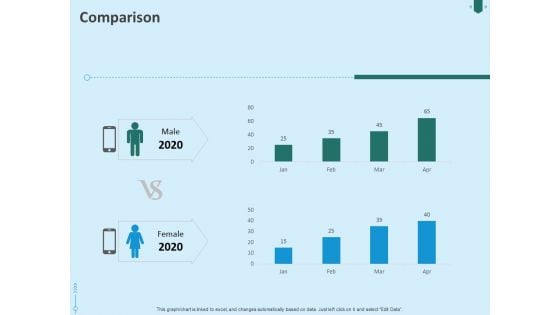
Developing Organization Partner Strategy Comparison Ppt PowerPoint Presentation Infographics Graphics Tutorials PDF
Presenting this set of slides with name developing organization partner strategy comparison ppt powerpoint presentation infographics graphics tutorials pdf. This is a two stage process. The stages in this process are comparison, male, female. This is a completely editable PowerPoint presentation and is available for immediate download. Download now and impress your audience.
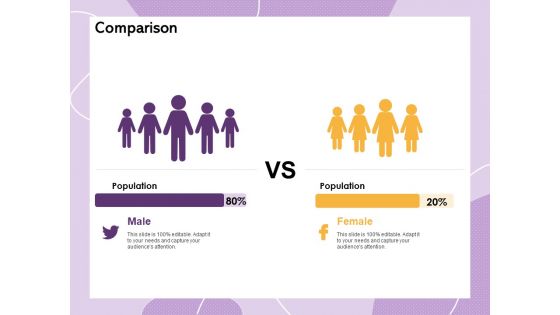
Investor Presentation For Society Funding Comparison Ppt PowerPoint Presentation Infographics Portfolio PDF
Presenting this set of slides with name investor presentation for society funding comparison ppt powerpoint presentation infographics portfolio pdf. This is a two stage process. The stages in this process are comparison. This is a completely editable PowerPoint presentation and is available for immediate download. Download now and impress your audience.
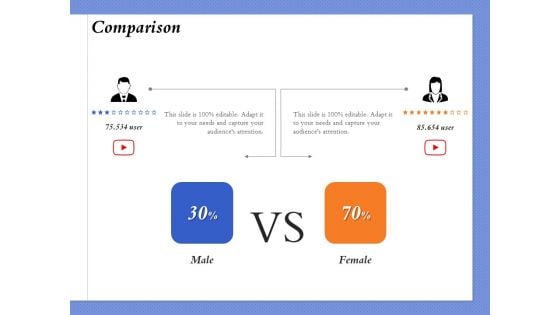
Selecting The Right Channel Strategy Comparison Ppt PowerPoint Presentation Infographics Model PDF
Presenting this set of slides with name selecting the right channel strategy comparison ppt powerpoint presentation infographics model pdf. This is a two stage process. The stages in this process are comparison. This is a completely editable PowerPoint presentation and is available for immediate download. Download now and impress your audience.
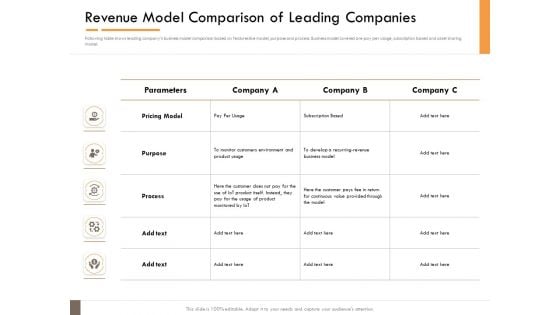
Competitor Intelligence Research And Market Intelligence Revenue Model Comparison Of Leading Companies Infographics PDF
Deliver an awe inspiring pitch with this creative competitor intelligence research and market intelligence revenue model comparison of leading companies infographics pdf bundle. Topics like pricing model, purpose, process, monitor, business can be discussed with this completely editable template. It is available for immediate download depending on the needs and requirements of the user.

B2b E Commerce Platform Comparison Ppt PowerPoint Presentation Infographics Graphics Cpb
Presenting this set of slides with name b2b e commerce platform comparison ppt powerpoint presentation infographics graphics cpb. This is a three stage process. The stages in this process are marketing, business, management, planning, strategy. This is a completely editable PowerPoint presentation and is available for immediate download. Download now and impress your audience.
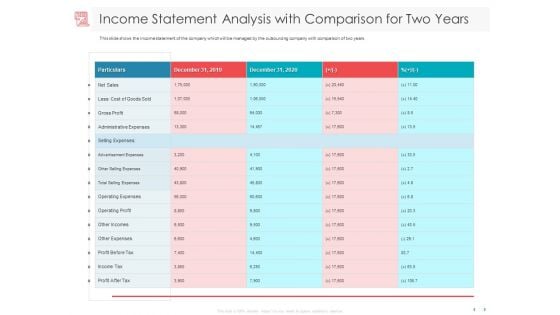
Managing CFO Services Income Statement Analysis With Comparison For Two Years Infographics PDF
Presenting this set of slides with name managing cfo services income statement analysis with comparison for two years infographics pdf. The topics discussed in these slides are net sales, gross profit, operating profit, income tax, operating expenses, administrative expenses, profit before tax. This is a completely editable PowerPoint presentation and is available for immediate download. Download now and impress your audience.
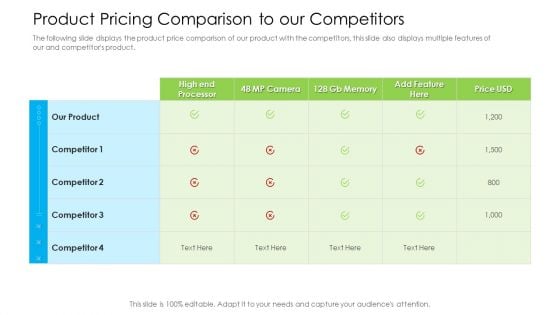
Marketing Techniques Online Offline Commercial Activities Product Pricing Comparison To Our Competitors Infographics PDF
The following slide displays the product price comparison of our product with the competitors, this slide also displays multiple features of our and competitors product. Deliver and pitch your topic in the best possible manner with this marketing techniques online offline commercial activities product pricing comparison to our competitors infographics pdf. Use them to share invaluable insights on product pricing comparison to our competitors and impress your audience. This template can be altered and modified as per your expectations. So, grab it now.
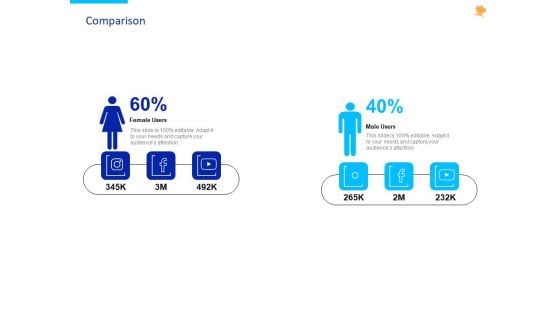
Stock Pitch For Fast Food Restaurants Delivery Comparison Ppt PowerPoint Presentation Infographics Example PDF
This is a stock pitch for fast food restaurants delivery comparison ppt powerpoint presentation infographics example pdf template with various stages. Focus and dispense information on two stages using this creative set, that comes with editable features. It contains large content boxes to add your information on topics like comparison, male, female. You can also showcase facts, figures, and other relevant content using this PPT layout. Grab it now.
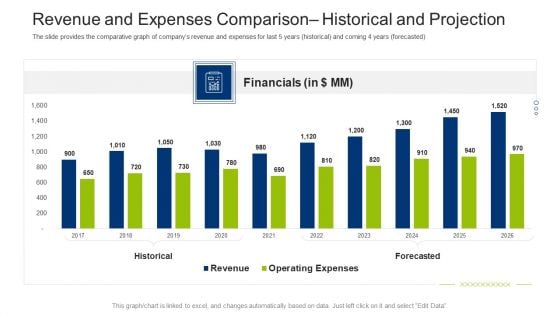
Investment Fundraising Pitch Deck From Stock Market Revenue And Expenses Comparison Historical And Projection Infographics PDF
The slide provides the comparative graph of companys revenue and expenses for last 5 years historical and coming 4 years forecasted. Deliver an awe inspiring pitch with this creative investment fundraising pitch deck from stock market revenue and expenses comparison historical and projection infographics pdf bundle. Topics like financials, historical, forecasted, revenue, expenses can be discussed with this completely editable template. It is available for immediate download depending on the needs and requirements of the user.
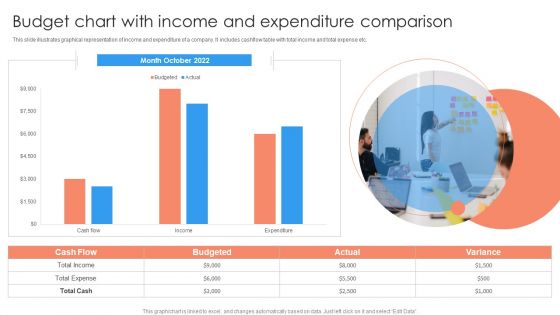
Budget Chart With Income And Expenditure Comparison Ppt PowerPoint Presentation Infographics Designs PDF
This slide illustrates graphical representation of income and expenditure of a company. It includes cashflow table with total income and total expense etc.Pitch your topic with ease and precision using this Budget Chart With Income And Expenditure Comparison Ppt PowerPoint Presentation Infographics Designs PDF. This layout presents information on Total Expense, Total Income, Total Cash. It is also available for immediate download and adjustment. So, changes can be made in the color, design, graphics or any other component to create a unique layout.
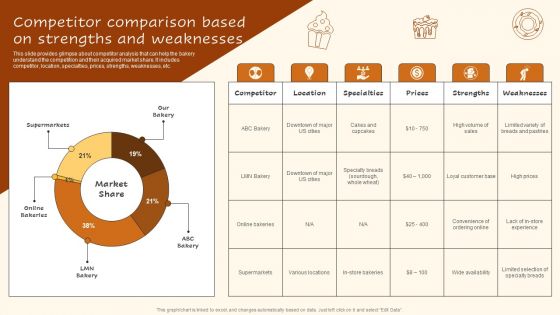
Digital Advertising Plan For Bakery Business Competitor Comparison Based On Strengths Infographics PDF
This slide provides glimpse about competitor analysis that can help the bakery understand the competition and their acquired market share. It includes competitor, location, specialties, prices, strengths, weaknesses, etc. Take your projects to the next level with our ultimate collection of Digital Advertising Plan For Bakery Business Competitor Comparison Based On Strengths Infographics PDF. Slidegeeks has designed a range of layouts that are perfect for representing task or activity duration, keeping track of all your deadlines at a glance. Tailor these designs to your exact needs and give them a truly corporate look with your own brand colors they will make your projects stand out from the rest.
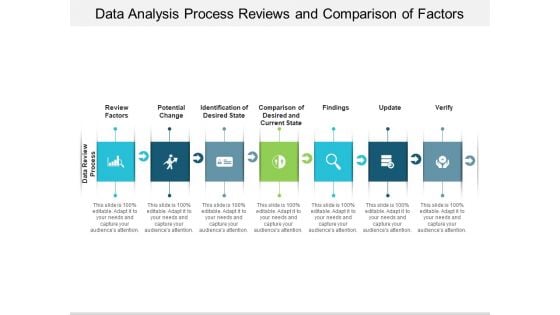
Data Analysis Process Reviews And Comparison Of Factors Ppt PowerPoint Presentation Infographic Template Graphics Template
This is a data analysis process reviews and comparison of factors ppt powerpoint presentation infographic template graphics template. This is a seven stage process. The stages in this process are data analysis, data review, data evaluation.
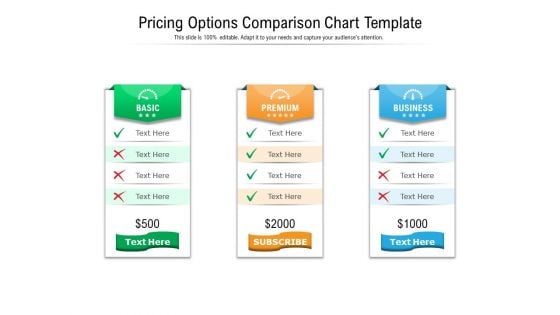
Pricing Options Comparison Chart Template Ppt PowerPoint Presentation Infographic Template Designs PDF
Presenting this set of slides with name pricing options comparison chart template ppt powerpoint presentation infographic template designs pdf. This is a three stage process. The stages in this process are basic, premium, business. This is a completely editable PowerPoint presentation and is available for immediate download. Download now and impress your audience.
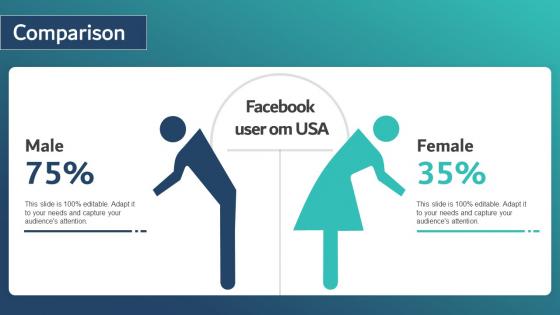
Comparison Healthcare Insurance App Capital Raising Pitch Deck Infographics Pdf
The Comparison Healthcare Insurance App Capital Raising Pitch Deck Infographics Pdf is a compilation of the most recent design trends as a series of slides. It is suitable for any subject or industry presentation, containing attractive visuals and photo spots for businesses to clearly express their messages. This template contains a variety of slides for the user to input data, such as structures to contrast two elements, bullet points, and slides for written information. Slidegeeks is prepared to create an impression. Our Comparison Healthcare Insurance App Capital Raising Pitch Deck Infographics Pdf are topically designed to provide an attractive backdrop to any subject. Use them to look like a presentation pro.
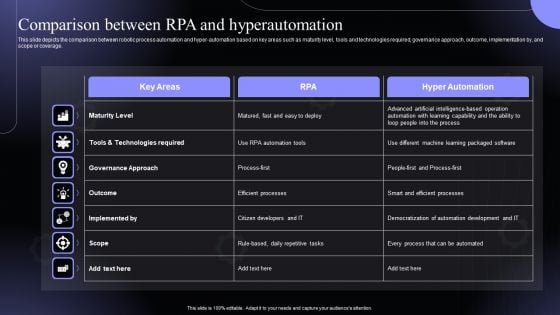
Comparison Between Rpa And Hyperautomation Software Solutions IT Infographics PDF
This slide depicts the comparison between robotic process automation and hyper automation based on key areas such as maturity level, tools and technologies required, governance approach, outcome, implementation by, and scope or coverage.Find highly impressive Common Phases In A Typical Platform Hyperautomation Software Solutions IT Topics PDF on Slidegeeks to deliver a meaningful presentation. You can save an ample amount of time using these presentation templates. No need to worry to prepare everything from scratch because Slidegeeks experts have already done a huge research and work for you. You need to download Common Phases In A Typical Platform Hyperautomation Software Solutions IT Topics PDF for your upcoming presentation. All the presentation templates are 100precent editable and you can change the color and personalize the content accordingly. Download now,
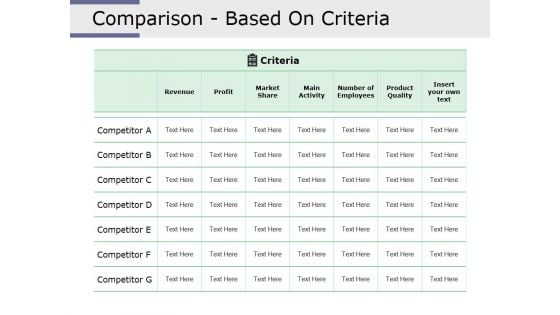
Comparison Based On Criteria Ppt PowerPoint Presentation Infographic Template Layout Ideas
This is a comparison based on criteria ppt powerpoint presentation infographic template layout ideas. This is a seven stage process. The stages in this process are revenue, profit, market share, main activity, number of employees, product quality.

Comparison Based On Criteria Ppt PowerPoint Presentation Infographic Template Graphic Tips
This is a comparison based on criteria ppt powerpoint presentation infographic template graphic tips. This is a seven stage process. The stages in this process are revenue, market share, main activity, number of employee, product quality.
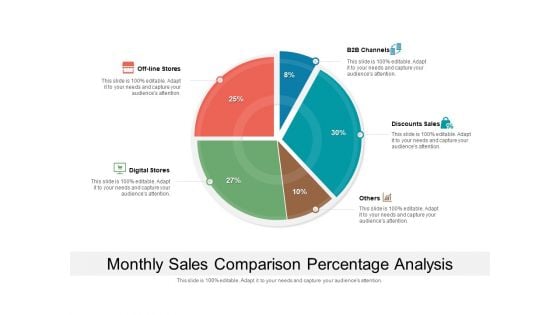
Monthly Sales Comparison Percentage Analysis Ppt PowerPoint Presentation File Infographic Template PDF
Pitch your topic with ease and precision using this monthly sales comparison percentage analysis ppt powerpoint presentation file infographic template pdf. This layout presents information on monthly sales comparison percentage analysis. It is also available for immediate download and adjustment. So, changes can be made in the color, design, graphics or any other component to create a unique layout.
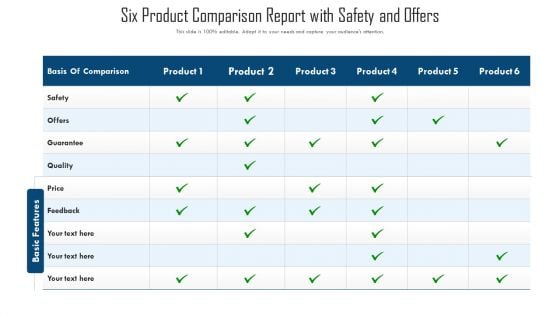
Six Product Comparison Report With Safety And Offers Ppt Infographic Template Styles PDF
Pitch your topic with ease and precision using this six product comparison report with safety and offers ppt infographic template styles pdf. This layout presents information on basis of comparison, product, price. It is also available for immediate download and adjustment. So, changes can be made in the color, design, graphics or any other component to create a unique layout.
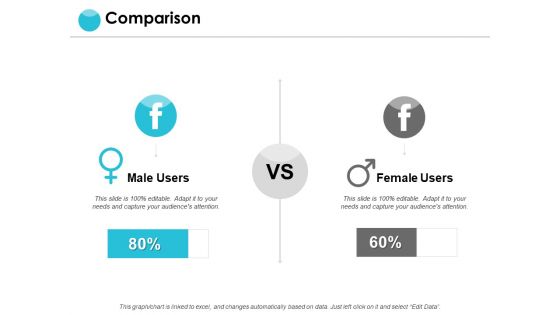
Comparison Male And Female Ppt PowerPoint Presentation Infographic Template Graphics Download
Presenting this set of slides with name comparison male and female ppt powerpoint presentation infographic template graphics download. This is a two stage process. The stages in this process are comparison, marketing, business, management, planning. This is a completely editable PowerPoint presentation and is available for immediate download. Download now and impress your audience.
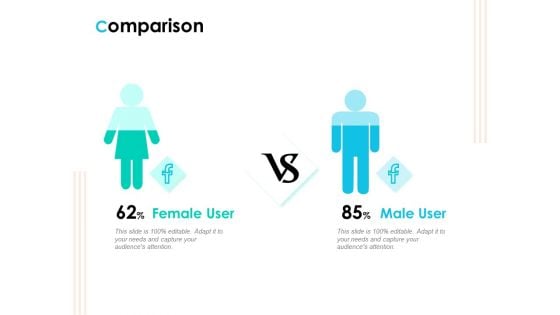
Effective Milestone Scheduling Approach Comparison Ppt PowerPoint Presentation Summary Infographics PDF
Presenting effective milestone scheduling approach comparison ppt powerpoint presentation summary infographics pdf to provide visual cues and insights. Share and navigate important information on two stages that need your due attention. This template can be used to pitch topics like comparison, male, female. In addtion, this PPT design contains high-resolution images, graphics, etc, that are easily editable and available for immediate download.
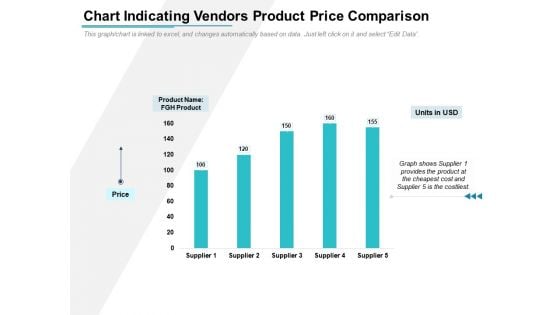
Chart Indicating Vendors Product Price Comparison Ppt PowerPoint Presentation Portfolio Infographics PDF
Showcasing this set of slides titled chart indicating vendors product price comparison ppt powerpoint presentation portfolio infographics pdf. The topics addressed in these templates are product, fgh product, units in usd, price, supplier. All the content presented in this PPT design is completely editable. Download it and make adjustments in color, background, font etc. as per your unique business setting.
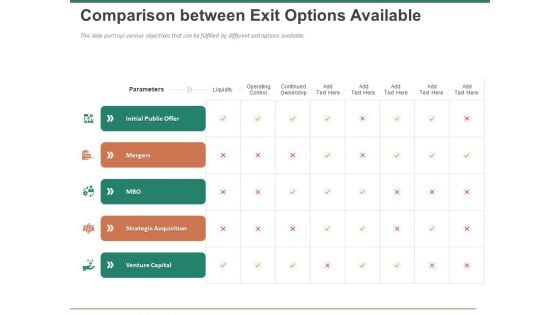
Escape Plan Venture Capitalist Comparison Between Exit Options Available Infographics PDF
Presenting this set of slides with name escape plan venture capitalist comparison between exit options available infographics pdf. The topics discussed in these slides are initial public offer, mergers, strategic acquisition, venture capital. This is a completely editable PowerPoint presentation and is available for immediate download. Download now and impress your audience.
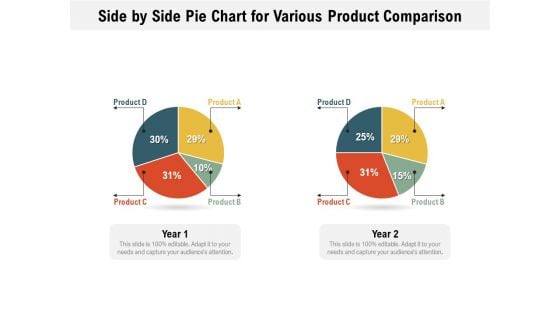
Side By Side Pie Chart For Various Product Comparison Ppt PowerPoint Presentation File Infographics PDF
Pitch your topic with ease and precision using this side by side pie chart for various product comparison ppt powerpoint presentation file infographics pdf. This layout presents information on side by side pie chart for various product comparison. It is also available for immediate download and adjustment. So, changes can be made in the color, design, graphics or any other component to create a unique layout.
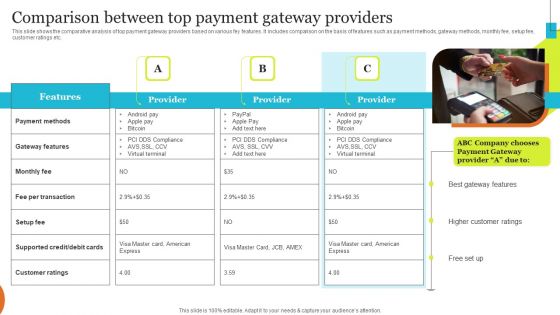
Implementing Effective Ecommerce Managemnet Platform Comparison Between Top Payment Gateway Infographics PDF
This slide shows the comparative analysis of top payment gateway providers based on various fey features. It includes comparison on the basis of features such as payment methods, gateway methods, monthly fee, setup fee, customer ratings etc. Get a simple yet stunning designed Implementing Effective Ecommerce Managemnet Platform Comparison Between Top Payment Gateway Infographics PDF. It is the best one to establish the tone in your meetings. It is an excellent way to make your presentations highly effective. So, download this PPT today from Slidegeeks and see the positive impacts. Our easy to edit Implementing Effective Ecommerce Managemnet Platform Comparison Between Top Payment Gateway Infographics PDF can be your go to option for all upcoming conferences and meetings. So, what are you waiting for Grab this template today.
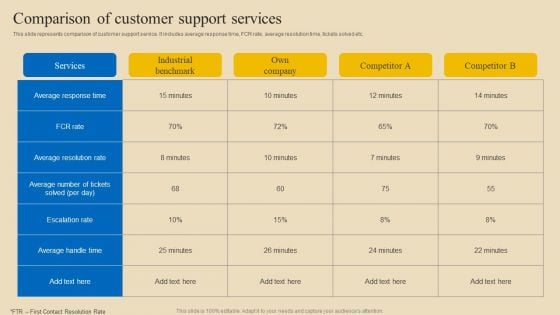
Implementing Digital Customer Service Comparison Of Customer Support Services Infographics PDF
This slide represents comparison of customer support service. It includes average response time, FCR rate, average resolution time, tickets solved etc. Want to ace your presentation in front of a live audience Our Implementing Digital Customer Service Comparison Of Customer Support Services Infographics PDF can help you do that by engaging all the users towards you. Slidegeeks experts have put their efforts and expertise into creating these impeccable powerpoint presentations so that you can communicate your ideas clearly. Moreover, all the templates are customizable, and easy-to-edit and downloadable. Use these for both personal and commercial use.
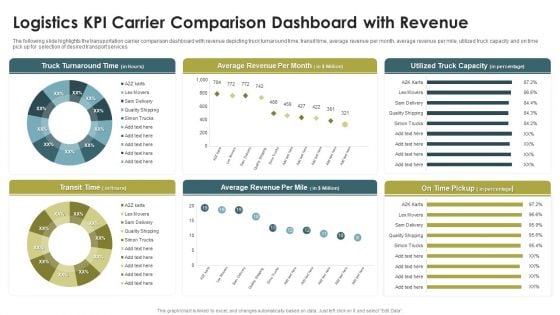
Logistics KPI Carrier Comparison Dashboard With Revenue Ppt Infographics Portfolio PDF
The following slide highlights the transportation carrier comparison dashboard with revenue depicting truck turnaround time, transit time, average revenue per month, average revenue per mile, utilized truck capacity and on time pick up for selection of desired transport services. Pitch your topic with ease and precision using this Logistics KPI Carrier Comparison Dashboard With Revenue Ppt Infographics Portfolio PDF. This layout presents information on Truck Turnaround Time, Average Revenue, Per Month, Transit Time. It is also available for immediate download and adjustment. So, changes can be made in the color, design, graphics or any other component to create a unique layout.
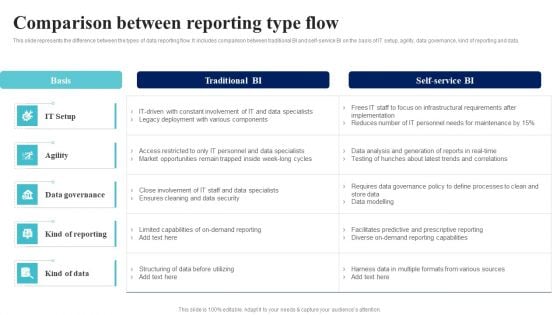
BI Implementation To Enhance Hiring Process Comparison Between Reporting Type Flow Infographics PDF
This slide represents the difference between the types of data reporting flow. It includes comparison between traditional BI and self-service BI on the basis of IT setup, agility, data governance, kind of reporting and data.Are you in need of a template that can accommodate all of your creative concepts This one is crafted professionally and can be altered to fit any style. Use it with Google Slides or PowerPoint. Include striking photographs, symbols, depictions, and other visuals. Fill, move around, or remove text boxes as desired. Test out color palettes and font mixtures. Edit and save your work, or work with colleagues. Download BI Implementation To Enhance Hiring Process Comparison Between Reporting Type Flow Infographics PDF and observe how to make your presentation outstanding. Give an impeccable presentation to your group and make your presentation unforgettable.
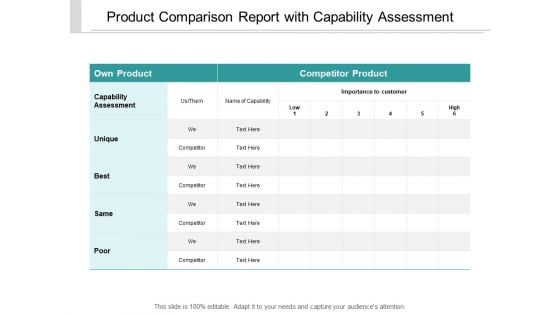
Product Comparison Report With Capability Assessment Ppt PowerPoint Presentation Infographic Template Graphics Template
Presenting this set of slides with name product comparison report with capability assessment ppt powerpoint presentation infographic template graphics template. The topics discussed in these slides are competition scorecard, competitors performance, competitors analysis. This is a completely editable PowerPoint presentation and is available for immediate download. Download now and impress your audience.
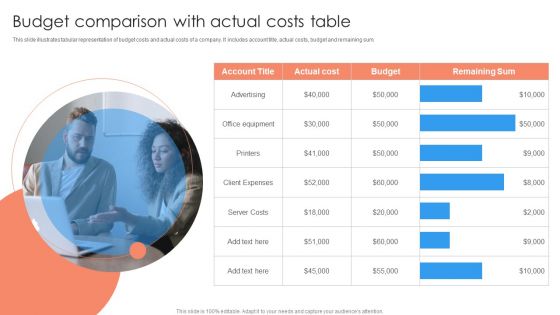
Budget Comparison With Actual Costs Table Ppt PowerPoint Presentation Infographic Template Graphics Pictures PDF
This slide illustrates tabular representation of budget costs and actual costs of a company. It includes account title, actual costs, budget and remaining sum.Showcasing this set of slides titled Budget Comparison With Actual Costs Table Ppt PowerPoint Presentation Infographic Template Graphics Pictures PDF. The topics addressed in these templates are Office Equipment, Client Expenses, Server Costs. All the content presented in this PPT design is completely editable. Download it and make adjustments in color, background, font etc. as per your unique business setting.
comparison shopify capital raising elevator pitch deck ppt infographic template pdf
This is a characteristics of shopifys multi channel commerce platform ppt model graphic images pdf template with various stages. Focus and dispense information on two stages using this creative set, that comes with editable features. It contains large content boxes to add your information on topics like men, women. You can also showcase facts, figures, and other relevant content using this PPT layout. Grab it now.
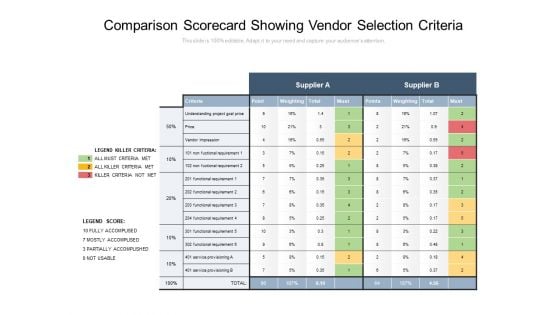
Comparison Scorecard Showing Vendor Selection Criteria Ppt PowerPoint Presentation Infographic Template Information PDF
Presenting this set of slides with name comparison scorecard showing vendor selection criteria ppt powerpoint presentation infographic template information pdf. The topics discussed in these slides are uderstanding project goal price, price, vendor impression, non fuctional requirement, service provisioning. This is a completely editable PowerPoint presentation and is available for immediate download. Download now and impress your audience.
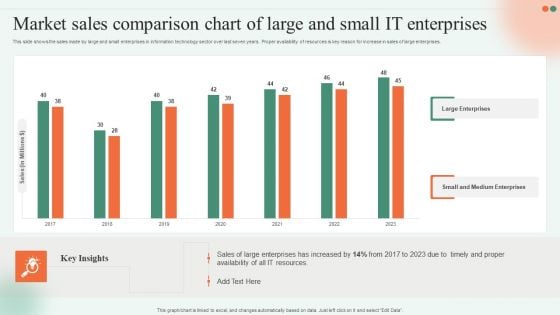
Market Sales Comparison Chart Of Large And Small IT Enterprises Ppt Infographic Template Background Image PDF
This slide shows the sales made by large and small enterprises in information technology sector over last seven years . Proper availability of resources is key reason for increase in sales of large enterprises. Showcasing this set of slides titled Market Sales Comparison Chart Of Large And Small IT Enterprises Ppt Infographic Template Background Image PDF. The topics addressed in these templates are Large Enterprises, Small And Medium, IT Resources. All the content presented in this PPT design is completely editable. Download it and make adjustments in color, background, font etc. as per your unique business setting.
Maintaining Customer Relations Financial Statement Comparison Productivity Metrics Ppt PowerPoint Presentation Infographics Graphic Images
This is a maintaining customer relations financial statement comparison productivity metrics ppt powerpoint presentation infographics graphic images. This is a six stage process. The stages in this process are maintaining customer relations, financial statement comparison, productivity metrics.

Comparison Management Marketing Ppt Powerpoint Presentation Infographics Graphics Tutorials Ppt Powerpoint Presentation File Slide
This is a comparison management marketing ppt powerpoint presentation infographics graphics tutorials ppt powerpoint presentation file slide. This is a three stage process. The stages in this process are finance, marketing, management, investment, analysis.
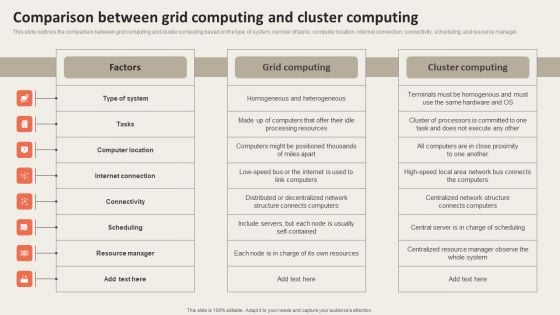
Grid Computing Applications Comparison Between Grid Computing And Cluster Infographics PDF
This slide outlines the comparison between grid computing and cluster computing based on the type of system, number of tasks, computer location, internet connection, connectivity, scheduling, and resource manager. Create an editable Grid Computing Applications Comparison Between Grid Computing And Cluster Infographics PDF that communicates your idea and engages your audience. Whether youre presenting a business or an educational presentation, pre designed presentation templates help save time. Grid Computing Applications Comparison Between Grid Computing And Cluster Infographics PDF is highly customizable and very easy to edit, covering many different styles from creative to business presentations. Slidegeeks has creative team members who have crafted amazing templates. So, go and get them without any delay.
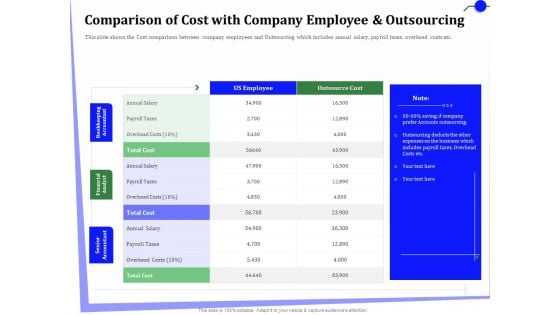
Outsourcing Finance Accounting Processes Comparison Of Cost Company Employee Outsourcing Infographics PDF
Presenting this set of slides with name outsourcing finance accounting processes comparison of cost company employee outsourcing infographics pdf. The topics discussed in these slides are bookkeeping accountant, financial analyst, senior accountant. This is a completely editable PowerPoint presentation and is available for immediate download. Download now and impress your audience.

API Comparison With Other API Developers Ppt Infographics Graphics Tutorials PDF
This slide covers the API Application Program Interface feature comparison with the competitors or developers which includes net platforms, non window platforms etc. Deliver an awe-inspiring pitch with this creative api comparison with other api developers ppt infographics graphics tutorials pdf bundle. Topics like every infinity feature represented, support non windows platforms, features organized into namespaces can be discussed with this completely editable template. It is available for immediate download depending on the needs and requirements of the user.
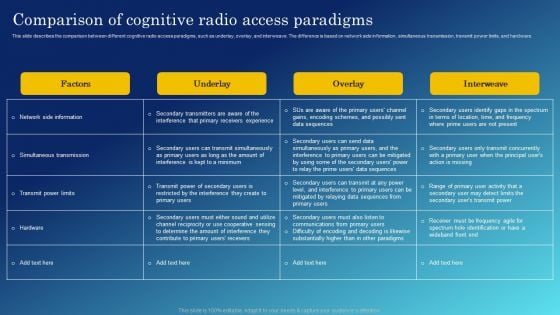
Cognitive Sensing Innovation Comparison Of Cognitive Radio Access Paradigms Infographics PDF
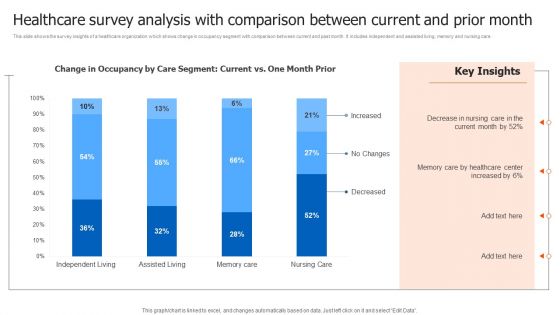
Healthcare Survey Analysis With Comparison Between Current And Prior Month Infographics PDF
This slide shows the survey insights of a healthcare organization which shows change in occupancy segment with comparison between current and past month. It includes independent and assisted living, memory and nursing care. Showcasing this set of slides titled Healthcare Survey Analysis With Comparison Between Current And Prior Month Infographics PDF. The topics addressed in these templates are Healthcare Survey Analysis, Comparison Between Current. All the content presented in this PPT design is completely editable. Download it and make adjustments in color, background, font etc. as per your unique business setting.
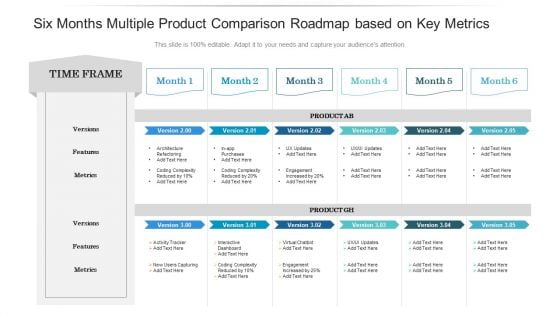
Six Months Multiple Product Comparison Roadmap Based On Key Metrics Infographics
Introducing our six months multiple product comparison roadmap based on key metrics infographics. This PPT presentation is Google Slides compatible, therefore, you can share it easily with the collaborators for measuring the progress. Also, the presentation is available in both standard screen and widescreen aspect ratios. So edit the template design by modifying the font size, font type, color, and shapes as per your requirements. As this PPT design is fully editable it can be presented in PDF, JPG and PNG formats.
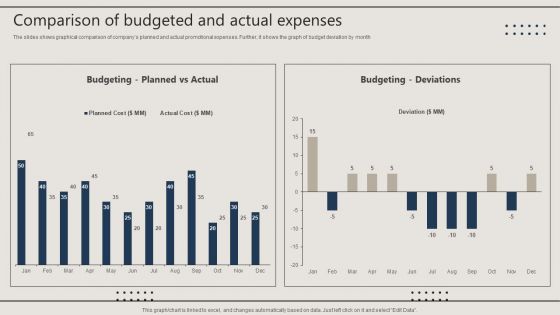
Promotion Techniques Used By B2B Firms Comparison Of Budgeted And Actual Expenses Infographics PDF
The slides shows graphical comparison of companys planned and actual promotional expenses. Further, it shows the graph of budget deviation by month. Do you know about Slidesgeeks Promotion Techniques Used By B2B Firms Comparison Of Budgeted And Actual Expenses Infographics PDF These are perfect for delivering any kind od presentation. Using it, create PowerPoint presentations that communicate your ideas and engage audiences. Save time and effort by using our pre designed presentation templates that are perfect for a wide range of topic. Our vast selection of designs covers a range of styles, from creative to business, and are all highly customizable and easy to edit. Download as a PowerPoint template or use them as Google Slides themes.

Utilizing Twitter For Social Media Comparison Matrix For Social Media Channels Infographics PDF
This slide indicates the matrix for the comparison of multiple social media channels on the basis of multiple parameters such as targeting specificity, impact on online traffic, follower growth, customer engagement etc. Are you in need of a template that can accommodate all of your creative concepts This one is crafted professionally and can be altered to fit any style. Use it with Google Slides or PowerPoint. Include striking photographs, symbols, depictions, and other visuals. Fill, move around, or remove text boxes as desired. Test out color palettes and font mixtures. Edit and save your work, or work with colleagues. Download Utilizing Twitter For Social Media Comparison Matrix For Social Media Channels Infographics PDF and observe how to make your presentation outstanding. Give an impeccable presentation to your group and make your presentation unforgettable.
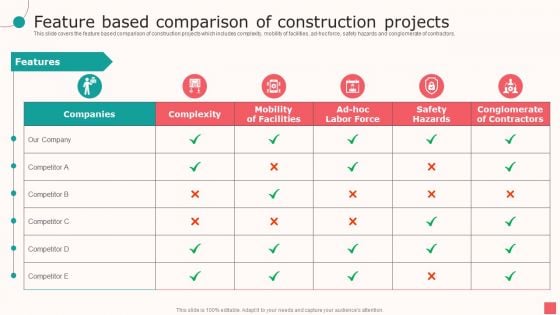
Real Estate Company Details Feature Based Comparison Of Construction Projects Ppt PowerPoint Presentation Infographic Template Display PDF
This slide covers the feature based comparison of construction projects which includes complexity, mobility of facilities, ad hoc force, safety hazards and conglomerate of contractors. Deliver an awe inspiring pitch with this creative Real Estate Company Details Feature Based Comparison Of Construction Projects Ppt PowerPoint Presentation Infographic Template Display PDF bundle. Topics like Mobility Facilities, Safety Hazards, Conglomerate Contractors can be discussed with this completely editable template. It is available for immediate download depending on the needs and requirements of the user.
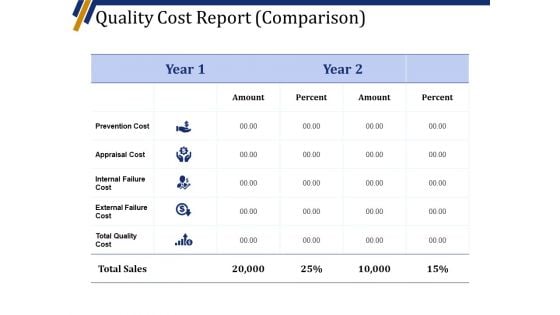
Quality Cost Report Comparison Template 1 Ppt PowerPoint Presentation Pictures Infographics
This is a quality cost report comparison template 1 ppt powerpoint presentation pictures infographics. This is a five stage process. The stages in this process are amount, percent, year, appraisal cost, prevention cost.
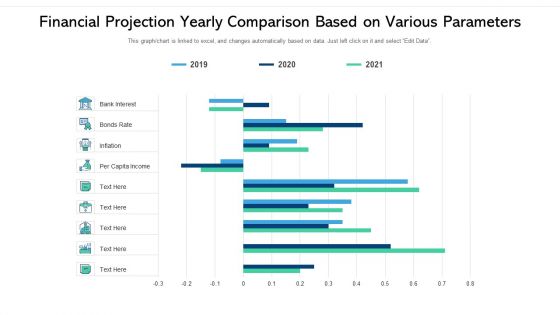
Financial Projection Yearly Comparison Based On Various Parameters Ppt Ideas Infographics PDF
Showcasing this set of slides titled financial projection yearly comparison based on various parameters ppt ideas infographics pdf. The topics addressed in these templates are financial projection yearly comparison based on various parameters. All the content presented in this PPT design is completely editable. Download it and make adjustments in color, background, font etc. as per your unique business setting.


 Continue with Email

 Home
Home


