Comparison Infographic
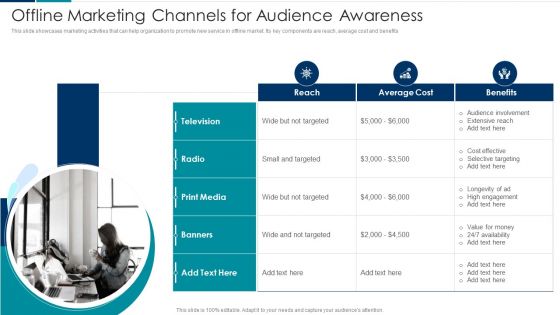
Managing New Service Roll Out And Marketing Procedure Offline Marketing Channels For Audience Awareness Infographics PDF
This slide showcases marketing activities that can help organization to promote new service in offline market. Its key components are reach, average cost and benefits. This is a Managing New Service Roll Out And Marketing Procedure Offline Marketing Channels For Audience Awareness Infographics PDF template with various stages. Focus and dispense information on three stages using this creative set, that comes with editable features. It contains large content boxes to add your information on topics like Average Cost, Benefits, Audience Involvement. You can also showcase facts, figures, and other relevant content using this PPT layout. Grab it now.
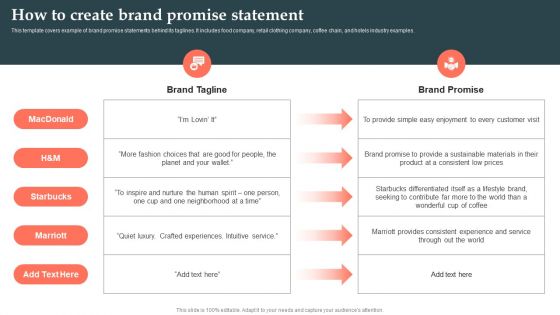
Product Launch Strategy How To Create Brand Promise Statement Ppt Infographics Styles PDF
This template covers example of brand promise statements behind its taglines. It includes food company, retail clothing company, coffee chain, and hotels industry examples. Do you know about Slidesgeeks Product Launch Strategy How To Create Brand Promise Statement Ppt Infographics Styles PDF These are perfect for delivering any kind od presentation. Using it, create PowerPoint presentations that communicate your ideas and engage audiences. Save time and effort by using our pre designed presentation templates that are perfect for a wide range of topic. Our vast selection of designs covers a range of styles, from creative to business, and are all highly customizable and easy to edit. Download as a PowerPoint template or use them as Google Slides themes.
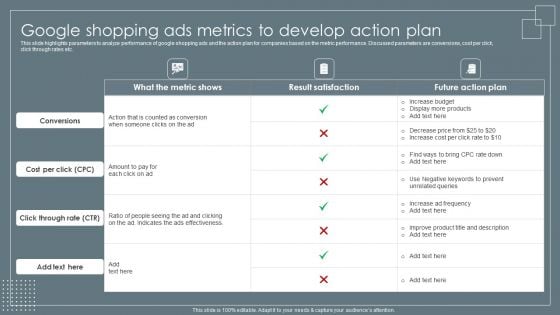
Google Shopping Ads Metrics To Develop Action Plan Retail Business Growth Marketing Techniques Infographics PDF
This slide highlights parameters to analyze performance of google shopping ads and the action plan for companies based on the metric performance. Discussed parameters are conversions, cost per click, click through rates etc. Slidegeeks is here to make your presentations a breeze with Google Shopping Ads Metrics To Develop Action Plan Retail Business Growth Marketing Techniques Infographics PDF With our easy to use and customizable templates, you can focus on delivering your ideas rather than worrying about formatting. With a variety of designs to choose from, youre sure to find one that suits your needs. And with animations and unique photos, illustrations, and fonts, you can make your presentation pop. So whether youre giving a sales pitch or presenting to the board, make sure to check out Slidegeeks first.
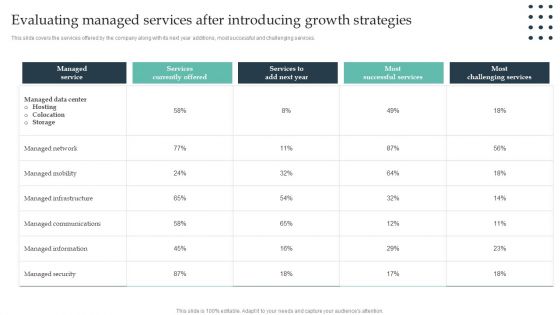
Enterprise Consumer Technology Management Evaluating Managed Services After Introducing Infographics PDF
This slide covers the services offered by the company along with its next year additions, most successful and challenging services. Coming up with a presentation necessitates that the majority of the effort goes into the content and the message you intend to convey. The visuals of a PowerPoint presentation can only be effective if it supplements and supports the story that is being told. Keeping this in mind our experts created Enterprise Consumer Technology Management Evaluating Managed Services After Introducing Infographics PDF to reduce the time that goes into designing the presentation. This way, you can concentrate on the message while our designers take care of providing you with the right template for the situation.
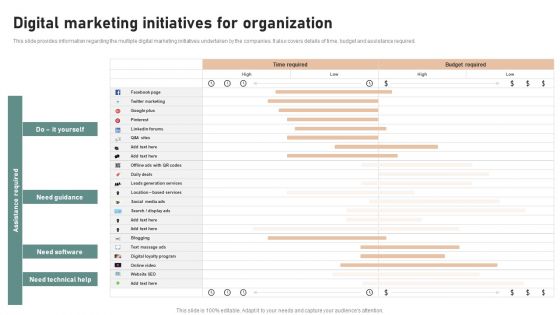
Utilizing Twitter For Social Media Digital Marketing Initiatives For Organization Infographics PDF
This slide provides information regarding the multiple digital marketing initiatives undertaken by the companies. It also covers details of time, budget and assistance required. Coming up with a presentation necessitates that the majority of the effort goes into the content and the message you intend to convey. The visuals of a PowerPoint presentation can only be effective if it supplements and supports the story that is being told. Keeping this in mind our experts created Utilizing Twitter For Social Media Digital Marketing Initiatives For Organization Infographics PDF to reduce the time that goes into designing the presentation. This way, you can concentrate on the message while our designers take care of providing you with the right template for the situation.

Retail Business Optimization Through Operational Excellence Strategy Our Retail Business Communication Infographics PDF
This slide portrays retail business communication mix that can be used by the company for delivering its brand message. Channels covered in the presentation are direct marketing, personal selling, advertising, PR and sales promotions. Slidegeeks is one of the best resources for PowerPoint templates. You can download easily and regulate Retail Business Optimization Through Operational Excellence Strategy Our Retail Business Communication Infographics PDF for your personal presentations from our wonderful collection. A few clicks is all it takes to discover and get the most relevant and appropriate templates. Use our Templates to add a unique zing and appeal to your presentation and meetings. All the slides are easy to edit and you can use them even for advertisement purposes.
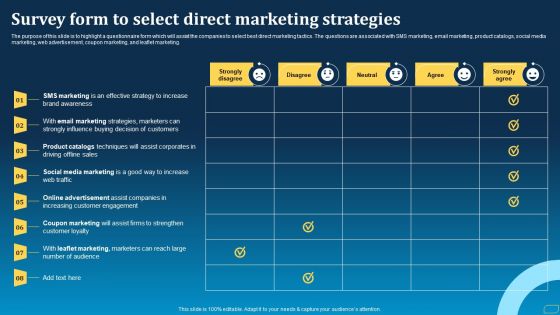
Direct Marketing Techniques To Enhance Business Presence Survey Form To Select Direct Marketing Strategies Infographics PDF
The purpose of this slide is to highlight a questionnaire form which will assist the companies to select best direct marketing tactics. The questions are associated with SMS marketing, email marketing, product catalogs, social media marketing, web advertisement, coupon marketing, and leaflet marketing. If your project calls for a presentation, then Slidegeeks is your go to partner because we have professionally designed, easy to edit templates that are perfect for any presentation. After downloading, you can easily edit Direct Marketing Techniques To Enhance Business Presence Survey Form To Select Direct Marketing Strategies Infographics PDF and make the changes accordingly. You can rearrange slides or fill them with different images. Check out all the handy templates
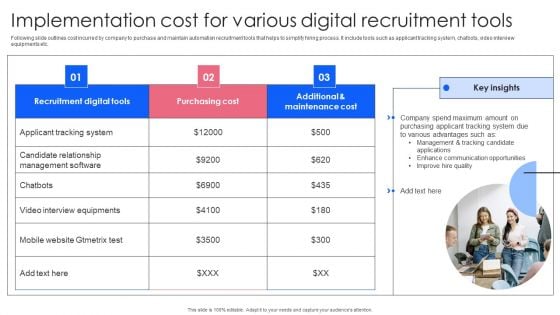
Effective Guide To Build Strong Online Hiring Strategy Implementation Cost For Various Digital Recruitment Infographics PDF
Following slide outlines cost incurred by company to purchase and maintain automation recruitment tools that helps to simplify hiring process. It include tools such as applicant tracking system, chatbots, video interview equipments etc. Want to ace your presentation in front of a live audience Our Effective Guide To Build Strong Online Hiring Strategy Implementation Cost For Various Digital Recruitment Infographics PDF can help you do that by engaging all the users towards you. Slidegeeks experts have put their efforts and expertise into creating these impeccable powerpoint presentations so that you can communicate your ideas clearly. Moreover, all the templates are customizable, and easy to edit and downloadable. Use these for both personal and commercial use.

Iot Device Management In Smart Homes Iot Device Management Infographics Pdf
This slide exhibits an overview of IoT device integration in managing and controlling home appliances. It covers components such as smart home devices, gateway, analytics, cloud, and mobile apps. There are so many reasons you need a Iot Device Management In Smart Homes Iot Device Management Infographics Pdf. The first reason is you can not spend time making everything from scratch, Thus, Slidegeeks has made presentation templates for you too. You can easily download these templates from our website easily. This slide exhibits an overview of IoT device integration in managing and controlling home appliances. It covers components such as smart home devices, gateway, analytics, cloud, and mobile apps.
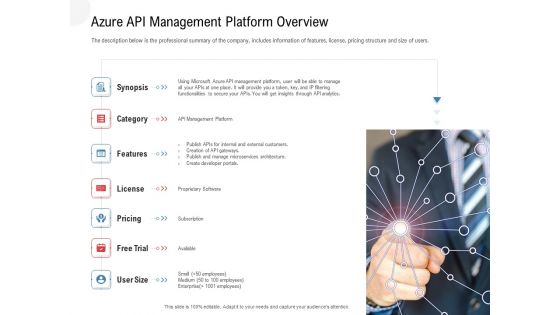
API Outline Azure API Management Platform Overview Ppt Infographics Summary PDF
The description below is the professional summary of the company, includes information of features, license, pricing structure and size of users. This is a api outline azure api management platform overview ppt infographics summary pdf template with various stages. Focus and dispense information on seven stages using this creative set, that comes with editable features. It contains large content boxes to add your information on topics like synopsis, category, features, license, pricing. You can also showcase facts, figures, and other relevant content using this PPT layout. Grab it now.

Wealthsimple Capital Raising Elevator Pitch Deck Why Choose Wealthsimple Infographics Pdf
This slide shows that why the users should choose Wealthsimple as their investment platform and what are some of the special features of Wealthsimple. This is a wealthsimple capital raising elevator pitch deck why choose wealthsimple infographics pdf template with various stages. Focus and dispense information on four stages using this creative set, that comes with editable features. It contains large content boxes to add your information on topics like powerful technology, powerful financial tools, standards available with security features. You can also showcase facts, figures, and other relevant content using this PPT layout. Grab it now.

Pitch Deck For Seed Funding Our Shopping Artificial Intelligence Chatbot Infographics PDF
This slide provides the glimpse about our shopping AI chatbot which have exclusive features such as conversational commerce, customer activation channel, etc. This is a pitch deck for seed funding our shopping artificial intelligence chatbot infographics pdf template with various stages. Focus and dispense information on two stages using this creative set, that comes with editable features. It contains large content boxes to add your information on topics like conversational commerce, customer activation channel. You can also showcase facts, figures, and other relevant content using this PPT layout. Grab it now.
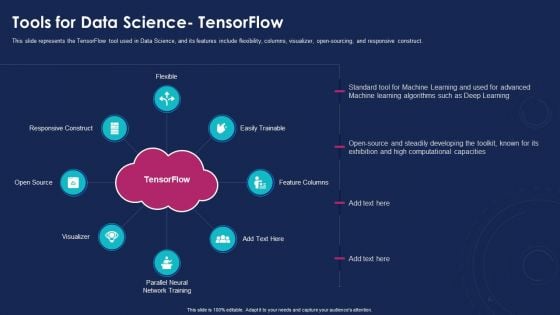
Data Analytics IT Tools For Data Science Tensorflow Ppt Infographics Styles PDF
This slide represents the TensorFlow tool used in Data Science, and its features include flexibility, columns, visualizer, open-sourcing, and responsive construct. Presenting data analytics it tools for data science tensorflow ppt infographics styles pdf to provide visual cues and insights. Share and navigate important information on eight stages that need your due attention. This template can be used to pitch topics like flexible, open source, visualizer, easily trainable, feature columns, responsive construct. In addtion, this PPT design contains high resolution images, graphics, etc, that are easily editable and available for immediate download.
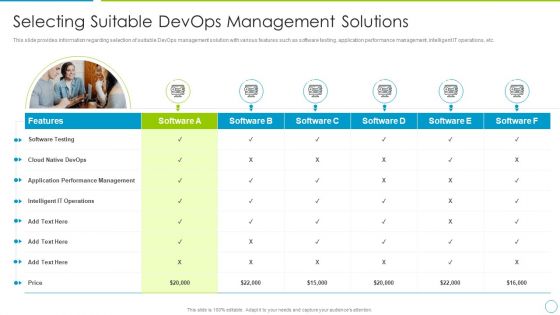
Comprehensive Development And Operations Adoption Initiatives IT Selecting Suitable Devops Infographics PDF
This slide provides information regarding selection of suitable DevOps management solution with various features such as software testing, application performance management, intelligent IT operations, etc. This is a comprehensive development and operations adoption initiatives it selecting suitable devops infographics pdf template with various stages. Focus and dispense information on one stages using this creative set, that comes with editable features. It contains large content boxes to add your information on topics like application, performance, management. You can also showcase facts, figures, and other relevant content using this PPT layout. Grab it now.
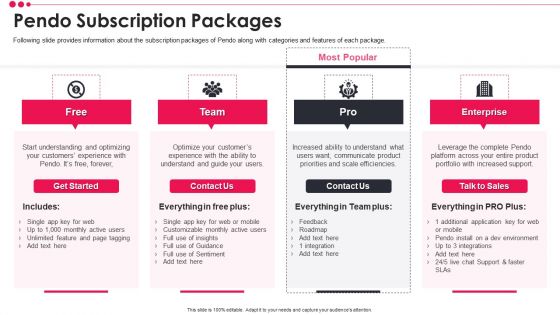
Pendo Venture Capital Financing Pitch Deck Pendo Subscription Packages Infographics PDF
Following slide provides information about the subscription packages of Pendo along with categories and features of each package. This is a pendo venture capital financing pitch deck pendo subscription packages infographics pdf template with various stages. Focus and dispense information on four stages using this creative set, that comes with editable features. It contains large content boxes to add your information on topics like optimizing, experience, ability, communicate, priorities. You can also showcase facts, figures, and other relevant content using this PPT layout. Grab it now.

Email Management Software Competitive Assessment Of Major Email Management Players Existing Infographics PDF
This slide caters details about competitive landscape of various competitors existing in email management market by comparing them on various parameters or features. This is a email management software competitive assessment of major email management players existing infographics pdf template with various stages. Focus and dispense information on four stages using this creative set, that comes with editable features. It contains large content boxes to add your information on topics like ticketing system, real time collision detection, automated workflows. You can also showcase facts, figures, and other relevant content using this PPT layout. Grab it now.
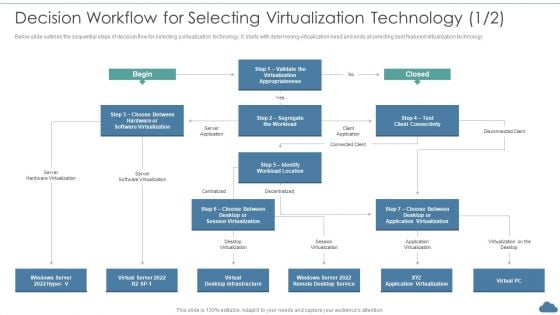
Cloud Optimization Infrastructure Model Decision Workflow For Selecting Virtualization Technology Infographics PDF
Below slide outlines the sequential steps of decision flow for selecting a virtualization technology. It starts with determining virtualization need and ends at selecting best featured virtualization technology.This is a Cloud Optimization Infrastructure Model Decision Workflow For Selecting Virtualization Technology Infographics PDF template with various stages. Focus and dispense information on one stage using this creative set, that comes with editable features. It contains large content boxes to add your information on topics like Virtualization Appropriateness, Software Virtualization, Desktop Infrastructure You can also showcase facts, figures, and other relevant content using this PPT layout. Grab it now.
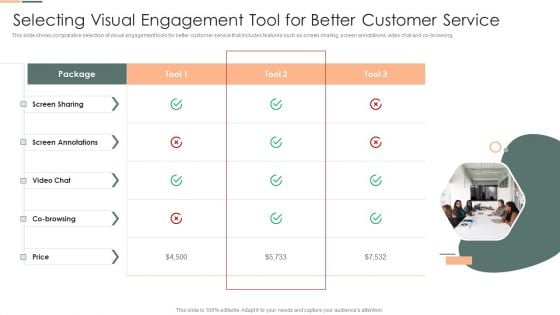
Developing Client Engagement Techniques Selecting Visual Engagement Tool For Better Customer Service Infographics PDF
This slide shows comparative selection of visual engagement tools for better customer service that includes features such as screen sharing, screen annotations, video chat and co browsing. This is a Developing Client Engagement Techniques Selecting Visual Engagement Tool For Better Customer Service Infographics PDF template with various stages. Focus and dispense information on three stages using this creative set, that comes with editable features. It contains large content boxes to add your information on topics like Price, Customer Service. You can also showcase facts, figures, and other relevant content using this PPT layout. Grab it now.
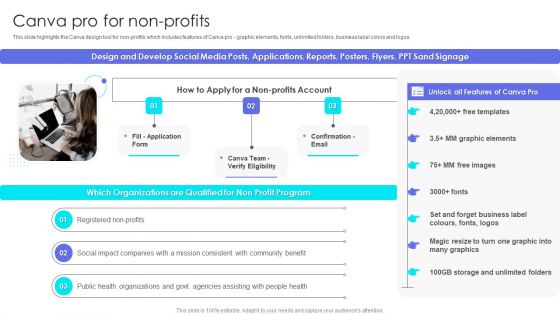
Canva Pro Business Profile Canva Pro For Non Profits Infographics PDF
This slide highlights the Canva design tool for non profits which includes features of Canva pro graphic elements, fonts, unlimited folders, business label colors and logos. This is a Canva Pro Business Profile Canva Pro For Non Profits Infographics PDF template with various stages. Focus and dispense information on three stages using this creative set, that comes with editable features. It contains large content boxes to add your information on topics like Application, Organizations, Business Label. You can also showcase facts, figures, and other relevant content using this PPT layout. Grab it now.
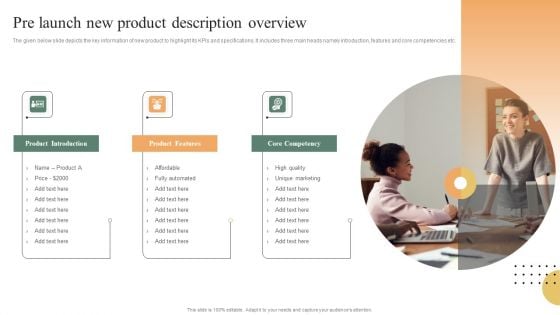
Pre Launch New Product Description Overview Ppt PowerPoint Presentation Gallery Infographics PDF
The given below slide depicts the key information of new product to highlight its KPIs and specifications. It includes three main heads namely introduction, features and core competencies etc. Persuade your audience using this Pre Launch New Product Description Overview Ppt PowerPoint Presentation Gallery Infographics PDF. This PPT design covers three stages, thus making it a great tool to use. It also caters to a variety of topics including Product Introduction, Product Features, Core Competency. Download this PPT design now to present a convincing pitch that not only emphasizes the topic but also showcases your presentation skills.
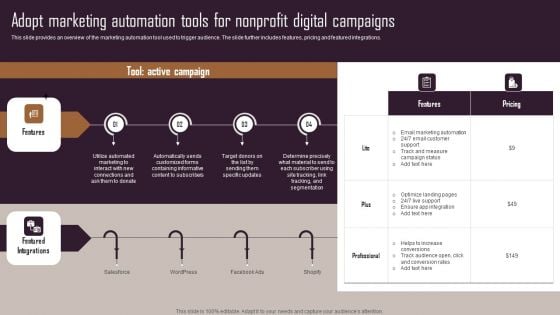
Effective NPO Promotional Strategies For Recruit Volunteers Adopt Marketing Automation Tools Nonprofit Infographics PDF
This slide provides an overview of the marketing automation tool used to trigger audience. The slide further includes features, pricing and featured integrations. Boost your pitch with our creative Effective NPO Promotional Strategies For Recruit Volunteers Adopt Marketing Automation Tools Nonprofit Infographics PDF. Deliver an awe-inspiring pitch that will mesmerize everyone. Using these presentation templates you will surely catch everyones attention. You can browse the ppts collection on our website. We have researchers who are experts at creating the right content for the templates. So you do not have to invest time in any additional work. Just grab the template now and use them.
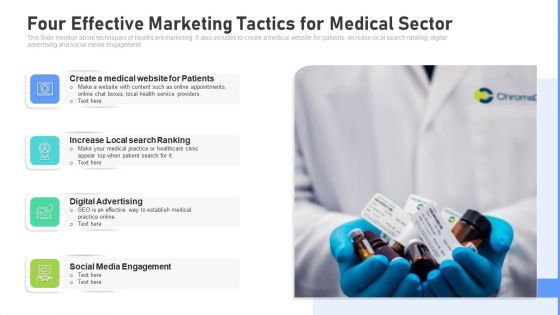
Four Effective Marketing Tactics For Medical Sector Ppt Infographics Design Templates PDF
This Slide mention about techniques of healthcare marketing. It also includes to create a medical website for patients, increase local search ranking, digital advertising and social media engagement. Pitch your topic with ease and precision using this four effective marketing tactics for medical sector ppt infographics design templates pdf. This layout presents information on engagement, appointments, service. It is also available for immediate download and adjustment. So, changes can be made in the color, design, graphics or any other component to create a unique layout.

Integrated Risk Management Methodology With Data Set Analysis Ppt PowerPoint Presentation Infographics Microsoft PDF
This slide covers different risk measurement approach that will help project managers to do historical loss analysis and scenario analysis. Pitch your topic with ease and precision using this integrated risk management methodology with data set analysis ppt powerpoint presentation infographics microsoft pdf. This layout presents information on historical loss analysis, severity distribution analysis, integration risk measure. It is also available for immediate download and adjustment. So, changes can be made in the color, design, graphics or any other component to create a unique layout.
Financial Budget Sheet For Effective Tracker And Planning Of Project Infographics PDF
This slide covers budget for a business project which helps the business in taking strategic decisions such as where to put money and where to cut expenses. Pitch your topic with ease and precision using this financial budget sheet for effective tracker and planning of project infographics pdf. This layout presents information on financial budget sheet for effective tracker and planning of project. It is also available for immediate download and adjustment. So, changes can be made in the color, design, graphics or any other component to create a unique layout.
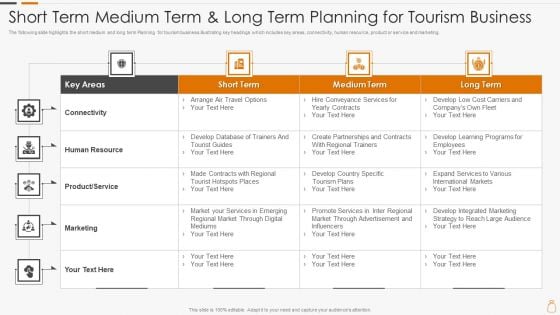
Short Term Medium Term And Long Term Planning For Tourism Business Infographics PDF
The following slide highlights the short medium and long term Planning for tourism business illustrating key headings which includes key areas, connectivity, human resource, product or service and marketing. Pitch your topic with ease and precision using this short term medium term and long term planning for tourism business infographics pdf. This layout presents information on connectivity, human resource, product or service, marketing. It is also available for immediate download and adjustment. So, changes can be made in the color, design, graphics or any other component to create a unique layout.
Paid Social Media Marketing Plan With Key Objectives Ppt PowerPoint Presentation Icon Infographics PDF
Following slide showcases an amazing paid plan to run marketing campaign on various social media platforms. It covers information about the objectives, social media platforms, tactics to be deployed, key metrics and target audience. Pitch your topic with ease and precision using this paid social media marketing plan with key objectives ppt powerpoint presentation icon infographics pdf. This layout presents information on social media platform, objective, tactics to be deployed, key metrics, target audience. It is also available for immediate download and adjustment. So, changes can be made in the color, design, graphics or any other component to create a unique layout.
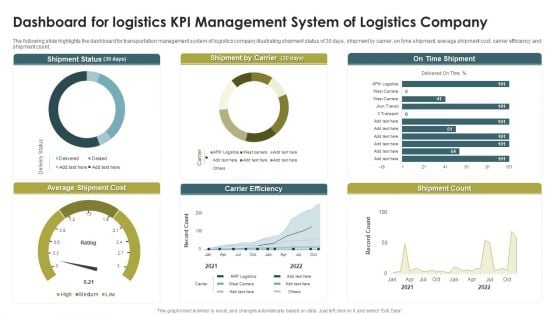
Dashboard For Logistics KPI Management System Of Logistics Company Infographics PDF
The following slide highlights the dashboard for transportation management system of logistics company illustrating shipment status of 30 days, shipment by carrier, on time shipment, average shipment cost, carrier efficiency and shipment count. Pitch your topic with ease and precision using this Dashboard For Logistics KPI Management System Of Logistics Company Infographics PDF. This layout presents information on Shipment Status, Shipment By Carrier, On Time Shipment. It is also available for immediate download and adjustment. So, changes can be made in the color, design, graphics or any other component to create a unique layout.
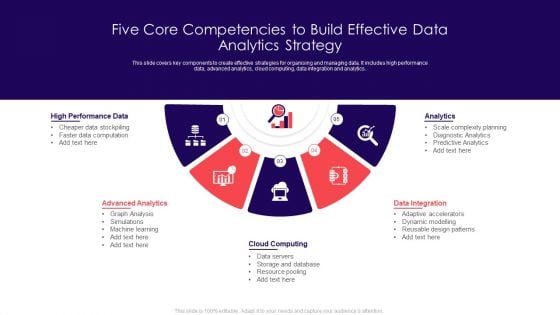
Five Core Competencies To Build Effective Data Analytics Strategy Infographics PDF
This slide covers key components to create effective strategies for organising and managing data. It includes high performance data, advanced analytics, cloud computing, data integration and analytics. Presenting Five Core Competencies To Build Effective Data Analytics Strategy Infographics PDF to dispense important information. This template comprises five stages. It also presents valuable insights into the topics including High Performance Data, Advanced Analytics, Cloud Computing. This is a completely customizable PowerPoint theme that can be put to use immediately. So, download it and address the topic impactfully.

How To Create A Customer Experience CX Strategystep 1 Communicate Your Service Philosophy Infographics PDF
All customer experiences should be geared towards meeting your core service philosophy. So before getting into service design, outline your service philosophy so that every component and interaction is designed to achieve those goals.Presenting How To Create A Customer Experience CX Strategystep 1 Communicate Your Service Philosophy Infographics PDF to provide visual cues and insights. Share and navigate important information on four stages that need your due attention. This template can be used to pitch topics like Think Customer, Beyond Service, Earn Trust. In addtion, this PPT design contains high resolution images, graphics, etc, that are easily editable and available for immediate download.
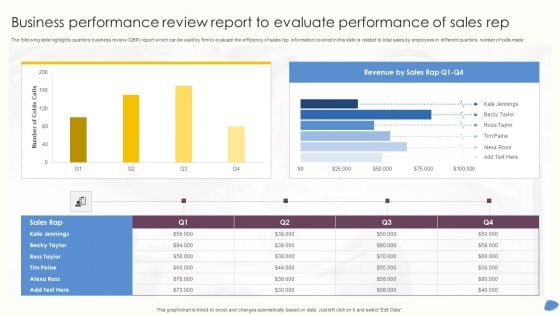
Business Performance Review Report To Evaluate Performance Of Sales Rep Infographics PDF
The following slide highlights quarterly business review QBR report which can be used by firm to evaluate the efficiency of sales rep. information covered in this slide is related to total sales by employees in different quarters, number of calls made. Pitch your topic with ease and precision using this Business Performance Review Report To Evaluate Performance Of Sales Rep Infographics PDF. This layout presents information on Revenue Sales, Tim Paine, Number Colds Calls. It is also available for immediate download and adjustment. So, changes can be made in the color, design, graphics or any other component to create a unique layout.
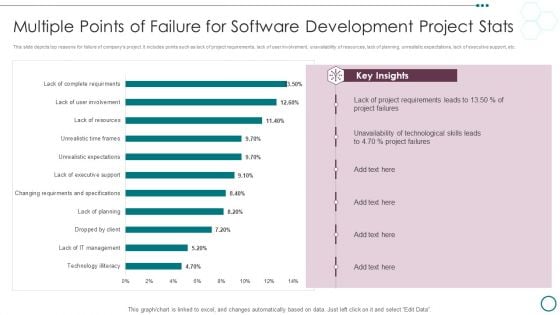
Multiple Points Of Failure For Software Development Project Stats Ppt PowerPoint Presentation Infographics Slides PDF
This slide depicts top reasons for failure of companys project. It includes points such as lack of project requirements, lack of user involvement, unavailability of resources, lack of planning, unrealistic expectations, lack of executive support, etc.Pitch your topic with ease and precision using this Multiple Points Of Failure For Software Development Project Stats Ppt PowerPoint Presentation Infographics Slides PDF. This layout presents information on Project Requirements, Unavailability Technological, Project Failures. It is also available for immediate download and adjustment. So, changes can be made in the color, design, graphics or any other component to create a unique layout.
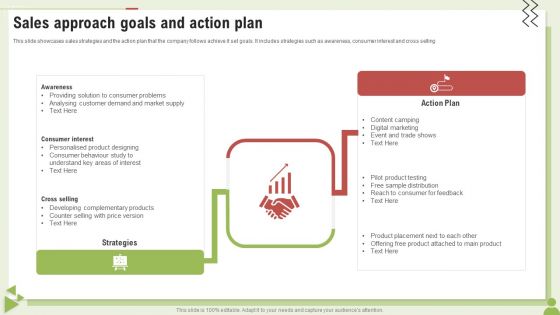
Sales Approach Goals And Action Plan Ppt PowerPoint Presentation Infographics Topics PDF
This slide showcases sales strategies and the action plan that the company follows achieve it set goals. It includes strategies such as awareness, consumer interest and cross selling.Pitch your topic with ease and precision using this Sales Approach Goals And Action Plan Ppt PowerPoint Presentation Infographics Topics PDF. This layout presents information on Awareness, Consumer Interest, Cross Selling . It is also available for immediate download and adjustment. So, changes can be made in the color, design, graphics or any other component to create a unique layout.
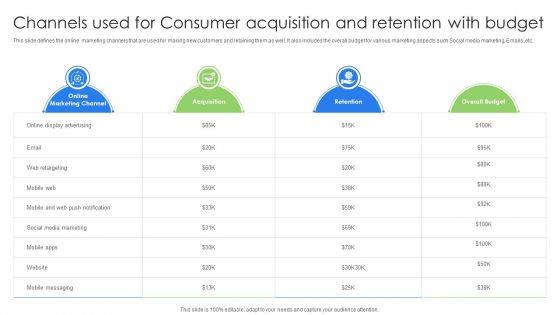
Channels Used For Consumer Acquisition And Retention With Budget Infographics PDF
This slide defines the online marketing channels that are used for making new customers and retaining them as well. It also includes the overall budget for various marketing aspects such Social media marketing, Emails ,etc. Pitch your topic with ease and precision using this Channels Used For Consumer Acquisition And Retention With Budget Infographics PDF. This layout presents information on Online Marketing Channel, Acquisition, Overall Budget . It is also available for immediate download and adjustment. So, changes can be made in the color, design, graphics or any other component to create a unique layout.

Kpis To Measure International Growth Performance Ppt Infographics Graphic Tips PDF
This slide shows various KPIs which can be used to evaluate international growth performance. It includes revenue, e-commerce conversion rate, cost per acquisition, bounce rate, etc. Pitch your topic with ease and precision using this Kpis To Measure International Growth Performance Ppt Infographics Graphic Tips PDF. This layout presents information on Revenue, Cost Per Acquisition, Bounce Rate. It is also available for immediate download and adjustment. So, changes can be made in the color, design, graphics or any other component to create a unique layout.
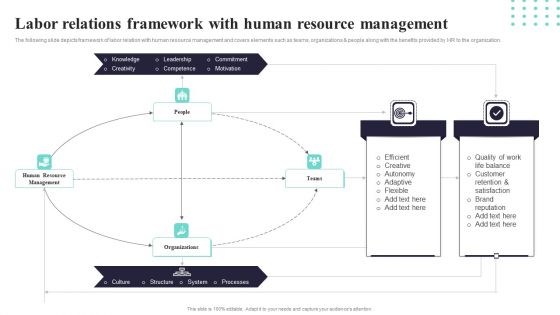
Labor Relations Framework With Human Resource Management Ppt PowerPoint Presentation Gallery Infographics PDF
The following slide depicts framework of labor relation with human resource management and covers elements such as teams, organizations and people along with the benefits provided by HR to the organization. Pitch your topic with ease and precision using this Labor Relations Framework With Human Resource Management Ppt PowerPoint Presentation Gallery Infographics PDF. This layout presents information on Knowledge, Leadership, Commitment. It is also available for immediate download and adjustment. So, changes can be made in the color, design, graphics or any other component to create a unique layout.
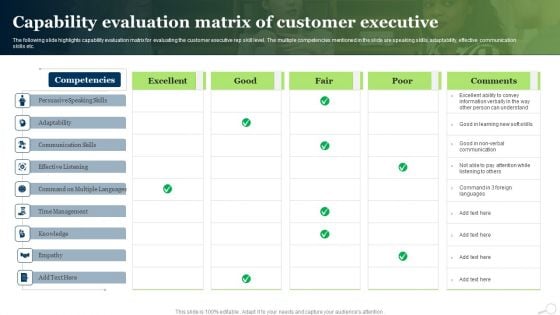
Capability Evaluation Matrix Of Customer Executive Ppt PowerPoint Presentation Infographics Influencers PDF
The following slide highlights capability evaluation matrix for evaluating the customer executive rep skill level. The multiple competencies mentioned in the slide are speaking skills, adaptability, effective communication skills etc.Pitch your topic with ease and precision using this Capability Evaluation Matrix Of Customer Executive Ppt PowerPoint Presentation Infographics Influencers PDF. This layout presents information on Communication Skills, Persuasive Speaking, Command Multiple. It is also available for immediate download and adjustment. So, changes can be made in the color, design, graphics or any other component to create a unique layout.
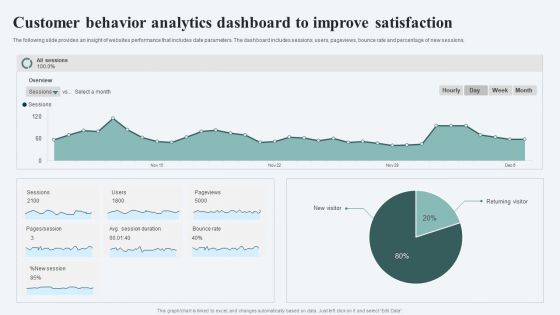
Customer Behavior Analytics Dashboard To Improve Satisfaction Ppt File Infographics PDF
The following slide provides an insight of websites performance that includes date parameters. The dashboard includes sessions, users, pageviews, bounce rate and percentage of new sessions. Pitch your topic with ease and precision using this Customer Behavior Analytics Dashboard To Improve Satisfaction Ppt File Infographics PDF. This layout presents information on Session, Avg Session Duration, Bounce Rate. It is also available for immediate download and adjustment. So, changes can be made in the color, design, graphics or any other component to create a unique layout.
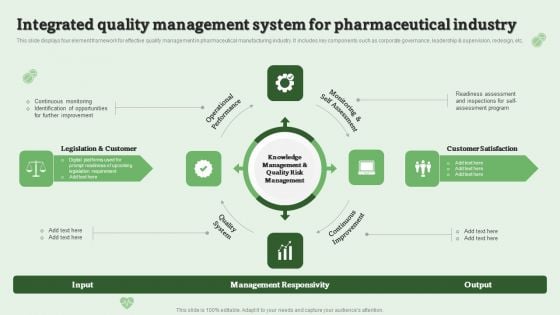
Integrated Quality Management System For Pharmaceutical Industry Ppt PowerPoint Presentation Infographics Backgrounds PDF
This slide displays four element framework for effective quality management in pharmaceutical manufacturing industry. It includes key components such as corporate governance, leadership and supervision, redesign, etc. Persuade your audience using this Integrated Quality Management System For Pharmaceutical Industry Ppt PowerPoint Presentation Infographics Backgrounds PDF. This PPT design covers four stages, thus making it a great tool to use. It also caters to a variety of topics including Operational Performance, Legislation Customer, Customer Satisfaction. Download this PPT design now to present a convincing pitch that not only emphasizes the topic but also showcases your presentation skills.
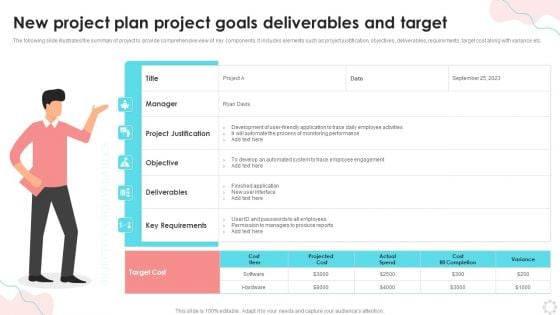
New Project Plan Project Goals Deliverables And Target Ppt PowerPoint Presentation Infographics Graphics Download PDF
The following slide illustrates the summary of project to provide comprehensive view of key components. It includes elements such as project justification, objectives, deliverables, requirements, target cost along with variance etc. Showcasing this set of slides titled New Project Plan Project Goals Deliverables And Target Ppt PowerPoint Presentation Infographics Graphics Download PDF. The topics addressed in these templates are Monitoring Performance, Key Requirements, Permission Managers. All the content presented in this PPT design is completely editable. Download it and make adjustments in color, background, font etc. as per your unique business setting.

5S Lean Production Strategies Audit Sheet For Safety Ppt Infographics Graphics Template PDF
This slide defines the 5s lean safety audit sheet for an organization. It includes information related observations, remarks and suggestions along with the scores. Pitch your topic with ease and precision using this 5S Lean Production Strategies Audit Sheet For Safety Ppt Infographics Graphics Template PDF. This layout presents information on Remarks And Suggestion, Safety Equipment, Extinguishers Available. It is also available for immediate download and adjustment. So, changes can be made in the color, design, graphics or any other component to create a unique layout.
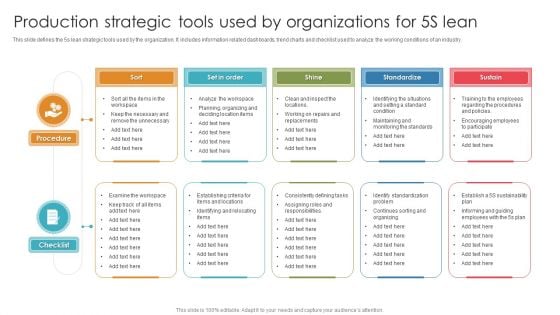
Production Strategic Tools Used By Organizations For 5S Lean Ppt Infographics Microsoft PDF
This slide defines the 5s lean strategic tools used by the organization. It includes information related dashboards, trend charts and checklist used to analyze the working conditions of an industry. Pitch your topic with ease and precision using this Production Strategic Tools Used By Organizations For 5S Lean Ppt Infographics Microsoft PDF. This layout presents information on Procedure, Checklist, Standardize. It is also available for immediate download and adjustment. So, changes can be made in the color, design, graphics or any other component to create a unique layout.
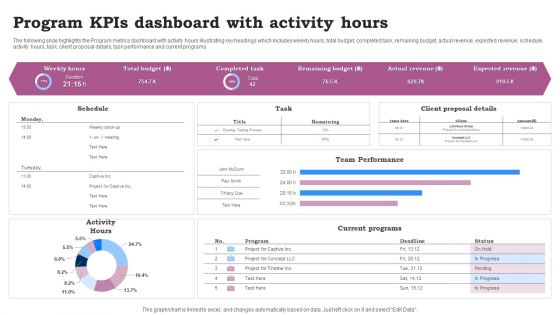
Program Kpis Dashboard With Activity Hours Ppt Infographics Clipart Images PDF
The following slide highlights the Program metrics dashboard with activity hours illustrating key headings which includes weekly hours, total budget, completed task, remaining budget, actual revenue, expected revenue, schedule, activity hours, task, client proposal details, task performance and current programs. Pitch your topic with ease and precision using this Program Kpis Dashboard With Activity Hours Ppt Infographics Clipart Images PDF. This layout presents information on Team Performance, Current Programs, Activity Hours. It is also available for immediate download and adjustment. So, changes can be made in the color, design, graphics or any other component to create a unique layout.
Three Months New Technical Officer Manager Plan Ppt Icon Infographics PDF
This slide shows 3 months plan for new chief technical officer to make improvements in technical side. It includes 30 60 90 days activities like getting familiar to employees, monitoring progress and making reports. Pitch your topic with ease and precision using this Three Months New Technical Officer Manager Plan Ppt Icon Infographics PDF. This layout presents information on First 30 Days, 30 60 Days,60 90 Days. It is also available for immediate download and adjustment. So, changes can be made in the color, design, graphics or any other component to create a unique layout.
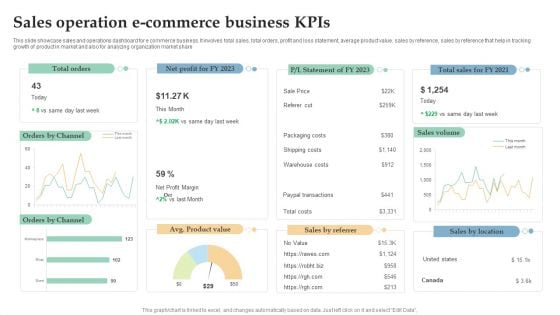
Sales Operation E Commerce Business Kpis Ppt Infographics Design Templates PDF
This slide showcase sales and operations dashboard for e commerce business. It involves total sales, total orders, profit and loss statement, average product value, sales by reference, sales by reference that help in tracking growth of product in market and also for analyzing organization market share. Pitch your topic with ease and precision using this Sales Operation E Commerce Business Kpis Ppt Infographics Design Templates PDF. This layout presents information on Total Orders, Sales Volume, Orders Channel. It is also available for immediate download and adjustment. So, changes can be made in the color, design, graphics or any other component to create a unique layout.
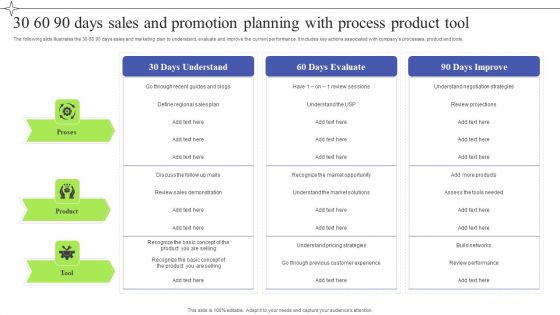
30 60 90 Days Sales And Promotion Planning With Process Product Tool Infographics PDF
The following slide illustrates the 30 60 90 days sales and marketing plan to understand, evaluate and improve the current performance. It includes key actions associated with companys processes, product and tools. Pitch your topic with ease and precision using this 30 60 90 Days Sales And Promotion Planning With Process Product Tool Infographics PDF. This layout presents information on 30 60 90 Days, Sales Promotion Planning, Process Product Tool. It is also available for immediate download and adjustment. So, changes can be made in the color, design, graphics or any other component to create a unique layout.
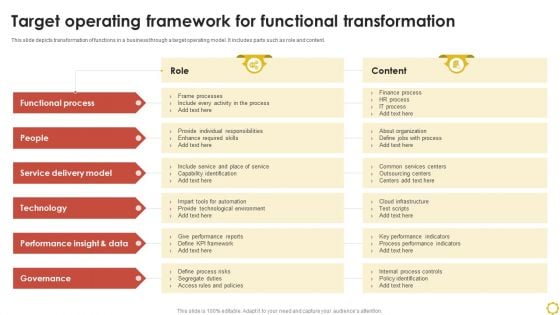
Target Operating Framework For Functional Transformation Ppt Infographics Example Topics PDF
This slide depicts transformation of functions in a business through a target operating model. It includes parts such as role and content. Pitch your topic with ease and precision using this Target Operating Framework For Functional Transformation Ppt Infographics Example Topics PDF. This layout presents information on Functional Process, Service Delivery Model, Performance, Insight And Data. It is also available for immediate download and adjustment. So, changes can be made in the color, design, graphics or any other component to create a unique layout.
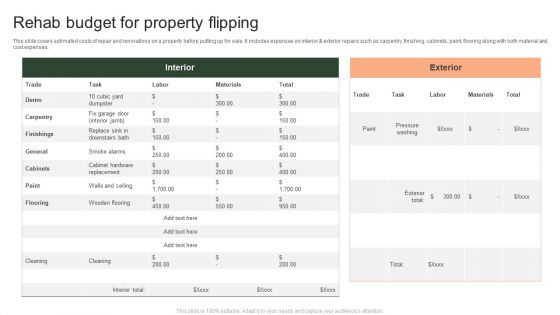
Rehab Budget For Property Flipping Ppt PowerPoint Presentation File Infographics PDF
This slide covers estimated costs of repair and renovations on a property before putting up for sale. It includes expenses on interior AND exterior repairs such as carpentry, finishing, cabinets, paint, flooring along with both material and cost expenses. Pitch your topic with ease and precision using this Rehab Budget For Property Flipping Ppt PowerPoint Presentation File Infographics PDF. This layout presents information on Interior, Exterior, Trade. It is also available for immediate download and adjustment. So, changes can be made in the color, design, graphics or any other component to create a unique layout.
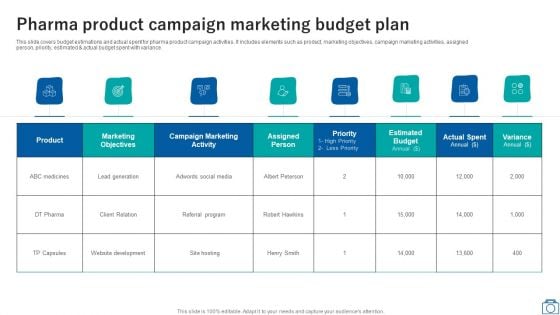
Pharma Product Campaign Marketing Budget Plan Ppt Visual Aids Infographics PDF
This slide covers budget estimations and actual spent for pharma product campaign activities. It includes elements such as product, marketing objectives, campaign marketing activities, assigned person, priority, estimated and actual budget spent with variance. Pitch your topic with ease and precision using this Pharma Product Campaign Marketing Budget Plan Ppt Visual Aids Infographics PDF. This layout presents information on Marketing Objectives, Product, Campaign Marketing Activity. It is also available for immediate download and adjustment. So, changes can be made in the color, design, graphics or any other component to create a unique layout.
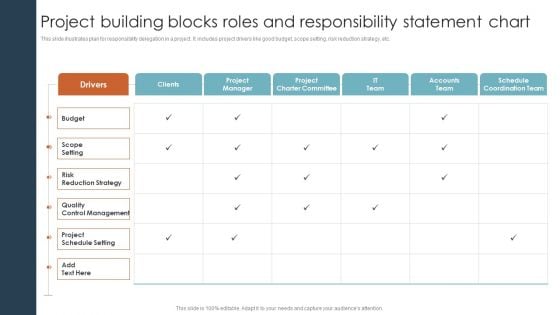
Project Building Blocks Roles And Responsibility Statement Chart Ppt Infographics Ideas PDF
This slide illustrates plan for responsibility delegation in a project. It includes project drivers like good budget, scope setting, risk reduction strategy, etc. Pitch your topic with ease and precision using this Project Building Blocks Roles And Responsibility Statement Chart Ppt Infographics Ideas PDF. This layout presents information on Scope Setting, Risk Reduction Strategy, Quality Control Management. It is also available for immediate download and adjustment. So, changes can be made in the color, design, graphics or any other component to create a unique layout.
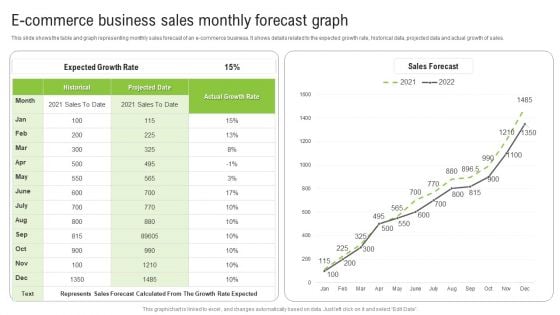
E Commerce Business Sales Monthly Forecast Graph Ppt Infographics Show PDF
This slide shows the table and graph representing monthly sales forecast of an e-commerce business. It shows details related to the expected growth rate, historical data, projected data and actual growth of sales. Pitch your topic with ease and precision using this E Commerce Business Sales Monthly Forecast Graph Ppt Infographics Show PDF. This layout presents information on Expected Growth Rate, Historical, Actual Growth Rate. It is also available for immediate download and adjustment. So, changes can be made in the color, design, graphics or any other component to create a unique layout.
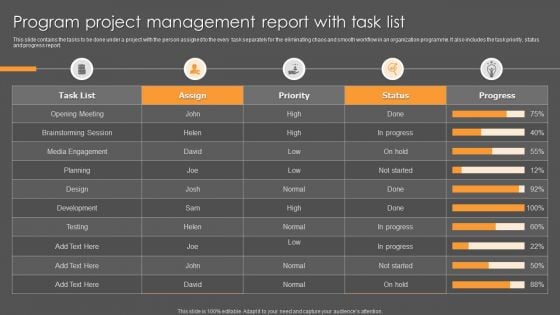
Program Project Management Report With Task List Ppt Infographics Examples PDF
This slide contains the tasks to be done under a project with the person assigned to the every task separately for the eliminating chaos and smooth workflow in an organization programme. It also includes the task priority, status and progress report. Pitch your topic with ease and precision using this Program Project Management Report With Task List Ppt Infographics Examples PDF. This layout presents information on Opening Meeting, Brainstorming Session, Media Engagement. It is also available for immediate download and adjustment. So, changes can be made in the color, design, graphics or any other component to create a unique layout.
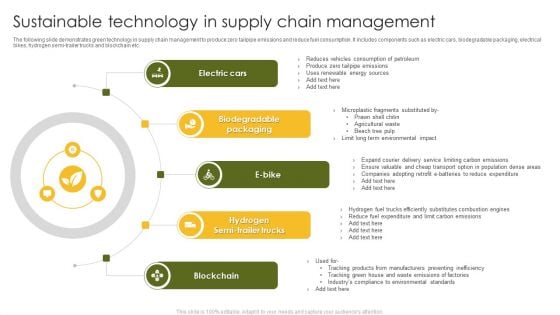
Sustainable Technology In Supply Chain Management Ppt Infographics Clipart Images PDF
The following slide demonstrates green technology in supply chain management to produce zero tailpipe emissions and reduce fuel consumption. It includes components such as electric cars, biodegradable packaging, electrical bikes, hydrogen semi-trailer trucks and blockchain etc. Persuade your audience using this Sustainable Technology In Supply Chain Management Ppt Infographics Clipart Images PDF. This PPT design covers five stages, thus making it a great tool to use. It also caters to a variety of topics including Electric Cars, Blockchain, Biodegradable Packaging. Download this PPT design now to present a convincing pitch that not only emphasizes the topic but also showcases your presentation skills.
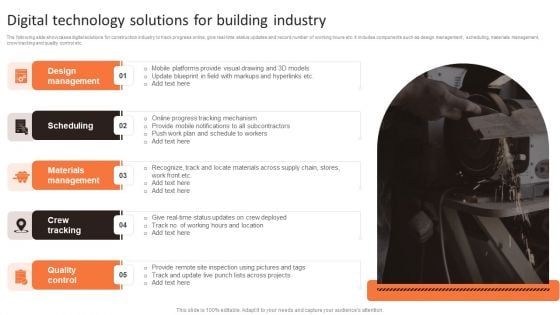
Digital Technology Solutions For Building Industry Ppt PowerPoint Presentation File Infographics PDF
The following slide showcases digital solutions for construction industry to track progress online, give real-time status updates and record number of working hours etc. It includes components such as design management, scheduling, materials management, crew tracking and quality control etc. Showcasing this set of slides titled Digital Technology Solutions For Building Industry Ppt PowerPoint Presentation File Infographics PDF. The topics addressed in these templates are Design Management, Scheduling, Materials Management. All the content presented in this PPT design is completely editable. Download it and make adjustments in color, background, font etc. as per your unique business setting.
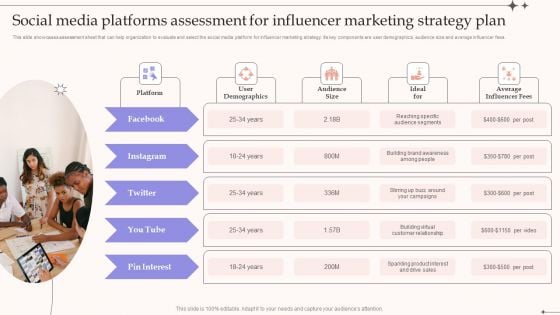
Social Media Platforms Assessment For Influencer Marketing Strategy Plan Infographics PDF
This slide showcases assessment sheet that can help organization to evaluate and select the social media platform for influencer marketing strategy. Its key components are user demographics, audience size and average influencer fees.Presenting Social Media Platforms Assessment For Influencer Marketing Strategy Plan Infographics PDF to dispense important information. This template comprises five stages. It also presents valuable insights into the topics including Demographics, Average Influencer, Audience Segments. This is a completely customizable PowerPoint theme that can be put to use immediately. So, download it and address the topic impactfully.
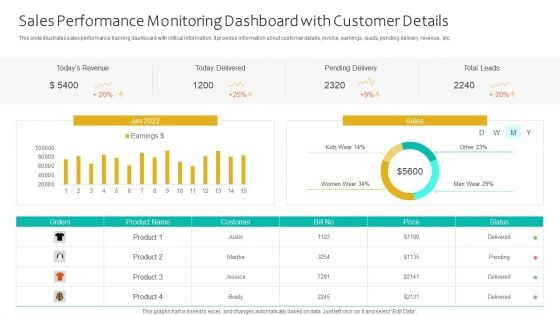
Sales Performance Monitoring Dashboard With Customer Details Ppt Infographics Themes PDF
This slide illustrates sales performance tracking dashboard with critical information. It provides information about customer details, invoice, earnings, leads, pending delivery, revenue, etc. Pitch your topic with ease and precision using this Sales Performance Monitoring Dashboard With Customer Details Ppt Infographics Themes PDF. This layout presents information on Todays Revenue, Today Delivered, Pending Delivery, Total Leads. It is also available for immediate download and adjustment. So, changes can be made in the color, design, graphics or any other component to create a unique layout.
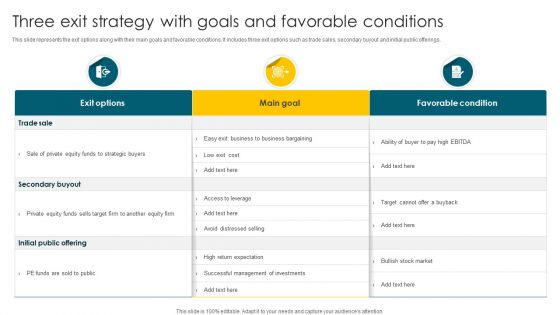
Three Exit Strategy With Goals And Favorable Conditions Ppt Infographics Microsoft PDF
This slide represents the exit options along with their main goals and favorable conditions. It includes three exit options such as trade sales, secondary buyout and initial public offerings. Pitch your topic with ease and precision using this Three Exit Strategy With Goals And Favorable Conditions Ppt Infographics Microsoft PDF. This layout presents information on Exit Options, Main Goal, Favorable Condition. It is also available for immediate download and adjustment. So, changes can be made in the color, design, graphics or any other component to create a unique layout.
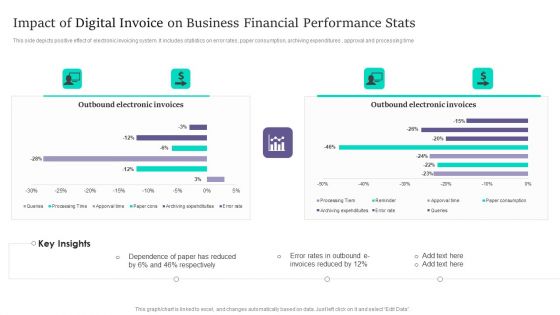
Impact Of Digital Invoice On Business Financial Performance Stats Infographics PDF
This side depicts positive effect of electronic invoicing system. It includes statistics on error rates, paper consumption, archiving expenditures , approval and processing time. Pitch your topic with ease and precision using this Impact Of Digital Invoice On Business Financial Performance Stats Infographics PDF. This layout presents information on Impact Of Digital Invoice, Business Financial Performance Stats. It is also available for immediate download and adjustment. So, changes can be made in the color, design, graphics or any other component to create a unique layout.
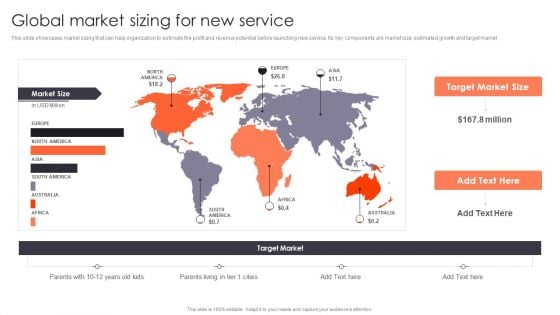
Promotion Strategies For New Service Launch Global Market Sizing For New Service Infographics PDF
This slide showcases market sizing that can help organization to estimate the profit and revenue potential before launching new service. Its key components are market size, estimated growth and target market. Take your projects to the next level with our ultimate collection of Promotion Strategies For New Service Launch Global Market Sizing For New Service Infographics PDF. Slidegeeks has designed a range of layouts that are perfect for representing task or activity duration, keeping track of all your deadlines at a glance. Tailor these designs to your exact needs and give them a truly corporate look with your own brand colors they will make your projects stand out from the rest.
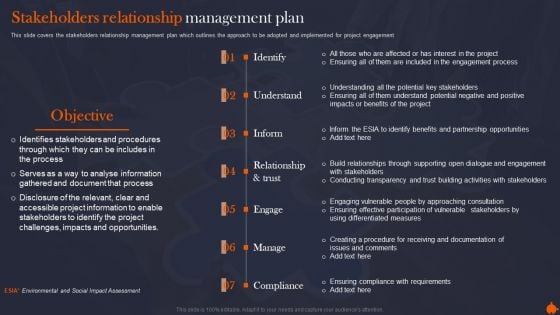
Stakeholders Relationship Organize Supervise And Enhance Relationships With Shareholders Infographics PDF
This slide covers the stakeholders relationship management plan which outlines the approach to be adopted and implemented for project engagement.This Stakeholders Relationship Organize Supervise And Enhance Relationships With Shareholders Infographics PDF from Slidegeeks makes it easy to present information on your topic with precision. It provides customization options, so you can make changes to the colors, design, graphics, or any other component to create a unique layout. It is also available for immediate download, so you can begin using it right away. Slidegeeks has done good research to ensure that you have everything you need to make your presentation stand out. Make a name out there for a brilliant performance.
Issues Tracking Dashboard For Organizational Building Management Ppt Infographics Topics PDF
This slide showcases dashboard which can help organization to keep track of issues plus faults during facility management and rectify them within stipulated time. Its key elements are issues reported, fault tracking, etc. Pitch your topic with ease and precision using this Issues Tracking Dashboard For Organizational Building Management Ppt Infographics Topics PDF. This layout presents information on Fault Tracking, Issues Reported, Location. It is also available for immediate download and adjustment. So, changes can be made in the color, design, graphics or any other component to create a unique layout.


 Continue with Email

 Home
Home


