Competitive Landscape
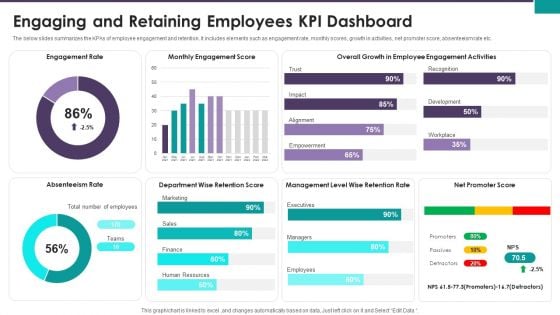
Engaging And Retaining Employees KPI Dashboard Ppt Slides Show PDF
The below slides summarizes the KPAs of employee engagement and retention. It includes elements such as engagement rate, monthly scores, growth in activities, net promoter score, absenteeism rate etc. Pitch your topic with ease and precision using this Engaging And Retaining Employees KPI Dashboard Ppt Slides Show PDF. This layout presents information on Engagement Rate Monthly, Engagement Score Overall, Growth Employee Engagement. It is also available for immediate download and adjustment. So, changes can be made in the color, design, graphics or any other component to create a unique layout.
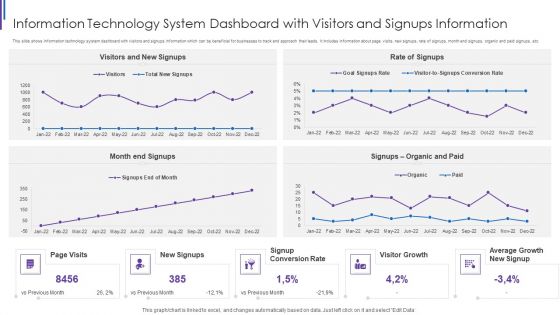
Information Technology System Dashboard With Visitors And Signups Information Guidelines PDF
This slide shows information technology system dashboard with visitors and signups information which can be beneficial for businesses to track and approach their leads. It includes information about page visits, new signups, rate of signups, month end signups, organic and paid signups, etc. Showcasing this set of slides titled Information Technology System Dashboard With Visitors And Signups Information Guidelines PDF. The topics addressed in these templates are Rate Of Signups, Month End Signups, Signup Conversion Rate, Visitors And New. All the content presented in this PPT design is completely editable. Download it and make adjustments in color, background, font etc. as per your unique business setting.
Essential Merchandise Store Activities Tracking Dashboard Merchandise Playbook Topics PDF
This slide provides details regarding the dashboard for tracking retail store activities in terms of customer retention, rate of return, volume sales, rate of return, number of new and returning customers, etc. Deliver an awe inspiring pitch with this creative Essential Merchandise Store Activities Tracking Dashboard Merchandise Playbook Topics PDF bundle. Topics like Rate Return Customer, Customer Retention Number, New And Returning can be discussed with this completely editable template. It is available for immediate download depending on the needs and requirements of the user.
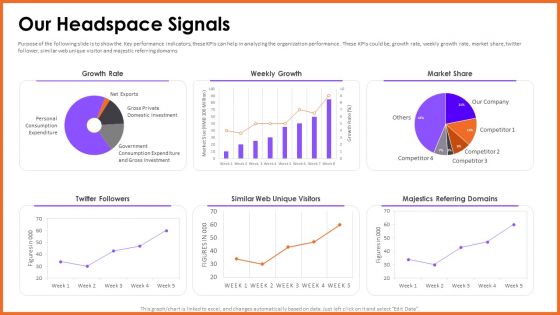
Headspace Fund Raising Pitch Deck Our Headspace Signals Microsoft PDF
Purpose of the following slide is to show the Key performance indicators, these KPIs can help in analyzing the organization performance . These KPIs could be growth rate, weekly growth rate, market share, twitter follower, similar web unique visitor and majestic referring domains.Deliver and pitch your topic in the best possible manner with this Headspace Fund Raising Pitch Deck Our Headspace Signals Microsoft PDF. Use them to share invaluable insights on Growth Rate, Weekly Growth, Referring Domains and impress your audience. This template can be altered and modified as per your expectations. So, grab it now.
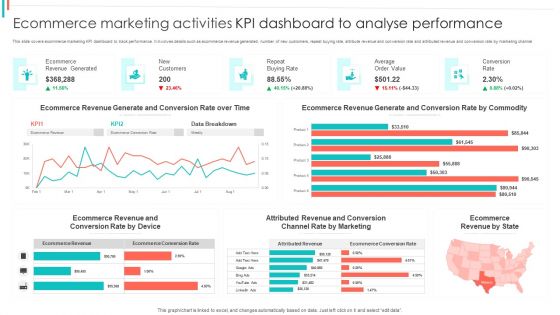
Ecommerce Marketing Activities KPI Dashboard To Analyse Performance Guidelines PDF
This slide covers ecommerce marketing KPI dashboard to track performance. It involves details such as ecommerce revenue generated, number of new customers, repeat buying rate, attribute revenue and conversion rate and attributed revenue and conversion rate by marketing channel.Pitch your topic with ease and precision using this Ecommerce Marketing Activities KPI Dashboard To Analyse Performance Guidelines PDF. This layout presents information on Revenue Generated, Ecommerce Revenue, Generate Conversion. It is also available for immediate download and adjustment. So, changes can be made in the color, design, graphics or any other component to create a unique layout.
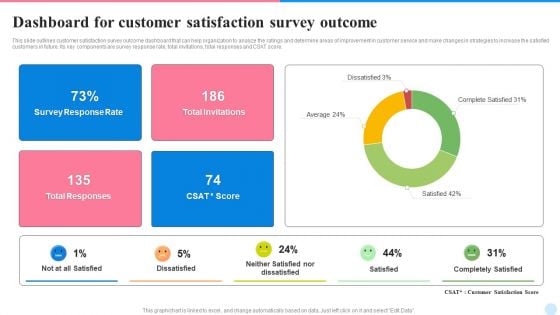
Dashboard For Customer Satisfaction Survey Outcome Demonstration PDF
This slide outlines customer satisfaction survey outcome dashboard that can help organization to analyze the ratings and determine areas of improvement in customer service and make changes in strategies to increase the satisfied customers in future. Its key components are survey response rate, total invitations, total responses and CSAT score. Showcasing this set of slides titled Dashboard For Customer Satisfaction Survey Outcome Demonstration PDF. The topics addressed in these templates are Total Invitations, Survey Response Rate, Total Responses. All the content presented in this PPT design is completely editable. Download it and make adjustments in color, background, font etc. as per your unique business setting.
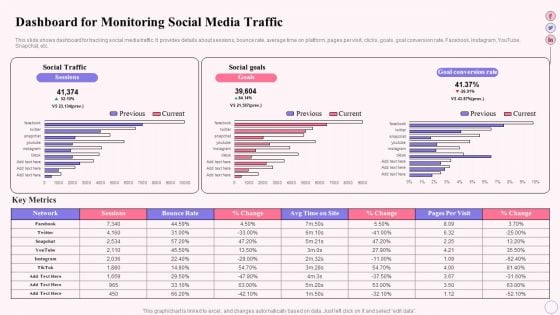
Integrating Social Media Tactics Dashboard For Monitoring Social Media Traffic Ideas PDF
This slide shows dashboard for tracking social media traffic. It provides details about sessions, bounce rate, average time on platform, pages per visit, clicks, goals, goal conversion rate, Facebook, Instagram, YouTube, Snapchat, etc. Deliver and pitch your topic in the best possible manner with this Integrating Social Media Tactics Dashboard For Monitoring Social Media Traffic Ideas PDF. Use them to share invaluable insights on Social Traffic, Social Goals, Goal Conversion Rate and impress your audience. This template can be altered and modified as per your expectations. So, grab it now.
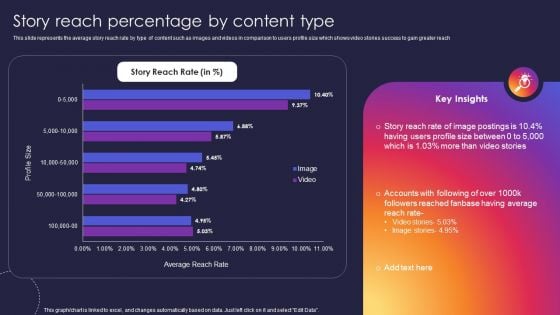
Instagram Company Details Story Reach Percentage By Content Type Rules PDF
This slide represents the average story reach rate by type of content such as images and videos in comparison to users profile size which shows video stories success to gain greater reach. Deliver and pitch your topic in the best possible manner with this Instagram Company Details Story Reach Percentage By Content Type Rules PDF. Use them to share invaluable insights on Story Reach Rate, Average Reach Rate and impress your audience. This template can be altered and modified as per your expectations. So, grab it now.
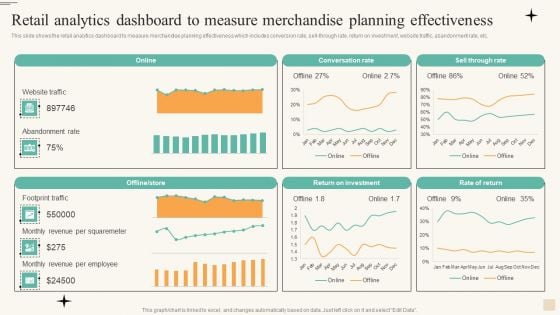
Retail Analytics Dashboard To Measure Merchandise Planning Effectiveness Microsoft PDF
This slide shows the retail analytics dashboard to measure merchandise planning effectiveness which includes conversion rate, sell through rate, return on investment, website traffic, abandonment rate, etc. Make sure to capture your audiences attention in your business displays with our gratis customizable Retail Analytics Dashboard To Measure Merchandise Planning Effectiveness Microsoft PDF. These are great for business strategies, office conferences, capital raising or task suggestions. If you desire to acquire more customers for your tech business and ensure they stay satisfied, create your own sales presentation with these plain slides.
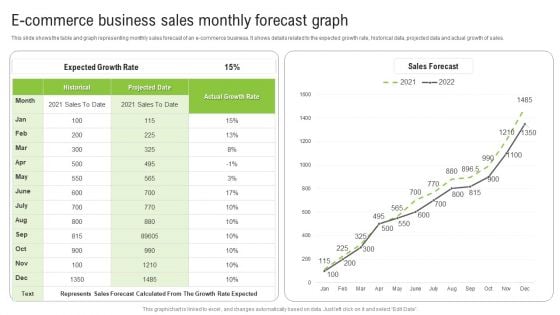
E Commerce Business Sales Monthly Forecast Graph Ppt Infographics Show PDF
This slide shows the table and graph representing monthly sales forecast of an e-commerce business. It shows details related to the expected growth rate, historical data, projected data and actual growth of sales. Pitch your topic with ease and precision using this E Commerce Business Sales Monthly Forecast Graph Ppt Infographics Show PDF. This layout presents information on Expected Growth Rate, Historical, Actual Growth Rate. It is also available for immediate download and adjustment. So, changes can be made in the color, design, graphics or any other component to create a unique layout.
Survey Report On Global Voluntary Attrition Tracking By Function Background PDF
This slide depicts survey outcomes on turnover rates based on different functions. It includes survey based on multiple functions such as IT, legal, R and D, public sector, customer support, marketing, HR, sales and finance. along with overall global rates. Showcasing this set of slides titled Survey Report On Global Voluntary Attrition Tracking By Function Background PDF. The topics addressed in these templates are Finance Function, Global Turnover Rates. All the content presented in this PPT design is completely editable. Download it and make adjustments in color, background, font etc. as per your unique business setting.
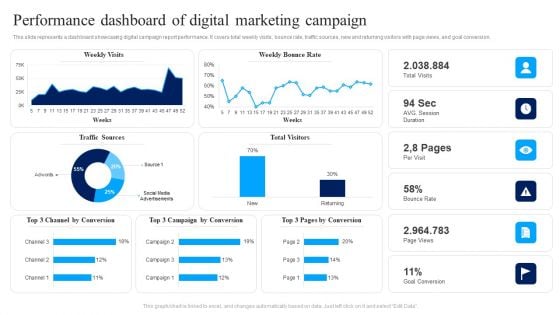
Performance Dashboard Of Digital Marketing Campaign Ppt Show Slide PDF
This slide represents a dashboard showcasing digital campaign report performance. It covers total weekly visits, bounce rate, traffic sources, new and returning visitors with page views, and goal conversion. Pitch your topic with ease and precision using this Performance Dashboard Of Digital Marketing Campaign Ppt Show Slide PDF. This layout presents information on Weekly Visits, Weekly Bounce Rate, Bounce Rate. It is also available for immediate download and adjustment. So, changes can be made in the color, design, graphics or any other component to create a unique layout.
Dashboard For Tracking Website Performance Consumer Contact Point Guide Brochure PDF
This slide covers the KPI dashboard for analyzing the company website. It includes metrics such as conversions, conversion rate, sessions, stickiness, bounce rate, engagement, etc. Slidegeeks has constructed Dashboard For Tracking Website Performance Consumer Contact Point Guide Brochure PDF after conducting extensive research and examination. These presentation templates are constantly being generated and modified based on user preferences and critiques from editors. Here, you will find the most attractive templates for a range of purposes while taking into account ratings and remarks from users regarding the content. This is an excellent jumping-off point to explore our content and will give new users an insight into our top-notch PowerPoint Templates.
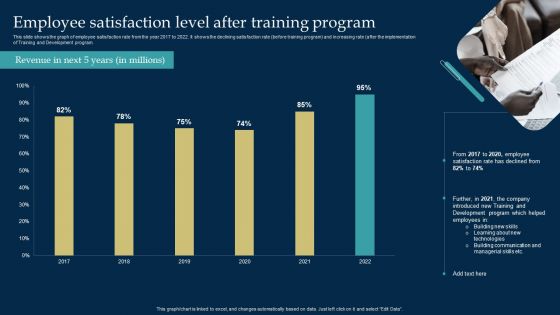
Employee Training And Development Strategy Employee Satisfaction Level After Training Program Rules PDF
This slide shows the graph of employee satisfaction rate from the year 2017 to 2022. It shows the declining satisfaction rate before training program and increasing rate after the implementation of Training and Development program. There are so many reasons you need a Employee Training And Development Strategy Employee Satisfaction Level After Training Program Rules PDF. The first reason is you can not spend time making everything from scratch, Thus, Slidegeeks has made presentation templates for you too. You can easily download these templates from our website easily.
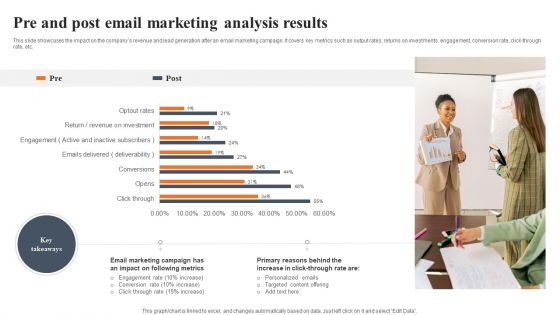
Pre And Post Email Marketing Analysis Results Slides PDF
This slide showcases the impact on the companys revenue and lead generation after an email marketing campaign. It covers key metrics such as output rates, returns on investments, engagement, conversion rate, click through rate, etc. Pitch your topic with ease and precision using this Pre And Post Email Marketing Analysis Results Slides PDF. This layout presents information on Email Marketing Campaign, Following Metrics, Targeted Content Offering. It is also available for immediate download and adjustment. So, changes can be made in the color, design, graphics or any other component to create a unique layout.
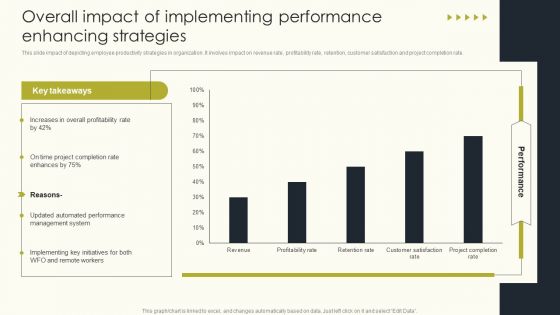
Overall Impact Of Implementing Performance Enhancing Strategies Employee Performance Formats PDF
This slide impact of depicting employee productivity strategies in organization. It involves impact on revenue rate, profitability rate, retention, customer satisfaction and project completion rate. Boost your pitch with our creative Overall Impact Of Implementing Performance Enhancing Strategies Employee Performance Formats PDF. Deliver an awe-inspiring pitch that will mesmerize everyone. Using these presentation templates you will surely catch everyones attention. You can browse the ppts collection on our website. We have researchers who are experts at creating the right content for the templates. So you do not have to invest time in any additional work. Just grab the template now and use them.

Email Marketing Campaign Outcomes Results And Campaign Performance Dashboard Slides PDF
This slide covers the dashboard for analyzing the results of email campaign. It includes information related to the emails sent, delivery rate, click rate, etc. Showcasing this set of slides titled Email Marketing Campaign Outcomes Results And Campaign Performance Dashboard Slides PDF. The topics addressed in these templates are Opens And Clicks Rates, Other Information, Bounces . All the content presented in this PPT design is completely editable. Download it and make adjustments in color, background, font etc. as per your unique business setting.
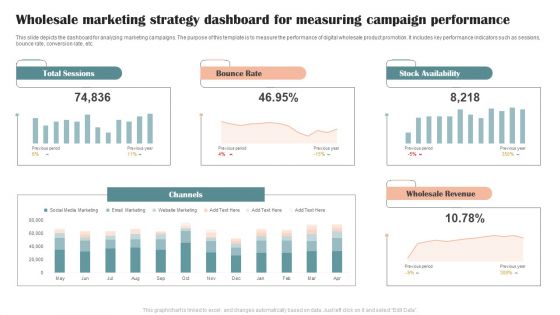
Wholesale Marketing Strategy Dashboard For Measuring Campaign Performance Graphics PDF
This slide depicts the dashboard for analyzing marketing campaigns. The purpose of this template is to measure the performance of digital wholesale product promotion. It includes key performance indicators such as sessions, bounce rate, conversion rate, etc. Showcasing this set of slides titled Wholesale Marketing Strategy Dashboard For Measuring Campaign Performance Graphics PDF. The topics addressed in these templates are Total Sessions, Bounce Rate, Stock Availability. All the content presented in this PPT design is completely editable. Download it and make adjustments in color, background, font etc. as per your unique business setting.
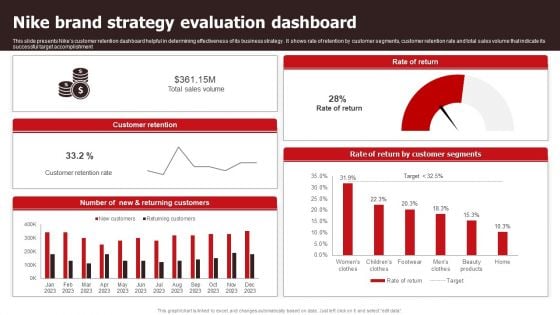
Nike Brand Strategy Evaluation Dashboard Sample PDF
This slide presents Nikes customer retention dashboard helpful in determining effectiveness of its business strategy . It shows rate of retention by customer segments, customer retention rate and total sales volume that indicate its successful target accomplishment. Showcasing this set of slides titled Nike Brand Strategy Evaluation Dashboard Sample PDF. The topics addressed in these templates are Sales Volume, Customer Retention Rate . All the content presented in this PPT design is completely editable. Download it and make adjustments in color, background, font etc. as per your unique business setting.
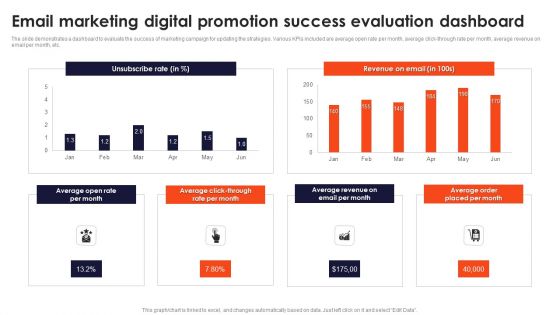
Email Marketing Digital Promotion Success Evaluation Dashboard Sample PDF
The slide demonstrates a dashboard to evaluate the success of marketing campaign for updating the strategies. Various KPIs included are average open rate per month, average click-through rate per month, average revenue on email per month, etc. Pitch your topic with ease and precision using this Email Marketing Digital Promotion Success Evaluation Dashboard Sample PDF. This layout presents information on Open Rate Per Month, Order Placed Per Month. It is also available for immediate download and adjustment. So, changes can be made in the color, design, graphics or any other component to create a unique layout.

Actual Time Marketing Advantages For Companies And Agencies Ppt PowerPoint Presentation File Information PDF
The slide illustrates a company report highlighting the benefits from investing in a real-time marketing program for responding quickly to the trends. Various advantages included are increases customer experience, boosts customer retention rate, better conversion rates, etc. Pitch your topic with ease and precision using this Actual Time Marketing Advantages For Companies And Agencies Ppt PowerPoint Presentation File Information PDF. This layout presents information on Increases Customer Experience, Better Conversion Rates, Improved Brand Perception, Facilitates Personalization. It is also available for immediate download and adjustment. So, changes can be made in the color, design, graphics or any other component to create a unique layout.
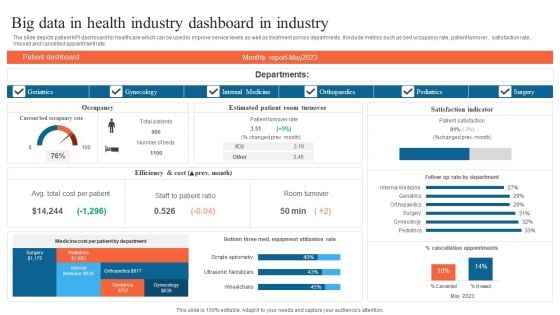
Big Data In Health Industry Dashboard In Industry Summary PDF
The slide depicts patient KPI dashboard for healthcare which can be used to improve service levels as well as treatment across departments. It include metrics such as bed occupancy rate, patient turnover, satisfaction rate, missed and cancelled appointment rate. Showcasing this set of slides titled Big Data In Health Industry Dashboard In Industry Summary PDF. The topics addressed in these templates are Geriatrics, Gynecology, Internal Medicine. All the content presented in this PPT design is completely editable. Download it and make adjustments in color, background, font etc. as per your unique business setting.
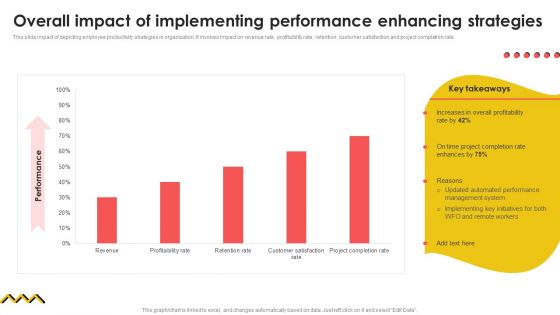
Overall Impact Of Implementing Performance Enhancing Strategies Summary PDF
This slide impact of depicting employee productivity strategies in organization. It involves impact on revenue rate, profitability rate, retention, customer satisfaction and project completion rate. Take your projects to the next level with our ultimate collection of Overall Impact Of Implementing Performance Enhancing Strategies Summary PDF. Slidegeeks has designed a range of layouts that are perfect for representing task or activity duration, keeping track of all your deadlines at a glance. Tailor these designs to your exact needs and give them a truly corporate look with your own brand colors they will make your projects stand out from the rest.
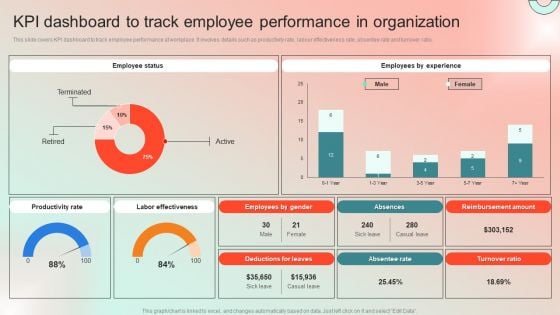
KPI Dashboard To Track Employee Performance In Organization Demonstration PDF
This slide covers KPI dashboard to track employee performance at workplace. It involves details such as productivity rate, labour effectiveness rate, absentee rate and turnover ratio. Take your projects to the next level with our ultimate collection of KPI Dashboard To Track Employee Performance In Organization Demonstration PDF. Slidegeeks has designed a range of layouts that are perfect for representing task or activity duration, keeping track of all your deadlines at a glance. Tailor these designs to your exact needs and give them a truly corporate look with your own brand colors they will make your projects stand out from the rest.
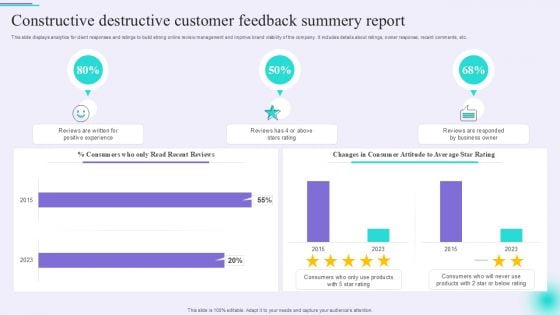
Constructive Destructive Customer Feedback Summery Report Inspiration PDF
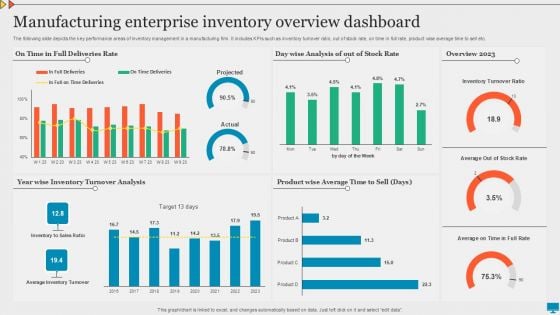
Manufacturing Enterprise Inventory Overview Dashboard Graphics PDF
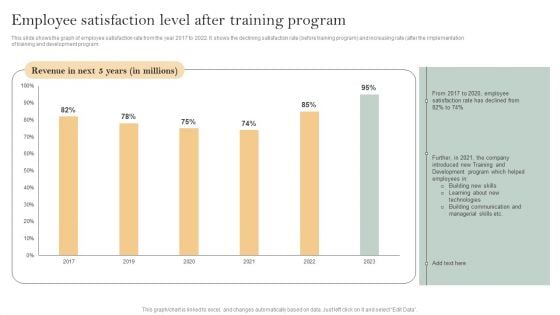
Skill Enhancement Plan Employee Satisfaction Level After Training Program Guidelines PDF
This slide shows the graph of employee satisfaction rate from the year 2017 to 2022. It shows the declining satisfaction rate before training program and increasing rate after the implementation of training and development program. If your project calls for a presentation, then Slidegeeks is your go-to partner because we have professionally designed, easy-to-edit templates that are perfect for any presentation. After downloading, you can easily edit Skill Enhancement Plan Employee Satisfaction Level After Training Program Guidelines PDF and make the changes accordingly. You can rearrange slides or fill them with different images. Check out all the handy templates
Optimizing Consumer Lead Nurturing Procedure Lead Generation Dashboard For Tracking Introduction PDF
This slide covers the KPI dashboard for tracking lead conversion rates. It includes metrics such as visitors, average session rate, per visit, bounce rate, page views, etc. Create an editable Optimizing Consumer Lead Nurturing Procedure Lead Generation Dashboard For Tracking Introduction PDF that communicates your idea and engages your audience. Whether youre presenting a business or an educational presentation, pre designed presentation templates help save time. Optimizing Consumer Lead Nurturing Procedure Lead Generation Dashboard For Tracking Introduction PDF is highly customizable and very easy to edit, covering many different styles from creative to business presentations. Slidegeeks has creative team members who have crafted amazing templates. So, go and get them without any delay.

Call Center Kpis Agent Performance Dashboard Clipart PDF
This slide covers contact center agent performance metrics KPI dashboard. It involves metrics such as number of calls, average response time, average hold time, daily average transfer rate and agents with most hold time and transfer rate. Showcasing this set of slides titled Call Center Kpis Agent Performance Dashboard Clipart PDF. The topics addressed in these templates are Transfer Rate, Call Center, Hold Time. All the content presented in this PPT design is completely editable. Download it and make adjustments in color, background, font etc. as per your unique business setting.
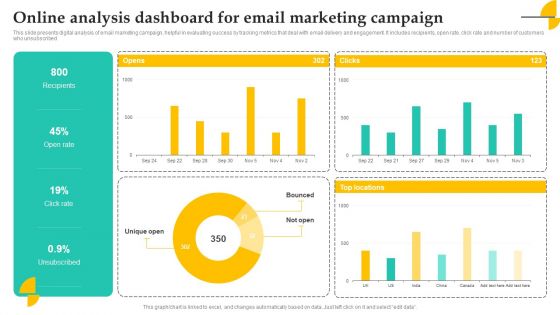
Online Analysis Dashboard For Email Marketing Campaign Elements PDF
This slide presents digital analysis of email marketing campaign, helpful in evaluating success by tracking metrics that deal with email delivery and engagement. It includes recipients, open rate, click rate and number of customers who unsubscribed Showcasing this set of slides titled Online Analysis Dashboard For Email Marketing Campaign Elements PDF. The topics addressed in these templates are Recipients, Open Rate, Campaign. All the content presented in this PPT design is completely editable. Download it and make adjustments in color, background, font etc. as per your unique business setting.
E Mail Performance Analytics Metrics Tracking Report Analysis Demonstration PDF
The purpose of this slide is to showcase an e-mail analytics mechanism in order to track the performance of certain e-mail marketing based on various metrics. Certain KPIs include open rate, click rate, unsubscribe rate etc. Pitch your topic with ease and precision using this E Mail Performance Analytics Metrics Tracking Report Analysis Demonstration PDF. This layout presents information on E Mail Performance Analytics, Metrics Tracking Report Analysis. It is also available for immediate download and adjustment. So, changes can be made in the color, design, graphics or any other component to create a unique layout.
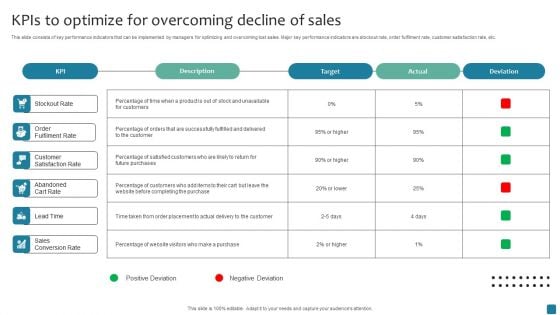
Kpis To Optimize For Overcoming Decline Of Sales Mockup PDF
This slide consists of key performance indicators that can be implemented by managers for optimizing and overcoming lost sales. Major key performance indicators are stockout rate, order fulfilment rate, customer satisfaction rate, etc. Showcasing this set of slides titled Kpis To Optimize For Overcoming Decline Of Sales Mockup PDF. The topics addressed in these templates are Target, Actual, Deviation. All the content presented in this PPT design is completely editable. Download it and make adjustments in color, background, font etc. as per your unique business setting.
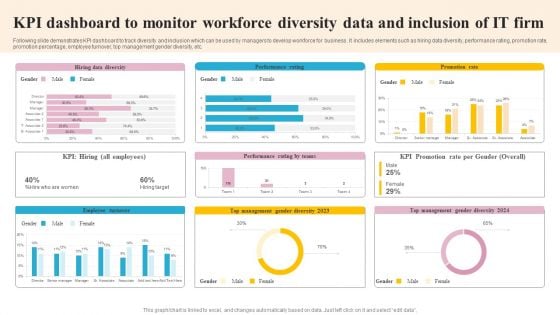
KPI Dashboard To Monitor Workforce Diversity Data And Inclusion Of IT Firm Slides PDF
Following slide demonstrates KPI dashboard to track diversity and inclusion which can be used by managers to develop workforce for business . It includes elements such as hiring data diversity, performance rating, promotion rate, promotion percentage, employee turnover, top management gender diversity, etc. Showcasing this set of slides titled KPI Dashboard To Monitor Workforce Diversity Data And Inclusion Of IT Firm Slides PDF. The topics addressed in these templates are Employee Turnover, Management, Promotion Rate. All the content presented in this PPT design is completely editable. Download it and make adjustments in color, background, font etc. as per your unique business setting.
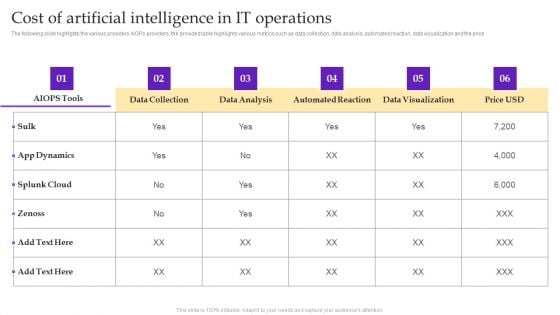
Operational Strategy For ML In IT Sector Cost Of Artificial Intelligence In IT Operations Inspiration PDF
The following slide highlights the various providers AIOPs providers, the provided table highlights various metrics such as data collection, data analysis, automated reaction, data visualization and the price. Welcome to our selection of the Operational Strategy For ML In IT Sector Cost Of Artificial Intelligence In IT Operations Inspiration PDF. These are designed to help you showcase your creativity and bring your sphere to life. Planning and Innovation are essential for any business that is just starting out. This collection contains the designs that you need for your everyday presentations. All of our PowerPoints are 100 percent editable, so you can customize them to suit your needs. This multi-purpose template can be used in various situations. Grab these presentation templates today.
Facebook Marketing Plan Dashboard For Tracking Facebook Post Performance Strategy SS V
Facebook Marketing Techniques Dashboard For Tracking Facebook Post Strategy SS V
The following slide outlines dashboard through which advertisers can manage Facebook post performance and optimize their marketing strategy. Information covered in this slide is related to key metrics such as impressions per post, engagement rate, click-through rate CTR , likes, etc. If you are looking for a format to display your unique thoughts, then the professionally designed Facebook Marketing Techniques Dashboard For Tracking Facebook Post Strategy SS V is the one for you. You can use it as a Google Slides template or a PowerPoint template. Incorporate impressive visuals, symbols, images, and other charts. Modify or reorganize the text boxes as you desire. Experiment with shade schemes and font pairings. Alter, share or cooperate with other people on your work. Download Facebook Marketing Techniques Dashboard For Tracking Facebook Post Strategy SS V and find out how to give a successful presentation. Present a perfect display to your team and make your presentation unforgettable. The following slide outlines dashboard through which advertisers can manage Facebook post performance and optimize their marketing strategy. Information covered in this slide is related to key metrics such as impressions per post, engagement rate, click-through rate CTR , likes, etc.
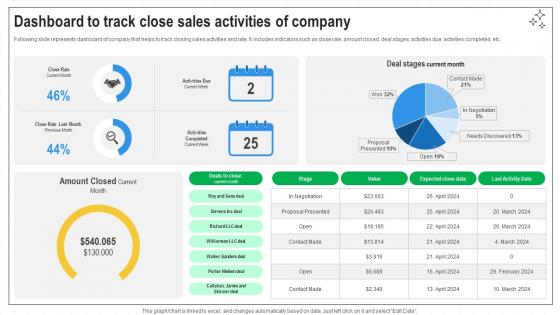
Closing Techniques To Seal Dashboard To Track Close Sales Activities Of Company SA SS V
Following slide represents dashboard of company that helps to track closing sales activities and rate. It includes indicators such as close rate, amount closed, deal stages, activities due, activities completed, etc. If you are looking for a format to display your unique thoughts, then the professionally designed Closing Techniques To Seal Dashboard To Track Close Sales Activities Of Company SA SS V is the one for you. You can use it as a Google Slides template or a PowerPoint template. Incorporate impressive visuals, symbols, images, and other charts. Modify or reorganize the text boxes as you desire. Experiment with shade schemes and font pairings. Alter, share or cooperate with other people on your work. Download Closing Techniques To Seal Dashboard To Track Close Sales Activities Of Company SA SS V and find out how to give a successful presentation. Present a perfect display to your team and make your presentation unforgettable. Following slide represents dashboard of company that helps to track closing sales activities and rate. It includes indicators such as close rate, amount closed, deal stages, activities due, activities completed, etc.
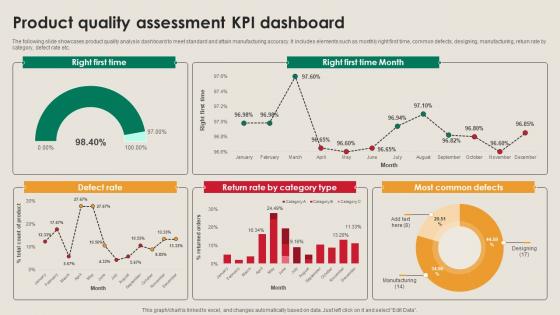
Product Quality Assessment KPI Dashboard Manufacturing Strategy Driving Industry 4 0
The following slide showcases product quality analysis dashboard to meet standard and attain manufacturing accuracy. It includes elements such as monthly right first time, common defects, designing, manufacturing, return rate by category, defect rate etc. If you are looking for a format to display your unique thoughts, then the professionally designed Product Quality Assessment KPI Dashboard Manufacturing Strategy Driving Industry 4 0 is the one for you. You can use it as a Google Slides template or a PowerPoint template. Incorporate impressive visuals, symbols, images, and other charts. Modify or reorganize the text boxes as you desire. Experiment with shade schemes and font pairings. Alter, share or cooperate with other people on your work. Download Product Quality Assessment KPI Dashboard Manufacturing Strategy Driving Industry 4 0 and find out how to give a successful presentation. Present a perfect display to your team and make your presentation unforgettable. The following slide showcases product quality analysis dashboard to meet standard and attain manufacturing accuracy. It includes elements such as monthly right first time, common defects, designing, manufacturing, return rate by category, defect rate etc.
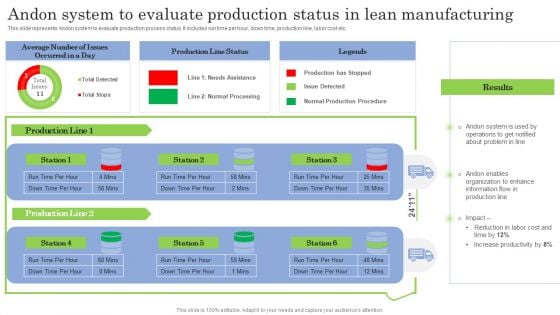
Andon System To Evaluate Production Status In Lean Manufacturing Demonstration PDF
This slide represents Andon system to evaluate production process status. It includes run time per hour, down time, production line, labor cost etc. Boost your pitch with our creative Andon System To Evaluate Production Status In Lean Manufacturing Demonstration PDF. Deliver an awe-inspiring pitch that will mesmerize everyone. Using these presentation templates you will surely catch everyones attention. You can browse the ppts collection on our website. We have researchers who are experts at creating the right content for the templates. So you do not have to invest time in any additional work. Just grab the template now and use them.
Lean Production Techniques To Enhance Operational Effectiveness Andon System To Evaluate Production Status In Lean Icons PDF
This slide represents Andon system to evaluate production process status. It includes run time per hour, down time, production line, labor cost etc. Boost your pitch with our creative Lean Production Techniques To Enhance Operational Effectiveness Andon System To Evaluate Production Status In Lean Icons PDF. Deliver an awe-inspiring pitch that will mesmerize everyone. Using these presentation templates you will surely catch everyones attention. You can browse the ppts collection on our website. We have researchers who are experts at creating the right content for the templates. So you do not have to invest time in any additional work. Just grab the template now and use them.
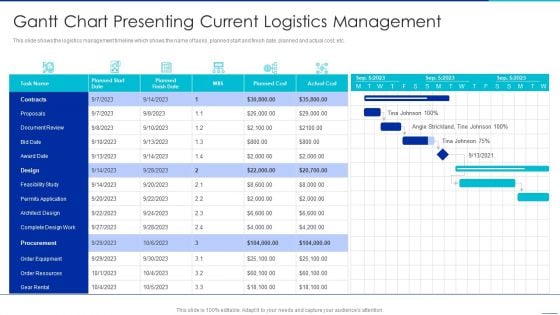
Optimizing Logistics Management Process Gantt Chart Presenting Current Logistics Management Clipart PDF
This slide shows the logistics management timeline which shows the name of tasks, planned start and finish date, planned and actual cost, etc. Your complex projects can be managed and organized simultaneously using this detailed optimizing logistics management process gantt chart presenting current logistics management clipart pdf template. Track the milestones, tasks, phases, activities, and subtasks to get an updated visual of your project. Share your planning horizon and release plan with this well crafted presentation template. This exemplary template can be used to plot various dependencies to distinguish the tasks in the pipeline and their impact on the schedules and deadlines of the project. Apart from this, you can also share this visual presentation with your team members and stakeholders. It a resourceful tool that can be incorporated into your business structure. Therefore, download and edit it conveniently to add the data and statistics as per your requirement.
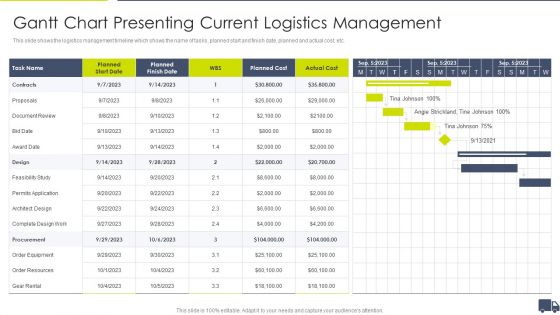
Enhancing Logistics Customer Service Gantt Chart Presenting Current Logistics Management Brochure PDF
This slide shows the logistics management timeline which shows the name of tasks, planned start and finish date, planned and actual cost, etc. Your complex projects can be managed and organized simultaneously using this detailed Enhancing Logistics Customer Service Gantt Chart Presenting Current Logistics Management Brochure PDF template. Track the milestones, tasks, phases, activities, and subtasks to get an updated visual of your project. Share your planning horizon and release plan with this well crafted presentation template. This exemplary template can be used to plot various dependencies to distinguish the tasks in the pipeline and their impact on the schedules and deadlines of the project. Apart from this, you can also share this visual presentation with your team members and stakeholders. It a resourceful tool that can be incorporated into your business structure. Therefore, download and edit it conveniently to add the data and statistics as per your requirement.
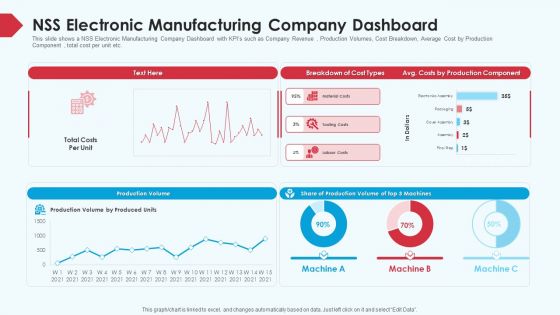
Skill Shortage In A Production Firm Case Study Solution NSS Electronic Manufacturing Company Dashboard Summary PDF
This slide shows a NSS Electronic Manufacturing Company Dashboard with KPIs such as Company Revenue , Production Volumes, Cost Breakdown, Average Cost by Production Component , total cost per unit etc. Deliver and pitch your topic in the best possible manner with this skill shortage in a production firm case study solution NSS electronic manufacturing company dashboard summary pdf. Use them to share invaluable insights on costs by production component, production volume, NSS electronic manufacturing company dashboard and impress your audience. This template can be altered and modified as per your expectations. So, grab it now.
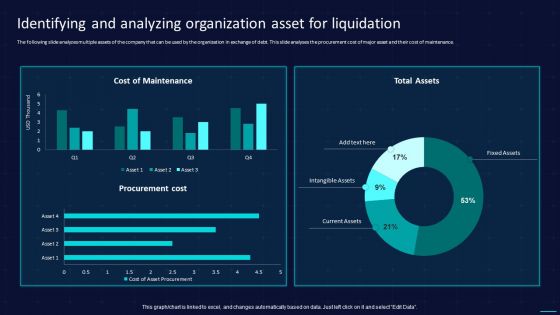
Identifying And Analyzing Organization Asset For Liquidation Ideas PDF
The following slide analyzes multiple assets of the company that can be used by the organization in exchange of debt. This slide analyses the procurement cost of major asset and their cost of maintenance. Deliver an awe inspiring pitch with this creative Identifying And Analyzing Organization Asset For Liquidation Ideas PDF bundle. Topics like Procurement Cost, Cost Of Maintenance, Intangible Assets can be discussed with this completely editable template. It is available for immediate download depending on the needs and requirements of the user.
Statistics Indicating Recurring Business Operational Expenditure In Telecom Operations Icons PDF
This slide shows statistics indicating recurring operating expenditure OPEX in telecom operations which can benefit their executives in evaluating the current expenses and make cost effective amendments for future operations. It includes information about maintenance, repair, network charging and billing, customer support, marketing and operational planning costs. Pitch your topic with ease and precision using this Statistics Indicating Recurring Business Operational Expenditure In Telecom Operations Icons PDF. This layout presents information on Company, Costs, Marketing Costs. It is also available for immediate download and adjustment. So, changes can be made in the color, design, graphics or any other component to create a unique layout.
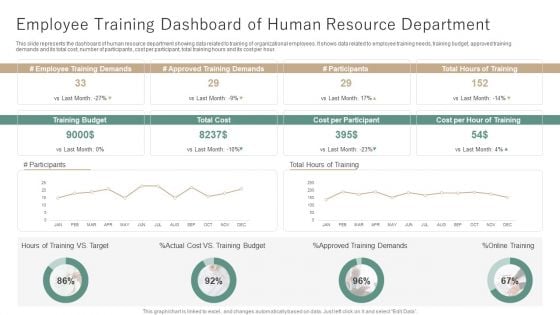
Employee Training Dashboard Of Human Resource Department Ppt Outline Themes PDF
This slide represents the dashboard of human resource department showing data related to training of organizational employees. It shows data related to employee training needs, training budget, approved training demands and its total cost, number of participants, cost per participant, total training hours and its cost per hour. Showcasing this set of slides titled Employee Training Dashboard Of Human Resource Department Ppt Outline Themes PDF. The topics addressed in these templates are Employee Training Demands, Approved Training Demands, Cost per Participant. All the content presented in this PPT design is completely editable. Download it and make adjustments in color, background, font etc. as per your unique business setting.
Project Status Dashboard With Stages And Deliverables Ppt Icon Design Inspiration PDF
This slide shows dashboard with project status based on stages and tasks. It provides information such as project cost performance, actual cost, budget, timeline, resource capacity, etc. Showcasing this set of slides titled Project Status Dashboard With Stages And Deliverables Ppt Icon Design Inspiration PDF. The topics addressed in these templates are Project Cost Performance, Actual Cost, Total Budget. All the content presented in this PPT design is completely editable. Download it and make adjustments in color, background, font etc. as per your unique business setting.
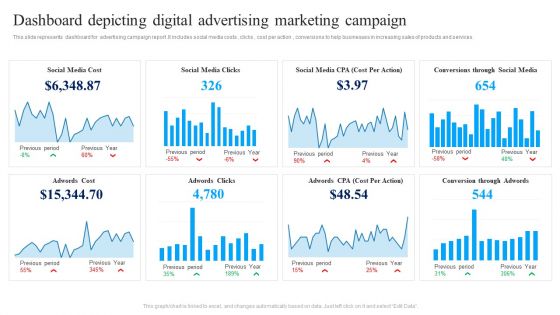
Dashboard Depicting Digital Advertising Marketing Campaign Ppt Summary Elements PDF
This slide represents dashboard for advertising campaign report .It includes social media costs , clicks , cost per action , conversions to help businesses in increasing sales of products and services. Showcasing this set of slides titled Dashboard Depicting Digital Advertising Marketing Campaign Ppt Summary Elements PDF. The topics addressed in these templates are Social Media Cost, Social Media Clicks, Adwords Clicks, Adwords Cost . All the content presented in this PPT design is completely editable. Download it and make adjustments in color, background, font etc. as per your unique business setting.
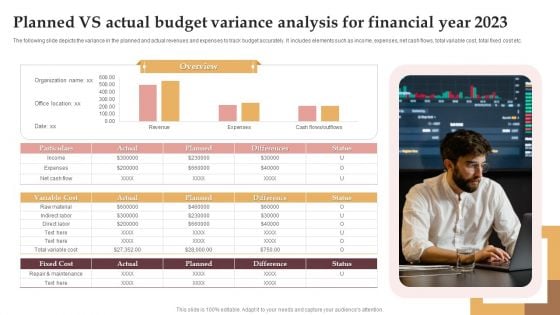
Planned Vs Actual Budget Variance Analysis For Financial Year 2023 Inspiration PDF
The following slide depicts the variance in the planned and actual revenues and expenses to track budget accurately. It includes elements such as income, expenses, net cash flows, total variable cost, total fixed cost etc. Pitch your topic with ease and precision using this Planned Vs Actual Budget Variance Analysis For Financial Year 2023 Inspiration PDF. This layout presents information on Budget Variance Analysis, Variable Cost, Fixed Cost. It is also available for immediate download and adjustment. So, changes can be made in the color, design, graphics or any other component to create a unique layout.
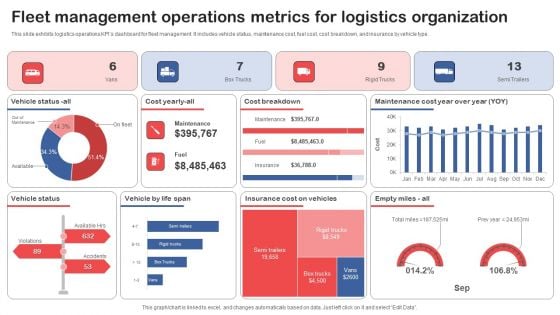
Fleet Management Operations Metrics For Logistics Organization Graphics PDF
This slide exhibits logistics operations KPIs dashboard for fleet management. It includes vehicle status, maintenance cost, fuel cost, cost breakdown, and insurance by vehicle type. Pitch your topic with ease and precision using this Fleet Management Operations Metrics For Logistics Organization Graphics PDF. This layout presents information on Cost Breakdown, Vehicle Status, Vehicle By Life Span. It is also available for immediate download and adjustment. So, changes can be made in the color, design, graphics or any other component to create a unique layout.
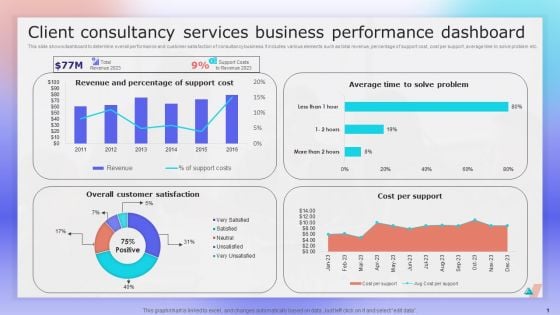
Client Consultancy Services Business Performance Dashboard Ppt File Layout PDF
This slide shows dashboard to determine overall performance and customer satisfaction of consultancy business. It includes various elements such as total revenue, percentage of support cost, cost per support, average time to solve problem etc. Showcasing this set of slides titled Client Consultancy Services Business Performance Dashboard Ppt File Layout PDF. The topics addressed in these templates are Revenue And Percentage, Support Cost, Cost Per Support. All the content presented in this PPT design is completely editable. Download it and make adjustments in color, background, font etc. as per your unique business setting.
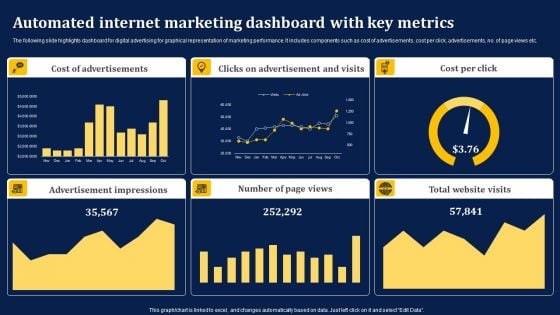
Automated Internet Marketing Dashboard With Key Metrics Information PDF
The following slide highlights dashboard for digital advertising for graphical representation of marketing performance. It includes components such as cost of advertisements, cost per click, advertisements, no. of page views etc. Showcasing this set of slides titled Automated Internet Marketing Dashboard With Key Metrics Information PDF. The topics addressed in these templates are Cost Advertisements, Clicks Advertisement, Cost Per Click. All the content presented in this PPT design is completely editable. Download it and make adjustments in color, background, font etc. as per your unique business setting.
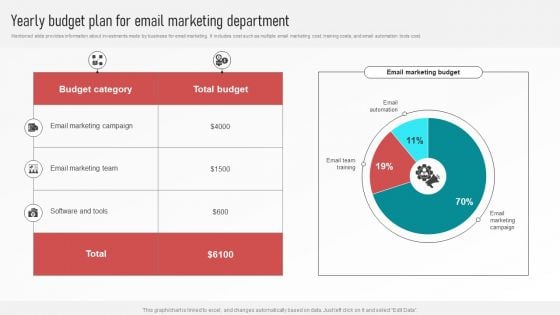
Customer Retention With Email Advertising Campaign Plan Yearly Budget Plan For Email Marketing Department Pictures PDF
Mentioned slide provides information about investments made by business for email marketing. It includes cost such as multiple email marketing cost, training costs, and email automation tools cost. The best PPT templates are a great way to save time, energy, and resources. Slidegeeks have 100 percent editable powerpoint slides making them incredibly versatile. With these quality presentation templates, you can create a captivating and memorable presentation by combining visually appealing slides and effectively communicating your message. Download Customer Retention With Email Advertising Campaign Plan Yearly Budget Plan For Email Marketing Department Pictures PDF from Slidegeeks and deliver a wonderful presentation.
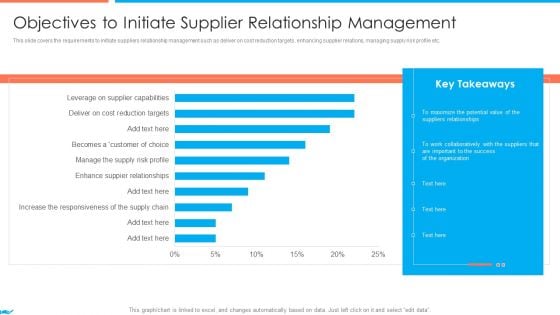
Supplier Association Management Techniques Objectives To Initiate Supplier Relationship Management Background PDF
This slide covers the requirements to initiate suppliers relationship management such as deliver on cost reduction targets, enhancing supplier relations, managing supply risk profile etc. Deliver an awe inspiring pitch with this creative supplier association management techniques objectives to initiate supplier relationship management background pdf bundle. Topics like challenges and issues when implementing srm can be discussed with this completely editable template. It is available for immediate download depending on the needs and requirements of the user.
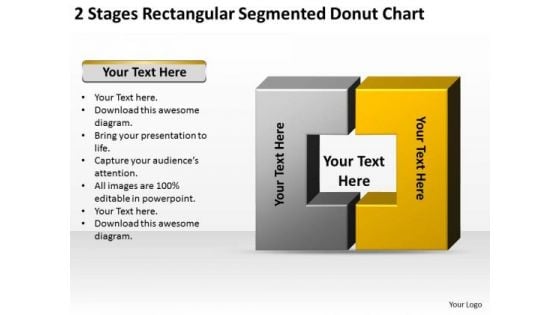
Stages Rectangular Segmented Donut Chart Ppt Business Proposal Outline PowerPoint Slides
We present our stages rectangular segmented donut chart ppt business proposal outline PowerPoint Slides.Download and present our Advertising PowerPoint Templates because Our PowerPoint Templates and Slides will let you Illuminate the road ahead to Pinpoint the important landmarks along the way. Download and present our Construction PowerPoint Templates because It will Raise the bar of your Thoughts. They are programmed to take you to the next level. Present our Boxes PowerPoint Templates because It can be used to Set your controls for the heart of the sun. Our PowerPoint Templates and Slides will be the propellant to get you there. Download and present our Business PowerPoint Templates because It can Leverage your style with our PowerPoint Templates and Slides. Charm your audience with your ability. Use our Shapes PowerPoint Templates because Your audience will believe you are the cats whiskers.Use these PowerPoint slides for presentations relating to Box, chart, organization, square, grade, floor, step, triangle business, concept, vector, sign, success, presentation, template, elements, diagram, graphic, process, flowchart, rectangular, level, layer, shape, class, illustration, figure, stage, object, brochure template, shiny, rating, rectangular shape, design, pyramid, organization chart, company, conceptual, structure. The prominent colors used in the PowerPoint template are Yellow, Gray, Black. Our Stages Rectangular Segmented Donut Chart Ppt Business Proposal Outline PowerPoint Slides are truly fair minded. They take all arguments into account.
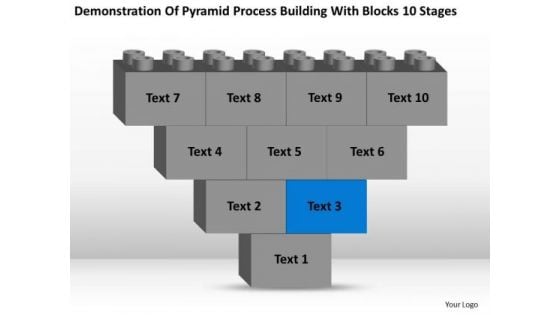
Business Charts Examples Of Pyramid Process Building With Blocks 10 Stages PowerPoint Slides
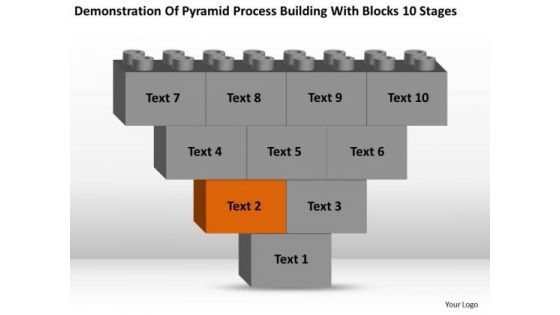
We present our business charts examples of pyramid process building with blocks 10 stages PowerPoint Slides.Use our Construction PowerPoint Templates because Our PowerPoint Templates and Slides will generate and maintain the level of interest you desire. They will create the impression you want to imprint on your audience. Present our Pyramids PowerPoint Templates because Our PowerPoint Templates and Slides are the chords of your song. String them along and provide the lilt to your views. Download and present our Business PowerPoint Templates because It will Raise the bar of your Thoughts. They are programmed to take you to the next level. Present our Shapes PowerPoint Templates because Our PowerPoint Templates and Slides will let you Leave a lasting impression to your audiences. They possess an inherent longstanding recall factor. Download and present our Leadership PowerPoint Templates because Our PowerPoint Templates and Slides will Activate the energies of your audience. Get their creative juices flowing with your words.Use these PowerPoint slides for presentations relating to box, chart, organization, 3d, square, grade, floor, step, triangle, business, concept, vector, sign, success, presentation, template, elements, diagram, graphic, process, tier, flowchart, rectangular, level, layer, shape, class, illustration, figure, stage, object, degree, brochure template, shiny, rating, rectangular shape, design, pyramid, organization chart, company, quadrangle, conceptual, sliced, structure, present, block. The prominent colors used in the PowerPoint template are Blue, Gray, Black. Your ideas will raise the stocks. Gain equity with our Business Charts Examples Of Pyramid Process Building With Blocks 10 Stages PowerPoint Slides.
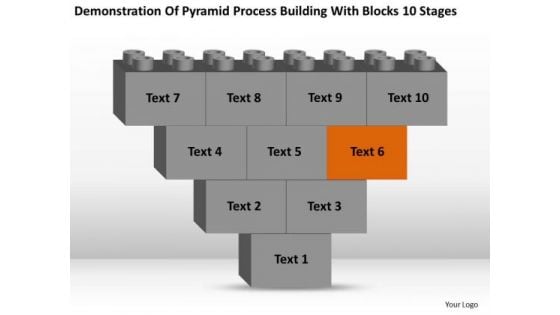
Business Charts Examples Of Pyramid Process Building With Blocks 10 Stages Ppt 6 PowerPoint Slides
We present our business charts examples of pyramid process building with blocks 10 stages ppt 6 PowerPoint Slides.Download and present our Construction PowerPoint Templates because Our PowerPoint Templates and Slides are conceived by a dedicated team. Use them and give form to your wondrous ideas. Use our Pyramids PowerPoint Templates because Our PowerPoint Templates and Slides will fulfill your every need. Use them and effectively satisfy the desires of your audience. Download our Business PowerPoint Templates because It can Bubble and burst with your ideas. Present our Shapes PowerPoint Templates because Timeline crunches are a fact of life. Meet all deadlines using our PowerPoint Templates and Slides. Present our Leadership PowerPoint Templates because Our PowerPoint Templates and Slides will bullet point your ideas. See them fall into place one by one.Use these PowerPoint slides for presentations relating to box, chart, organization, 3d, square, grade, floor, step, triangle, business, concept, vector, sign, success, presentation, template, elements, diagram, graphic, process, tier, flowchart, rectangular, level, layer, shape, class, illustration, figure, stage, object, degree, brochure template, shiny, rating, rectangular shape, design, pyramid, organization chart, company, quadrangle, conceptual, sliced, structure, present, block. The prominent colors used in the PowerPoint template are Brown, Gray, Black. Guide your team with our Business Charts Examples Of Pyramid Process Building With Blocks 10 Stages Ppt 6 PowerPoint Slides. Download without worries with our money back guaranteee.
Business Charts Examples Of Pyramid Process Building With Blocks 10 Stages Ppt PowerPoint Slides
We present our business charts examples of pyramid process building with blocks 10 stages ppt PowerPoint Slides.Present our Construction PowerPoint Templates because Our PowerPoint Templates and Slides will let you Leave a lasting impression to your audiences. They possess an inherent longstanding recall factor. Download our Pyramids PowerPoint Templates because Watching this your Audience will Grab their eyeballs, they wont even blink. Download and present our Business PowerPoint Templates because Our PowerPoint Templates and Slides will let you meet your Deadlines. Use our Shapes PowerPoint Templates because You can Be the star of the show with our PowerPoint Templates and Slides. Rock the stage with your ideas. Present our Leadership PowerPoint Templates because Our PowerPoint Templates and Slides will definately Enhance the stature of your presentation. Adorn the beauty of your thoughts with their colourful backgrounds.Use these PowerPoint slides for presentations relating to box, chart, organization, 3d, square, grade, floor, step, triangle, business, concept, vector, sign, success, presentation, template, elements, diagram, graphic, process, tier, flowchart, rectangular, level, layer, shape, class, illustration, figure, stage, object, degree, brochure template, shiny, rating, rectangular shape, design, pyramid, organization chart, company, quadrangle, conceptual, sliced, structure, present, block. The prominent colors used in the PowerPoint template are Brown, Gray, Black. Cover the gaps with our Business Charts Examples Of Pyramid Process Building With Blocks 10 Stages Ppt PowerPoint Slides. They provide an ideal filling.
Areas To Cover Under Social Media Audit Social Media Platforms Performance Portrait Pdf
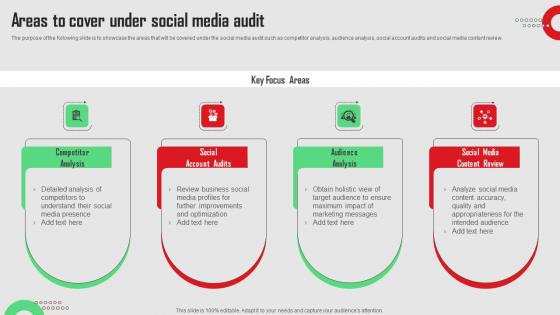
The purpose of the following slide is to showcase the areas that will be covered under the social media audit such as competitor analysis, audience analysis, social account audits and social media content review. Take your projects to the next level with our ultimate collection of Areas To Cover Under Social Media Audit Social Media Platforms Performance Portrait Pdf. Slidegeeks has designed a range of layouts that are perfect for representing task or activity duration, keeping track of all your deadlines at a glance. Tailor these designs to your exact needs and give them a truly corporate look with your own brand colors they all make your projects stand out from the rest. The purpose of the following slide is to showcase the areas that will be covered under the social media audit such as competitor analysis, audience analysis, social account audits and social media content review.
Prospects Identification Introduction And Implementation Procedure Diagrams Pdf
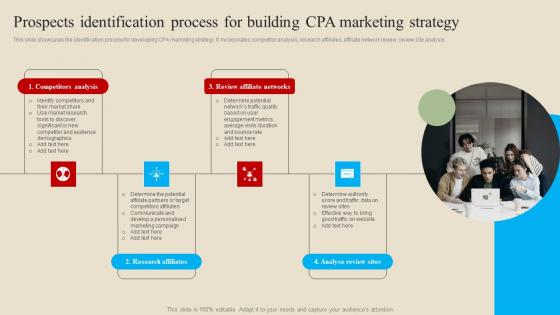
This slide showcases the identification process for developing CPA marketing strategy. It incorporates competitor analysis, research affiliates, affiliate network review, review site analysis. Welcome to our selection of the Prospects Identification Introduction And Implementation Procedure Diagrams Pdf. These are designed to help you showcase your creativity and bring your sphere to life. Planning and Innovation are essential for any business that is just starting out. This collection contains the designs that you need for your everyday presentations. All of our PowerPoints are 100 percent editable, so you can customize them to suit your needs. This multi purpose template can be used in various situations. Grab these presentation templates today. This slide showcases the identification process for developing CPA marketing strategy. It incorporates competitor analysis, research affiliates, affiliate network review, review site analysis.


 Continue with Email

 Home
Home


