Compliance Dashboard
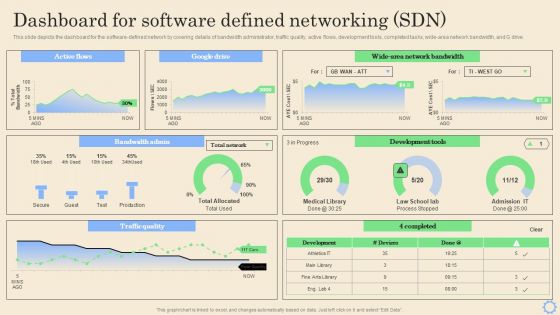
Software Defined Networking Development Strategies Dashboard For Software Defined Networking Sdn Infographics PDF
This slide depicts the dashboard for the software-defined network by covering details of bandwidth administrator, traffic quality, active flows, development tools, completed tasks, wide-area network bandwidth, and G drive. Find a pre designed and impeccable Software Defined Networking Development Strategies Dashboard For Software Defined Networking Sdn Infographics PDF. The templates can ace your presentation without additional effort. You can download these easy to edit presentation templates to make your presentation stand out from others. So, what are you waiting for Download the template from Slidegeeks today and give a unique touch to your presentation.
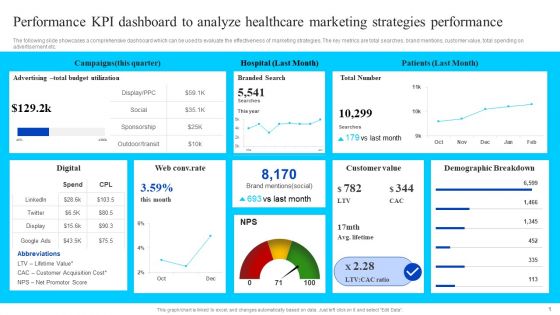
Performance KPI Dashboard To Analyze Healthcare Marketing Strategies Performance Elements PDF
The following slide showcases a comprehensive dashboard which can be used to evaluate the effectiveness of marketing strategies. The key metrics are total searches, brand mentions, customer value, total spending on advertisement etc. If your project calls for a presentation, then Slidegeeks is your go to partner because we have professionally designed, easy to edit templates that are perfect for any presentation. After downloading, you can easily edit Performance KPI Dashboard To Analyze Healthcare Marketing Strategies Performance Elements PDF and make the changes accordingly. You can rearrange slides or fill them with different images. Check out all the handy templates.
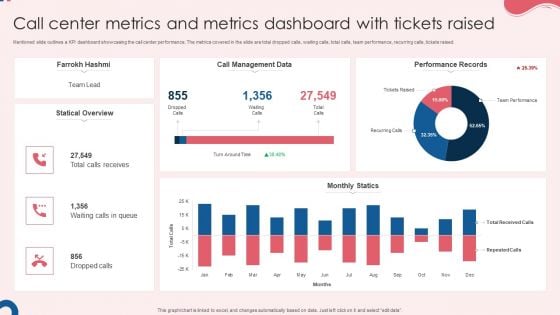
Call Center Metrics And Metrics Dashboard With Tickets Raised Graphics PDF
Mentioned slide outlines a KPI dashboard showcasing the call center performance. The metrics covered in the slide are total dropped calls, waiting calls, total calls, team performance, recurring calls, tickets raised. Showcasing this set of slides titled Call Center Metrics And Metrics Dashboard With Tickets Raised Graphics PDF. The topics addressed in these templates are Call Management Data, Monthly Statics, Performance Records. All the content presented in this PPT design is completely editable. Download it and make adjustments in color, background, font etc. as per your unique business setting.
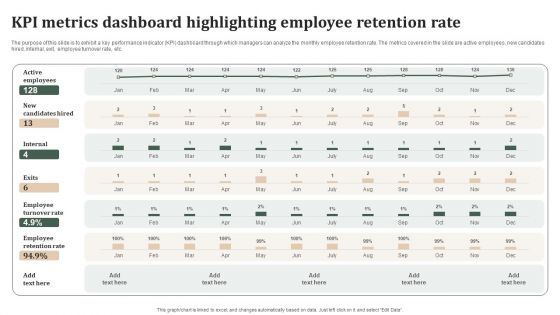
Successful Staff Retention Techniques KPI Metrics Dashboard Highlighting Employee Retention Rate Pictures PDF
The purpose of this slide is to exhibit a key performance indicator KPI dashboard through which managers can analyze the monthly employee retention rate. The metrics covered in the slide are active employees, new candidates hired, internal, exit, employee turnover rate, etc. Make sure to capture your audiences attention in your business displays with our gratis customizable Successful Staff Retention Techniques KPI Metrics Dashboard Highlighting Employee Retention Rate Pictures PDF. These are great for business strategies, office conferences, capital raising or task suggestions. If you desire to acquire more customers for your tech business and ensure they stay satisfied, create your own sales presentation with these plain slides.
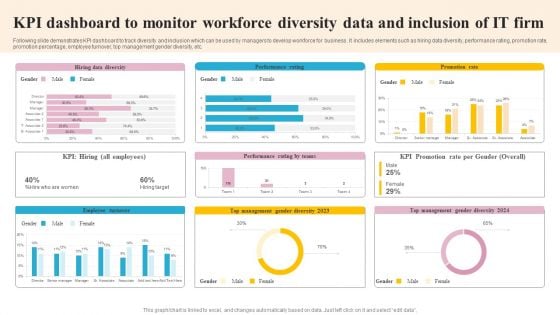
KPI Dashboard To Monitor Workforce Diversity Data And Inclusion Of IT Firm Slides PDF
Following slide demonstrates KPI dashboard to track diversity and inclusion which can be used by managers to develop workforce for business . It includes elements such as hiring data diversity, performance rating, promotion rate, promotion percentage, employee turnover, top management gender diversity, etc. Showcasing this set of slides titled KPI Dashboard To Monitor Workforce Diversity Data And Inclusion Of IT Firm Slides PDF. The topics addressed in these templates are Employee Turnover, Management, Promotion Rate. All the content presented in this PPT design is completely editable. Download it and make adjustments in color, background, font etc. as per your unique business setting.
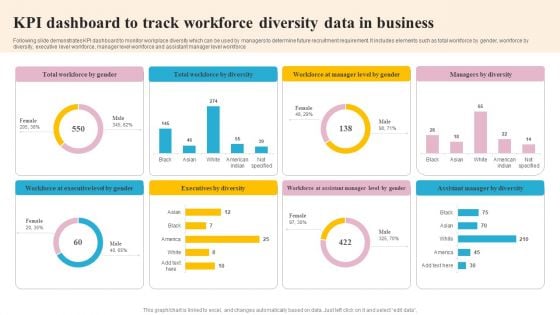
KPI Dashboard To Track Workforce Diversity Data In Business Mockup PDF
Following slide demonstrates KPI dashboard to monitor workplace diversity which can be used by managers to determine future recruitment requirement. It includes elements such as total workforce by gender, workforce by diversity, executive level workforce, manager level workforce and assistant manager level workforce. Pitch your topic with ease and precision using this KPI Dashboard To Track Workforce Diversity Data In Business Mockup PDF. This layout presents information on Executives By Diversity, Workforce By Diversity, Executive Level By Gender. It is also available for immediate download and adjustment. So, changes can be made in the color, design, graphics or any other component to create a unique layout.
Planning Transnational Technique To Improve International Scope Dashboard Tracking Post Expansion Revenue Structure PDF
This slide covers the dashboard for analyzing fast food business sales by location. It includes KPIs such as the companys revenue by location, by type, top 5 expenses by account, top 5 expenses by department, cost of revenue year to date, etc. If your project calls for a presentation, then Slidegeeks is your go to partner because we have professionally designed, easy to edit templates that are perfect for any presentation. After downloading, you can easily edit Planning Transnational Technique To Improve International Scope Dashboard Tracking Post Expansion Revenue Structure PDF and make the changes accordingly. You can rearrange slides or fill them with different images. Check out all the handy templates
Online Marketing Analytics To Enhance Business Growth Website Landing Page KPI Tracking Dashboard Sample PDF
This slide covers a dashboard for analyzing the metrics of the website landing page. It includes KPIs such as conversions, conversion rate, sessions, bounce rate, engagement sickness, etc. If your project calls for a presentation, then Slidegeeks is your go to partner because we have professionally designed, easy to edit templates that are perfect for any presentation. After downloading, you can easily edit Online Marketing Analytics To Enhance Business Growth Website Landing Page KPI Tracking Dashboard Sample PDF and make the changes accordingly. You can rearrange slides or fill them with different images. Check out all the handy templates
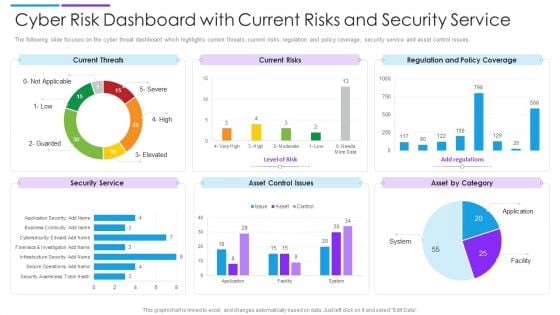
Cyber Risk Dashboard With Current Risks And Security Service Formats PDF
The following slide focuses on the cyber threat dashboard which highlights current threats, current risks, regulation and policy coverage, security service and asset control issues. Pitch your topic with ease and precision using this cyber risk dashboard with current risks and security service formats pdf. This layout presents information on current threats, current risks, regulation and policy coverage. It is also available for immediate download and adjustment. So, changes can be made in the color, design, graphics or any other component to create a unique layout.
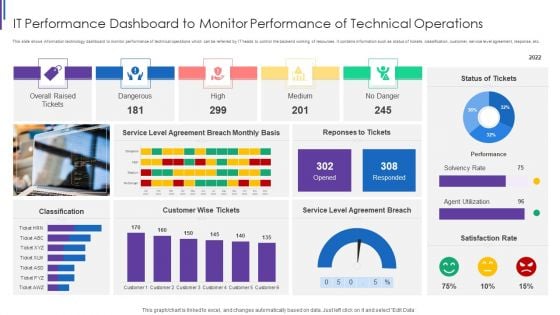
IT Performance Dashboard To Monitor Performance Of Technical Operations Download PDF
This slide shows information technology dashboard to monitor performance of technical operations which can be referred by IT heads to control the backend working of resources. It contains information such as status of tickets, classification, customer, service level agreement, response, etc. Showcasing this set of slides titled IT Performance Dashboard To Monitor Performance Of Technical Operations Download PDF. The topics addressed in these templates are Overall Raised Tickets, Dangerous High Medium, Service Level Agreement, Customer Wise Tickets. All the content presented in this PPT design is completely editable. Download it and make adjustments in color, background, font etc. as per your unique business setting.
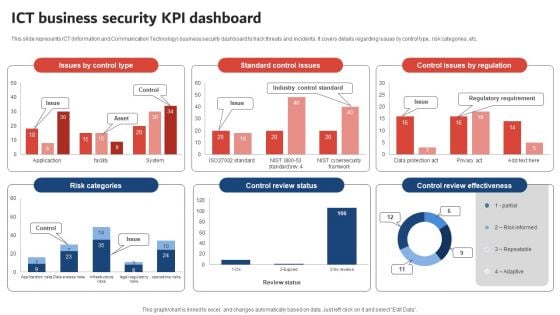
Execution Of ICT Strategic Plan ICT Business Security KPI Dashboard Designs PDF
This slide represents ICT Information and Communication Technology business security dashboard to track threats and incidents. It covers details regarding issues by control type, risk categories, etc. Boost your pitch with our creative Execution Of ICT Strategic Plan ICT Business Security KPI Dashboard Designs PDF. Deliver an awe inspiring pitch that will mesmerize everyone. Using these presentation templates you will surely catch everyones attention. You can browse the ppts collection on our website. We have researchers who are experts at creating the right content for the templates. So you do not have to invest time in any additional work. Just grab the template now and use them.
Real Time Employment Tracking Dashboard With Human Resource Metrics Brochure PDF
This slide showcases dashboard that can help human resource manager to track the salary and hiring status of employee in organization. Its key KPIs are permanent rate, turnover rate, absenteeism rate, employees hired and employees left. Showcasing this set of slides titled Real Time Employment Tracking Dashboard With Human Resource Metrics Brochure PDF. The topics addressed in these templates are Average Age, Permanent Rate, Headcount. All the content presented in this PPT design is completely editable. Download it and make adjustments in color, background, font etc. as per your unique business setting.
Reverse Proxy Web Server Dashboard For Reverse Proxy Performance Tracking Elements PDF
This slide represents the dashboard for reverse proxy performance tracking by covering details of CPU load, available memory, and connections. If your project calls for a presentation, then Slidegeeks is your go-to partner because we have professionally designed, easy-to-edit templates that are perfect for any presentation. After downloading, you can easily edit Reverse Proxy Web Server Dashboard For Reverse Proxy Performance Tracking Elements PDF and make the changes accordingly. You can rearrange slides or fill them with different images. Check out all the handy templates
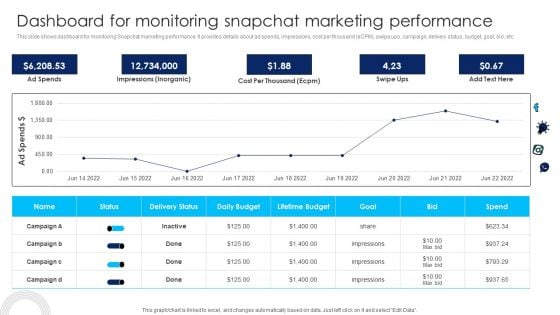
Using Social Media Platforms To Enhance Dashboard For Monitoring Snapchat Marketing Introduction PDF
This slide shows dashboard for monitoring Snapchat marketing performance. It provides details about ad spends, impressions, cost per thousand eCPM, swipe ups, campaign, delivery status, budget, goal, bid, etc. If your project calls for a presentation, then Slidegeeks is your go-to partner because we have professionally designed, easy-to-edit templates that are perfect for any presentation. After downloading, you can easily edit Using Social Media Platforms To Enhance Dashboard For Monitoring Snapchat Marketing Introduction PDF and make the changes accordingly. You can rearrange slides or fill them with different images. Check out all the handy templates
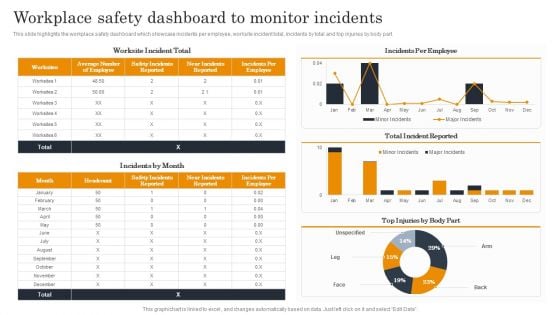
Employee Health And Safety Workplace Safety Dashboard To Monitor Incidents Ideas PDF
This slide highlights the workplace safety dashboard which showcase incidents per employee, worksite incident total, incidents by total and top injuries by body part. If your project calls for a presentation, then Slidegeeks is your go-to partner because we have professionally designed, easy-to-edit templates that are perfect for any presentation. After downloading, you can easily edit Employee Health And Safety Workplace Safety Dashboard To Monitor Incidents Ideas PDF and make the changes accordingly. You can rearrange slides or fill them with different images. Check out all the handy templates.
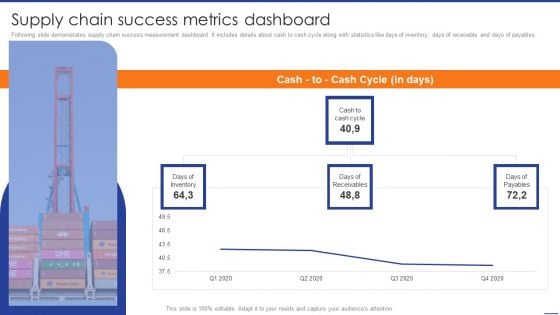
Digital Transformation Of Supply Supply Chain Success Metrics Dashboard Graphics PDF
Following slide demonstrates supply chain success measurement dashboard. It includes details about cash to cash cycle along with statistics like days of inventory, days of receivable and days of payables. If your project calls for a presentation, then Slidegeeks is your go-to partner because we have professionally designed, easy-to-edit templates that are perfect for any presentation. After downloading, you can easily edit Digital Transformation Of Supply Supply Chain Success Metrics Dashboard Graphics PDF and make the changes accordingly. You can rearrange slides or fill them with different images. Check out all the handy templates.
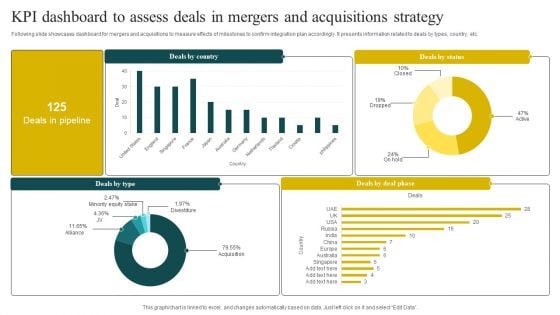
KPI Dashboard To Assess Deals In Mergers And Acquisitions Strategy Rules PDF
Following slide showcases dashboard for mergers and acquisitions to measure effects of milestones to confirm integration plan accordingly. It presents information related to deals by types, country, etc. Pitch your topic with ease and precision using this KPI Dashboard To Assess Deals In Mergers And Acquisitions Strategy Rules PDF. This layout presents information on Status, Strategy, Minority Equity Stake. It is also available for immediate download and adjustment. So, changes can be made in the color, design, graphics or any other component to create a unique layout.
Ultimate Guide To Improve Customer Support And Services Dashboard For Tracking Aftersales Customer Sample PDF
This slide covers the KPI dashboard for ticket tracking. It includes metrics such as tickets by month, service level, and details of customer service department agents. If your project calls for a presentation, then Slidegeeks is your go to partner because we have professionally designed, easy to edit templates that are perfect for any presentation. After downloading, you can easily edit Ultimate Guide To Improve Customer Support And Services Dashboard For Tracking Aftersales Customer Sample PDF and make the changes accordingly. You can rearrange slides or fill them with different images. Check out all the handy templates
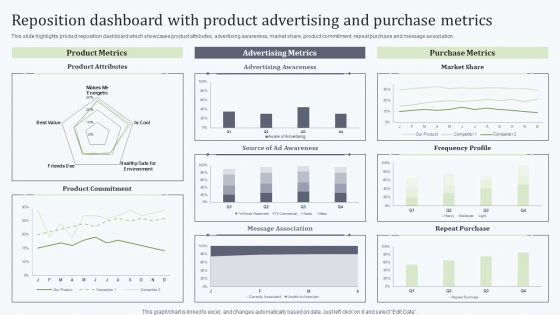
Deploying Revitalization Strategy Enhance Product And Service Sales Reposition Dashboard With Product Slides PDF
This slide highlights product reposition dashboard which showcases product attributes, advertising awareness, market share, product commitment, repeat purchase and message association. If your project calls for a presentation, then Slidegeeks is your go to partner because we have professionally designed, easy to edit templates that are perfect for any presentation. After downloading, you can easily edit Deploying Revitalization Strategy Enhance Product And Service Sales Reposition Dashboard With Product Slides PDF and make the changes accordingly. You can rearrange slides or fill them with different images. Check out all the handy templates
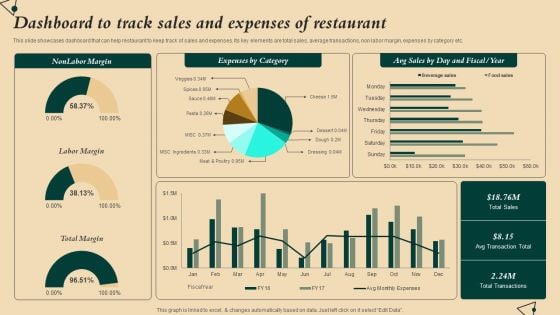
Coffeehouse Promotion Techniques To Boost Revenue Dashboard To Track Sales Expenses Restaurant Clipart PDF
This slide showcases dashboard that can help restaurant to keep track of sales and expenses. Its key elements are total sales, average transactions, non labor margin, expenses by category etc. If your project calls for a presentation, then Slidegeeks is your go-to partner because we have professionally designed, easy-to-edit templates that are perfect for any presentation. After downloading, you can easily edit Coffeehouse Promotion Techniques To Boost Revenue Dashboard To Track Sales Expenses Restaurant Clipart PDF and make the changes accordingly. You can rearrange slides or fill them with different images. Check out all the handy templates
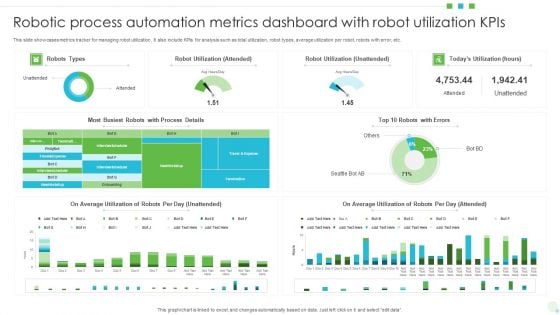
Robotic Process Automation Metrics Dashboard With Robot Utilization Kpis Background PDF
This slide showcases metrics tracker for managing robot utilization. It also include KPIs for analysis such as total utilization, robot types, average utilization per robot, robots with error, etc. Pitch your topic with ease and precision using this Robotic Process Automation Metrics Dashboard With Robot Utilization Kpis Background PDF. This layout presents information on Average Utilization, Robot Utilization, Automation Metrics Dashboard. It is also available for immediate download and adjustment. So, changes can be made in the color, design, graphics or any other component to create a unique layout.
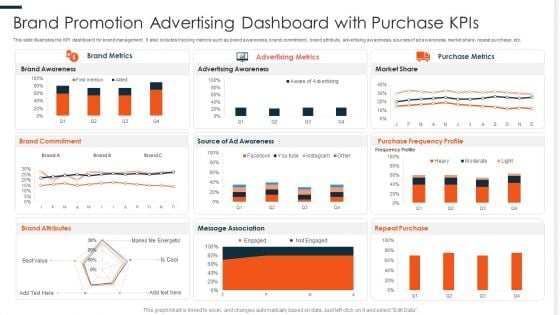
Brand Promotion Advertising Dashboard With Purchase Kpis Ppt PowerPoint Presentation File Format PDF
This slide illustrates the KPI dashboard for brand management. It also includes tracking metrics such as brand awareness, brand commitment, brand attribute, advertising awareness, sources of ad awareness, market share, repeat purchase, etc. Showcasing this set of slides titled Brand Promotion Advertising Dashboard With Purchase Kpis Ppt PowerPoint Presentation File Format PDF. The topics addressed in these templates are Brand Awareness, Advertising Awareness, Purchase Frequency. All the content presented in this PPT design is completely editable. Download it and make adjustments in color, background, font etc. as per your unique business setting.
Market Evaluation Of IT Industry Marketing Campaign Dashboard For B2b Marketers Icons PDF
The following slide showcases key performance indicator KPI dashboard that can assist managers to evaluate digital marketing campaign performance. The key metrics mentioned in the slide are click through rate CTR, conversion rate, cost per click CPC, etc. Make sure to capture your audiences attention in your business displays with our gratis customizable Market Evaluation Of IT Industry Marketing Campaign Dashboard For B2b Marketers Icons PDF. These are great for business strategies, office conferences, capital raising or task suggestions. If you desire to acquire more customers for your tech business and ensure they stay satisfied, create your own sales presentation with these plain slides.
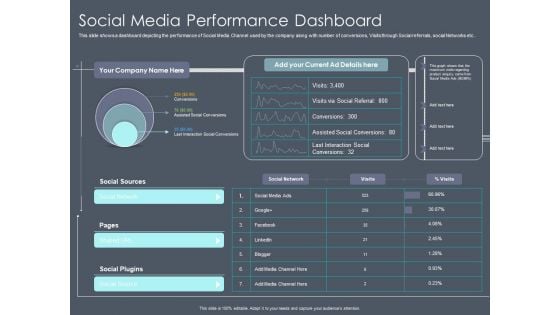
Private Equity Fund Pitch Deck To Raise Series C Funding Social Media Performance Dashboard Topics PDF
This slide shows a dashboard depicting the performance of Social Media Channel used by the company along with number of conversions, Visits through Social referrals, social Networks etc. This is a private equity fund pitch deck to raise series c funding social media performance dashboard topics pdf template with various stages. Focus and dispense information on three stages using this creative set, that comes with editable features. It contains large content boxes to add your information on topics like social sources, social plugins, social source, shared url. You can also showcase facts, figures, and other relevant content using this PPT layout. Grab it now.
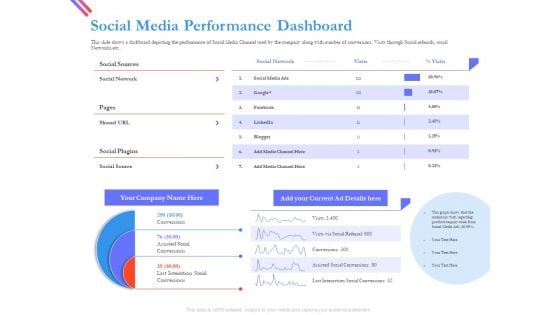
Pitch Deck For Fund Raising From Series C Funding Social Media Performance Dashboard Ideas PDF
This slide shows a dashboard depicting the performance of Social Media Channel used by the company along with number of conversions, Visits through Social referrals, social Networks etc. Presenting pitch deck for fund raising from series c funding social media performance dashboard ideas pdf to provide visual cues and insights. Share and navigate important information on three stages that need your due attention. This template can be used to pitch topics like social sources, social media. In addtion, this PPT design contains high resolution images, graphics, etc, that are easily editable and available for immediate download.
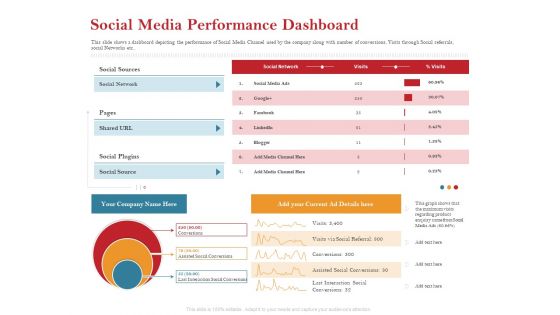
Pitch Deck For Raising Capital For Inorganic Growth Social Media Performance Dashboard Mockup PDF
This slide shows a dashboard depicting the performance of Social Media Channel used by the company along with number of conversions, Visits through Social referrals, social Networks etc. Presenting pitch deck for raising capital for inorganic growth social media performance dashboard mockup pdf to provide visual cues and insights. Share and navigate important information on three stages that need your due attention. This template can be used to pitch topics like social sources, social media. In addtion, this PPT design contains high resolution images, graphics, etc, that are easily editable and available for immediate download.
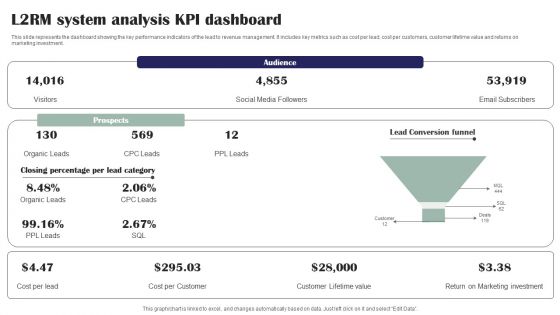
L2RM System Analysis KPI Dashboard Ppt PowerPoint Presentation File Microsoft PDF
This slide represents the dashboard showing the key performance indicators of the lead to revenue management. It includes key metrics such as cost per lead, cost per customers, customer lifetime value and returns on marketing investment. Presenting L2RM System Analysis KPI Dashboard Ppt PowerPoint Presentation File Microsoft PDF to dispense important information. This template comprises one stages. It also presents valuable insights into the topics including Audience, Prospects, Lead Conversion Funnel. This is a completely customizable PowerPoint theme that can be put to use immediately. So, download it and address the topic impactfully.

KPI Dashboard To Track Performance Of Sales To Cash Process Download PDF
This slide depicts a dashboard for business managers to keep the track of performance order to cash process for effective decision making. The key elements are orders received, cash receivables, order to cash key performance indicators, days of inventory outstanding etc. Showcasing this set of slides titled KPI Dashboard To Track Performance Of Sales To Cash Process Download PDF. The topics addressed in these templates are Orders Received, Cash Receivables, Days Inventory Outstanding. All the content presented in this PPT design is completely editable. Download it and make adjustments in color, background, font etc. as per your unique business setting.
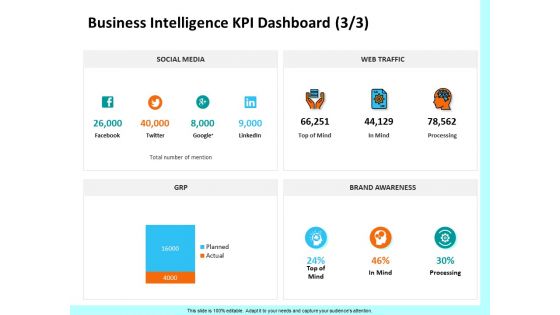
Firm Productivity Administration Business Intelligence KPI Dashboard Mind Ppt PowerPoint Presentation Outline Graphics PDF
Presenting this set of slides with name firm productivity administration business intelligence kpi dashboard mind ppt powerpoint presentation outline graphics pdf. This is a four stage process. The stages in this process are social media, web traffic, grp, brand awareness, mind, processing. This is a completely editable PowerPoint presentation and is available for immediate download. Download now and impress your audience.
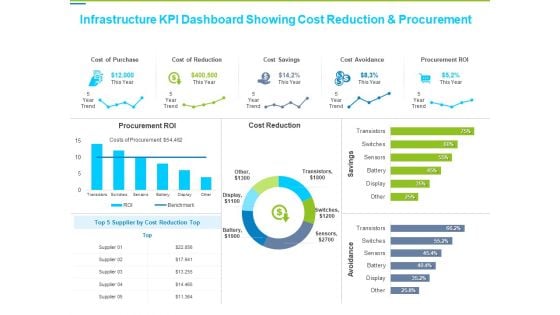
Framework Administration Infrastructure KPI Dashboard Showing Cost Reduction And Procurement Guidelines PDF
Deliver and pitch your topic in the best possible manner with this framework administration infrastructure kpi dashboard showing cost reduction and procurement guidelines pdf. Use them to share invaluable insights on cost of purchase, cost of reduction, cost savings, cost avoidance, procurement roi and impress your audience. This template can be altered and modified as per your expectations. So, grab it now.
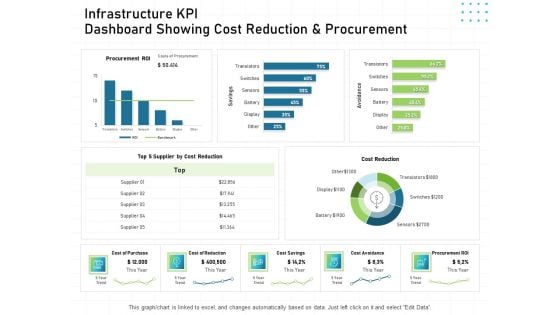
IT Infrastructure Administration Infrastructure KPI Dashboard Showing Cost Reduction And Procurement Ppt Model Deck PDF
Deliver an awe inspiring pitch with this creative it infrastructure administration infrastructure kpi dashboard showing cost reduction and procurement ppt model deck pdf bundle. Topics like cost of purchase, cost of reduction, cost savings, cost avoidance, procurement roi can be discussed with this completely editable template. It is available for immediate download depending on the needs and requirements of the user.
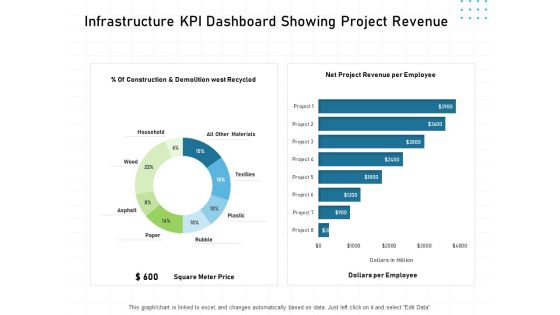
IT Infrastructure Administration Infrastructure KPI Dashboard Showing Project Revenue Ppt Summary Grid PDF
Deliver and pitch your topic in the best possible manner with this it infrastructure administration infrastructure kpi dashboard showing project revenue ppt summary grid pdf. Use them to share invaluable insights on household, textiles, plastic, rubble, paper, asphalt and impress your audience. This template can be altered and modified as per your expectations. So, grab it now.
IT Infrastructure Administration Infrastructure KPI Dashboard Showing Resource Allocation Ppt Icon Clipart Images PDF
Deliver an awe inspiring pitch with this creative it infrastructure administration infrastructure kpi dashboard showing resource allocation ppt icon clipart images pdf bundle. Topics like days per project, project financial, resource allocation, delivery timeline and resources can be discussed with this completely editable template. It is available for immediate download depending on the needs and requirements of the user.
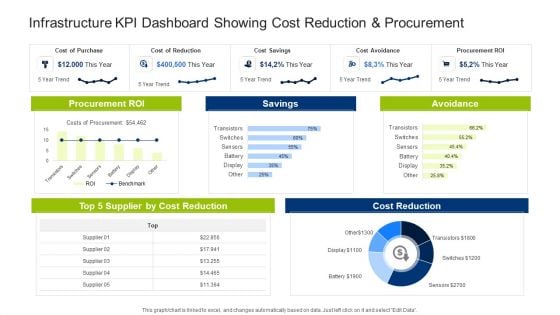
Infrastructure Building Administration Infrastructure KPI Dashboard Showing Cost Reduction And Procurement Inspiration PDF
Deliver and pitch your topic in the best possible manner with this infrastructure building administration infrastructure kpi dashboard showing cost reduction and procurement inspiration pdf. Use them to share invaluable insights on cost of purchase, cost of reduction, cost avoidance, savings, avoidance and impress your audience. This template can be altered and modified as per your expectations. So, grab it now.
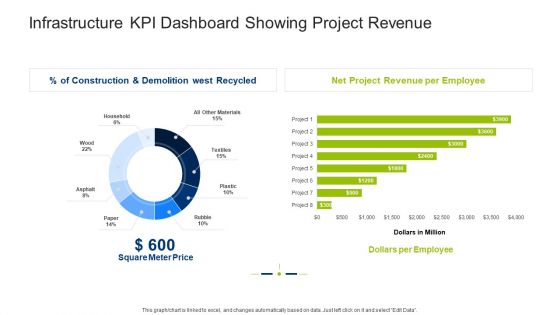
Infrastructure Building Administration Infrastructure KPI Dashboard Showing Project Revenue Clipart PDF
Deliver an awe inspiring pitch with this creative infrastructure building administration infrastructure kpi dashboard showing project revenue clipart pdf bundle. Topics like square meter price, net project revenue per employee, dollars per employee can be discussed with this completely editable template. It is available for immediate download depending on the needs and requirements of the user.
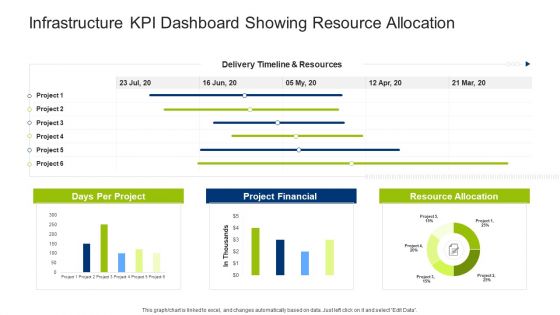
Infrastructure Building Administration Infrastructure KPI Dashboard Showing Resource Allocation Background PDF
Deliver and pitch your topic in the best possible manner with this infrastructure building administration infrastructure kpi dashboard showing resource allocation background pdf. Use them to share invaluable insights on days per project, project financial, resource allocation and impress your audience. This template can be altered and modified as per your expectations. So, grab it now.

Infrastructure Designing And Administration Infrastructure KPI Dashboard Showing Cost Reduction And Procurement Diagrams PDF
Deliver an awe inspiring pitch with this creative infrastructure designing and administration infrastructure kpi dashboard showing cost reduction and procurement diagrams pdf bundle. Topics like cost of purchase, cost of reduction, cost savings, cost avoidance, procurement roi can be discussed with this completely editable template. It is available for immediate download depending on the needs and requirements of the user.
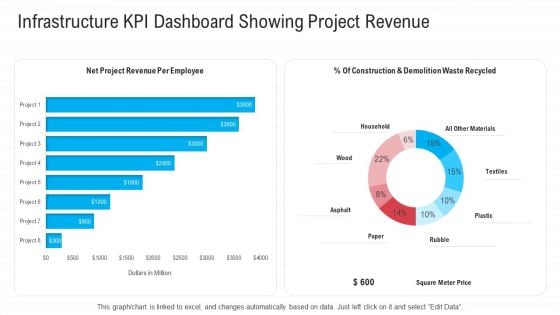
Infrastructure Designing And Administration Infrastructure KPI Dashboard Showing Project Revenue Professional PDF
Deliver and pitch your topic in the best possible manner with this infrastructure designing and administration infrastructure kpi dashboard showing project revenue professional pdf. Use them to share invaluable insights on household, textiles, plastic, rubble, paper, asphalt and impress your audience. This template can be altered and modified as per your expectations. So, grab it now.
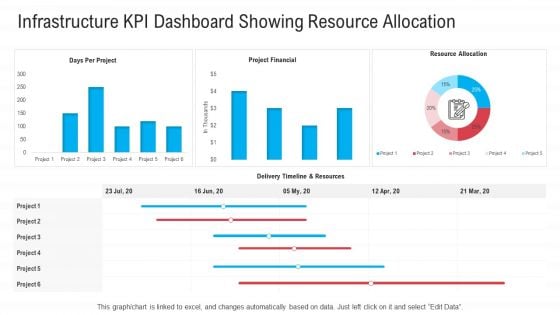
Infrastructure Designing And Administration Infrastructure KPI Dashboard Showing Resource Allocation Demonstration PDF
Deliver an awe inspiring pitch with this creative infrastructure designing and administration infrastructure kpi dashboard showing resource allocation demonstration pdf bundle. Topics like days per project, project financial, resource allocation, delivery timeline and resources can be discussed with this completely editable template. It is available for immediate download depending on the needs and requirements of the user.
Monthly Project Progress Report Dashboard With Execution Timeline Ppt Icon Graphics Tutorials PDF
This slide showcases monthly project status dashboard with execution timeline. It provides information about sponsor, financials, budget, key risks and issues, work stream , etc. Presenting Monthly Project Progress Report Dashboard With Execution Timeline Ppt Icon Graphics Tutorials PDF to dispense important information. This template comprises one stages. It also presents valuable insights into the topics including Execution Timeline, Project Status, Project Manager. This is a completely customizable PowerPoint theme that can be put to use immediately. So, download it and address the topic impactfully.
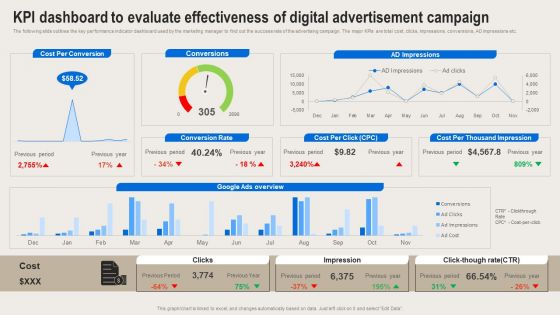
Formulating Branding Strategy To Enhance Revenue And Sales KPI Dashboard To Evaluate Effectivenessl Clipart PDF
The following slide outlines the key performance indicator dashboard used by the marketing manager to find out the success rate of the advertising campaign. The major KPIs are total cost, clicks, impressions, conversions, AD impressions etc. There are so many reasons you need a Formulating Branding Strategy To Enhance Revenue And Sales KPI Dashboard To Evaluate Effectivenessl Clipart PDF. The first reason is you cannot spend time making everything from scratch, Thus, Slidegeeks has made presentation templates for you too. You can easily download these templates from our website easily.
Warehouse Automation Deployment Dashboard For Tracking Impact Of Warehouse House Infographics PDF
This slide covers the dashboard with after automation warehouse overview. It include KPIs such as autonomous robots status, robotic arms status, battery level, performance, time to return, etc. Deliver and pitch your topic in the best possible manner with this Warehouse Automation Deployment Dashboard For Tracking Impact Of Warehouse House Infographics PDF. Use them to share invaluable insights on Autonomous Robot, Systems Engineer, Warehouse Manager and impress your audience. This template can be altered and modified as per your expectations. So, grab it now.
Automating Supply Chain Dashboard For Tracking Impact Of Supply Chain Automation Pictures PDF
This slide covers the dashboard for back-end tracking of overall impact automation. It include KPIs such as retailer capacity, warehouse capacity, truck efficiency, time to reach warehouse, sustainability, etc. Deliver and pitch your topic in the best possible manner with this Automating Supply Chain Dashboard For Tracking Impact Of Supply Chain Automation Pictures PDF. Use them to share invaluable insights on Supply Chain Manager, Warehouse Manager, Truck Driver and impress your audience. This template can be altered and modified as per your expectations. So, grab it now.
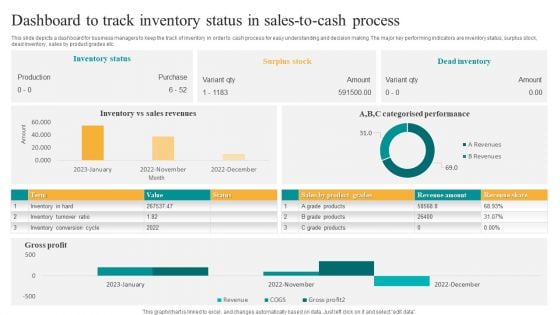
Dashboard To Track Inventory Status In Sales To Cash Process Themes PDF
This slide depicts a dashboard for business managers to keep the track of inventory in order to cash process for easy understanding and decision making. The major key performing indicators are inventory status, surplus stock, dead inventory, sales by product grades etc. Showcasing this set of slides titled Dashboard To Track Inventory Status In Sales To Cash Process Themes PDF. The topics addressed in these templates are Inventory Status, Surplus Stock, Dead Inventory. All the content presented in this PPT design is completely editable. Download it and make adjustments in color, background, font etc. as per your unique business setting.
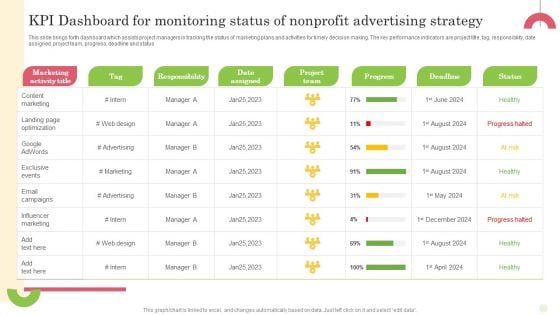
Kpi Dashboard For Monitoring Status Of Nonprofit Advertising Strategy Portrait PDF
This slide brings forth dashboard which assists project managers in tracking the status of marketing plans and activities for timely decision making. The key performance indicators are project title, tag, responsibility, date assigned, project team, progress, deadline and status Pitch your topic with ease and precision using this Kpi Dashboard For Monitoring Status Of Nonprofit Advertising Strategy Portrait PDF. This layout presents information on Tag, Responsibility, Date Assigned. It is also available for immediate download and adjustment. So, changes can be made in the color, design, graphics or any other component to create a unique layout.
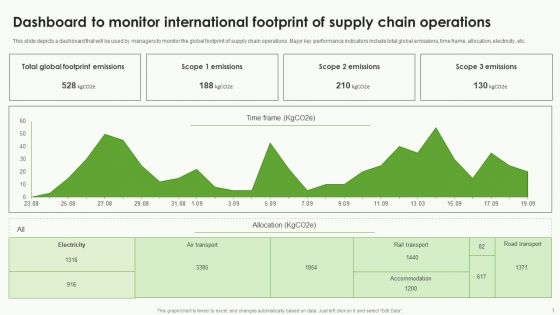
Dashboard To Monitor International Footprint Of Supply Chain Operations Brochure PDF
This slide depicts a dashboard that will be used by managers to monitor the global footprint of supply chain operations. Major key performance indicators include total global emissions, time frame, allocation, electricity, etc. Showcasing this set of slides titled Dashboard To Monitor International Footprint Of Supply Chain Operations Brochure PDF. The topics addressed in these templates are Electricity, Footprint Emissions, Allocation. All the content presented in this PPT design is completely editable. Download it and make adjustments in color, background, font etc. as per your unique business setting.
Professional Scrum Master Training IT Software Development Progress Tracking Dashboard Mockup PDF
This slide portrays software development project management dashboard with KPIs namely status of planning, design, development, testing project launch date, project budget, overdue tasks, workload and upcoming deadlines. Deliver and pitch your topic in the best possible manner with this professional scrum master training it software development progress tracking dashboard mockup pdf. Use them to share invaluable insights on financial risk, people risk, governance risk, competitive risk, system or technology and impress your audience. This template can be altered and modified as per your expectations. So, grab it now.
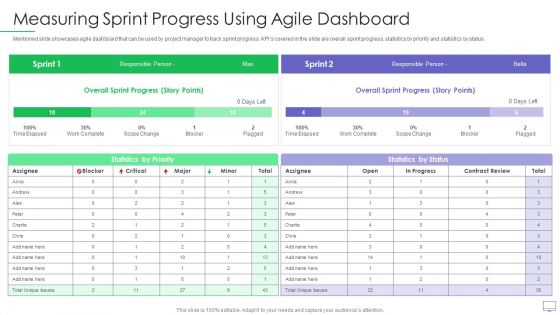
Guide For Software Developers Measuring Sprint Progress Using Agile Dashboard Rules PDF
Mentioned slide showcases agile dashboard that can be used by project manager to track sprint progress. KPIs covered in the slide are overall sprint progress, statistics by priority and statistics by status. Deliver and pitch your topic in the best possible manner with this guide for software developers measuring sprint progress using agile dashboard rules pdf. Use them to share invaluable insights on overall sprint progress, statistics by priority and impress your audience. This template can be altered and modified as per your expectations. So, grab it now.
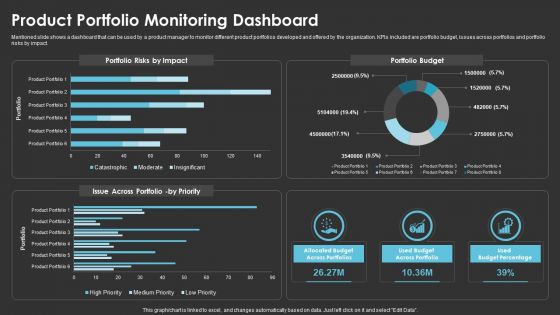
Method To Introduce New Product Offerings In The Industry Product Portfolio Monitoring Dashboard Template PDF
Mentioned slide shows a dashboard that can be used by a product manager to monitor different product portfolios developed and offered by the organization. KPIs included are portfolio budget, issues across portfolios and portfolio risks by impact. Deliver and pitch your topic in the best possible manner with this Method To Introduce New Product Offerings In The Industry Product Portfolio Monitoring Dashboard Template PDF. Use them to share invaluable insights on Portfolio Risks, Portfolio Budget and impress your audience. This template can be altered and modified as per your expectations. So, grab it now.
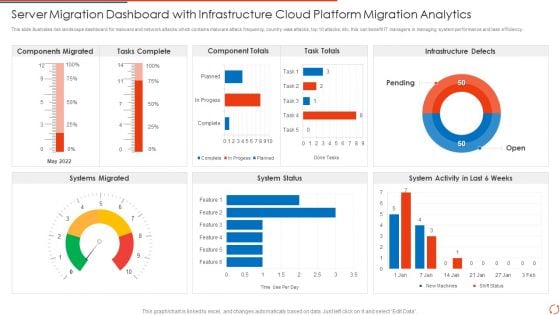
Server Migration Dashboard With Infrastructure Cloud Platform Migration Analytics Elements PDF Portrait PDF
This slide illustrates risk landscape dashboard for malware and network attacks which contains malware attack frequency, country wise attacks, top 10 attacks, etc. this can benefit IT managers in managing system performance and task efficiency Pitch your topic with ease and precision using this Server Migration Dashboard With Infrastructure Cloud Platform Migration Analytics Elements PDF Portrait PDF. This layout presents information on Tasks Complete, Component Totals, Task Totals. It is also available for immediate download and adjustment. So, changes can be made in the color, design, graphics or any other component to create a unique layout.
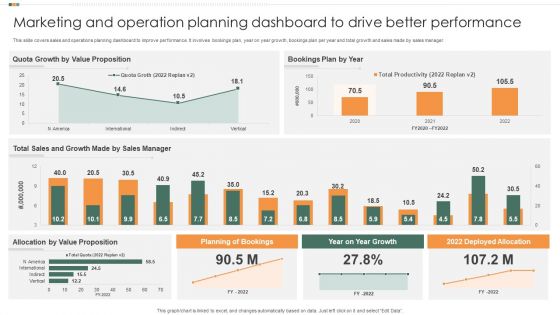
Marketing And Operation Planning Dashboard To Drive Better Performance Graphics PDF
This slide covers sales and operations planning dashboard to improve performance. It involves bookings plan, year on year growth, bookings plan per year and total growth and sales made by sales manager. Showcasing this set of slides titled Marketing And Operation Planning Dashboard To Drive Better Performance Graphics PDF. The topics addressed in these templates are Sales Manager, Growth Made, Bookings Plan By Year. All the content presented in this PPT design is completely editable. Download it and make adjustments in color, background, font etc. as per your unique business setting.
Operations Of Commercial Bank Dashboard Tracking Online Banking Activities Topics PDF
This slide contains dashboard that will allow bank to track the online customer activities in terms of new customer connected with bank on online platform, fraud prevention. It will also help the bank in tracking the numbers of employees that are connected to bank through mobile access. Deliver and pitch your topic in the best possible manner with this operations of commercial bank dashboard tracking online banking activities topics pdf. Use them to share invaluable insights on express invoicing, account management, fraud prevention, payroll service and impress your audience. This template can be altered and modified as per your expectations. So, grab it now.
Executing Online Solution In Banking Dashboard Tracking Online Banking Activities Structure PDF
This slide contains dashboard that will allow bank to track the online customer activities in terms of new customer connected with bank on online platform, fraud prevention. It will also help the bank in tracking the numbers of employees that are connected to bank through mobile access. Deliver and pitch your topic in the best possible manner with this executing online solution in banking dashboard tracking online banking activities structure pdf. Use them to share invaluable insights on payroll service, express invoicing, account management, fraud prevention and impress your audience. This template can be altered and modified as per your expectations. So, grab it now.
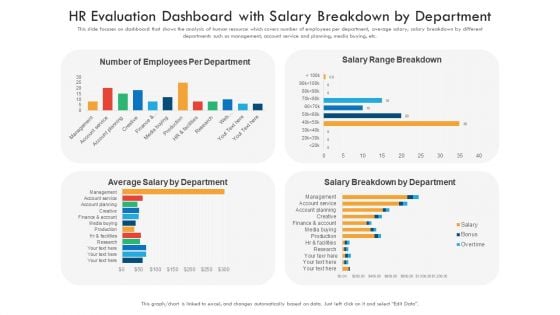
HR Evaluation Dashboard With Salary Breakdown By Department Ppt PowerPoint Presentation Templates PDF
This slide focuses on dashboard that shows the analysis of human resource which covers number of employees per department, average salary, salary breakdown by different departments such as management, account service and planning, media buying, etc. Showcasing this set of slides titled HR evaluation dashboard with salary breakdown by department ppt powerpoint presentation templates pdf. The topics addressed in these templates are finance account, web development, account planning. All the content presented in this PPT design is completely editable. Download it and make adjustments in color, background, font etc. as per your unique business setting.
Developing Firm Security Strategy Plan Security Incidents Tracking Dashboard Alerts Graphics PDF
This slide portrays information regarding the dashboard that firm will track various incidents detected. These incidents will be managed in order to avoid security risks. Presenting developing firm security strategy plan security incidents tracking dashboard alerts graphics pdf to provide visual cues and insights. Share and navigate important information on eight stages that need your due attention. This template can be used to pitch topics like application whitelisting, patch applications, patch operating systems, restrict admin privileges. In addtion, this PPT design contains high resolution images, graphics, etc, that are easily editable and available for immediate download.
Developing Firm Security Strategy Plan Security Incidents Tracking Dashboard Growth Guidelines PDF
This slide portrays information regarding the dashboard that firm will track various security incidents detected. These incidents will be managed in order to avoid security risks. Deliver and pitch your topic in the best possible manner with this developing firm security strategy plan security incidents tracking dashboard growth guidelines pdf. Use them to share invaluable insights on number of open security incidents, open security incidents by age, average age of open security incidents, security incident backlog growth and impress your audience. This template can be altered and modified as per your expectations. So, grab it now.
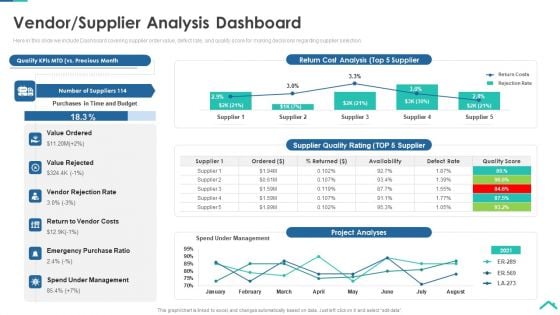
Risk Analysis Strategies For Real Estate Construction Project Vendor Supplier Analysis Dashboard Sample PDF
Here in this slide we include Dashboard covering supplier order value, defect rate, and quality score for making decisions regarding supplier selection. Deliver an awe inspiring pitch with this creative risk analysis strategies for real estate construction project vendor supplier analysis dashboard sample pdf bundle. Topics like value ordered, value rejected, vendor rejection rate, return to vendor costs, emergency purchase ratio, spend under management can be discussed with this completely editable template. It is available for immediate download depending on the needs and requirements of the user.
E2E Quality Assurance And Testing In Developer Operations IT Tracking Devops Dashboard Guidelines PDF Mockup PDF
This slide provides information regarding essential quality management activities tracking dashboard in DevOps in terms of quality health such as static analysis, code coverage and unit tests. Deliver and pitch your topic in the best possible manner with this e2e quality assurance and testing in developer operations it tracking devops dashboard guidelines pdf mockup pdf Use them to share invaluable insights on iteration performance, release quality, engagement level and impress your audience. This template can be altered and modified as per your expectations. So, grab it now.
Transformation Plan Issues Tracking Dashboard For Transition Project Ppt Summary Layouts PDF
This slide shows the issues tracking the dashboard for the business transition project. It provides details of multiple issues faced by users to keep records for effective management of the project. Deliver and pitch your topic in the best possible manner with this transformation plan issues tracking dashboard for transition project ppt summary layouts pdf. Use them to share invaluable insights on employee wise issues status, overall issues status, immediate issues, suspect requirements and impress your audience. This template can be altered and modified as per your expectations. So, grab it now.
SFA Dashboard To Track Performance Ppt PowerPoint Presentation Icon Example File PDF
This Slide visually represents sales force automation dashboard to track performance which can be utilized by marketing managers to streamline the process of automated selling. It includes information about sales pipeline, competitors, opportunities, key competitors, etc. Pitch your topic with ease and precision using this sfa dashboard to track performance ppt powerpoint presentation icon example file pdf. This layout presents information on sales pipeline, sales pipeline by sales rep, key competitors, forecast by month, key opportunities. It is also available for immediate download and adjustment. So, changes can be made in the color, design, graphics or any other component to create a unique layout.


 Continue with Email

 Home
Home


