Computer Network Icons
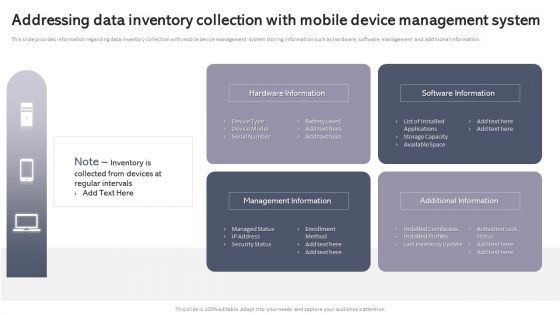
Addressing Data Inventory Collection With Mobile Device Management System Designs PDF
This slide provides information regarding data inventory collection with mobile device management system storing information such as hardware, software, management and additional information. If you are looking for a format to display your unique thoughts, then the professionally designed Addressing Data Inventory Collection With Mobile Device Management System Designs PDF is the one for you. You can use it as a Google Slides template or a PowerPoint template. Incorporate impressive visuals, symbols, images, and other charts. Modify or reorganize the text boxes as you desire. Experiment with shade schemes and font pairings. Alter, share or cooperate with other people on your work. Download Addressing Data Inventory Collection With Mobile Device Management System Designs PDF and find out how to give a successful presentation. Present a perfect display to your team and make your presentation unforgettable.
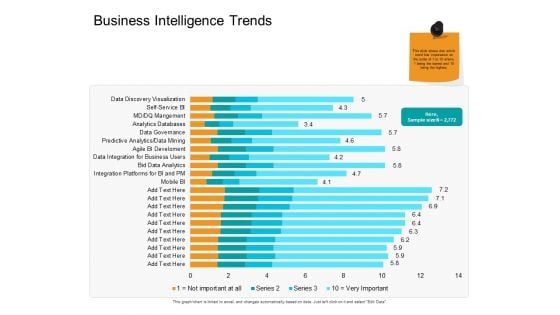
Facts Assessment Business Intelligence Trends Ppt PowerPoint Presentation Infographics Examples PDF
Presenting this set of slides with name facts assessment business intelligence trends ppt powerpoint presentation infographics examples pdf. The topics discussed in these slides are mobile bi, integration platforms bi and pm, bid data analytics, data integration for business users, agile bi development, predictive analytics, data mining, data governance, analytics databases. This is a completely editable PowerPoint presentation and is available for immediate download. Download now and impress your audience.
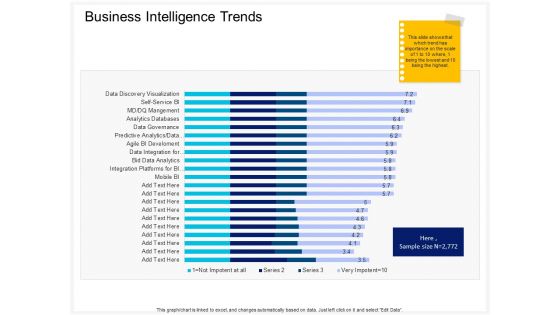
Enterprise Problem Solving And Intellect Business Intelligence Trends Ppt PowerPoint Presentation Styles Graphics PDF
Presenting this set of slides with name enterprise problem solving and intellect business intelligence trends ppt powerpoint presentation styles graphics pdf. The topics discussed in these slides are mobile bi, integration platforms bi and pm, bid data analytics, data integration for business users, agile bi development, predictive analytics, data mining, data governance, analytics databases. This is a completely editable PowerPoint presentation and is available for immediate download. Download now and impress your audience.

Firm Productivity Administration Business Intelligence Trends Ppt PowerPoint Presentation Outline Ideas PDF
Presenting this set of slides with name firm productivity administration business intelligence trends ppt powerpoint presentation outline ideas pdf. The topics discussed in these slides are mobile bi, integration platforms bi and pm, bid data analytics, data integration for business users, agile bi development, predictive analytics, data mining, data governance, analytics databases. This is a completely editable PowerPoint presentation and is available for immediate download. Download now and impress your audience.
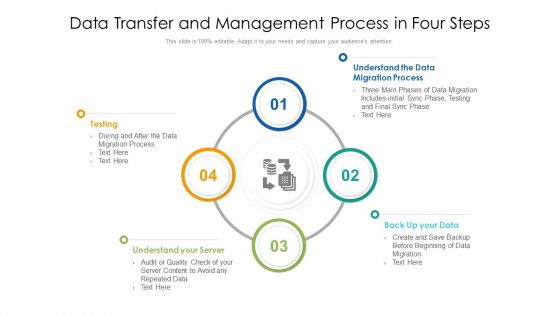
Data Transfer And Management Process In Four Steps Ppt PowerPoint Presentation Show Graphics PDF
Presenting data transfer and management process in four steps ppt powerpoint presentation show graphics pdf to dispense important information. This template comprises four stages. It also presents valuable insights into the topics including understand your server, back up your data, understand the data migration process. This is a completely customizable PowerPoint theme that can be put to use immediately. So, download it and address the topic impactfully.
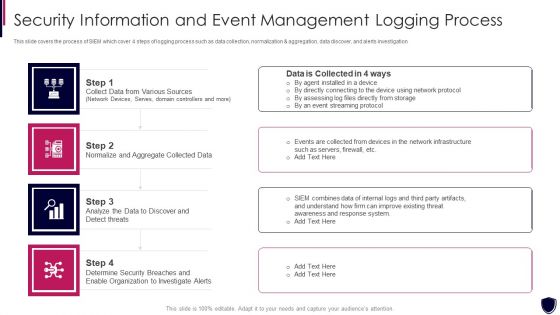
Security Information And Event Management Logging Process Diagrams PDF
This slide covers the process of SIEM which cover 4 steps of logging process such as data collection, normalization and aggregation, data discover, and alerts investigation. This is a security information and event management logging process diagrams pdf template with various stages. Focus and dispense information on four stages using this creative set, that comes with editable features. It contains large content boxes to add your information on topics like collect data from various sources, normalize and aggregate collected data, organization to investigate alerts. You can also showcase facts, figures, and other relevant content using this PPT layout. Grab it now.
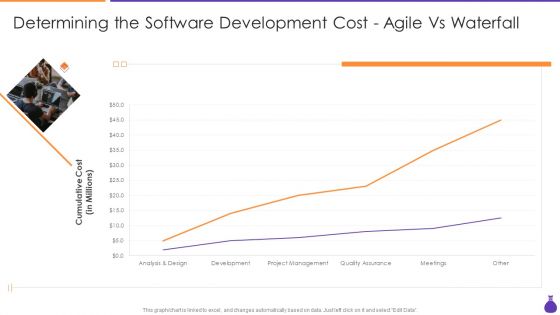
Why Is Agile Cost Effective IT Determining The Software Development Cost Agile Demonstration PDF
This graph or chart is linked to excel, and changes automatically based on data. Just left click on it and select Edit Data. Deliver and pitch your topic in the best possible manner with this Why Is Agile Cost Effective IT Determining The Software Development Cost Agile Demonstration PDF. Use them to share invaluable insights on Analysis And Design, Development, Project Management, Quality Assurance and impress your audience. This template can be altered and modified as per your expectations. So, grab it now.
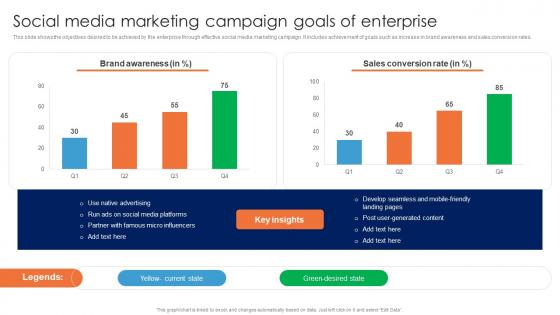
Social Media Marketing Campaign Goals Of Enterprise Guide For Data Driven Advertising Infographics Pdf
This slide shows the objectives desired to be achieved by the enterprise through effective social media marketing campaign. It includes achievement of goals such as increase in brand awareness and sales conversion rates.The best PPT templates are a great way to save time, energy, and resources. Slidegeeks have 100Precent editable powerpoint slides making them incredibly versatile. With these quality presentation templates, you can create a captivating and memorable presentation by combining visually appealing slides and effectively communicating your message. Download Social Media Marketing Campaign Goals Of Enterprise Guide For Data Driven Advertising Infographics Pdf from Slidegeeks and deliver a wonderful presentation. This slide shows the objectives desired to be achieved by the enterprise through effective social media marketing campaign. It includes achievement of goals such as increase in brand awareness and sales conversion rates.
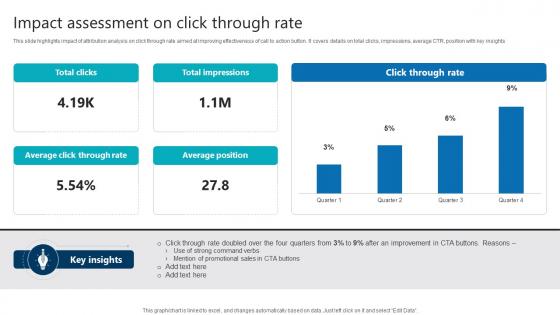
Impact Assessment On Click Through Rate Product Analytics Implementation Data Analytics V
This slide highlights impact of attribution analysis on click through rate aimed at improving effectiveness of call to action button. It covers details on total clicks, impressions, average CTR, position with key insights The best PPT templates are a great way to save time, energy, and resources. Slidegeeks have 100 percent editable powerpoint slides making them incredibly versatile. With these quality presentation templates, you can create a captivating and memorable presentation by combining visually appealing slides and effectively communicating your message. Download Impact Assessment On Click Through Rate Product Analytics Implementation Data Analytics V from Slidegeeks and deliver a wonderful presentation. This slide highlights impact of attribution analysis on click through rate aimed at improving effectiveness of call to action button. It covers details on total clicks, impressions, average CTR, position with key insights
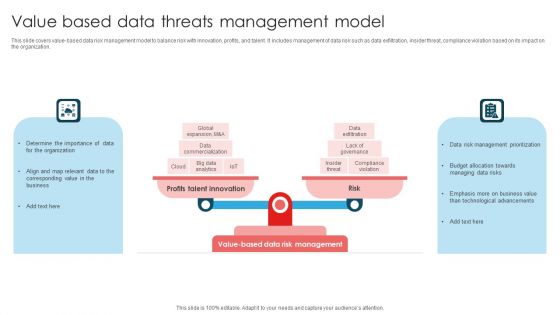
Value Based Data Threats Management Model Ppt Layouts Clipart Images PDF
This slide covers value-based data risk management model to balance risk with innovation, profits, and talent. It includes management of data risk such as data exfiltration, insider threat, compliance violation based on its impact on the organization. Presenting Value Based Data Threats Management Model Ppt Layouts Clipart Images PDF to dispense important information. This template comprises TWO stages. It also presents valuable insights into the topics including Profits Talent Innovation, Risk, Value Based, Data Risk Management. This is a completely customizable PowerPoint theme that can be put to use immediately. So, download it and address the topic impactfully.
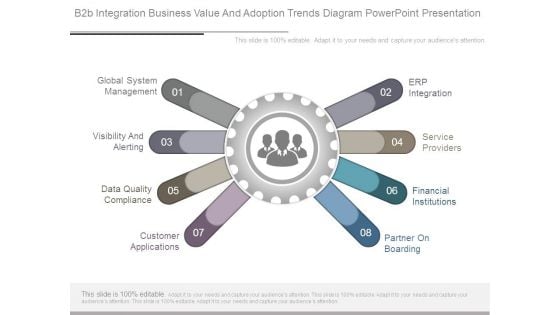
B2b Integration Business Value And Adoption Trends Diagram Powerpoint Presentation
This is a b2b integration business value and adoption trends diagram powerpoint presentation. This is a eight stage process. The stages in this process are global system management, visibility and alerting, data quality compliance, customer applications, erp integration, service providers, financial institutions, partner on boarding.
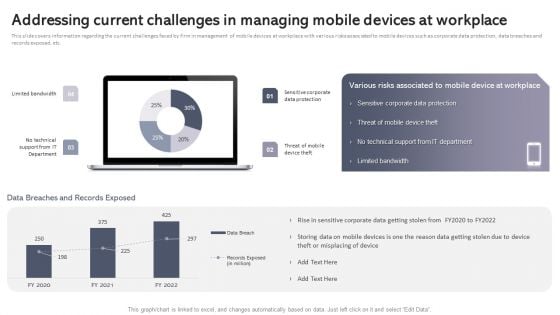
Addressing Current Challenges In Managing Mobile Devices At Workplace Diagrams PDF
This slide covers information regarding the current challenges faced by firm in management of mobile devices at workplace with various risks associated to mobile devices such as corporate data protection, data breaches and records exposed, etc. Presenting this PowerPoint presentation, titled Addressing Current Challenges In Managing Mobile Devices At Workplace Diagrams PDF, with topics curated by our researchers after extensive research. This editable presentation is available for immediate download and provides attractive features when used. Download now and captivate your audience. Presenting this Addressing Current Challenges In Managing Mobile Devices At Workplace Diagrams PDF. Our researchers have carefully researched and created these slides with all aspects taken into consideration. This is a completely customizable Addressing Current Challenges In Managing Mobile Devices At Workplace Diagrams PDF that is available for immediate downloading. Download now and make an impact on your audience. Highlight the attractive features available with our PPTs.
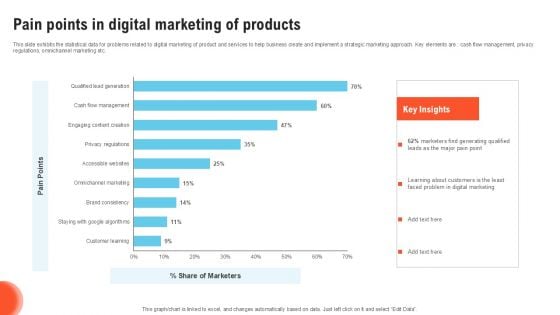
Pain Points In Digital Marketing Of Products Graphics PDF
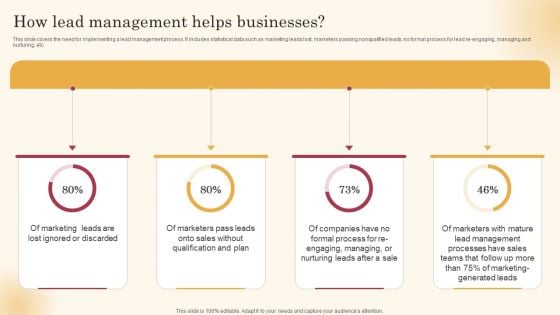
How Lead Management Helps Businesses Improving Lead Generation Process Clipart PDF
This slide covers the need for implementing a lead management process. It includes statistical data such as marketing leads lost, marketers passing nonqualified leads, no formal process for lead re-engaging, managing and nurturing, etc. The best PPT templates are a great way to save time, energy, and resources. Slidegeeks have 100 percent editable powerpoint slides making them incredibly versatile. With these quality presentation templates, you can create a captivating and memorable presentation by combining visually appealing slides and effectively communicating your message. Download How Lead Management Helps Businesses Improving Lead Generation Process Clipart PDF from Slidegeeks and deliver a wonderful presentation.
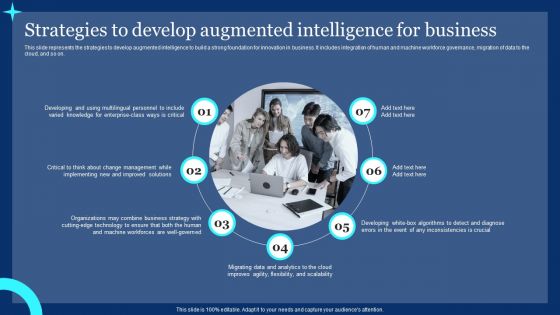
Strategies To Develop Augmented Intelligence For Business Ppt PowerPoint Presentation Diagram PDF
This slide represents the strategies to develop augmented intelligence to build a strong foundation for innovation in business. It includes integration of human and machine workforce governance, migration of data to the cloud, and so on. Formulating a presentation can take up a lot of effort and time, so the content and message should always be the primary focus. The visuals of the PowerPoint can enhance the presenters message, so our Strategies To Develop Augmented Intelligence For Business Ppt PowerPoint Presentation Diagram PDF was created to help save time. Instead of worrying about the design, the presenter can concentrate on the message while our designers work on creating the ideal templates for whatever situation is needed. Slidegeeks has experts for everything from amazing designs to valuable content, we have put everything into Strategies To Develop Augmented Intelligence For Business Ppt PowerPoint Presentation Diagram PDF.
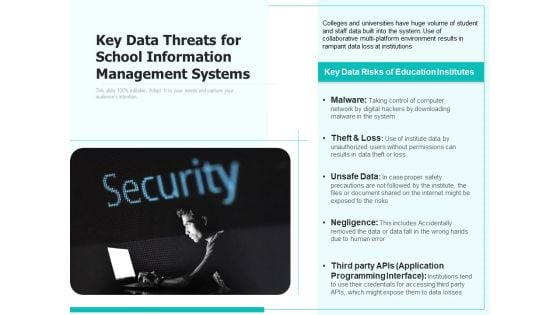
Key Data Threats For School Information Management Systems Ppt PowerPoint Presentation Slides Examples PDF
Presenting key data threats for school information management systems ppt powerpoint presentation slides examples pdf to dispense important information. This template comprises one stages. It also presents valuable insights into the topics including malware, theft and loss, unsafe data, negligence, third party apis application programming interface institutions. This is a completely customizable PowerPoint theme that can be put to use immediately. So, download it and address the topic impactfully.
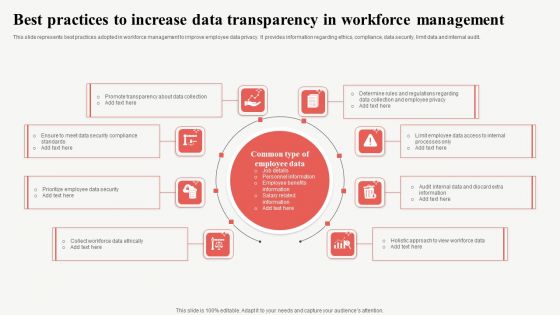
Best Practices To Increase Data Transparency In Workforce Management Demonstration PDF
This slide represents best practices adopted in workforce management to improve employee data privacy. It provides information regarding ethics, compliance, data security, limit data and internal audit. Presenting Best Practices To Increase Data Transparency In Workforce Management Demonstration PDF to dispense important information. This template comprises eight stages. It also presents valuable insights into the topics including Employee Privacy, Data Collection, Determine. This is a completely customizable PowerPoint theme that can be put to use immediately. So, download it and address the topic impactfully.
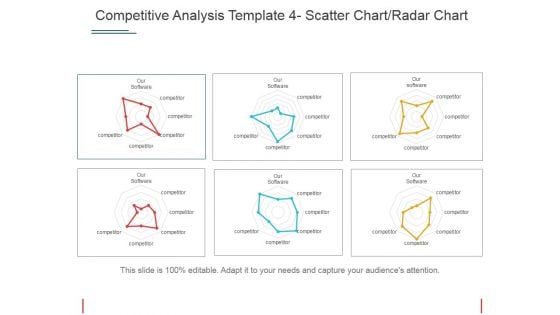
Competitive Analysis Scatter Chart Radar Chart Ppt PowerPoint Presentation Portfolio Templates
This is a competitive analysis scatter chart radar chart ppt powerpoint presentation portfolio templates. This is a eight stage process. The stages in this process are users interface, data import, example, pricing, support.
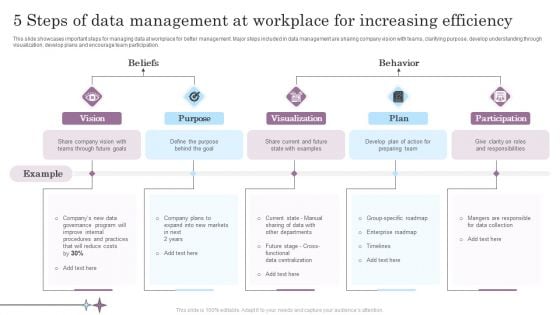
5 Steps Of Data Management At Workplace For Increasing Efficiency Inspiration PDF
This slide showcases important steps for managing data at workplace for better management. Major steps included in data management are sharing company vision with teams, clarifying purpose, develop understanding through visualization, develop plans and encourage team participation. Presenting 5 Steps Of Data Management At Workplace For Increasing Efficiency Inspiration PDF to dispense important information. This template comprises five stages. It also presents valuable insights into the topics including Visualization, Plan, Goals. This is a completely customizable PowerPoint theme that can be put to use immediately. So, download it and address the topic impactfully.
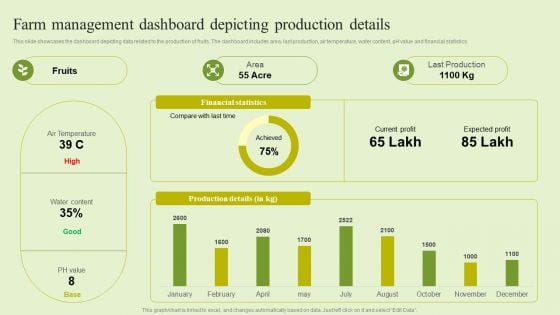
Agriculture Marketing Strategy To Improve Revenue Performance Farm Management Dashboard Depicting Production Themes PDF
This slide showcases the dashboard depicting data related to the production of fruits. The dashboard includes area, last production, air temperature, water content, pH value and financial statistics. Coming up with a presentation necessitates that the majority of the effort goes into the content and the message you intend to convey. The visuals of a PowerPoint presentation can only be effective if it supplements and supports the story that is being told. Keeping this in mind our experts created Agriculture Marketing Strategy To Improve Revenue Performance Farm Management Dashboard Depicting Production Themes PDF to reduce the time that goes into designing the presentation. This way, you can concentrate on the message while our designers take care of providing you with the right template for the situation.
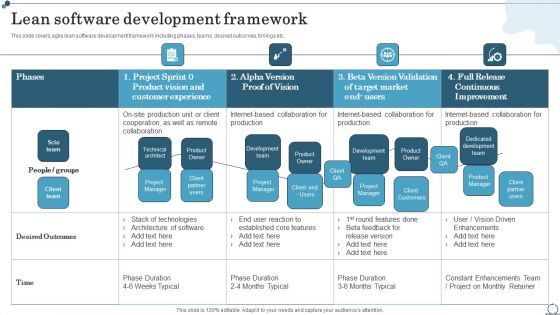
Lean Software Development Framework Agile IT Methodology In Project Management Background PDF
This slide covers agile lean software development framework including phases, teams, desired outcomes, timings etc.The Lean Software Development Framework Agile IT Methodology In Project Management Background PDF is a compilation of the most recent design trends as a series of slides. It is suitable for any subject or industry presentation, containing attractive visuals and photo spots for businesses to clearly express their messages. This template contains a variety of slides for the user to input data, such as structures to contrast two elements, bullet points, and slides for written information. Slidegeeks is prepared to create an impression.
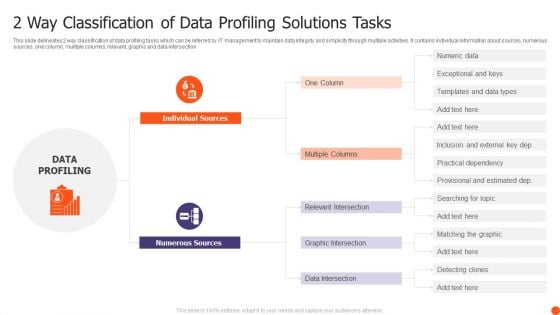
2 Way Classification Of Data Profiling Solutions Tasks Ppt Model Background Designs PDF
This slide delineates 2 way classification of data profiling tasks which can be referred by IT management to maintain data integrity and simplicity through multiple activities. It contains individual information about sources, numerous sources, one column, multiple columns, relevant, graphic and data intersection Presenting 2 Way Classification Of Data Profiling Solutions Tasks Ppt Model Background Designs PDF to dispense important information. This template comprises two stages. It also presents valuable insights into the topics including Individual Sources, Numerous Sources, Multiple Columns. This is a completely customizable PowerPoint theme that can be put to use immediately. So, download it and address the topic impactfully.
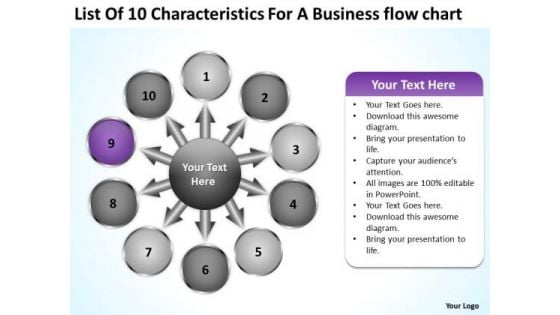
For A Free Business PowerPoint Templates Flow Chart Circular Process Slides
We present our for a free business powerpoint templates flow chart Circular Process Slides.Download our Ring Charts PowerPoint Templates because it is inspired by the indelible Olympic logo this graphic exemplifies the benefits of teamwork. Use our Shapes PowerPoint Templates because this slide demonstrates how they contribute to the larger melting pot. Download and present our Circle Charts PowerPoint Templates because it unravels the process layer by layer and exposes their relevance to the core issue. Download our Business PowerPoint Templates because you are sure you have the right people for your plans. Download our Process and Flows PowerPoint Templates because it unravels the process layer by layer and exposes their relevance to the core issue.Use these PowerPoint slides for presentations relating to Business,chart, circle, colors, concept,contemporary, corporate, cycle, data,design, detail, development, diagram, engineering, graphic, ideas,illustration, implement, implementation,management, model, modern,organization, phase, plan, process,product, professional, project, quality,schema, set, software, stack, stage, steps, strategy, success, system, tag, team. The prominent colors used in the PowerPoint template are Purple, Gray, Black. Customers tell us our for a free business powerpoint templates flow chart Circular Process Slides are Excellent. Customers tell us our data PowerPoint templates and PPT Slides are the best it can get when it comes to presenting. Customers tell us our for a free business powerpoint templates flow chart Circular Process Slides are Fashionable. People tell us our data PowerPoint templates and PPT Slides are Radiant. Customers tell us our for a free business powerpoint templates flow chart Circular Process Slides are Youthful. Customers tell us our colors PowerPoint templates and PPT Slides will save the presenter time. Exceed expectations with our For A Free Business PowerPoint Templates Flow Chart Circular Process Slides. You will come out on top.
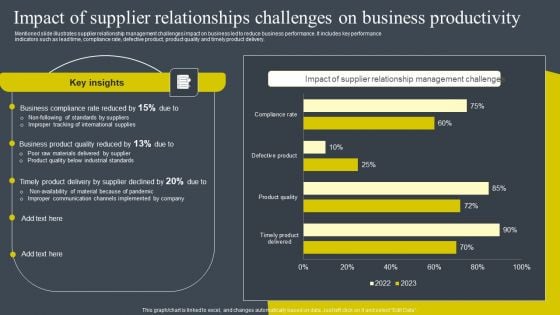
Impact Of Supplier Relationships Challenges On Business Productivity Diagrams PDF
Mentioned slide illustrates supplier relationship management challenges impact on business led to reduce business performance. It includes key performance indicators such as lead time, compliance rate, defective product, product quality and timely product delivery. The Impact Of Supplier Relationships Challenges On Business Productivity Diagrams PDF is a compilation of the most recent design trends as a series of slides. It is suitable for any subject or industry presentation, containing attractive visuals and photo spots for businesses to clearly express their messages. This template contains a variety of slides for the user to input data, such as structures to contrast two elements, bullet points, and slides for written information. Slidegeeks is prepared to create an impression.

Challenges Of AML Risk Management Program Mapping Out The Anti Money Fin SS V
The below slide highlights the major challenges of the AML risk management program that hinder effective management. Various challenges faced are data quality, data integration challenges, risk scoring models, etc. If you are looking for a format to display your unique thoughts, then the professionally designed Challenges Of AML Risk Management Program Mapping Out The Anti Money Fin SS V is the one for you. You can use it as a Google Slides template or a PowerPoint template. Incorporate impressive visuals, symbols, images, and other charts. Modify or reorganize the text boxes as you desire. Experiment with shade schemes and font pairings. Alter, share or cooperate with other people on your work. Download Challenges Of AML Risk Management Program Mapping Out The Anti Money Fin SS V and find out how to give a successful presentation. Present a perfect display to your team and make your presentation unforgettable. The below slide highlights the major challenges of the AML risk management program that hinder effective management. Various challenges faced are data quality, data integration challenges, risk scoring models, etc.
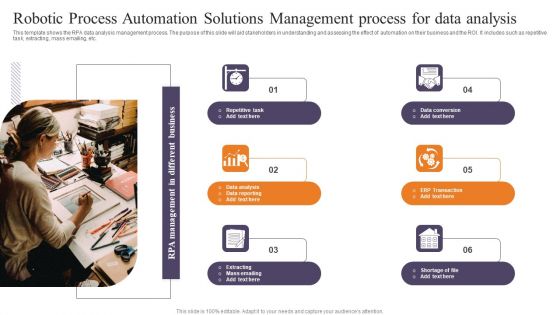
Robotic Process Automation Solutions Management Process For Data Analysis Clipart PDF
This template shows the RPA data analysis management process. The purpose of this slide will aid stakeholders in understanding and assessing the effect of automation on their business and the ROI. It includes such as repetitive task, extracting, mass emailing, etc. Presenting Robotic Process Automation Solutions Management Process For Data Analysis Clipart PDF to dispense important information. This template comprises six stages. It also presents valuable insights into the topics including Robotic Process Automation, Solutions Management, Process For Data Analysis. This is a completely customizable PowerPoint theme that can be put to use immediately. So, download it and address the topic impactfully.
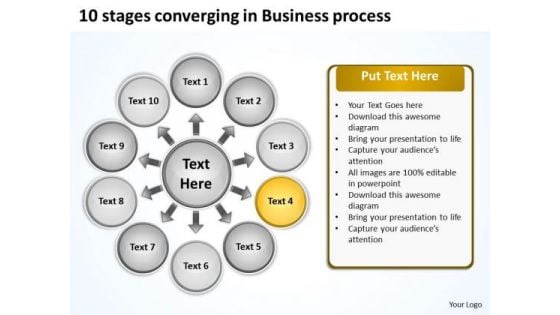
10 Stages Converging Business Process Circular Flow Diagram PowerPoint Slides
We present our 10 stages converging business process Circular Flow Diagram PowerPoint Slides.Download and present our Arrows PowerPoint Templates because they enhance the essence of your viable ideas. Download and present our Flow charts PowerPoint Templates because this slide can help to bullet point your views. Download our Business PowerPoint Templates because it will demonstrate the strength of character under severe stress. Shine the torch ahead and bring the light to shine on all. Present our Process and Flows PowerPoint Templates because you are aware of some pitfalls ahead where you need to be cautious not to overrun and avoid a stall. Download and present our Circle charts PowerPoint Templates because you have what it takes to grow.Use these PowerPoint slides for presentations relating to Business, chart, circle, colors, concept, corporate, cycle, data, design, detail, development, diagram, engineering, graphic, ideas, illustration, image, implement, implementation, life, lifecycle, management, model, objects, organization, plan, process, product, professional, project, quality, schema, shape, stack, stage, steps, strategy, structure, success, symbol. The prominent colors used in the PowerPoint template are Yellow, Black, White. You can be sure our 10 stages converging business process Circular Flow Diagram PowerPoint Slides have awesome images to get your point across. Presenters tell us our data PowerPoint templates and PPT Slides are Beautiful. We assure you our 10 stages converging business process Circular Flow Diagram PowerPoint Slides are Delightful. Customers tell us our corporate PowerPoint templates and PPT Slides will impress their bosses and teams. Presenters tell us our 10 stages converging business process Circular Flow Diagram PowerPoint Slides are Perfect. You can be sure our corporate PowerPoint templates and PPT Slides will impress their bosses and teams. Exhibit your plan with our 10 Stages Converging Business Process Circular Flow Diagram PowerPoint Slides. Display the clarity of your ideas.
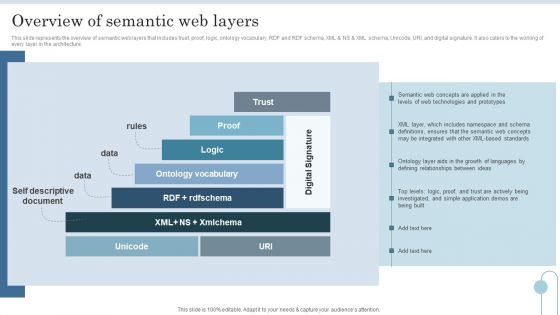
Semantic Data Searching Technique Overview Of Semantic Web Layers Diagrams PDF
This slide represents the overview of semantic web layers that includes trust, proof, logic, ontology vocabulary, RDF and RDF schema, XML and NS and XML schema, Unicode, URI, and digital signature. It also caters to the working of every layer in the architecture. The best PPT templates are a great way to save time, energy, and resources. Slidegeeks have 100 percent editable powerpoint slides making them incredibly versatile. With these quality presentation templates, you can create a captivating and memorable presentation by combining visually appealing slides and effectively communicating your message. Download Semantic Data Searching Technique Overview Of Semantic Web Layers Diagrams PDF from Slidegeeks and deliver a wonderful presentation.
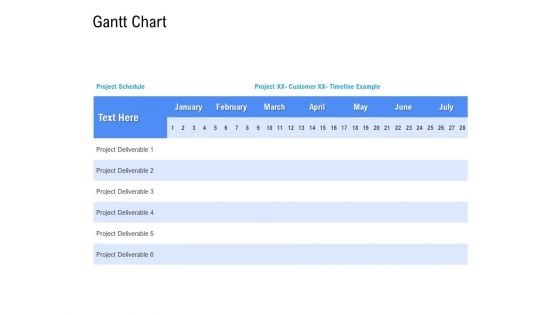
Revenue Cycle Management Deal Gantt Chart Ppt Slides Graphics Download PDF
Your complex projects can be managed and organized simultaneously using this detailed revenue cycle management deal gantt chart ppt slides graphics download pdf template. Track the milestones, tasks, phases, activities, and subtasks to get an updated visual of your project. Share your planning horizon and release plan with this well-crafted presentation template. This exemplary template can be used to plot various dependencies to distinguish the tasks in the pipeline and their impact on the schedules and deadlines of the project. Apart from this, you can also share this visual presentation with your team members and stakeholders. It a resourceful tool that can be incorporated into your business structure. Therefore, download and edit it conveniently to add the data and statistics as per your requirement.

Implementation Timeline Of Product Analytics In Organisation Product Analytics Implementation Data Analytics V
This slide illustrates a weekly timeline of activities undertaken while implementing product analytics in businesses to streamline operations. It covers activities under four heads choose simple use case, implement data governance, democratize product analytics and build expe4rimentataion culture Retrieve professionally designed Implementation Timeline Of Product Analytics In Organisation Product Analytics Implementation Data Analytics V to effectively convey your message and captivate your listeners. Save time by selecting pre-made slideshows that are appropriate for various topics, from business to educational purposes. These themes come in many different styles, from creative to corporate, and all of them are easily adjustable and can be edited quickly. Access them as PowerPoint templates or as Google Slides themes. You do not have to go on a hunt for the perfect presentation because Slidegeeks got you covered from everywhere. This slide illustrates a weekly timeline of activities undertaken while implementing product analytics in businesses to streamline operations. It covers activities under four heads choose simple use case, implement data governance, democratize product analytics and build expe4rimentataion culture
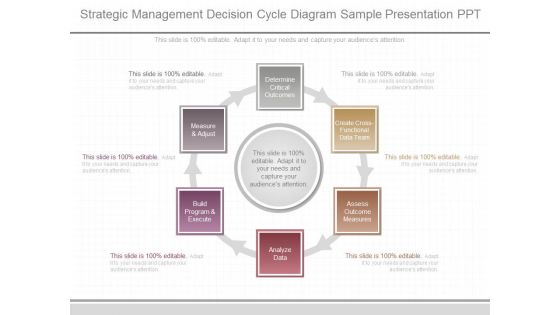
Strategic Management Decision Cycle Diagram Sample Presentation Ppt
This is a strategic management decision cycle diagram sample presentation ppt. This is a six stage process. The stages in this process are measure and adjust, determine critical outcomes, create cross functional data team, assess outcome measures, analyze data, build program and execute.\n\n
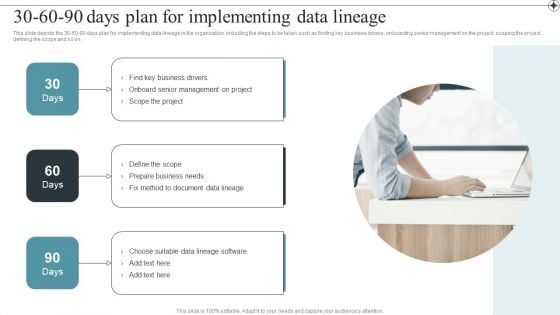
30 60 90 Days Plan For Implementing Data Lineage Themes PDF
This slide depicts the 30 60 90 days plan for implementing data lineage in the organization, including the steps to be taken such as finding key business drivers, onboarding senior management on the project, scoping the project, defining the scope and so on.Presenting this PowerPoint presentation, titled 30 60 90 Days Plan For Implementing Data Lineage Themes PDF, with topics curated by our researchers after extensive research. This editable presentation is available for immediate download and provides attractive features when used. Download now and captivate your audience. Presenting this 30 60 90 Days Plan For Implementing Data Lineage Themes PDF. Our researchers have carefully researched and created these slides with all aspects taken into consideration. This is a completely customizable 30 60 90 Days Plan For Implementing Data Lineage Themes PDF that is available for immediate downloading. Download now and make an impact on your audience. Highlight the attractive features available with our PPTs.
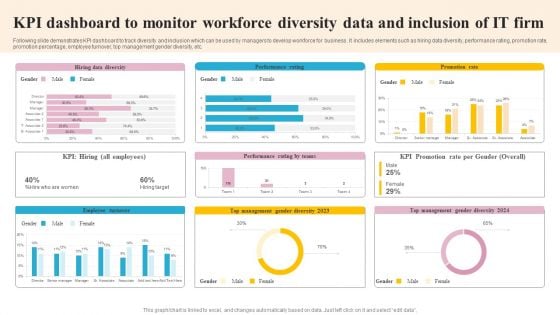
KPI Dashboard To Monitor Workforce Diversity Data And Inclusion Of IT Firm Slides PDF
Following slide demonstrates KPI dashboard to track diversity and inclusion which can be used by managers to develop workforce for business . It includes elements such as hiring data diversity, performance rating, promotion rate, promotion percentage, employee turnover, top management gender diversity, etc. Showcasing this set of slides titled KPI Dashboard To Monitor Workforce Diversity Data And Inclusion Of IT Firm Slides PDF. The topics addressed in these templates are Employee Turnover, Management, Promotion Rate. All the content presented in this PPT design is completely editable. Download it and make adjustments in color, background, font etc. as per your unique business setting.

5 Principles Of Data Management Ethics For Business Professionals Ppt Model Example Topics PDF
This slide shows five principles which should be considered while collecting data to maintain data ethics. These are ownership, transparency, privacy, intention and outcomes. Presenting 5 Principles Of Data Management Ethics For Business Professionals Ppt Model Example Topics PDF to dispense important information. This template comprises five stages. It also presents valuable insights into the topics including Ownership, Transparency, Privacy, Intention, Outcomes. This is a completely customizable PowerPoint theme that can be put to use immediately. So, download it and address the topic impactfully.
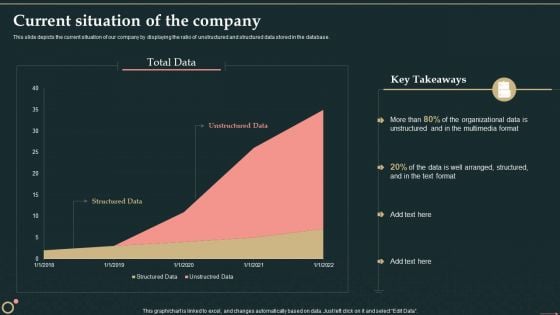
Management Information System Current Situation Of The Company Background PDF
This slide depicts the current situation of our company by displaying the ratio of unstructured and structured data stored in the database.Deliver an awe inspiring pitch with this creative Management Information System Current Situation Of The Company Background PDF bundle. Topics like Unstructured Data, Structured Data, Organizational Data can be discussed with this completely editable template. It is available for immediate download depending on the needs and requirements of the user.
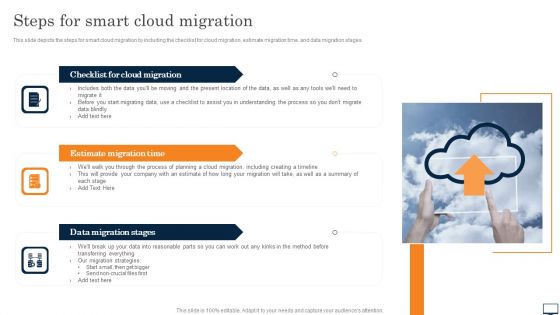
Steps For Smart Cloud Migration Ppt PowerPoint Presentation Diagram Graph Charts PDF
This slide depicts the steps for smart cloud migration by including the checklist for cloud migration, estimate migration time, and data migration stages. From laying roadmaps to briefing everything in detail, our templates are perfect for you. You can set the stage with your presentation slides. All you have to do is download these easy to edit and customizable templates. Steps For Smart Cloud Migration Ppt PowerPoint Presentation Diagram Graph Charts PDF will help you deliver an outstanding performance that everyone would remember and praise you for. Do download this presentation today.
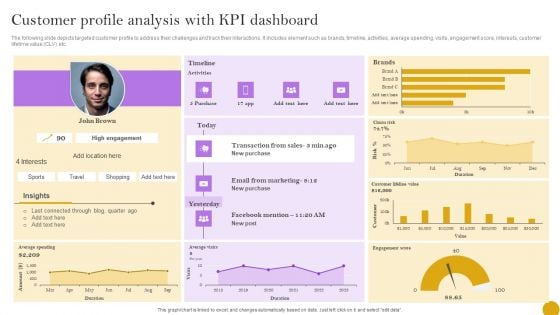
Comprehensive Customer Data Platform Guide Optimizing Promotional Initiatives Customer Profile Analysis KPI Dashboard Pictures PDF
The following slide depicts targeted customer profile to address their challenges and track their interactions. It includes element such as brands, timeline, activities, average spending, visits, engagement score, interests, customer lifetime value CLV etc. The best PPT templates are a great way to save time, energy, and resources. Slidegeeks have 100 percent editable powerpoint slides making them incredibly versatile. With these quality presentation templates, you can create a captivating and memorable presentation by combining visually appealing slides and effectively communicating your message. Download Comprehensive Customer Data Platform Guide Optimizing Promotional Initiatives Customer Profile Analysis KPI Dashboard Pictures PDF from Slidegeeks and deliver a wonderful presentation.
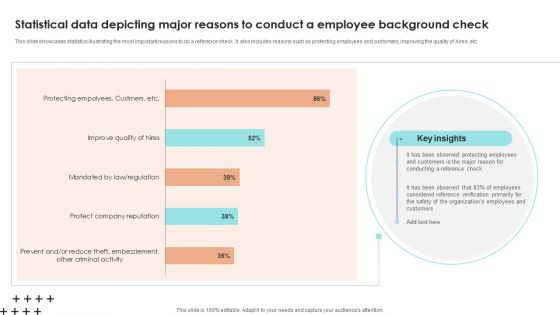
Statistical Data Depicting Major Reasons To Conduct A Employee Background Check Download PDF
This slide showcases statistics illustrating the most important reasons to do a reference check. It also includes reasons such as protecting employees and customers, improving the quality of hires, etc. Pitch your topic with ease and precision using this Statistical Data Depicting Major Reasons To Conduct A Employee Background Check Download PDF. This layout presents information on Key Insights, Reference Check, Customers. It is also available for immediate download and adjustment. So, changes can be made in the color, design, graphics or any other component to create a unique layout.
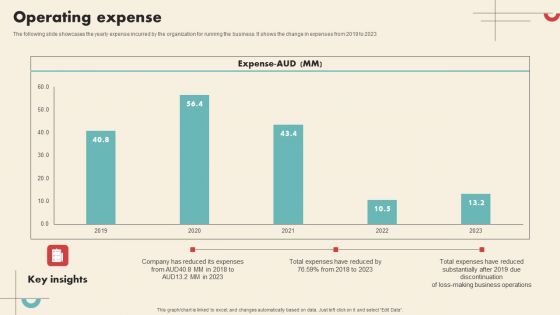
Data Driven Marketing Solutions Firm Company Profile Operating Expense Background PDF
The following slide showcases the yearly expense incurred by the organization for running the business. It shows the change in expenses from 2019 to 2023 The best PPT templates are a great way to save time, energy, and resources. Slidegeeks have 100 percent editable powerpoint slides making them incredibly versatile. With these quality presentation templates, you can create a captivating and memorable presentation by combining visually appealing slides and effectively communicating your message. Download Data Driven Marketing Solutions Firm Company Profile Operating Expense Background PDF from Slidegeeks and deliver a wonderful presentation.
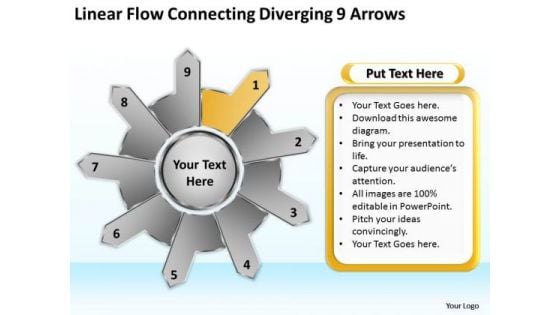
Linear Flow Connecting Diverging 9 Arrows Ppt Gear Process PowerPoint Templates
We present our linear flow connecting diverging 9 arrows ppt Gear Process PowerPoint templates.Download our Flow charts PowerPoint Templates because we provide the means to project your views. Present our Ring Charts PowerPoint Templates because brilliant ideas popping up all over the place. Use our Arrows PowerPoint Templates because it depicts Rolling along while gathering profits along the way is the aim. Download and present our Success PowerPoint Templates because your quest has taken you well onto the path of success. Download and present our Business PowerPoint Templates because watch the excitement levels rise as they realise their worth.Use these PowerPoint slides for presentations relating to Abstract, arrow, brochure, business,button, chart, circle, company, cyclic,data, demonstration, diagram,economic, financial, glossy, goal, graph,illustration, info, information, investment,manage, marketing, model, navigation,option, part, pie, presentation, process. The prominent colors used in the PowerPoint template are Yellow, Black, White. People tell us our linear flow connecting diverging 9 arrows ppt Gear Process PowerPoint templates are Cheerful. Customers tell us our cyclic PowerPoint templates and PPT Slides are Efficient. Professionals tell us our linear flow connecting diverging 9 arrows ppt Gear Process PowerPoint templates are Precious. Presenters tell us our chart PowerPoint templates and PPT Slides will make the presenter successul in his career/life. Use our linear flow connecting diverging 9 arrows ppt Gear Process PowerPoint templates provide you with a vast range of viable options. Select the appropriate ones and just fill in your text. Presenters tell us our company PowerPoint templates and PPT Slides are Functional. See your audience react before your very eyes. Our Linear Flow Connecting Diverging 9 Arrows Ppt Gear Process PowerPoint Templates extract positive delight.
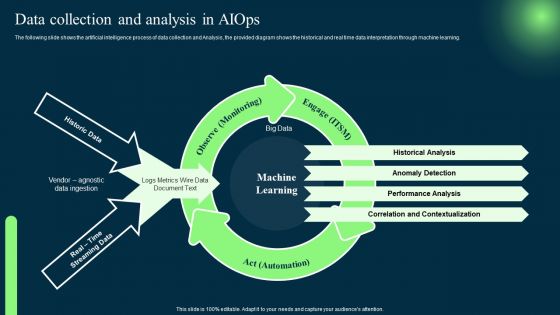
Introduction To Artificial Intelligence In Operation Management Industry Data Collection And Analysis In AIOPS Summary PDF
The following slide shows the artificial intelligence process of data collection and Analysis, the provided diagram shows the historical and real time data interpretation through machine learning. Do you have an important presentation coming up. Are you looking for something that will make your presentation stand out from the rest. Look no further than Introduction To Artificial Intelligence In Operation Management Industry Data Collection And Analysis In AIOPS Summary PDF. With our professional designs, you can trust that your presentation will pop and make delivering it a smooth process. And with Slidegeeks, you can trust that your presentation will be unique and memorable. So why wait. Grab Introduction To Artificial Intelligence In Operation Management Industry Data Collection And Analysis In AIOPS Summary PDF today and make your presentation stand out from the rest.

4 Stages Diverging Arrows Activity Diagram Cycle Chart PowerPoint Template
We present our 4 stages diverging arrows activity diagram Cycle Chart PowerPoint template.Download and present our Flow Charts PowerPoint Templates because you have the ideas, you have got a brainwave. Download our Business PowerPoint Templates because you have analysed many global markets and come up with possibilities. Highlight the pros and cons of other likely business oppurtunities. Use our Process and Flows PowerPoint Templates because health of the determines the quality of our lives. Download our Success PowerPoint Templates because the choices you make today will determine the future growth of your enterprise. Download our Arrows PowerPoint Templates because your business and plans for its growth consist of processes that are highly co-related.Use these PowerPoint slides for presentations relating to Business, Chart, Circle, Cyclic, Data, Diagram, Financial, Goal, Graph, Illustration, Info, Information, Marketing, Model, Option, Part, Pie, Presentation, Process, Result, Sphere, Statistics. The prominent colors used in the PowerPoint template are Yellow, Gray, White. People tell us our 4 stages diverging arrows activity diagram Cycle Chart PowerPoint template are Zippy. Customers tell us our Cyclic PowerPoint templates and PPT Slides are Beautiful. People tell us our 4 stages diverging arrows activity diagram Cycle Chart PowerPoint template are Whimsical. Professionals tell us our Cyclic PowerPoint templates and PPT Slides are Romantic. Customers tell us our 4 stages diverging arrows activity diagram Cycle Chart PowerPoint template help you meet deadlines which are an element of today's workplace. Just browse and pick the slides that appeal to your intuitive senses. Use our Financial PowerPoint templates and PPT Slides are Precious. Encourage teams with our 4 Stages Diverging Arrows Activity Diagram Cycle Chart PowerPoint Template. Download without worries with our money back guaranteee.
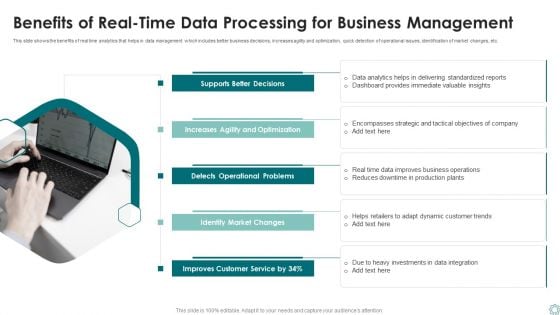
Benefits Of Real Time Data Processing For Business Management Ppt Layouts Show PDF
This slide shows the benefits of real time analytics that helps in data management which includes better business decisions, increases agility and optimization, quick detection of operational issues, identification of market changes, etc. Presenting Benefits Of Real Time Data Processing For Business Management Ppt Layouts Show PDF to dispense important information. This template comprises five stages. It also presents valuable insights into the topics including Supports Better Decisions, Detects Operational Problems, Identify Market Changes. This is a completely customizable PowerPoint theme that can be put to use immediately. So, download it and address the topic impactfully.
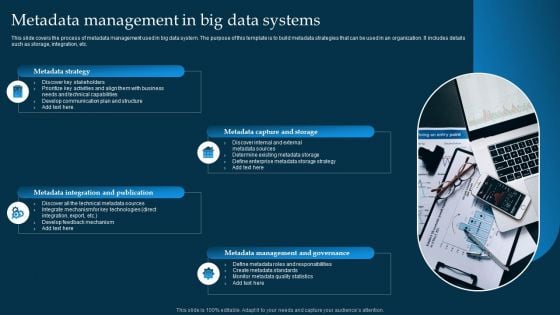
Metadata Management In Big Data Systems Ppt PowerPoint Presentation Gallery Show PDF
This slide covers the process of metadata management used in big data system. The purpose of this template is to build metadata strategies that can be used in an organization. It includes details such as storage, integration, etc. Presenting Metadata Management In Big Data Systems Ppt PowerPoint Presentation Gallery Show PDF to dispense important information. This template comprises four stages. It also presents valuable insights into the topics including Metadata Strategy, Integration And Publication, Discover Key Stakeholders. This is a completely customizable PowerPoint theme that can be put to use immediately. So, download it and address the topic impactfully.

Reasons Towards Failure Of Data Analytics Project Business Analysis Modification Toolkit Topics PDF
This slide shows the graph highlighting key reasons for the failure of data management project.Deliver an awe inspiring pitch with this creative Reasons Towards Failure Of Data Analytics Project Business Analysis Modification Toolkit Topics PDF bundle. Topics like Incorrect Project, Inadequate Management, Cultural Resistance can be discussed with this completely editable template. It is available for immediate download depending on the needs and requirements of the user.
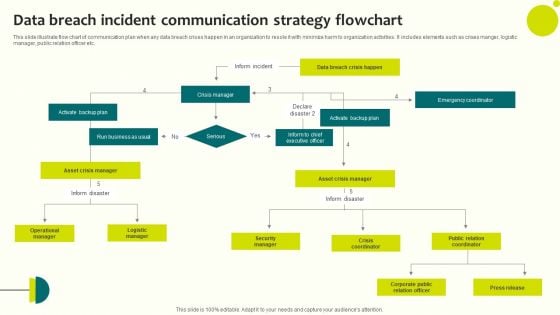
Data Breach Incident Communication Strategy Flowchart Clipart PDF
This slide illustrate flow chart of communication plan when any data breach crises happen in an organization to resole it with minimize harm to organization activities. It includes elements such as crises manger, logistic manager, public relation officer etc. Showcasing this set of slides titled Data Breach Incident Communication Strategy Flowchart Clipart PDF. The topics addressed in these templates are Crisis Manager, Flowchart, Operational Manager. All the content presented in this PPT design is completely editable. Download it and make adjustments in color, background, font etc. as per your unique business setting.
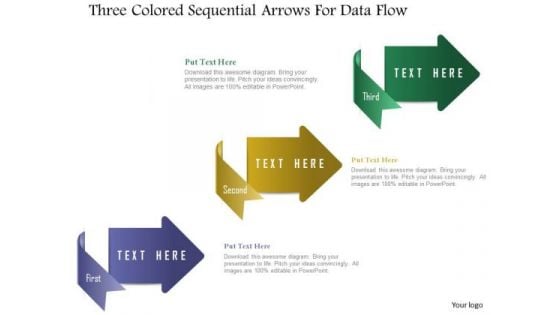
Business Diagram Three Colored Sequential Arrows For Data Flow Presentation Template
Three colored sequential arrows graphic has been used to design this power point template slide. This PPT slide contains the concept of data flow representation. Use this PPT slide for your business and management related presentations.
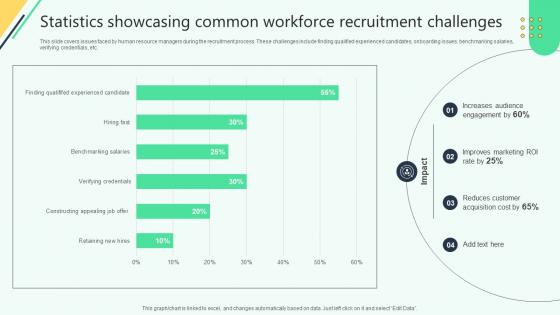
Statistics Showcasing Common Workforce Recruitment Analysing Hr Data For Effective Decision Making
This slide covers issues faced by human resource managers during the recruitment process. These challenges include finding qualified experienced candidates, onboarding issues, benchmarking salaries,verifying credentials, etc. Do you have to make sure that everyone on your team knows about any specific topic I yes, then you should give Statistics Showcasing Common Workforce Recruitment Analysing Hr Data For Effective Decision Making a try. Our experts have put a lot of knowledge and effort into creating this impeccable Statistics Showcasing Common Workforce Recruitment Analysing Hr Data For Effective Decision Making. You can use this template for your upcoming presentations, as the slides are perfect to represent even the tiniest detail. You can download these templates from the Slidegeeks website and these are easy to edit. So grab these today This slide covers issues faced by human resource managers during the recruitment process. These challenges include finding qualified experienced candidates, onboarding issues, benchmarking salaries,verifying credentials, etc.
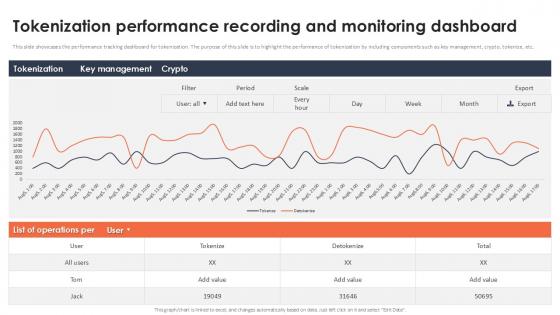
Tokenization Performance Recording And Monitoring Dashboard Securing Your Data Ppt Slide
This slide showcases the performance tracking dashboard for tokenization. The purpose of this slide is to highlight the performance of tokenization by including components such as key management, crypto, tokenize, etc. Do you have an important presentation coming up Are you looking for something that will make your presentation stand out from the rest Look no further than Tokenization Performance Recording And Monitoring Dashboard Securing Your Data Ppt Slide With our professional designs, you can trust that your presentation will pop and make delivering it a smooth process. And with Slidegeeks, you can trust that your presentation will be unique and memorable. So why wait Grab Tokenization Performance Recording And Monitoring Dashboard Securing Your Data Ppt Slide today and make your presentation stand out from the rest This slide showcases the performance tracking dashboard for tokenization. The purpose of this slide is to highlight the performance of tokenization by including components such as key management, crypto, tokenize, etc.
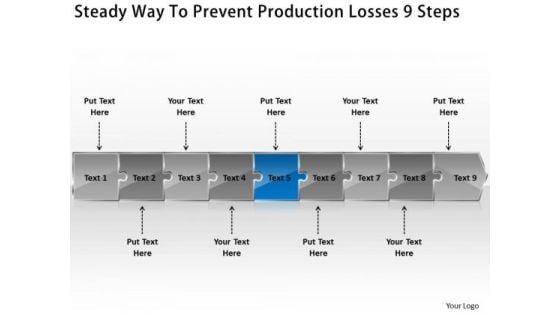
Steady Way To Prevent Production Losses 9 Steps What Is Flow Chart Used For PowerPoint Slides
We present our steady way to prevent production losses 9 steps what is flow chart used for PowerPoint Slides.Use our Arrows PowerPoint Templates because,you have the ability to judge Which out of late have been proving to be a hassle. Use our Leadership PowerPoint Templates because,This diagram can be used to illustrate the logical path or system Use our Business PowerPoint Templates because, A brainwave has occurred to you after review. You know just how to push the graph skyward Use our Symbol PowerPoint Templates because,This one depicts the popular chart. Use our Process and Flows PowerPoint Templates because,Your business and plans for its growth consist of processes that are highly co-related.Use these PowerPoint slides for presentations relating to Abstract, Action, Attach, Box, Business, Center, Chain, Chart, Color, Communication, Concept, Connection, Cube, Cycle, Data, Diagram, Flow, Globe, Horizontal, Idea, Illustration, Information, Interaction, Jigsaw, Join, Link, Pieces, Process, Puzzle, Relation, Relationship, Shape, Success. The prominent colors used in the PowerPoint template are Blue, Black, Gray. People tell us our steady way to prevent production losses 9 steps what is flow chart used for PowerPoint Slides are Royal. PowerPoint presentation experts tell us our Chart PowerPoint templates and PPT Slides are Great. PowerPoint presentation experts tell us our steady way to prevent production losses 9 steps what is flow chart used for PowerPoint Slides are Graceful. Professionals tell us our Center PowerPoint templates and PPT Slides are Amazing. Professionals tell us our steady way to prevent production losses 9 steps what is flow chart used for PowerPoint Slides are readymade to fit into any presentation structure. People tell us our Business PowerPoint templates and PPT Slides are Glamorous. Address problems with our Steady Way To Prevent Production Losses 9 Steps What Is Flow Chart Used For PowerPoint Slides. Download without worries with our money back guaranteee.
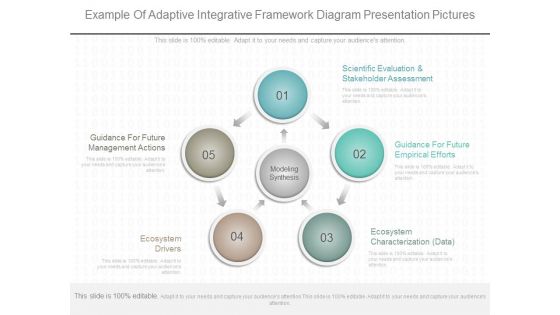
Example Of Adaptive Integrative Framework Diagram Presentation Pictures
This is a example of adaptive integrative framework diagram presentation pictures. This is a five stage process. The stages in this process are modeling synthesis, scientific evaluation and stakeholder assessment, guidance for future empirical efforts, ecosystem characterization data, ecosystem drivers, guidance for future management actions.
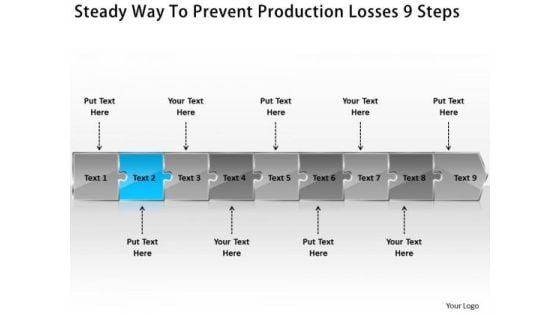
Steady Way To Prevent Production Losses 9 Steps Flow Chart Maker Online PowerPoint Templates
We present our steady way to prevent production losses 9 steps flow chart maker online PowerPoint templates.Use our Arrows PowerPoint Templates because, You have churned your mind and come up with effective ways and means to further refine it. Use our Leadership PowerPoint Templates because, Brilliant ideas are your forte. Use our Business PowerPoint Templates because,This layout helps you to bring some important aspects of your business process to the notice of all concerned. Streamline the flow of information across the board Use our Symbol PowerPoint Templates because, This diagram helps you to discuss each step slowly but surely move up the pyramid narrowing down to the best and most success oriented project. Use our Process and Flows PowerPoint Templates because, You can Transmit this concern to your staff using our helpful slides.Use these PowerPoint slides for presentations relating to Abstract, Action, Attach, Box, Business, Center, Chain, Chart, Color, Communication, Concept, Connection, Cube, Cycle, Data, Diagram, Flow, Globe, Horizontal, Idea, Illustration, Information, Interaction, Jigsaw, Join, Link, Pieces, Process, Puzzle, Relation, Relationship, Shape, Success. The prominent colors used in the PowerPoint template are Blue , Black, Gray. People tell us our steady way to prevent production losses 9 steps flow chart maker online PowerPoint templates are Exuberant. PowerPoint presentation experts tell us our Center PowerPoint templates and PPT Slides are Swanky. PowerPoint presentation experts tell us our steady way to prevent production losses 9 steps flow chart maker online PowerPoint templates are Detailed. Professionals tell us our Chain PowerPoint templates and PPT Slides are Appealing. Professionals tell us our steady way to prevent production losses 9 steps flow chart maker online PowerPoint templates are Endearing. People tell us our Chart PowerPoint templates and PPT Slides are Magnificent. Our Steady Way To Prevent Production Losses 9 Steps Flow Chart Maker Online PowerPoint Templates encourage a creative environment. Allow diverse ideas to gain acceptance.
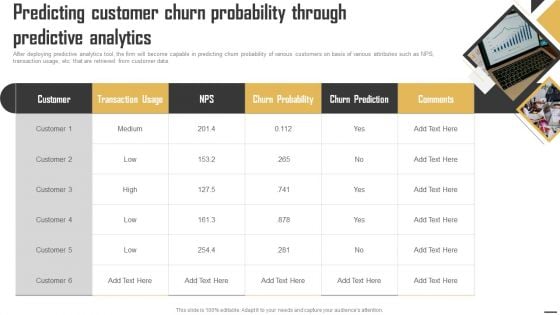
Data Monetization And Management Predicting Customer Churn Probability Through Formats PDF
After deploying predictive analytics tool, the firm will become capable in predicting churn probability of various customers on basis of various attributes such as NPS, transaction usage, etc. that are retrieved from customer data. Are you searching for a Data Monetization And Management Predicting Customer Churn Probability Through Formats PDF that is uncluttered, straightforward, and original Its easy to edit, and you can change the colors to suit your personal or business branding. For a presentation that expresses how much effort youve put in, this template is ideal With all of its features, including tables, diagrams, statistics, and lists, its perfect for a business plan presentation. Make your ideas more appealing with these professional slides. Download Data Monetization And Management Predicting Customer Churn Probability Through Formats PDF from Slidegeeks today.
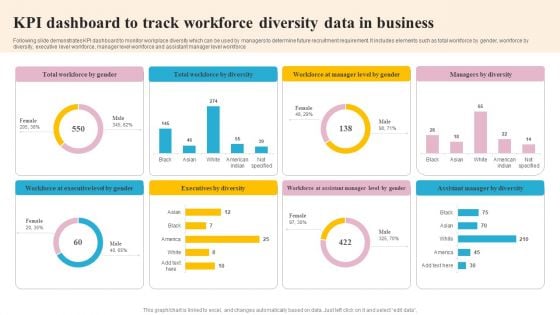
KPI Dashboard To Track Workforce Diversity Data In Business Mockup PDF
Following slide demonstrates KPI dashboard to monitor workplace diversity which can be used by managers to determine future recruitment requirement. It includes elements such as total workforce by gender, workforce by diversity, executive level workforce, manager level workforce and assistant manager level workforce. Pitch your topic with ease and precision using this KPI Dashboard To Track Workforce Diversity Data In Business Mockup PDF. This layout presents information on Executives By Diversity, Workforce By Diversity, Executive Level By Gender. It is also available for immediate download and adjustment. So, changes can be made in the color, design, graphics or any other component to create a unique layout.
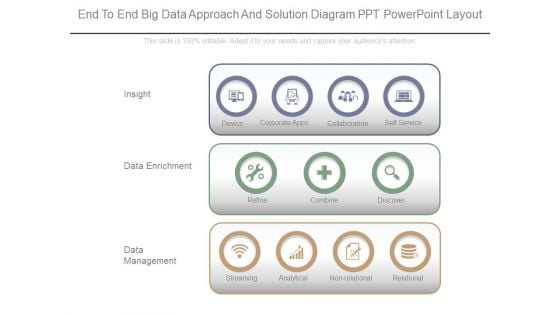
End To End Big Data Approach And Solution Diagram Ppt Powerpoint Layout
This is a end to end big data approach and solution diagram ppt powerpoint layout. This is a three stage process. The stages in this process are insight, data enrichment, data management, device, corporate apps, collaboration, self service, refine, combine, discover, relational, non relational, analytical, streaming.
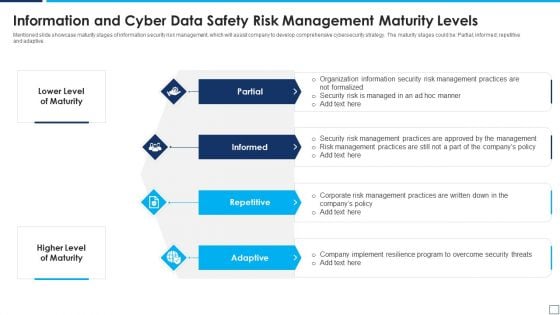
Information And Cyber Data Safety Risk Management Maturity Levels Elements PDF
Mentioned slide showcase maturity stages of information security risk management, which will assist company to develop comprehensive cybersecurity strategy. The maturity stages could be Partial informed repetitive and adaptive. Presenting information and cyber data safety risk management maturity levels elements pdf to dispense important information. This template comprises four stages. It also presents valuable insights into the topics including partial, informed, repetitive, adaptive. This is a completely customizable PowerPoint theme that can be put to use immediately. So, download it and address the topic impactfully.
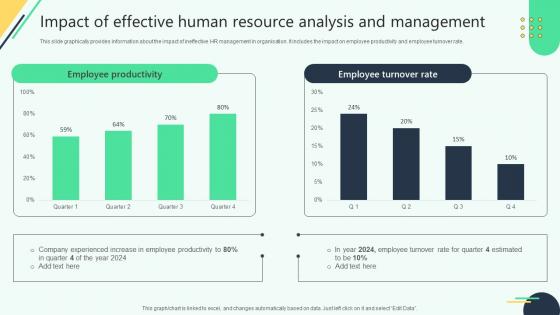
Impact Of Effective Human Resource Analysis And Analysing Hr Data For Effective Decision Making
This slide graphically provides information about the impact of ineffective HR management in organisation. It includes the impact on employee productivity and employee turnover rate. Slidegeeks has constructed Impact Of Effective Human Resource Analysis And Analysing Hr Data For Effective Decision Making after conducting extensive research and examination. These presentation templates are constantly being generated and modified based on user preferences and critiques from editors. Here, you will find the most attractive templates for a range of purposes while taking into account ratings and remarks from users regarding the content. This is an excellent jumping-off point to explore our content and will give new users an insight into our top-notch PowerPoint Templates. This slide graphically provides information about the impact of ineffective HR management in organisation. It includes the impact on employee productivity and employee turnover rate.
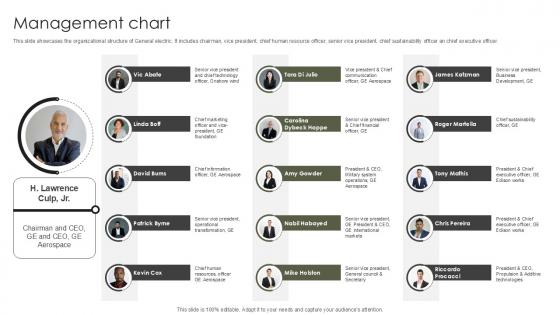
Management Chart Military Aircraft Engine Manufacturing PPT Presentation CP SS V
This slide showcases the organizational structure of General electric. It includes chairman, vice president, chief human resource officer, senior vice president, chief sustainability officer an chief executive officer. The Management Chart Military Aircraft Engine Manufacturing PPT Presentation CP SS V is a compilation of the most recent design trends as a series of slides. It is suitable for any subject or industry presentation, containing attractive visuals and photo spots for businesses to clearly express their messages. This template contains a variety of slides for the user to input data, such as structures to contrast two elements, bullet points, and slides for written information. Slidegeeks is prepared to create an impression. This slide showcases the organizational structure of General electric. It includes chairman, vice president, chief human resource officer, senior vice president, chief sustainability officer an chief executive officer.
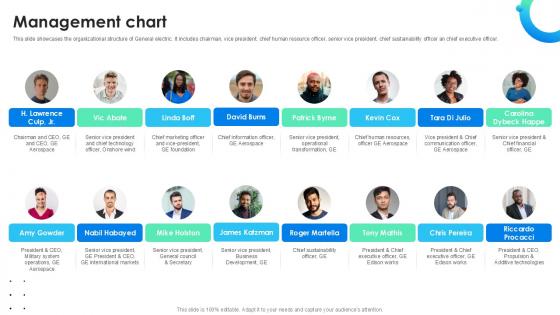
Management Chart Global Energy Company Profile PPT Sample CP SS V
This slide showcases the organizational structure of General electric. It includes chairman, vice president, chief human resource officer, senior vice president, chief sustainability officer an chief executive officer. The Management Chart Global Energy Company Profile PPT Sample CP SS V is a compilation of the most recent design trends as a series of slides. It is suitable for any subject or industry presentation, containing attractive visuals and photo spots for businesses to clearly express their messages. This template contains a variety of slides for the user to input data, such as structures to contrast two elements, bullet points, and slides for written information. Slidegeeks is prepared to create an impression. This slide showcases the organizational structure of General electric. It includes chairman, vice president, chief human resource officer, senior vice president, chief sustainability officer an chief executive officer.
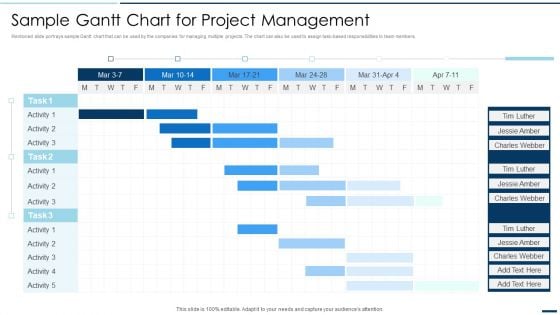
QA Plan Set 2 Sample Gantt Chart For Project Management Ppt PowerPoint Presentation File Mockup PDF
Mentioned slide portrays sample Gantt chart that can be used by the companies for managing multiple projects. The chart can also be used to assign task-based responsibilities to team members. Your complex projects can be managed and organized simultaneously using this detailed QA Plan Set 2 Sample Gantt Chart For Project Management Ppt PowerPoint Presentation File Mockup PDF template. Track the milestones, tasks, phases, activities, and subtasks to get an updated visual of your project. Share your planning horizon and release plan with this well crafted presentation template. This exemplary template can be used to plot various dependencies to distinguish the tasks in the pipeline and their impact on the schedules and deadlines of the project. Apart from this, you can also share this visual presentation with your team members and stakeholders. It a resourceful tool that can be incorporated into your business structure. Therefore, download and edit it conveniently to add the data and statistics as per your requirement.


 Continue with Email

 Home
Home


