Construction Icons

Business Diagram World Map With Multiple Pointers For Business Location Presentation Template
This diagram has been designed with 3d graphic of world map. Multiple location symbols have been used to give it a more effective look. It helps in clearly conveying your message to clients and audience.
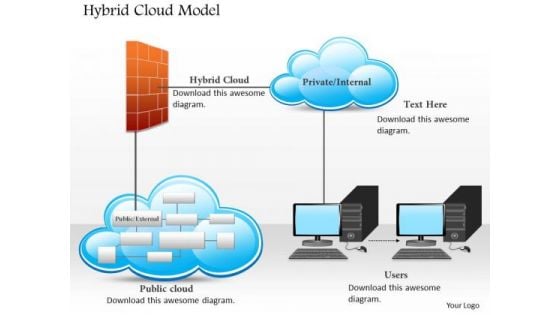
Business Diagram Hybrid Cloud Model With Public Private Cloud And Users Connected Ppt Slide
This technology diagram slide has been designed with graphic of hybrid cloud model. This slide depicts the concept of cloud computing for user benefit. Display private and public user benefits of cloud computing.
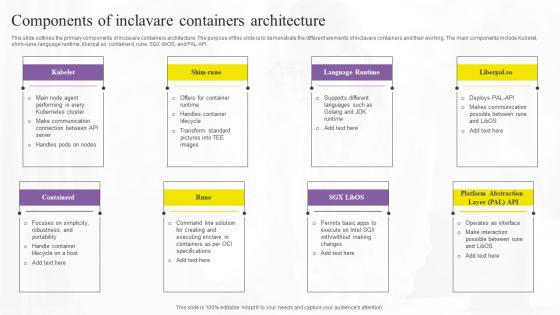
Components Of Inclavare Containers Confidential Computing Technologies Diagrams Pdf
This slide outlines the primary components of inclavare containers architecture. The purpose of this slide is to demonstrate the different elements of inclavare containers and their working. The main components include Kubelet, shim-rune, language runtime, liberpal.so, containerd, rune, SGX libOS, and PAL-API. Slidegeeks is here to make your presentations a breeze with Components Of Inclavare Containers Confidential Computing Technologies Diagrams Pdf With our easy-to-use and customizable templates, you can focus on delivering your ideas rather than worrying about formatting. With a variety of designs to choose from, you are sure to find one that suits your needs. And with animations and unique photos, illustrations, and fonts, you can make your presentation pop. So whether you are giving a sales pitch or presenting to the board, make sure to check out Slidegeeks first This slide outlines the primary components of inclavare containers architecture. The purpose of this slide is to demonstrate the different elements of inclavare containers and their working. The main components include Kubelet, shim-rune, language runtime, liberpal.so, containerd, rune, SGX libOS, and PAL-API.

Three Steps Venn Diagram For Risk Mitigation Ppt PowerPoint Presentation Layouts Graphics Pictures PDF
Persuade your audience using this three steps venn diagram for risk mitigation ppt powerpoint presentation layouts graphics pictures pdf. This PPT design covers three stages, thus making it a great tool to use. It also caters to a variety of topics including three steps venn diagram for risk mitigation. Download this PPT design now to present a convincing pitch that not only emphasizes the topic but also showcases your presentation skills.
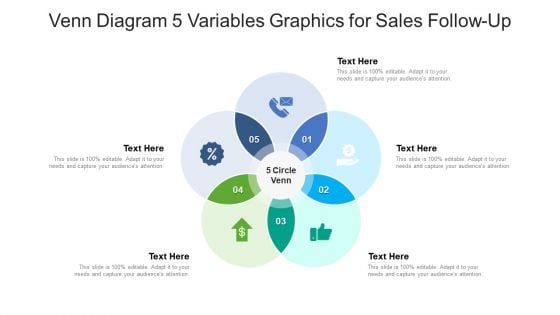
Venn Diagram 5 Variables Graphics For Sales Follow Up Ppt PowerPoint Presentation Gallery Example File PDF
Persuade your audience using this venn diagram 5 variables graphics for sales follow up ppt powerpoint presentation gallery example file pdf. This PPT design covers five stages, thus making it a great tool to use. It also caters to a variety of topics including venn diagram 5 variables graphics for sales follow up. Download this PPT design now to present a convincing pitch that not only emphasizes the topic but also showcases your presentation skills.
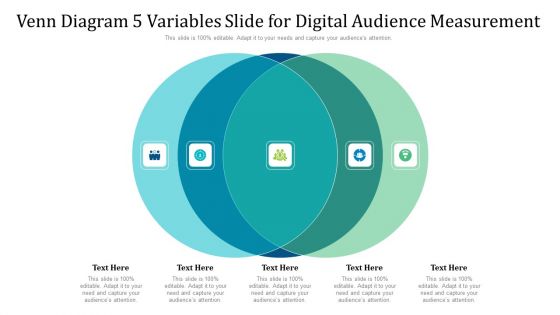
Venn Diagram 5 Variables Slide For Digital Audience Measurement Ppt PowerPoint Presentation Gallery File Formats PDF
Persuade your audience using this venn diagram 5 variables slide for digital audience measurement ppt powerpoint presentation gallery file formats pdf. This PPT design covers five stages, thus making it a great tool to use. It also caters to a variety of topics including venn diagram 5 variables slide for digital audience measurement. Download this PPT design now to present a convincing pitch that not only emphasizes the topic but also showcases your presentation skills.
Agenda For Talent Management Optimization With Workforce Staffing Inspiration PDF Themes PDF Diagrams PDF
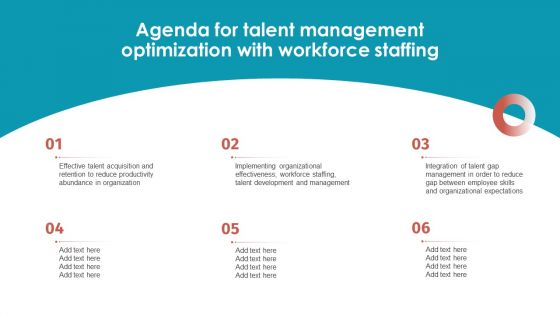
Find a pre designed and impeccable Agenda For Talent Management Optimization With Workforce Staffing Inspiration PDF Themes PDF Diagrams PDF. The templates can ace your presentation without additional effort. You can download these easy to edit presentation templates to make your presentation stand out from others. So, what are you waiting for Download the template from Slidegeeks today and give a unique touch to your presentation.
PowerPoint Layouts Cycle Process Company Ppt Slide Designs
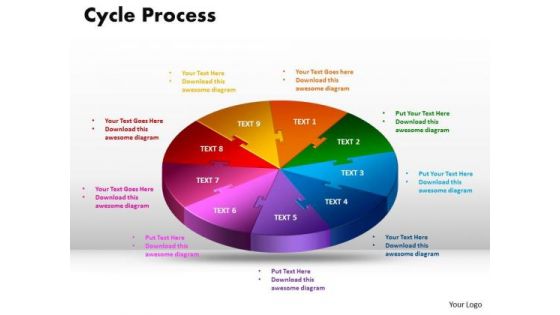
PowerPoint Layouts Cycle Process Company PPT Slide Designs-Cycle Diagrams are a type of graphics that shows how items are related to one another in a repeating cycle. In this cycle diagram, you can explain the main events in the cycle, how they interact, and how the cycle repeats.-PowerPoint Layouts Cycle Process Company PPT Slide Designs Feature your views with our PowerPoint Layouts Cycle Process Company Ppt Slide Designs. They will get the desired exposure.
PowerPoint Slides Cycle Puzzle Process Strategy Ppt Slide Designs
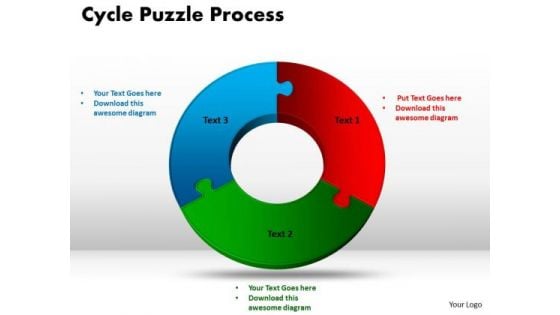
PowerPoint Slides Cycle Puzzle Process Strategy PPT Slide Designs-Cycle Diagrams are a type of graphics that shows how items are related to one another in a repeating cycle. In a cycle diagram, you can explain the main events in the cycle, how they interact, and how the cycle repeats-PowerPoint Slides Cycle Puzzle Process Strategy PPT Slide Designs Our PowerPoint Slides Cycle Puzzle Process Strategy Ppt Slide Designs team exert themselves. They put in all the effort for you.
Pricing Packages For Freehold Land Ariel Photography Proposal Diagrams PDF
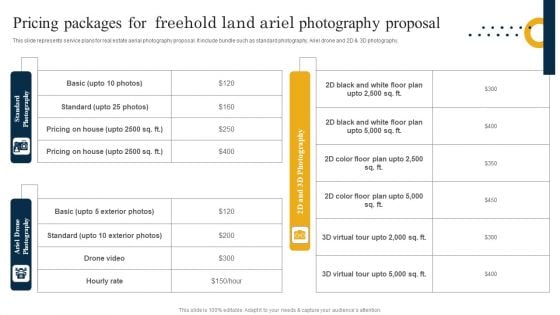
This slide represents service plans for real estate aerial photography proposal. It include bundle such as standard photography, Ariel drone and 2D and 3D photography. Take your presentations to the next level with our Pricing Packages For Freehold Land Ariel Photography Proposal Diagrams PDF template. With its sleek design and seamless editing features, this single slide PPT template is a game changer for professionals who want to make an impact. Impress your audience with stunning visuals and engaging content that will capture their attention from start to finish. Get your hands on our template and elevate your presentations to new heights.
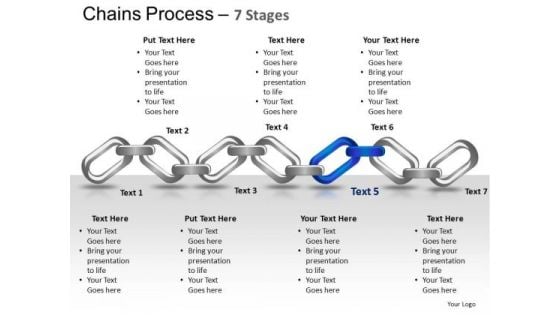
PowerPoint Process Chart Chains Ppt Process
PowerPoint Process Chart Chains PPT Process-These Fabulous PowerPoint slides and PowerPoint templates have been delicately designed by our professional team to leave long-lasting impressions on your audiences Give your audience a feel of your ability. Dole out a dose on our PowerPoint Process Chart Chains Ppt Process.
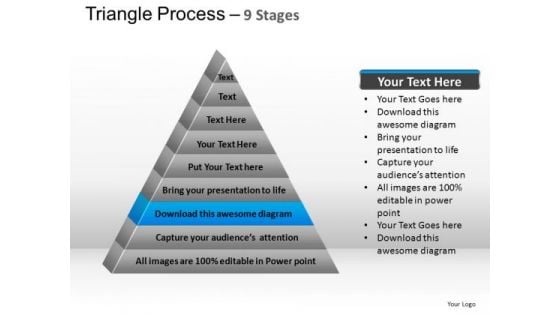
PowerPoint Process Chart Triangle Process Ppt Slide
PowerPoint Process Chart triangle process PPT Slide-These Fabulous PowerPoint slides and PowerPoint templates have been delicately designed by our professional team to leave long-lasting impressions on your audiences Give your thoughts an exclusive feel. Our PowerPoint Process Chart Triangle Process Ppt Slide will give them a distinctive touch.
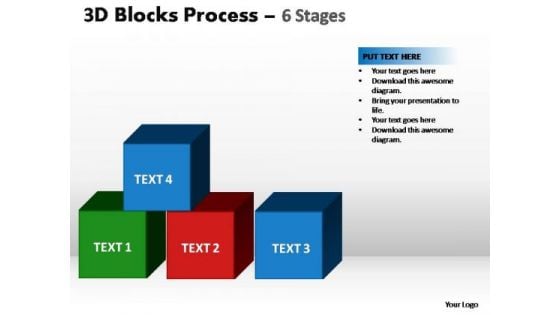
PowerPoint Slidelayout Chart Blocks Process Ppt Slide
PowerPoint Slidelayout Chart blocks process PPT Slide-These Fabulous PowerPoint slides and PowerPoint templates have been delicately designed by our professional team to leave long-lasting impressions on your audiences There is no destination too far for our PowerPoint Slidelayout Chart Blocks Process Ppt Slide. They willget you there within a jiffy.
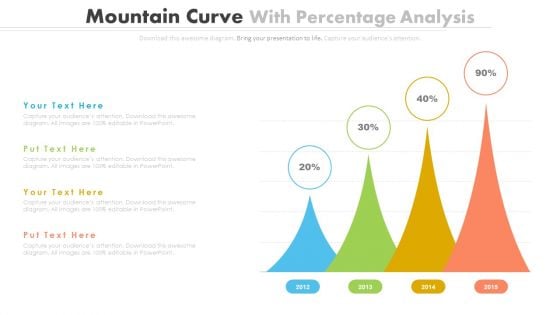
Percentage Data Growth Chart Powerpoint Slides
This PowerPoint template has been designed with percentage data growth chart. Download this PPT chart to depict financial ratio analysis. This PowerPoint slide is of great help in the business sector to make realistic presentations and provides effective way of presenting your newer thoughts.
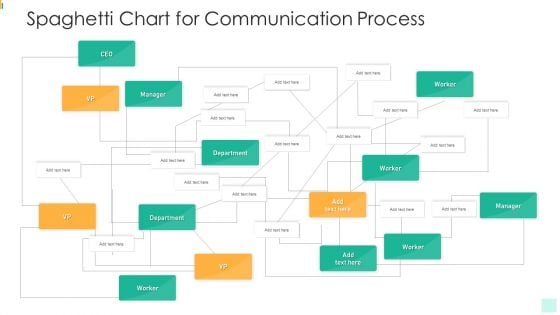
Spaghetti Chart For Communication Process Infographics PDF
Showcasing this set of slides titled spaghetti chart for communication process infographics pdf. The topics addressed in these templates are spaghetti chart for communication process. All the content presented in this PPT design is completely editable. Download it and make adjustments in color, background, font etc. as per your unique business setting.
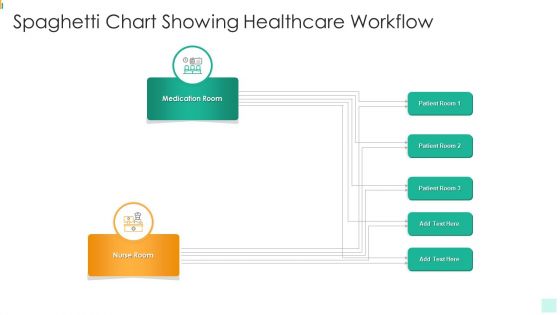
Spaghetti Chart Showing Healthcare Workflow Professional PDF
Pitch your topic with ease and precision using this spaghetti chart showing healthcare workflow professional pdf. This layout presents information on spaghetti chart showing healthcare workflow. It is also available for immediate download and adjustment. So, changes can be made in the color, design, graphics or any other component to create a unique layout.
Business Diagram Post It Notes Style 1 Mba Models And Frameworks
Use our Business Diagram post it notes style 1 MBA Models And Frameworks Powerpoint Templates to weave a web of your great ideas. They are guaranteed to attract even the most critical of your colleagues. Our Business Diagram post it notes style 1 MBA Models And Frameworks Powerpoint Templates are designed to help you succeed. They have all the ingredients you need.
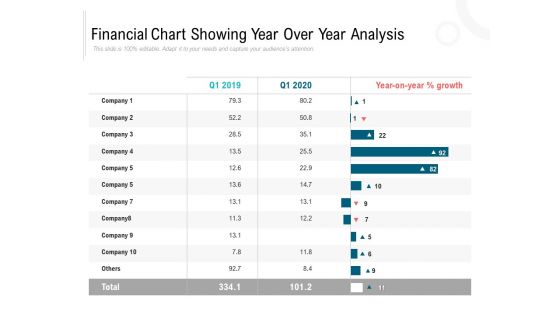
Financial Chart Showing Year Over Year Analysis Ppt PowerPoint Presentation Styles Design Ideas
Presenting this set of slides with name financial chart showing year over year analysis ppt powerpoint presentation styles design ideas. The topics discussed in these slide is financial chart showing year over year analysis. This is a completely editable PowerPoint presentation and is available for immediate download. Download now and impress your audience.
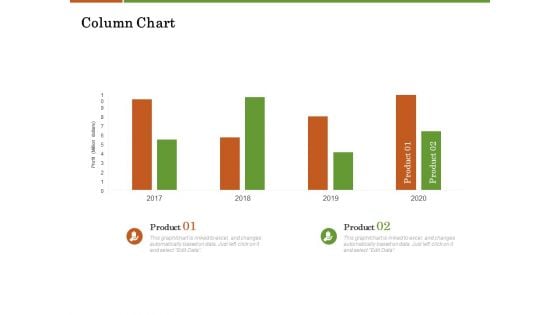
Accounting Advisory Services For Organization Column Chart Ppt PowerPoint Presentation Inspiration Designs Download PDF
Presenting this set of slides with name accounting advisory services for organization column chart ppt powerpoint presentation inspiration designs download pdf. The topics discussed in these slides are column chart. This is a completely editable PowerPoint presentation and is available for immediate download. Download now and impress your audience.

Designing Compensation Systems For Professionals Bubble Chart Ppt Infographics Files PDF
Presenting this set of slides with name designing compensation systems for professionals bubble chart ppt infographics files pdf. The topics discussed in these slide is bubble chart. This is a completely editable PowerPoint presentation and is available for immediate download. Download now and impress your audience.
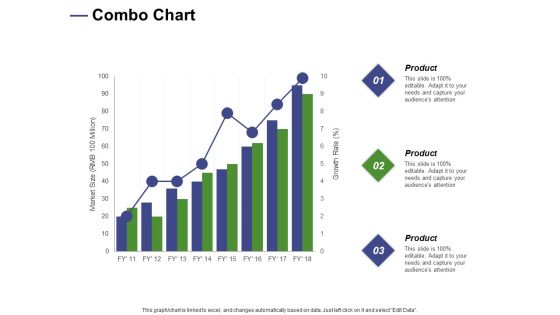
Designing Compensation Systems For Professionals Combo Chart Ppt Portfolio Backgrounds PDF
Presenting this set of slides with name designing compensation systems for professionals combo chart ppt portfolio backgrounds pdf. The topics discussed in these slide is combo chart. This is a completely editable PowerPoint presentation and is available for immediate download. Download now and impress your audience.
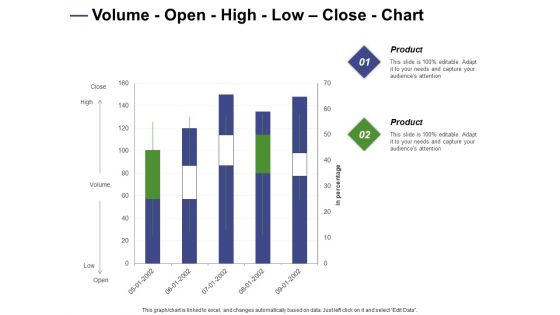
Designing Compensation Systems For Professionals Volume Open High Low Close Chart Introduction PDF
Presenting this set of slides with name designing compensation systems for professionals volume open high low close chart introduction pdf. The topics discussed in these slide is volume open high low close chart. This is a completely editable PowerPoint presentation and is available for immediate download. Download now and impress your audience.
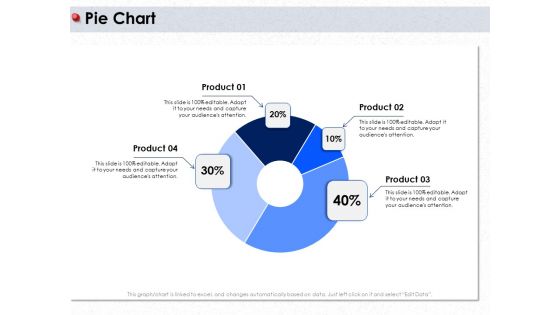
Ways To Design Impactful Trading Solution Pie Chart Ppt PowerPoint Presentation Model Mockup PDF
Presenting this set of slides with name ways to design impactful trading solution pie chart ppt powerpoint presentation model mockup pdf. The topics discussed in these slide is pie chart. This is a completely editable PowerPoint presentation and is available for immediate download. Download now and impress your audience.
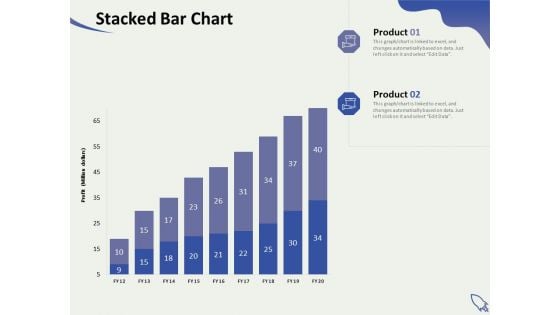
Social Enterprise Funding Stacked Bar Chart Ppt PowerPoint Presentation Summary Design Inspiration PDF
Presenting this set of slides with name social enterprise funding stacked bar chart ppt powerpoint presentation summary design inspiration pdf. The topics discussed in these slide is stacked bar chart. This is a completely editable PowerPoint presentation and is available for immediate download. Download now and impress your audience.
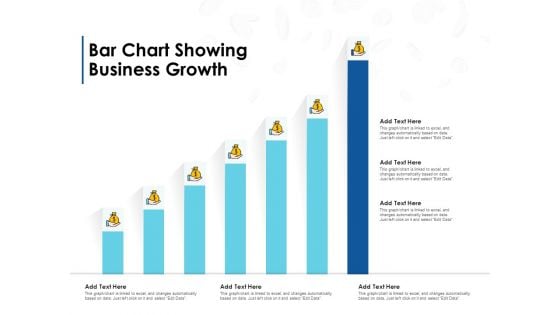
Bar Chart Showing Business Growth Ppt PowerPoint Presentation Portfolio Design Ideas PDF
Presenting this set of slides with name bar chart showing business growth ppt powerpoint presentation portfolio design ideas pdf. The topics discussed in these slide is bar chart showing business growth. This is a completely editable PowerPoint presentation and is available for immediate download. Download now and impress your audience.
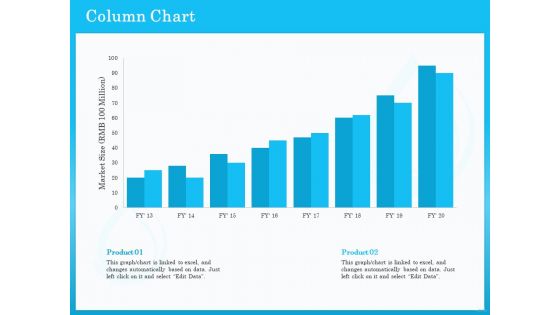
Monitoring And Evaluating Water Quality Column Chart Ppt PowerPoint Presentation File Designs PDF
Presenting this set of slides with name monitoring and evaluating water quality column chart ppt powerpoint presentation file designs pdf. The topics discussed in these slide is column chart. This is a completely editable PowerPoint presentation and is available for immediate download. Download now and impress your audience.
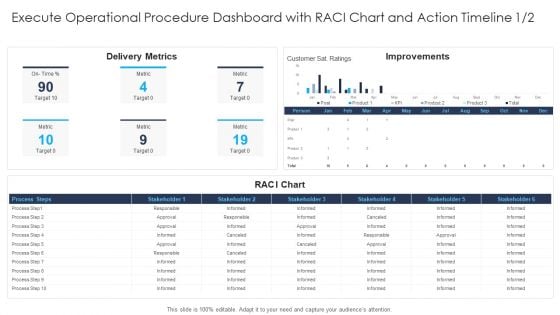
Execute Operational Procedure Dashboard With Raci Chart And Action Timeline Metric Designs PDF
Deliver and pitch your topic in the best possible manner with this execute operational procedure dashboard with raci chart and action timeline metric designs pdf. Use them to share invaluable insights on execute operational procedure dashboard with raci chart and action timeline and impress your audience. This template can be altered and modified as per your expectations. So, grab it now.
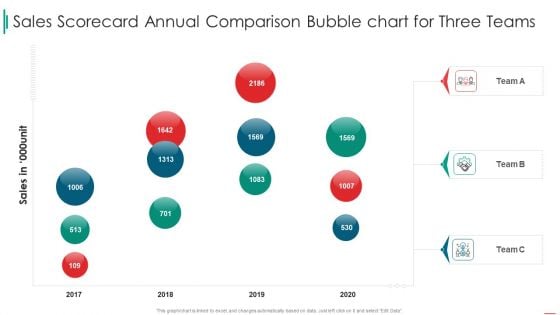
Sales Rep Scorecard Sales Scorecard Annual Comparison Bubble Chart For Three Teams Designs PDF
Deliver and pitch your topic in the best possible manner with this sales rep scorecard sales scorecard annual comparison bubble chart for three teams designs pdf. Use them to share invaluable insights on sales scorecard annual comparison bubble chart for three teams and impress your audience. This template can be altered and modified as per your expectations. So, grab it now.
Framework Administration Commissioning New Facilities Ppt Visual Aids Pictures PDF
This is a framework administration commissioning new facilities ppt visual aids pictures pdf template with various stages. Focus and dispense information on two stages using this creative set, that comes with editable features. It contains large content boxes to add your information on topics like commissioning levels, commissioning by project phase. You can also showcase facts, figures, and other relevant content using this PPT layout. Grab it now.
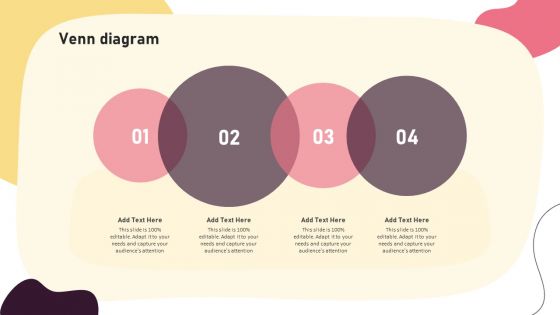
Video Promotion Techniques Venn Diagram Ppt PowerPoint Presentation File Model PDF
Formulating a presentation can take up a lot of effort and time, so the content and message should always be the primary focus. The visuals of the PowerPoint can enhance the presenters message, so our Video Promotion Techniques Venn Diagram Ppt PowerPoint Presentation File Model PDF was created to help save time. Instead of worrying about the design, the presenter can concentrate on the message while our designers work on creating the ideal templates for whatever situation is needed. Slidegeeks has experts for everything from amazing designs to valuable content, we have put everything into Video Promotion Techniques Venn Diagram Ppt PowerPoint Presentation File Model PDF.
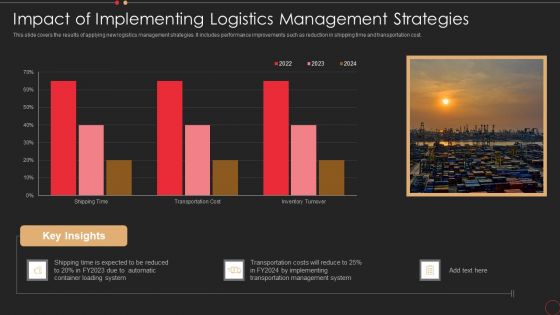
Impact Of Implementing Logistics Management Strategies Diagrams PDF
This slide covers the results of applying new logistics management strategies. It includes performance improvements such as reduction in shipping time and transportation cost. Showcasing this set of slides titled impact of implementing logistics management strategies diagrams pdf. The topics addressed in these templates are implementing, system, management. All the content presented in this PPT design is completely editable. Download it and make adjustments in color, background, font etc. as per your unique business setting.
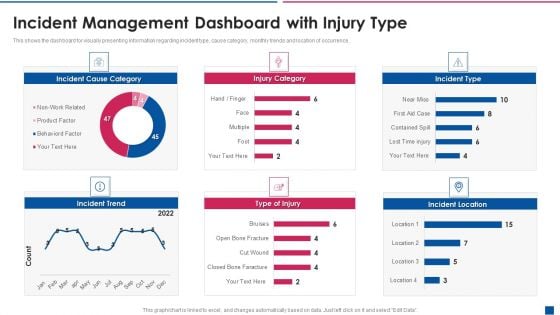
Incident Management Dashboard With Injury Type Diagrams PDF
This shows the dashboard for visually presenting information regarding incident type, cause category, monthly trends and location of occurrence. Showcasing this set of slides titled incident management dashboard with injury type diagrams pdf. The topics addressed in these templates are incident management dashboard with injury type. All the content presented in this PPT design is completely editable. Download it and make adjustments in color, background, font etc. as per your unique business setting.
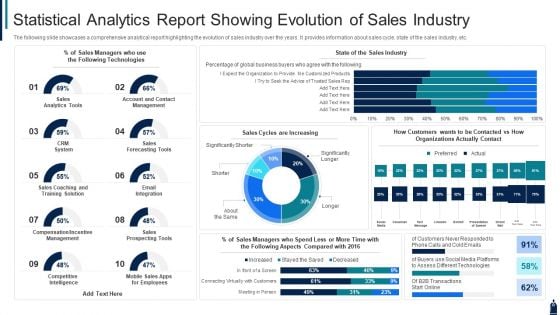
Statistical Analytics Report Showing Evolution Of Sales Industry Diagrams PDF
The following slide showcases a comprehensive analytical report highlighting the evolution of sales industry over the years. It provides information about sales cycle, state of the sales industry, etc. Showcasing this set of slides titled statistical analytics report showing evolution of sales industry diagrams pdf. The topics addressed in these templates are sales, technologies, system. All the content presented in this PPT design is completely editable. Download it and make adjustments in color, background, font etc. as per your unique business setting.
Professional Scrum Master Software Development Progress Tracking Dashboard Diagrams PDF
This slide portrays software development project management dashboard with KPIs namely status of planning, design, development, testing project launch date, project budget, overdue tasks, workload and upcoming deadlines. Deliver an awe inspiring pitch with this creative Professional Scrum Master Software Development Progress Tracking Dashboard Diagrams PDF bundle. Topics like Project Budget, Overdue Tasks, Upcoming Deadlines, Workload, Projected Launch Date, Planning can be discussed with this completely editable template. It is available for immediate download depending on the needs and requirements of the user.
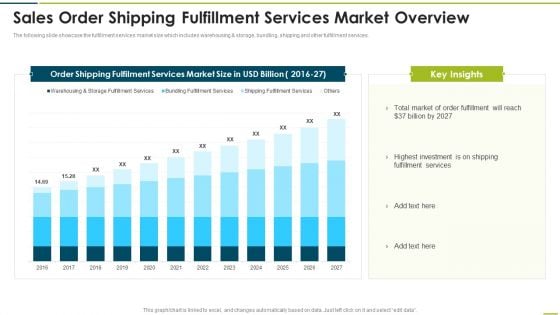
Sales Order Shipping Fulfillment Services Market Overview Diagrams PDF
The following slide showcase the fulfillment services market size which includes warehousing and storage, bundling, shipping and other fulfillment services.Pitch your topic with ease and precision using this Sales Order Shipping Fulfillment Services Market Overview Diagrams PDF This layout presents information on Order Shipping, Highest Investment, Fulfilment Services It is also available for immediate download and adjustment. So, changes can be made in the color, design, graphics or any other component to create a unique layout.
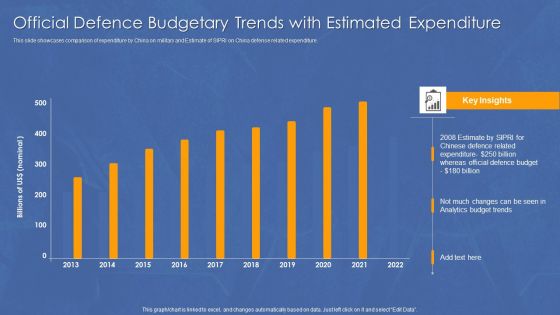
Official Defence Budgetary Trends With Estimated Expenditure Diagrams PDF
This slide showcases comparison of expenditure by China on military and Estimate of SIPRI on China defense related expenditure.Pitch your topic with ease and precision using this Official Defence Budgetary Trends With Estimated Expenditure Diagrams PDF. This layout presents information on Defence Related, Defence Budget, Expenditure. It is also available for immediate download and adjustment. So, changes can be made in the color, design, graphics or any other component to create a unique layout.

Commercial Marketing KPI With Return On Investment Diagrams PDF
This slide templates covers about trade marketing key performing indicators with website visitors, leads by channel, social media reach with yearly goal achievement.Pitch your topic with ease and precision using this Commercial Marketing KPI With Return On Investment Diagrams PDF. This layout presents information on Marketing Spend, Return Investment, Budget Remaining. It is also available for immediate download and adjustment. So, changes can be made in the color, design, graphics or any other component to create a unique layout.
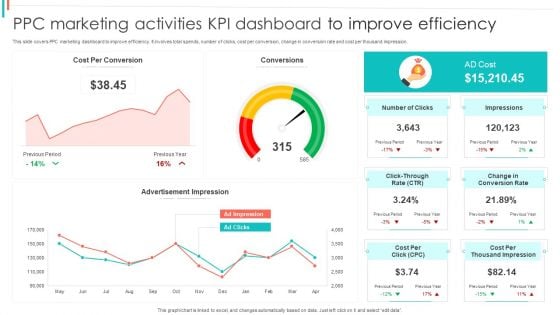
PPC Marketing Activities KPI Dashboard To Improve Efficiency Diagrams PDF
This slide covers PPC marketing dashboard to improve efficiency. It involves total spends, number of clicks, cost per conversion, change in conversion rate and cost per thousand impression.Showcasing this set of slides titled PPC Marketing Activities KPI Dashboard To Improve Efficiency Diagrams PDF. The topics addressed in these templates are Per Conversion, Advertisement Impression, Impressions. All the content presented in this PPT design is completely editable. Download it and make adjustments in color, background, font etc. as per your unique business setting.
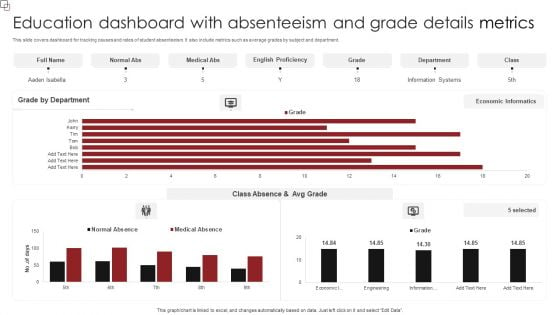
Education Dashboard With Absenteeism And Grade Details Metrics Diagrams PDF
This slide covers dashboard for tracking causes and rates of student absenteeism. It also include metrics such as average grades by subject and department. Pitch your topic with ease and precision using this Education Dashboard With Absenteeism And Grade Details Metrics Diagrams PDF. This layout presents information on Grade Department, English Proficiency, Medical Abs. It is also available for immediate download and adjustment. So, changes can be made in the color, design, graphics or any other component to create a unique layout.

Project Management Report Dashboard Exhibiting Task Progress Diagrams PDF
This slide showcase report dashboard of project management representing task progress status. It covers project name, status, tasks, priority, budget and pending items for the project. Showcasing this set of slides titled Project Management Report Dashboard Exhibiting Task Progress Diagrams PDF. The topics addressed in these templates are Company Website Development, Tasks Status, Budget. All the content presented in this PPT design is completely editable. Download it and make adjustments in color, background, font etc. as per your unique business setting.
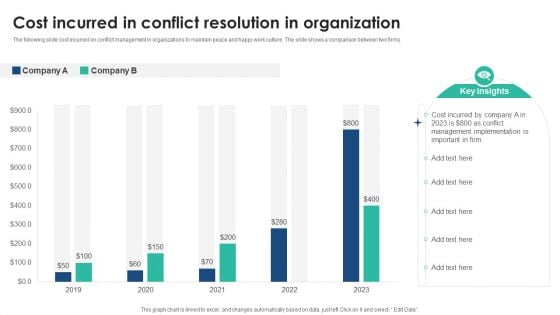
Cost Incurred In Conflict Resolution In Organization Diagrams PDF
The following slide cost incurred on conflict management in organizations to maintain peace and happy work culture. The slide shows a comparison between two firms. Showcasing this set of slides titled Cost Incurred In Conflict Resolution In Organization Diagrams PDF. The topics addressed in these templates are Cost Incurred, Conflict Resolution, Organization. All the content presented in this PPT design is completely editable. Download it and make adjustments in color, background, font etc. as per your unique business setting.
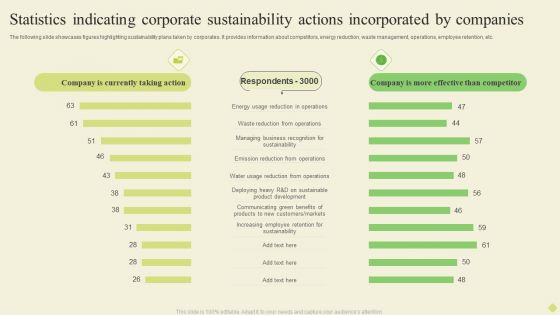
Statistics Indicating Corporate Sustainability Actions Incorporated By Companies Diagrams PDF
The following slide showcases figures highlighting sustainability plans taken by corporates. It provides information about competitors, energy reduction, waste management, operations, employee retention, etc.Pitch your topic with ease and precision using this Statistics Indicating Corporate Sustainability Actions Incorporated By Companies Diagrams PDF. This layout presents information on Energy Reduction, Emission Reduction, Increasing Employee. It is also available for immediate download and adjustment. So, changes can be made in the color, design, graphics or any other component to create a unique layout.
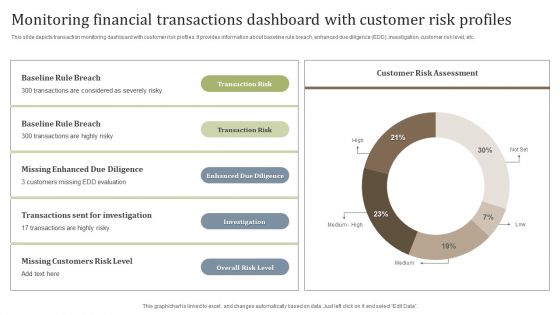
Monitoring Financial Transactions Dashboard With Customer Risk Profiles Diagrams PDF
This slide depicts transaction monitoring dashboard with customer risk profiles. It provides information about baseline rule breach, enhanced due diligence EDD, investigation, customer risk level, etc. Showcasing this set of slides titled Monitoring Financial Transactions Dashboard With Customer Risk Profiles Diagrams PDF. The topics addressed in these templates are Overall Risk Level, Investigation, Enhanced Due Diligence. All the content presented in this PPT design is completely editable. Download it and make adjustments in color, background, font etc. as per your unique business setting.

Project Risk KPI Dashboard With Impact Assessment Diagrams PDF
This slide depicts project risk impact assessment dashboard. It provides information about residual, inherent, enterprise and project risk assessment by status, etc. Showcasing this set of slides titled Project Risk KPI Dashboard With Impact Assessment Diagrams PDF. The topics addressed in these templates are Inherent Risk, Impact Of Risks On Project. All the content presented in this PPT design is completely editable. Download it and make adjustments in color, background, font etc. as per your unique business setting.
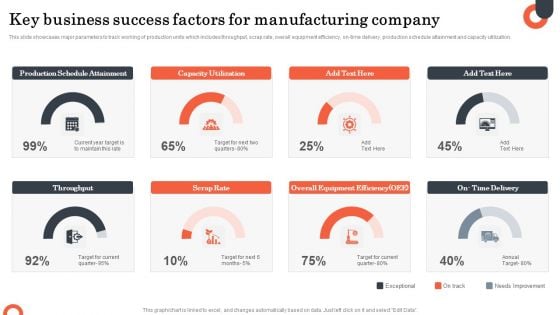
Key Business Success Factors For Manufacturing Company Diagrams PDF
This slide showcases major parameters to track working of production units which includes throughput, scrap rate, overall equipment efficiency, on-time delivery, production schedule attainment and capacity utilization. Showcasing this set of slides titled Key Business Success Factors For Manufacturing Company Diagrams PDF. The topics addressed in these templates are Production Schedule Attainment, Capacity Utilization, Scrap Rate. All the content presented in this PPT design is completely editable. Download it and make adjustments in color, background, font etc. as per your unique business setting.
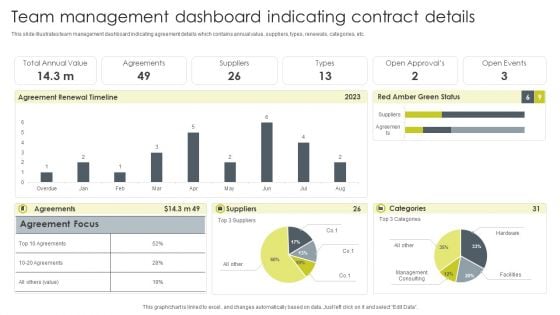
Team Management Dashboard Indicating Contract Details Diagrams PDF
This slide illustrates team management dashboard indicating agreement details which contains annual value, suppliers, types, renewals, categories, etc. Showcasing this set of slides titled Team Management Dashboard Indicating Contract Details Diagrams PDF. The topics addressed in these templates are Suppliers, Agreements, Total Annual Value. All the content presented in this PPT design is completely editable. Download it and make adjustments in color, background, font etc. as per your unique business setting.
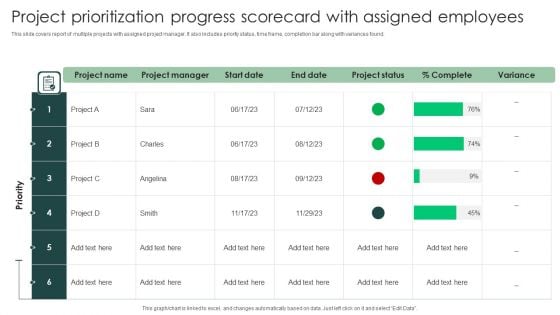
Project Prioritization Progress Scorecard With Assigned Employees Diagrams PDF
This slide covers report of multiple projects with assigned project manager. It also includes priority status, time frame, completion bar along with variances found. Pitch your topic with ease and precision using this Project Prioritization Progress Scorecard With Assigned Employees Diagrams PDF. This layout presents information on Project Prioritization, Progress Scorecard, Assigned Employees. It is also available for immediate download and adjustment. So, changes can be made in the color, design, graphics or any other component to create a unique layout.
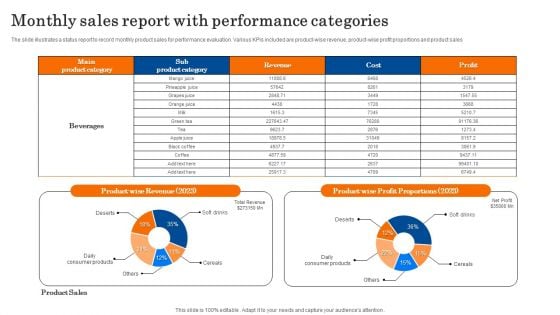
Monthly Sales Report With Performance Categories Diagrams PDF
The slide illustrates a status report to record monthly product sales for performance evaluation. Various KPIs included are product wise revenue, product-wise profit proportions and product sales. Showcasing this set of slides titled Monthly Sales Report With Performance Categories Diagrams PDF. The topics addressed in these templates are Revenue, Profit Proportions, Product Sales. All the content presented in this PPT design is completely editable. Download it and make adjustments in color, background, font etc. as per your unique business setting.
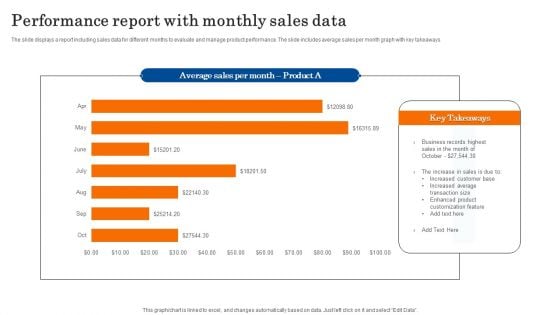
Performance Report With Monthly Sales Data Diagrams PDF
The slide displays a report including sales data for different months to evaluate and manage product performance. The slide includes average sales per month graph with key takeaways. Showcasing this set of slides titled Performance Report With Monthly Sales Data Diagrams PDF. The topics addressed in these templates are Business, Sales, Customization. All the content presented in this PPT design is completely editable. Download it and make adjustments in color, background, font etc. as per your unique business setting.
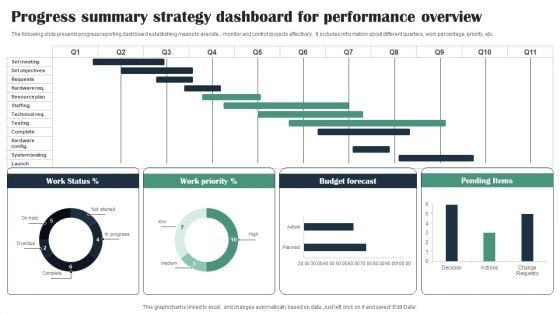
Progress Summary Strategy Dashboard For Performance Overview Diagrams PDF
The following slide presents progress reporting dashboard establishing means to execute , monitor and control projects effectively. It includes information about different quarters, work percentage, priority, etc. Showcasing this set of slides titled Progress Summary Strategy Dashboard For Performance Overview Diagrams PDF. The topics addressed in these templates are Work Status, Work Priority, Budget Forecast. All the content presented in this PPT design is completely editable. Download it and make adjustments in color, background, font etc. as per your unique business setting.
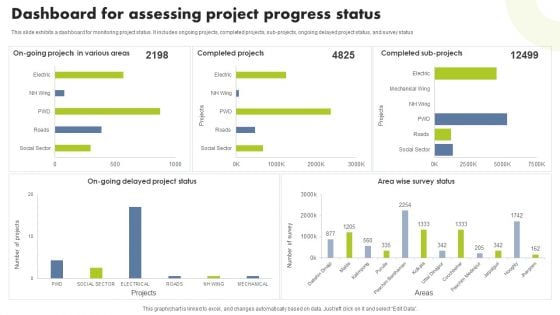
Dashboard For Assessing Project Progress Status Diagrams PDF
This slide exhibits a dashboard for monitoring project status. It includes ongoing projects, completed projects, sub-projects, ongoing delayed project status, and survey status. Showcasing this set of slides titled Dashboard For Assessing Project Progress Status Diagrams PDF. The topics addressed in these templates are Completed Projects, Completed Sub Projects, Area Wise Survey. All the content presented in this PPT design is completely editable. Download it and make adjustments in color, background, font etc. as per your unique business setting.
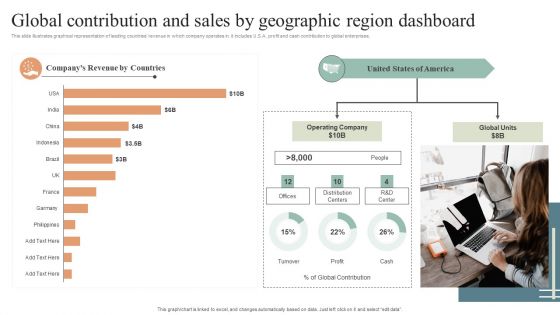
Global Contribution And Sales By Geographic Region Dashboard Diagrams PDF
This slide illustrates graphical representation of leading countries revenue in which company operates in. it includes U.S.A. profit and cash contribution to global enterprises. Pitch your topic with ease and precision using this Global Contribution And Sales By Geographic Region Dashboard Diagrams PDF. This layout presents information on Global Contribution, Sales By Geographic, Region Dashboard. It is also available for immediate download and adjustment. So, changes can be made in the color, design, graphics or any other component to create a unique layout.
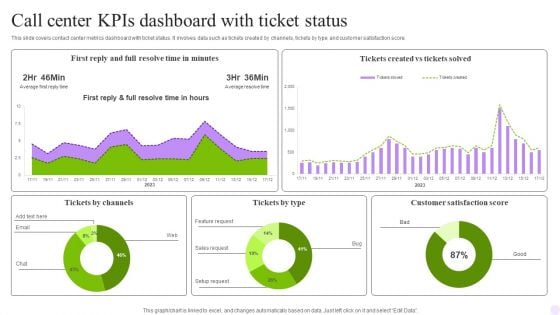
Call Center Kpis Dashboard With Ticket Status Diagrams PDF
This slide covers contact center metrics dashboard with ticket status. It involves data such as tickets created by channels, tickets by type and customer satisfaction score. Showcasing this set of slides titled Call Center Kpis Dashboard With Ticket Status Diagrams PDF. The topics addressed in these templates are Status, Minutes, Call. All the content presented in this PPT design is completely editable. Download it and make adjustments in color, background, font etc. as per your unique business setting.
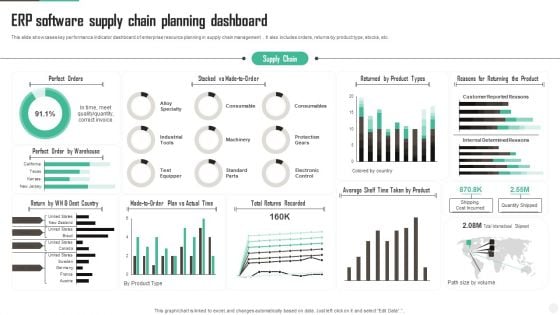
ERP Software Supply Chain Planning Dashboard Diagrams PDF
This slide showcases key performance indicator dashboard of enterprise resource planning in supply chain management . It also includes orders, returns by product type, stocks, etc. Showcasing this set of slides titled ERP Software Supply Chain Planning Dashboard Diagrams PDF Sample. The topics addressed in these templates are Perfect Orders, Dest Country, Actual Time. All the content presented in this PPT design is completely editable. Download it and make adjustments in color, background, font etc. as per your unique business setting.
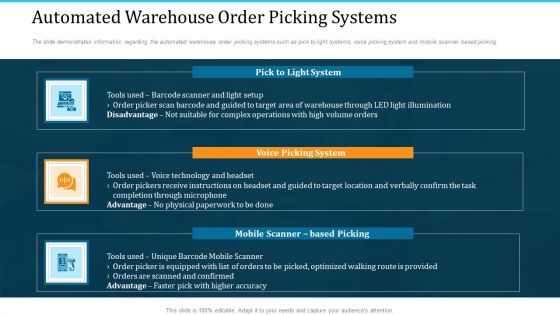
WMS Implementation Automated Warehouse Order Picking Systems Themes PDF
The slide demonstrates information regarding the automated warehouse order picking systems such as pick to light systems, voice picking system and mobile scanner based picking. Deliver an awe-inspiring pitch with this creative wms implementation automated warehouse order picking systems themes pdf bundle. Topics like target location, complex operations, completion can be discussed with this completely editable template. It is available for immediate download depending on the needs and requirements of the user.
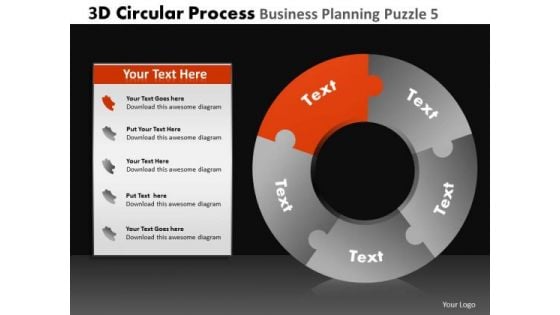
PowerPoint Slidelayout Executive Leadership 3d Cycle Chart Process Ppt Design Slides
PowerPoint Slidelayout Executive Leadership 3d Cycle Chart process PPT Design Slides-These high quality powerpoint pre-designed slides and powerpoint templates have been carefully created by our professional team to help you impress your audience. All slides have been created and are 100% editable in powerpoint. Each and every property of any graphic - color, size, orientation, shading, outline etc. can be modified to help you build an effective powerpoint presentation. Any text can be entered at any point in the powerpoint template or slide. Simply DOWNLOAD, TYPE and PRESENT! Coach your organization with our PowerPoint Slidelayout Executive Leadership 3d Cycle Chart Process Ppt Design Slides. You will come out on top.
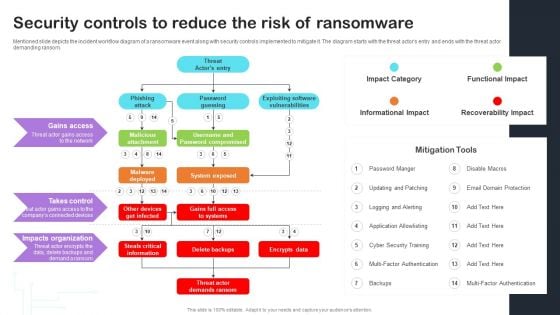
Cyber Risks And Incident Response Playbook Security Controls To Reduce The Risk Of Ransomware Themes PDF
Mentioned slide depicts the incident workflow diagram of a ransomware event along with security controls implemented to mitigate it. The diagram starts with the threat actors entry and ends with the threat actor demanding ransom. Take your projects to the next level with our ultimate collection of Cyber Risks And Incident Response Playbook Security Controls To Reduce The Risk Of Ransomware Themes PDF. Slidegeeks has designed a range of layouts that are perfect for representing task or activity duration, keeping track of all your deadlines at a glance. Tailor these designs to your exact needs and give them a truly corporate look with your own brand colors theyll make your projects stand out from the rest.
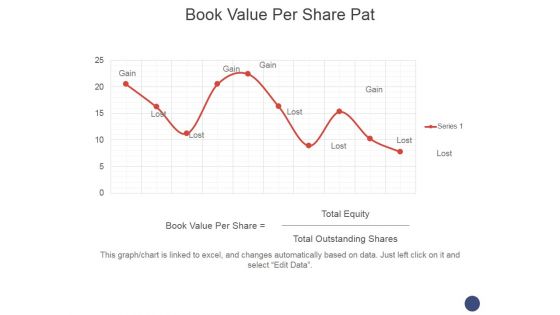
Book Value Per Share Pat Ppt PowerPoint Presentation Layouts Outfit
This is a book value per share pat ppt powerpoint presentation layouts outfit. This is a ten stage process. The stages in this process are book value per share, equity total, total outstanding shares.
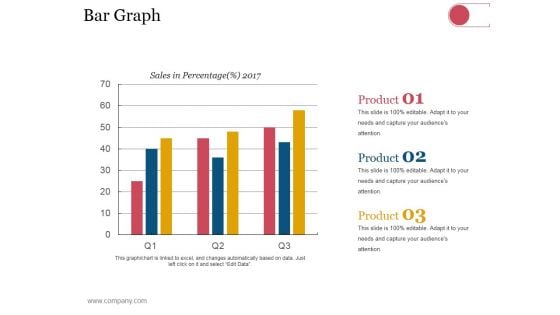
Bar Graph Ppt PowerPoint Presentation Visual Aids Model
This is a bar graph ppt powerpoint presentation visual aids model. This is a three stage process. The stages in this process are business, strategy, analysis, planning, sales in percentage.
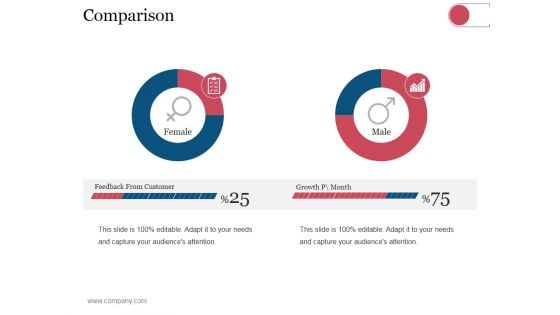
Comparison Ppt PowerPoint Presentation Pictures Templates
This is a comparison ppt powerpoint presentation pictures templates. This is a two stage process. The stages in this process are business, strategy, analysis, planning, feedback from customer, growth.


 Continue with Email

 Home
Home


