Construction Icons
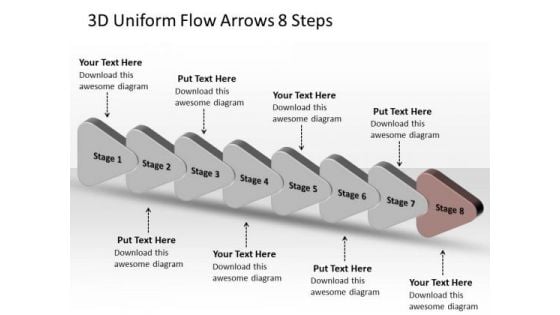
3d Uniform Flow Arrows 8 Steps Process Charts PowerPoint Slides
We present our 3d uniform flow arrows 8 steps process charts PowerPoint Slides. Use our Business PowerPoint Templates because, Spread the light of knowledge around you, clear the doubts and enlighten the questioning minds with your brilliance and ability. Use our Arrows PowerPoint Templates because, you have the moves to sway the market. Use our Success PowerPoint Templates because, the basic stages are in place, you need to build upon them with our PowerPoint templates. Use our Signs PowerPoint Templates because, the pyramid is a symbol of the desire to reach the top in a steady manner. Use our Process and Flows PowerPoint Templates because, However there is a key aspect to be emphasized. Use these PowerPoint slides for presentations relating to abstract, arrow, arrows, business, chart, design, development, diagram, direction, element, flow, flowchart, graph, linear, management, model, motion, organization, plan, process, program, section, segment, set, sign, solution, strategy, symbol, technology. The prominent colors used in the PowerPoint template are Brown, Gray, and Black Cheat failure with our 3d Uniform Flow Arrows 8 Steps Process Charts PowerPoint Slides. You will come out on top.
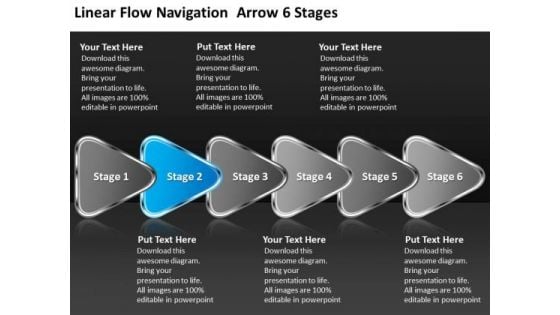
Linear Flow Navigation Arrow 6 Stages Best Chart PowerPoint Templates
We present our linear flow navigation arrow 6 stages best chart PowerPoint templates.Use our Arrows PowerPoint Templates because, There are different paths to gain the necessary knowledge to acheive it. Use our Marketing PowerPoint Templates because,This shows plans to increase the strength of your business relationships. Use our Success PowerPoint Templates because, The success of your venture depends on the performance of every team member. Use our Process and Flows PowerPoint Templates because, Our template will help pinpoint their viability. Use our Business PowerPoint Templates because,This template helps you to grab the attention of your listeners.Use these PowerPoint slides for presentations relating to Abstract, Arrow, Arrows, Business, Chart, Design, Development, Diagram, Direction, Element, Flow, Flowchart, Graph, Linear, Management, Model, Motion, Organization, Plan, Process, Program, Section, Segment, Set, Sign, Solution, Strategy, Symbol, Technology. The prominent colors used in the PowerPoint template are Blue, Gray, Black Make education entertaining with our Linear Flow Navigation Arrow 6 Stages Best Chart PowerPoint Templates. Add color to even the dullest activity.
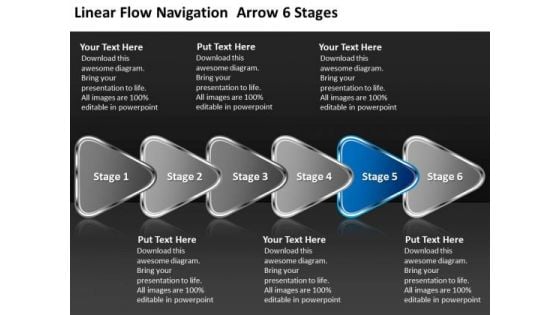
Linear Flow Navigation Arrow 6 Stages Chart Slides PowerPoint Templates
We present our linear flow navigation arrow 6 stages chart Slides PowerPoint templates.Use our Arrows PowerPoint Templates because,You have the people in place, selected the team leaders and all are raring to go. Use our Marketing PowerPoint Templates because,Networking is an imperative in todays world. You need to access the views of others. Similarly you need to give access to them of your abilities Use our Success PowerPoint Templates because,You have come up with a brilliant breakthrough idea. You can also visualise the interest it will generate. Use our Process and Flows PowerPoint Templates because,You have the people in place, selected the team leaders and all are raring to go. Use our Business PowerPoint Templates because, Your ideas too are pinpointedly focused on you goals. Use these PowerPoint slides for presentations relating to Abstract, Arrow, Arrows, Business, Chart, Design, Development, Diagram, Direction, Element, Flow, Flowchart, Graph, Linear, Management, Model, Motion, Organization, Plan, Process, Program, Section, Segment, Set, Sign, Solution, Strategy, Symbol, Technology. The prominent colors used in the PowerPoint template are Blue navy, Gray, Black Get face to face with your audience. Put your thoughts and our Linear Flow Navigation Arrow 6 Stages Chart Slides PowerPoint Templates right up front.
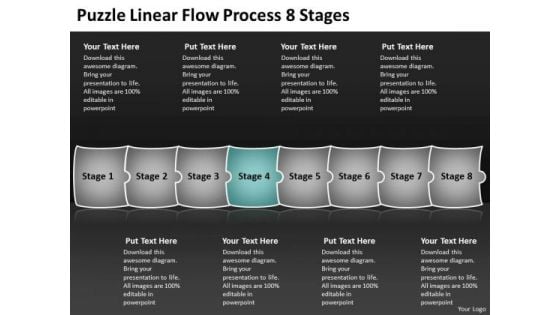
Puzzle Linear Flow Process 8 Stages Chart PowerPoint Templates
We present our puzzle linear flow process 8 stages chart PowerPoint templates.Use our Business PowerPoint Templates because, Your ideas too are pinpointedly focused on you goals. Use our Puzzles or Jigsaws PowerPoint Templates because,You have a handle on all the targets, a master of the game, the experienced and consummate juggler. Use our Communication PowerPoint Templates because,your group can behave steady in the top bracket. Use our Shapes PowerPoint Templates because,This slide is Designed to help bullet-point your views and thoughts. Use our Success PowerPoint Templates because,You have come up with a brilliant breakthrough idea. You can also visualise the interest it will generate.Use these PowerPoint slides for presentations relating to abstract, action, attach, box, business, center, chain, chart, communication, concept, connection, cube, cycle, data, diagram, flow, horizontal, illustration, individual, interaction, jigsaw, join, link, merge, puzzle, relation, relationship, search, shape, silhouette, success. The prominent colors used in the PowerPoint template are Blue, White, Gray Complete your projects with our Puzzle Linear Flow Process 8 Stages Chart PowerPoint Templates. Download without worries with our money back guaranteee.
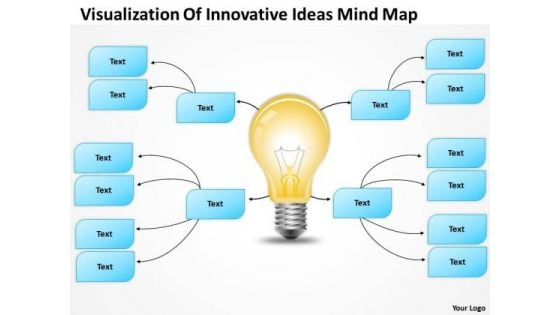
PowerPoint Org Chart Visualization Of Innovative Ideas Mind Map Templates
We present our powerpoint org chart visualization of innovative ideas mind map templates.Use our Technology PowerPoint Templates because These PowerPoint Templates and Slides will give the updraft to your ideas. See them soar to great heights with ease. Download our Marketing PowerPoint Templates because Our PowerPoint Templates and Slides are a sure bet. Gauranteed to win against all odds. Use our Arrows PowerPoint Templates because Our PowerPoint Templates and Slides will effectively help you save your valuable time. They are readymade to fit into any presentation structure. Use our Light Bulbs PowerPoint Templates because Our PowerPoint Templates and Slides are effectively colour coded to prioritise your plans They automatically highlight the sequence of events you desire. Present our Business PowerPoint Templates because Our PowerPoint Templates and Slides will definately Enhance the stature of your presentation. Adorn the beauty of your thoughts with their colourful backgrounds.Use these PowerPoint slides for presentations relating to Chart, flow, organization, flowchart, diagram, sitemap, process, box, arrow, graph, business, graphical, data, design, important, rectangle, corporate, plan, president, concept, hierarchy, glossy, teamwork, tier, chain, supervisor, relation, steps, glassy, connection, ladder, administration, group, connect, organize, connectivity, site-map, office, financial, structure, officer, glass. The prominent colors used in the PowerPoint template are Yellow, Gray, White. Maintain the continuity of your thoughts. Our PowerPoint Org Chart Visualization Of Innovative Ideas Mind Map Templates will be the fillers.
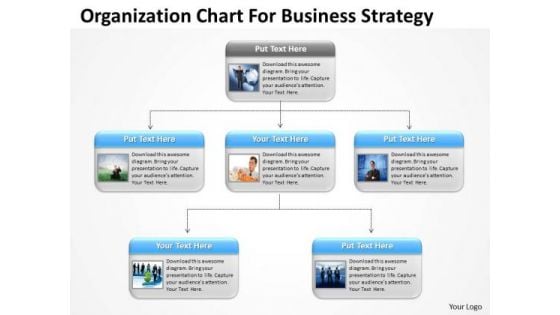
Chart For International Marketing Concepts Formulate Business Plan PowerPoint Templates
We present our chart for international marketing concepts formulate business plan PowerPoint templates.Present our Technology PowerPoint Templates because You can safely bank on our PowerPoint Templates and Slides. They will provide a growth factor to your valuable thoughts. Download and present our Competition PowerPoint Templates because You have a driving passion to excel in your field. Our PowerPoint Templates and Slides will prove ideal vehicles for your ideas. Download our Boxes PowerPoint Templates because Our PowerPoint Templates and Slides will let you Clearly mark the path for others to follow. Present our Process and Flows PowerPoint Templates because Our PowerPoint Templates and Slides will bullet point your ideas. See them fall into place one by one. Present our Business PowerPoint Templates because You will get more than you ever bargained for. Use these PowerPoint slides for presentations relating to Chart, flow, organization, flowchart, box, vector, chain, information, 3d, network, isolated, program, business, blank, plan, concept, arrow, sign, teamwork, symbol, organisation, diagram, circle, graphic, process, workflow, technology, shape, management, graph, connection, solution, design, colorful, empty, procedure, connect, organize, background, work, structure, block. The prominent colors used in the PowerPoint template are Blue, Gray, Black. Destroy failure with our Chart For International Marketing Concepts Formulate Business Plan PowerPoint Templates. You will come out on top.
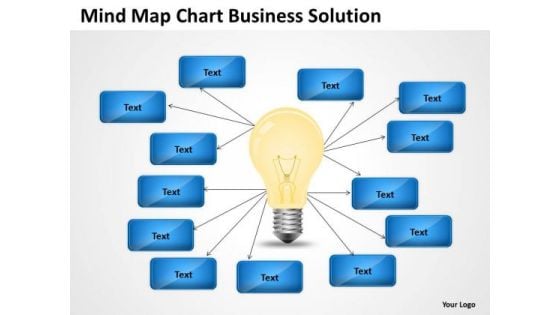
Mind Map Chart Business Solution Ppt Internet Plan PowerPoint Templates
We present our mind map chart business solution ppt internet plan PowerPoint templates.Use our Technology PowerPoint Templates because It will Give impetus to the hopes of your colleagues. Our PowerPoint Templates and Slides will aid you in winning their trust. Download and present our Marketing PowerPoint Templates because Our PowerPoint Templates and Slides help you meet the demand of the Market. Just browse and pick the slides that appeal to your intuitive senses. Present our Light Bulbs PowerPoint Templates because You have a driving passion to excel in your field. Our PowerPoint Templates and Slides will prove ideal vehicles for your ideas. Present our Business PowerPoint Templates because You can Be the puppeteer with our PowerPoint Templates and Slides as your strings. Lead your team through the steps of your script. Download and present our Arrows PowerPoint Templates because Our PowerPoint Templates and Slides will fulfill your every need. Use them and effectively satisfy the desires of your audience.Use these PowerPoint slides for presentations relating to Flowchart, chart, 3d, light bulb, concept, idea, organization, arrows, organization, flowchart, box, chain, information, 3d, network, isolated, program, business, blank, plan, concept, arrow, sign, teamwork, symbol, organisation, diagram, circle, graphic, process, workflow, technology, shape, management, graph, connection, solution, design, procedure, connect, organize, work, structure, block. The prominent colors used in the PowerPoint template are Blue, Yellow, White. Draft your plans with our Mind Map Chart Business Solution Ppt Internet Plan PowerPoint Templates. Download without worries with our money back guaranteee.
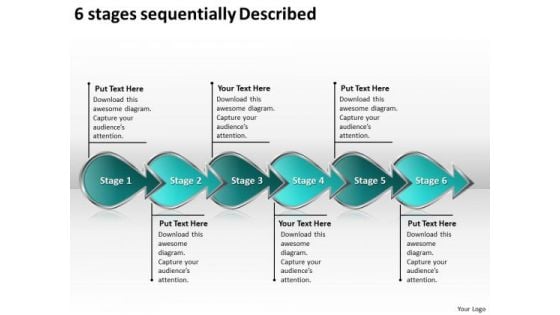
6 Stages Sequentially Described Flow Charting PowerPoint Templates
We present our 6 stages sequentially described flow charting PowerPoint templates.Use our Arrows PowerPoint Templates because it outlines the process with this innovative graphic to authenticate your plan of achieving the goal of added value/profit. Download and present our Shapes PowerPoint Templates because they are the stepping stones of our journey till date. Download and present our Business PowerPoint Templates because a brainwave has occurred to you after review. You know just how to push the graph skyward. Download our Leadership PowerPoint Templates because a healthy person is the esence of a sense of happiness. Use our Process and Flows PowerPoint Templates because you can present your opinions in this field using our impressive templates.Use these PowerPoint slides for presentations relating to Arrow, Arrows, Block, Business, Chart, Design, Development, Diagram, Direction, Element, Flow, Flowchart, Graph, Linear, Management, Organization, Process, Program, Section, Sign, Solution, Symbol. The prominent colors used in the PowerPoint template are Blue light, Blue, Black. Customers tell us our 6 stages sequentially described flow charting PowerPoint templates are Fantastic. The feedback we get is that our Chart PowerPoint templates and PPT Slides are readymade to fit into any presentation structure. Professionals tell us our 6 stages sequentially described flow charting PowerPoint templates are No-nonsense. People tell us our Block PowerPoint templates and PPT Slides are Zippy. Customers tell us our 6 stages sequentially described flow charting PowerPoint templates are topically designed to provide an attractive backdrop to any subject. Professionals tell us our Direction PowerPoint templates and PPT Slides are Tasteful. Filter out ideas with our 6 Stages Sequentially Described Flow Charting PowerPoint Templates. They get actionable ones to emerge.
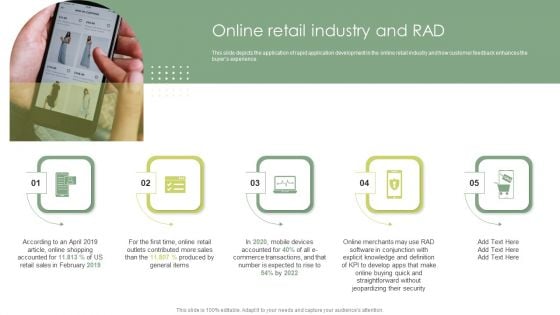
Online Retail Industry And Rad Rapid Application Building RAB Model Microsoft PDF
This slide depicts the application of rapid application development in the online retail industry and how customer feedback enhances the buyers experience.Whether you have daily or monthly meetings, a brilliant presentation is necessary. Online Retail Industry And Rad Rapid Application Building RAB Model Microsoft PDF can be your best option for delivering a presentation. Represent everything in detail using Online Retail Industry And Rad Rapid Application Building RAB Model Microsoft PDF and make yourself stand out in meetings. The template is versatile and follows a structure that will cater to your requirements. All the templates prepared by Slidegeeks are easy to download and edit. Our research experts have taken care of the corporate themes as well. So, give it a try and see the results.
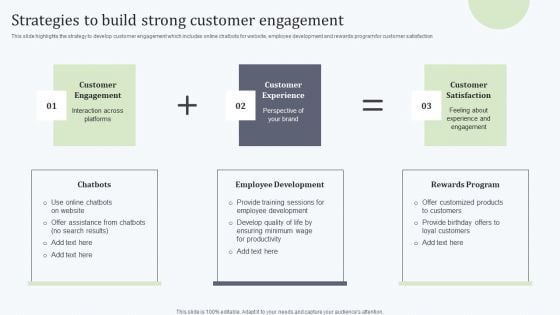
Deploying Revitalization Strategy Enhance Product And Service Sales Strategies To Build Strong Customer Information PDF
This slide highlights the strategy to develop customer engagement which includes online chatbots for website, employee development and rewards program for customer satisfaction Whether you have daily or monthly meetings, a brilliant presentation is necessary. Deploying Revitalization Strategy Enhance Product And Service Sales Strategies To Build Strong Customer Information PDF can be your best option for delivering a presentation. Represent everything in detail using Deploying Revitalization Strategy Enhance Product And Service Sales Strategies To Build Strong Customer Information PDF and make yourself stand out in meetings. The template is versatile and follows a structure that will cater to your requirements. All the templates prepared by Slidegeeks are easy to download and edit. Our research experts have taken care of the corporate themes as well. So, give it a try and see the results.
Triptans Comparison Chart In Powerpoint And Google Slides Cpb
Presenting our innovatively designed set of slides titled Triptans Comparison Chart In Powerpoint And Google Slides Cpb This completely editable PowerPoint graphic exhibits Triptans Comparison Chart that will help you convey the message impactfully. It can be accessed with Google Slides and is available in both standard screen and widescreen aspect ratios. Apart from this, you can download this well structured PowerPoint template design in different formats like PDF, JPG, and PNG. So, click the download button now to gain full access to this PPT design. Our Triptans Comparison Chart In Powerpoint And Google Slides Cpb are topically designed to provide an attractive backdrop to any subject. Use them to look like a presentation pro.
Sound Quality Chart In Powerpoint And Google Slides Cpb
Presenting our innovatively designed set of slides titled Sound Quality Chart In Powerpoint And Google Slides Cpb. This completely editable PowerPoint graphic exhibits Sound Quality Chart that will help you convey the message impactfully. It can be accessed with Google Slides and is available in both standard screen and widescreen aspect ratios. Apart from this, you can download this well structured PowerPoint template design in different formats like PDF, JPG, and PNG. So, click the download button now to gain full access to this PPT design. Our Sound Quality Chart In Powerpoint And Google Slides Cpb are topically designed to provide an attractive backdrop to any subject. Use them to look like a presentation pro.
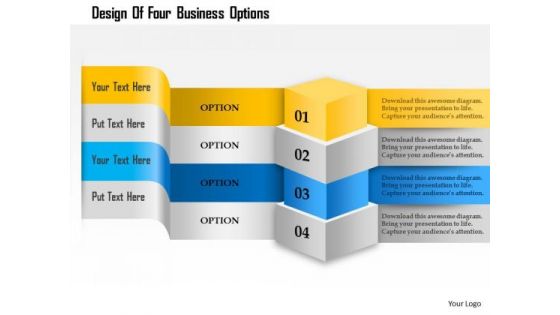
Business Diagram Design Of Four Business Options Presentation Template
Graphic of four staged colorful text boxes has been used to craft this power point template. This PPT contains the concept of data representation and flow. This PPT can be used for your data flow related topics in any business and sales presentation.
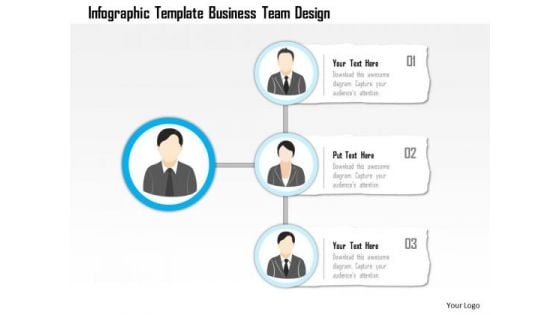
Business Diagram Infographic Template Business Team Design Presentation Template
Concept of business team formation has been displayed in this power point template with suitable graphics. This PPT contains the graphic of business team and info graphics. Use this PPT for business presentations.
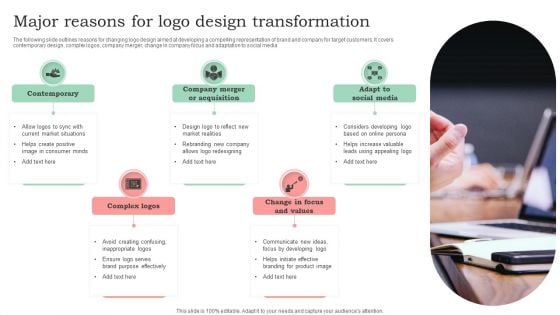
Major Reasons For Logo Design Transformation Guidelines PDF
The following slide outlines reasons for changing logo design aimed at developing a compelling representation of brand and company for target customers. It covers contemporary design, complex logos, company merger, change in company focus and adaptation to social media. Presenting Major Reasons For Logo Design Transformation Guidelines PDF to dispense important information. This template comprises five stages. It also presents valuable insights into the topics including Contemporary, Complex Logos, Social Media. This is a completely customizable PowerPoint theme that can be put to use immediately. So, download it and address the topic impactfully.
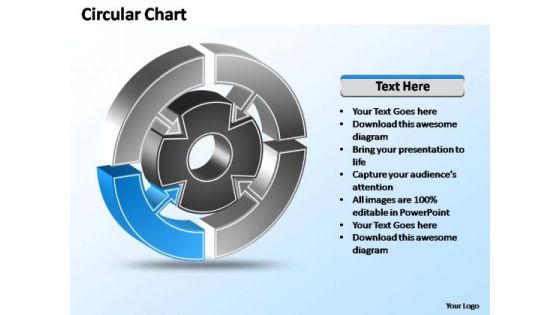
PowerPoint Templates Strategy Interconnected Circular Chart Ppt Layout
Analyze the seven success factors of your business with this circular business chart for Microsoft PowerPoint presentations Our PowerPoint Templates Strategy Interconnected Circular Chart Ppt Layout are clear to even the farthest. They are designed for distance.
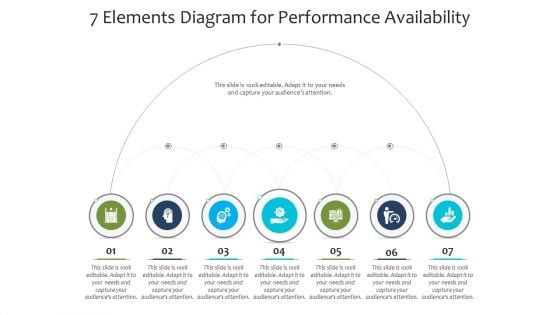
7 Elements Diagram For Performance Availability Ppt PowerPoint Presentation File Background Designs PDF
Presenting 7 elements diagram for performance availability ppt powerpoint presentation file background designs pdf to dispense important information. This template comprises seven stages. It also presents valuable insights into the topics including 7 elements diagram for performance availability. This is a completely customizable PowerPoint theme that can be put to use immediately. So, download it and address the topic impactfully.
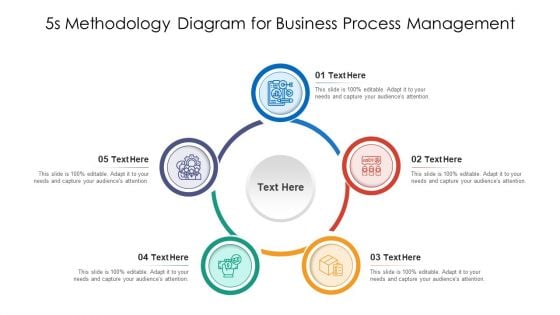
5S Methodology Diagram For Business Process Management Ppt PowerPoint Presentation Pictures Designs PDF
Presenting 5s methodology diagram for business process management ppt powerpoint presentation pictures designs pdf to dispense important information. This template comprises five stages. It also presents valuable insights into the topics including 5s methodology diagram for business process management. This is a completely customizable PowerPoint theme that can be put to use immediately. So, download it and address the topic impactfully.
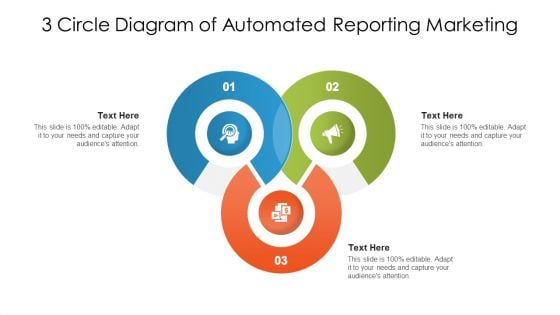
3 Circle Diagram Of Automated Reporting Marketing Ppt PowerPoint Presentation File Background Designs PDF
Presenting 3 circle diagram of automated reporting marketing ppt powerpoint presentation file background designs pdf to dispense important information. This template comprises three stages. It also presents valuable insights into the topics including 3 circle diagram of automated reporting marketing. This is a completely customizable PowerPoint theme that can be put to use immediately. So, download it and address the topic impactfully.
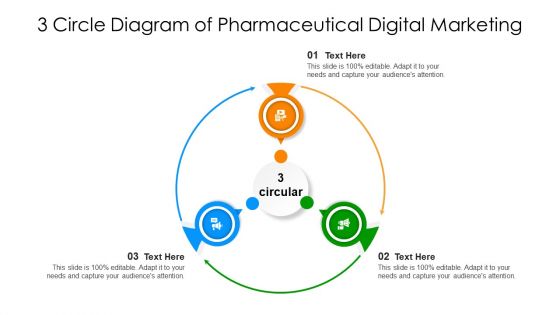
3 Circle Diagram Of Pharmaceutical Digital Marketing Ppt PowerPoint Presentation File Designs Download PDF
Presenting 3 circle diagram of pharmaceutical digital marketing ppt powerpoint presentation file designs download pdf to dispense important information. This template comprises three stages. It also presents valuable insights into the topics including 3 circle diagram of pharmaceutical digital marketing. This is a completely customizable PowerPoint theme that can be put to use immediately. So, download it and address the topic impactfully.
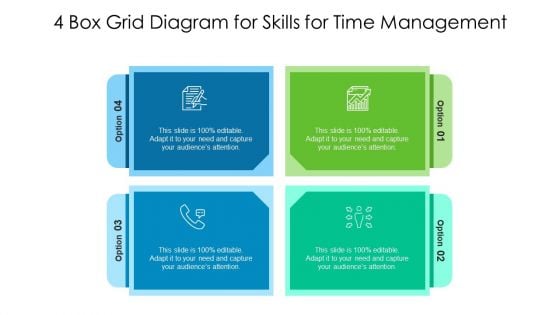
4 Box Grid Diagram For Skills For Time Management Ppt Show Design Inspiration PDF
Presenting 4 box grid diagram for skills for time management ppt show design inspiration pdf to dispense important information. This template comprises four stages. It also presents valuable insights into the topics including 4 box grid diagram for skills for time management. This is a completely customizable PowerPoint theme that can be put to use immediately. So, download it and address the topic impactfully.
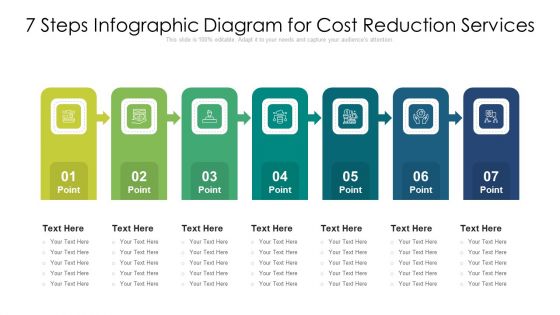
7 Steps Infographic Diagram For Cost Reduction Services Ppt PowerPoint Presentation Pictures Design Ideas PDF
Presenting 7 steps infographic diagram for cost reduction services ppt powerpoint presentation pictures design ideas pdf to dispense important information. This template comprises seven stages. It also presents valuable insights into the topics including 7 steps infographic diagram for cost reduction services. This is a completely customizable PowerPoint theme that can be put to use immediately. So, download it and address the topic impactfully.
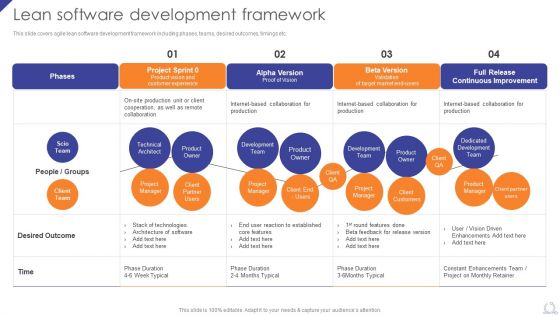
Lean Software Development Framework Agile Project Development Strategies Demonstration PDF
This slide covers agile lean software development framework including phases, teams, desired outcomes, timings etc.Presenting this PowerPoint presentation, titled Lean Software Development Framework Agile Project Development Strategies Demonstration PDF, with topics curated by our researchers after extensive research. This editable presentation is available for immediate download and provides attractive features when used. Download now and captivate your audience. Presenting this Lean Software Development Framework Agile Project Development Strategies Demonstration PDF. Our researchers have carefully researched and created these slides with all aspects taken into consideration. This is a completely customizable Lean Software Development Framework Agile Project Development Strategies Demonstration PDF that is available for immediate downloading. Download now and make an impact on your audience. Highlight the attractive features available with our PPTs.
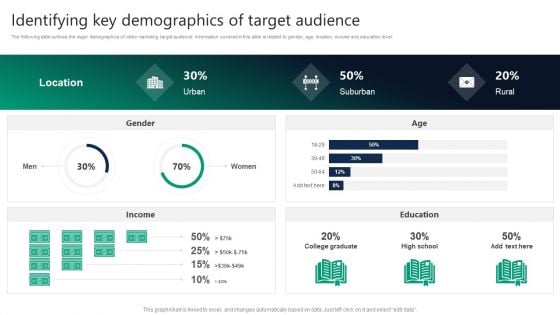
Formulating Video Marketing Strategies To Enhance Sales Identifying Key Demographics Of Target Audience Diagrams PDF
The following slide outlines the major demographics of video marketing target audience. Information covered in this slide is related to gender, age, location, income and education level. Formulating a presentation can take up a lot of effort and time, so the content and message should always be the primary focus. The visuals of the PowerPoint can enhance the presenters message, so our Formulating Video Marketing Strategies To Enhance Sales Identifying Key Demographics Of Target Audience Diagrams PDF was created to help save time. Instead of worrying about the design, the presenter can concentrate on the message while our designers work on creating the ideal templates for whatever situation is needed. Slidegeeks has experts for everything from amazing designs to valuable content, we have put everything into Formulating Video Marketing Strategies To Enhance Sales Identifying Key Demographics Of Target Audience Diagrams PDF.
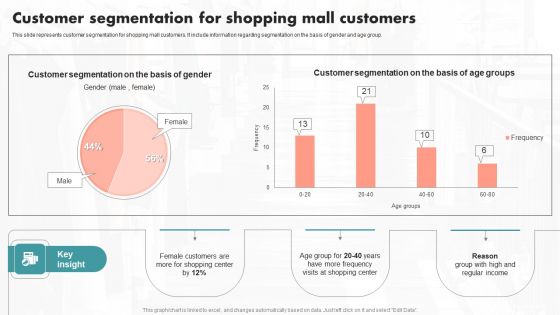
Customer Segmentation For Shopping Mall Customers Ppt PowerPoint Presentation File Diagrams PDF
This slide represents customer segmentation for shopping mall customers. It include information regarding segmentation on the basis of gender and age group. Formulating a presentation can take up a lot of effort and time, so the content and message should always be the primary focus. The visuals of the PowerPoint can enhance the presenters message, so our Customer Segmentation For Shopping Mall Customers Ppt PowerPoint Presentation File Diagrams PDF was created to help save time. Instead of worrying about the design, the presenter can concentrate on the message while our designers work on creating the ideal templates for whatever situation is needed. Slidegeeks has experts for everything from amazing designs to valuable content, we have put everything into Customer Segmentation For Shopping Mall Customers Ppt PowerPoint Presentation File Diagrams PDF
Influencers Marketing Campaign Performance Tracking Dashboard Ppt PowerPoint Presentation Diagram Lists PDF
This slide covers performance monitoring dashboard of influencer based referral marketing program. It includes elements such as impressions on Instagram, likes, comments, clicks, sales generated along with value calculators and campaign breakdown based on gender and age. Formulating a presentation can take up a lot of effort and time, so the content and message should always be the primary focus. The visuals of the PowerPoint can enhance the presenters message, so our Influencers Marketing Campaign Performance Tracking Dashboard Ppt PowerPoint Presentation Diagram Lists PDF was created to help save time. Instead of worrying about the design, the presenter can concentrate on the message while our designers work on creating the ideal templates for whatever situation is needed. Slidegeeks has experts for everything from amazing designs to valuable content, we have put everything into Influencers Marketing Campaign Performance Tracking Dashboard Ppt PowerPoint Presentation Diagram Lists PDF
Reinforcement Learning Techniques And Applications Performance Tracking Dashboard Reinforcement Diagrams PDF
This slide shows the roadmap for the reinforcement learning project, including the list of tasks to be performed from March 2023 to February 2024. The tasks include initializing the values table, observing the current state, choosing an action for that state, and so on. Formulating a presentation can take up a lot of effort and time, so the content and message should always be the primary focus. The visuals of the PowerPoint can enhance the presenters message, so our Reinforcement Learning Techniques And Applications Performance Tracking Dashboard Reinforcement Diagrams PDF was created to help save time. Instead of worrying about the design, the presenter can concentrate on the message while our designers work on creating the ideal templates for whatever situation is needed. Slidegeeks has experts for everything from amazing designs to valuable content, we have put everything into Reinforcement Learning Techniques And Applications Performance Tracking Dashboard Reinforcement Diagrams PDF
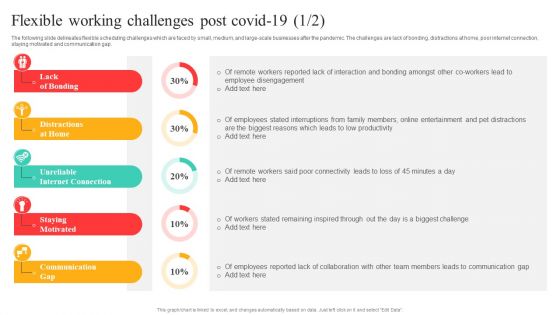
Flexible Working Policies And Guidelines Flexible Working Challenges Post Covid 19 Diagrams PDF
The following slide delineates flexible scheduling challenges which are faced by small, medium, and large-scale businesses after the pandemic. The challenges are lack of bonding, distractions at home, poor internet connection, staying motivated and communication gap. Formulating a presentation can take up a lot of effort and time, so the content and message should always be the primary focus. The visuals of the PowerPoint can enhance the presenters message, so our Flexible Working Policies And Guidelines Flexible Working Challenges Post Covid 19 Diagrams PDF was created to help save time. Instead of worrying about the design, the presenter can concentrate on the message while our designers work on creating the ideal templates for whatever situation is needed. Slidegeeks has experts for everything from amazing designs to valuable content, we have put everything into Flexible Working Policies And Guidelines Flexible Working Challenges Post Covid 19 Diagrams PDF
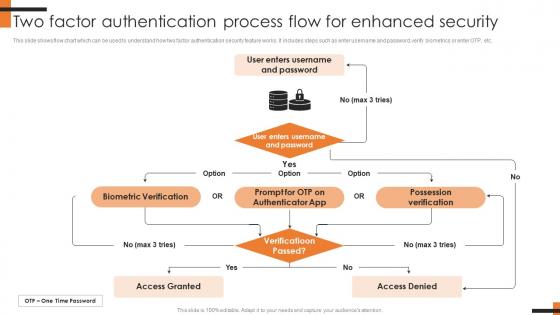
Two Factor Authentication Process Flow For Comprehensive Smartphone Banking Diagrams Pdf
This slide shows flow chart which can be used to understand how two factor authentication security feature works. It includes steps such as enter username and password, verify biometrics or enter OTP, etc. The Two Factor Authentication Process Flow For Comprehensive Smartphone Banking Diagrams Pdf is a compilation of the most recent design trends as a series of slides. It is suitable for any subject or industry presentation, containing attractive visuals and photo spots for businesses to clearly express their messages. This template contains a variety of slides for the user to input data, such as structures to contrast two elements, bullet points, and slides for written information. Slidegeeks is prepared to create an impression. This slide shows flow chart which can be used to understand how two factor authentication security feature works. It includes steps such as enter username and password, verify biometrics or enter OTP, etc.
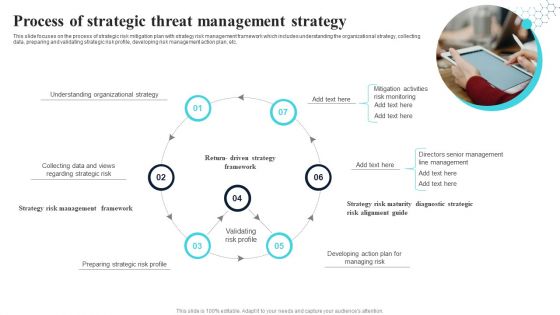
Process Of Strategic Threat Management Strategy Themes PDF
This slide focuses on the process of strategic risk mitigation plan with strategy risk management framework which includes understanding the organizational strategy, collecting data, preparing and validating strategic risk profile, developing risk management action plan, etc. Presenting Process Of Strategic Threat Management Strategy Themes PDF to dispense important information. This template comprises seven stages. It also presents valuable insights into the topics including Risk Alignment Guide, Strategy Risk Management Framework, Strategy Risk Maturity. This is a completely customizable PowerPoint theme that can be put to use immediately. So, download it and address the topic impactfully.
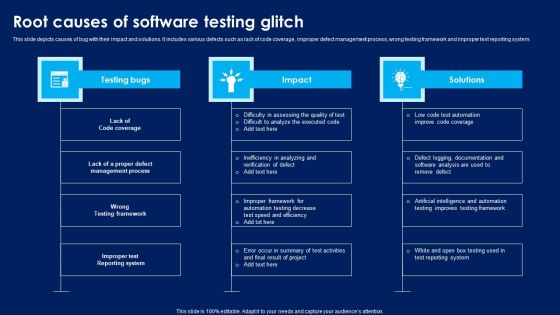
Root Causes Of Software Testing Glitch Themes PDF
This slide depicts causes of bug with their impact and solutions. It includes various defects such as lack of code coverage, improper defect management process, wrong testing framework and improper test reporting system. Presenting Root Causes Of Software Testing Glitch Themes PDF to dispense important information. This template comprises three stages. It also presents valuable insights into the topics including Lack Code Coverage, Defect Management Process, Wrong Testing Framework. This is a completely customizable PowerPoint theme that can be put to use immediately. So, download it and address the topic impactfully.
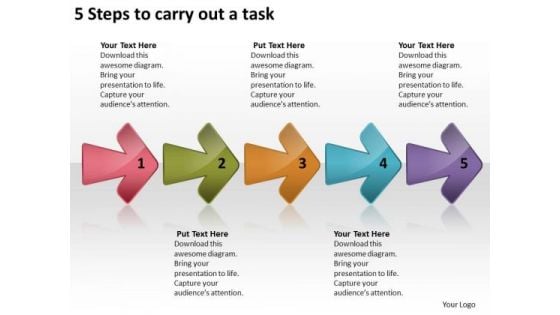
5 Steps To Carry Out Task Flow Charting PowerPoint Templates
We present our 5 steps to carry out task flow charting PowerPoint templates.Download our Arrows PowerPoint Templates because your business and plans for its growth consist of processes that are highly co-related. Download and present our Symbol PowerPoint Templates because they are Gauranteed to focus the minds of your team. Present our Leadership PowerPoint Templates because this slide imprint them on the minds of your audience via our slides. Download and present our Process and Flows PowerPoint Templates because it demonstrates the seeds of many of our successes. Download and present our Business PowerPoint Templates because your fledgling career is in the chrysallis stage. Nurture it and watch it grow into a beautiful butterfly.Use these PowerPoint slides for presentations relating to Abstract, Arrow, Arrows, Business, Chart, Design, Development, Diagram, Direction, Element, Flow, Flowchart, Graph, Linear, Management, Model, Motion, Organization, Plan, Process, Program, Section, Segment, Set, Sign, Solution, Strategy, Symbol, Technology. The prominent colors used in the PowerPoint template are Red, Green, Yellow. Customers tell us our 5 steps to carry out task flow charting PowerPoint templates are Spiffy. The feedback we get is that our Business PowerPoint templates and PPT Slides will help them to explain complicated concepts. Professionals tell us our 5 steps to carry out task flow charting PowerPoint templates are Fabulous. People tell us our Design PowerPoint templates and PPT Slides are Luxurious. Customers tell us our 5 steps to carry out task flow charting PowerPoint templates are visually appealing. Professionals tell us our Development PowerPoint templates and PPT Slides are Stunning. Our 5 Steps To Carry Out Task Flow Charting PowerPoint Templates bring you closer to your dream. They give you an avenue to achieve them.
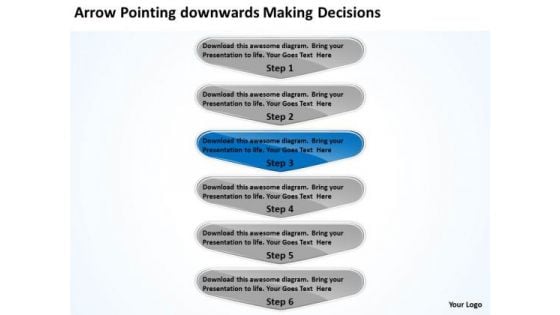
Arrow Pointing Downwards Making Decisions PowerPoint Flow Charts Slides
We present our arrow pointing downwards making decisions PowerPoint flow charts Slides.Present our Leadership PowerPoint Templates because with the help of our Slides you can Illustrate these thoughts with this slide. Download and present our Marketing PowerPoint Templates because The marketplace is the merger of your dreams and your ability. Present our Business PowerPoint Templates because profit levels have been steady over the recent past. Spread your heightened excitement to others in the room. Download our Shapes PowerPoint Templates because educate your staff on the means to provide the required support for speedy recovery. Download and present our Arrows PowerPoint Templates because this template will explain the value of its wellness to human life.Use these PowerPoint slides for presentations relating to Abstract, Arrow, Arrows, Business, Chart, Design, Development, Diagram, Direction, Element, Flow, Flowchart, Graph, Linear, Management, Model, Motion, Organization, Plan, Process, Program, Section, Segment, Set, Sign, Solution, Strategy, Symbol, Technology. The prominent colors used in the PowerPoint template are Blue, Gray, White. Customers tell us our arrow pointing downwards making decisions PowerPoint flow charts Slides are Fancy. You can be sure our Direction PowerPoint templates and PPT Slides will help you be quick off the draw. Just enter your specific text and see your points hit home. Presenters tell us our arrow pointing downwards making decisions PowerPoint flow charts Slides are Second to none. Professionals tell us our Design PowerPoint templates and PPT Slides are Ritzy. Presenters tell us our arrow pointing downwards making decisions PowerPoint flow charts Slides are Flirty. Professionals tell us our Development PowerPoint templates and PPT Slides are Delightful. Make a great career call with our Arrow Pointing Downwards Making Decisions PowerPoint Flow Charts Slides. Put your ideas across emphatically.
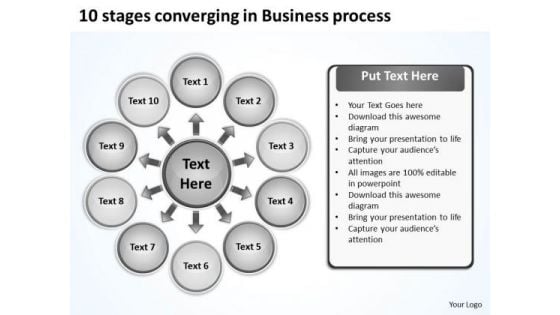
In World Business PowerPoint Templates Process Cycle Chart Slides
We present our in world business powerpoint templates process Cycle Chart Slides.Download and present our Arrows PowerPoint Templates because with the help of our Slides you can Illustrate your ideas one by one and demonstrate how each is an important cog in running the entire wheel. Use our Business PowerPoint Templates because you can Lead your flock steadily to greater heights. Look around at the vast potential of achievement around you. Download and present our Signs PowerPoint Templates because this is An innovative slide design depicting driving home the relevance of a steady rhythm. Download our Shapes PowerPoint Templates because your marketing strategies can funnel down to the cone, stage by stage, refining as you go along. Use our Spheres PowerPoint Templates because your business and plans for its growth consist of processes that are highly co-related.Use these PowerPoint slides for presentations relating to Arrows, Business, Chart, Circular, Commerce, Concept, Contribution, Cycle, Development, Diagram, Global, Idea, Informative, Internet, Join, Making, Manage, Management, Market, Marketing, Partner, Paying, Performance, Plans, Process, Productive, Productivity, Profit, Profitable, Project. The prominent colors used in the PowerPoint template are White, Black, Gray. Professionals tell us our in world business powerpoint templates process Cycle Chart Slides are Elevated. You can be sure our Cycle PowerPoint templates and PPT Slides are Perfect. Customers tell us our in world business powerpoint templates process Cycle Chart Slides are the best it can get when it comes to presenting. Professionals tell us our Cycle PowerPoint templates and PPT Slides are Magnificent. People tell us our in world business powerpoint templates process Cycle Chart Slides are One-of-a-kind. People tell us our Contribution PowerPoint templates and PPT Slides are topically designed to provide an attractive backdrop to any subject. Taste success with our In World Business PowerPoint Templates Process Cycle Chart Slides. You will come out on top.
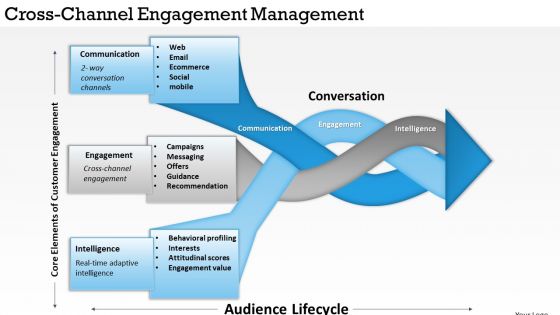
Business Framework Cross Channel Engagement Management PowerPoint Presentation 2
This innovative image slide has been designed to display cross channel customer engagement diagram. This business framework template may be used in your presentations to depict business marketing plan. This image slide will help you make professional presentations.
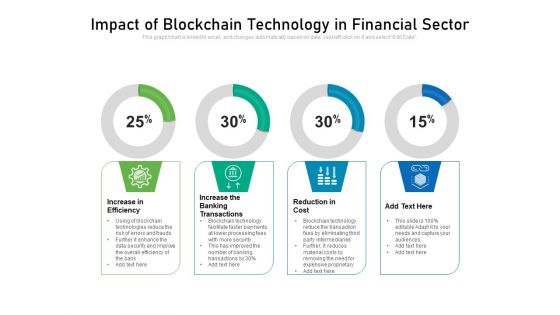
Impact Of Blockchain Technology In Financial Sector Ppt PowerPoint Presentation Diagram Templates PDF
Showcasing this set of slides titled impact of blockchain technology in financial sector ppt powerpoint presentation diagram templates pdf. The topics addressed in these templates are increase in efficiency, reduction in cost, increase the banking transactions. All the content presented in this PPT design is completely editable. Download it and make adjustments in color, background, font etc. as per your unique business setting.
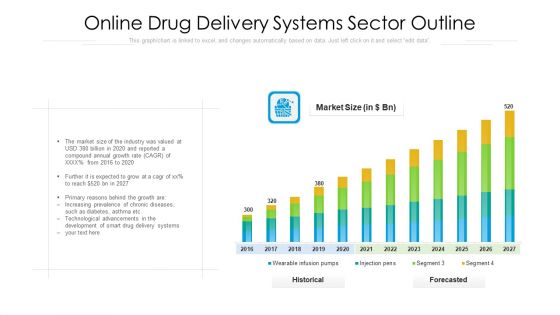
Online Drug Delivery Systems Sector Outline Ppt Infographic Template Diagrams PDF
Showcasing this set of slides titled online drug delivery systems sector outline ppt infographic template diagrams pdf. The topics addressed in these templates are online drug delivery systems sector outline. All the content presented in this PPT design is completely editable. Download it and make adjustments in color, background, font etc. as per your unique business setting.
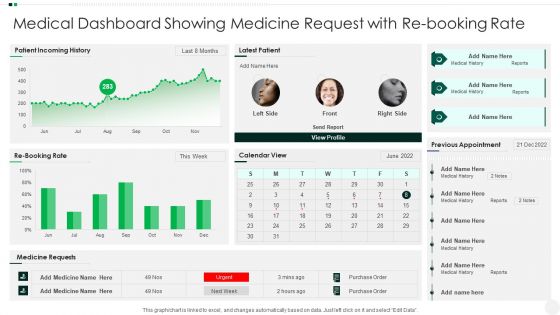
Medical Dashboard Showing Medicine Request With Re Booking Rate Diagrams PDF
Pitch your topic with ease and precision using this Medical Dashboard Showing Medicine Request With Re Booking Rate Diagrams PDF. This layout presents information on Medical Dashboard Showing Medicine Request With Re Booking Rate. It is also available for immediate download and adjustment. So, changes can be made in the color, design, graphics or any other component to create a unique layout.
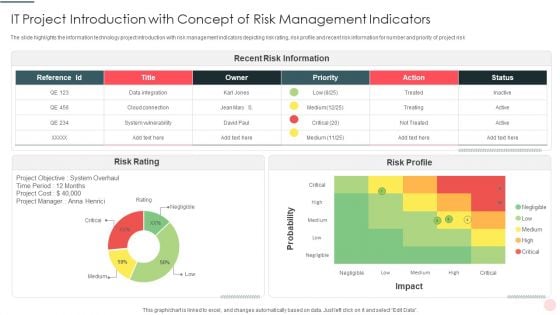
IT Project Introduction With Concept Of Risk Management Indicators Diagrams PDF
Pitch your topic with ease and precision using this IT Project Introduction With Concept Of Risk Management Indicators Diagrams PDF This layout presents information on System Vulnerability, Recent Risk Information, Probability It is also available for immediate download and adjustment. So, changes can be made in the color, design, graphics or any other component to create a unique layout.
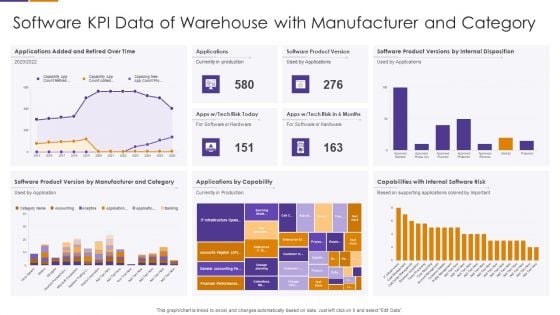
Software KPI Data Of Warehouse With Manufacturer And Category Diagrams PDF
Showcasing this set of slides titled Software KPI Data Of Warehouse With Manufacturer And Category Diagrams PDF The topics addressed in these templates are Software Product Versions, Capabilities With Internal, Applications By Capability All the content presented in this PPT design is completely editable. Download it and make adjustments in color, background, font etc. as per your unique business setting.
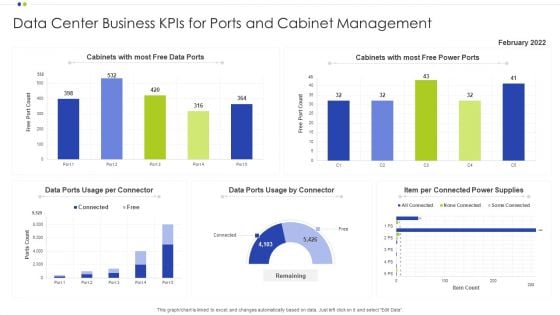
Data Center Business Kpis For Ports And Cabinet Management Ppt Diagram Ppt PDF
Showcasing this set of slides titled Data Center Business Kpis For Ports And Cabinet Management Ppt Diagram Ppt PDF. The topics addressed in these templates are Cabinet Management, Data Center Business, Power Supplies. All the content presented in this PPT design is completely editable. Download it and make adjustments in color, background, font etc. as per your unique business setting.
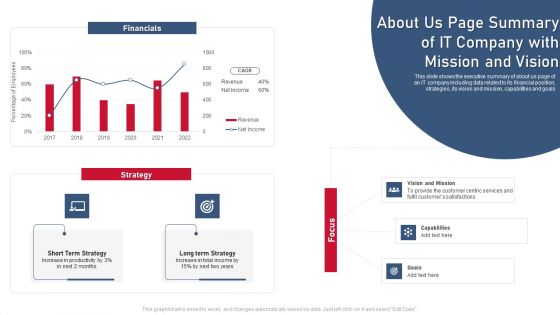
About Us Page Summary Of IT Company With Mission And Vision Diagrams PDF
Showcasing this set of slides titled About Us Page Summary Of IT Company With Mission And Vision Diagrams PDF. The topics addressed in these templates are Increase Productivity, Capabilities, Provide Customer. All the content presented in this PPT design is completely editable. Download it and make adjustments in color, background, font etc. as per your unique business setting.
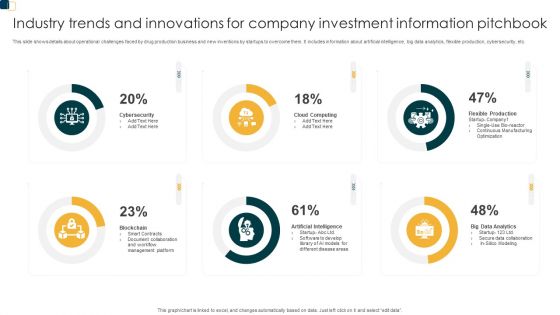
Industry Trends And Innovations For Company Investment Information Pitchbook Diagrams PDF
Pitch your topic with ease and precision using this Industry Trends And Innovations For Company Investment Information Pitchbook Diagrams PDF. This layout presents information on Innovations, Company Investment. It is also available for immediate download and adjustment. So, changes can be made in the color, design, graphics or any other component to create a unique layout.
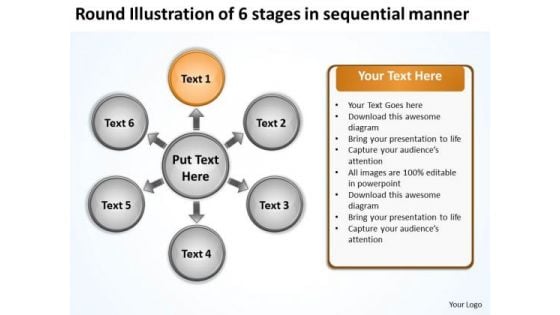
Round Illustration Of 6 Stages In Sequential Manner Business Cycle Arrow Process PowerPoint Slides
We present our round illustration of 6 stages in sequential manner business Cycle Arrow Process PowerPoint Slides.Use our Business PowerPoint Templates because the great Bald headed Eagle embodies your personality. the eagle eye to seize upon the smallest of opportunities. Present our Shapes PowerPoint Templates because you can Master them all and you have it made. Present our Ring Charts PowerPoint Templates because stable ideas are the building blocks of a sucessful structure. Download and present our Process and Flows PowerPoint Templates because you have an idea of which you are sure. Download our Success PowerPoint Templates because your quest has taken you well onto the path of success.Use these PowerPoint slides for presentations relating to Arrow, Business, Change, Concept, Development, Diagram, Different, Flow Chart, Idea, Innovate, Innovation, Invention, Marketing, Process, Slide, Success, Template. The prominent colors used in the PowerPoint template are Orange, Gray, White. Professionals tell us our round illustration of 6 stages in sequential manner business Cycle Arrow Process PowerPoint Slides are readymade to fit into any presentation structure. Customers tell us our Diagram PowerPoint templates and PPT Slides are Wistful. Use our round illustration of 6 stages in sequential manner business Cycle Arrow Process PowerPoint Slides are Gorgeous. The feedback we get is that our Different PowerPoint templates and PPT Slides are Exuberant. Professionals tell us our round illustration of 6 stages in sequential manner business Cycle Arrow Process PowerPoint Slides are Festive. Presenters tell us our Change PowerPoint templates and PPT Slides are Amazing. Launch your crusade with our Round Illustration Of 6 Stages In Sequential Manner Business Cycle Arrow Process PowerPoint Slides. They will assist in creating belief.
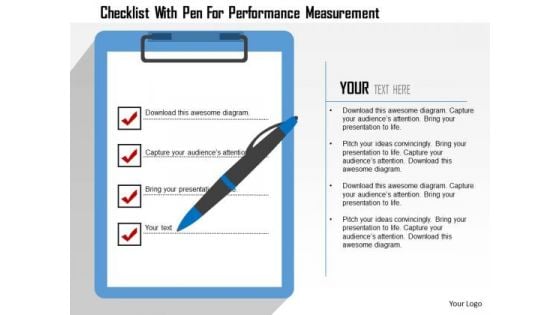
Business Diagram Checklist With Pen For Performance Measurement Presentation Template
Our above business slide has been designed with graphics of checklist with pen. You may use this slide to display performance management. Download this diagram slide to make professional presentations.
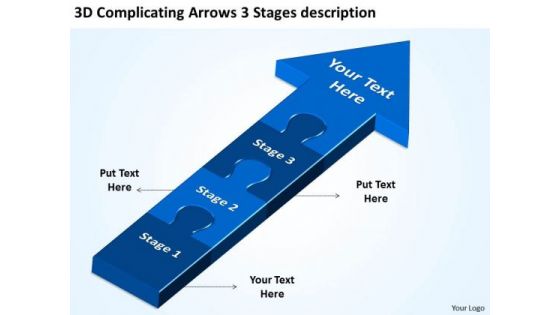
3d Complicating Arrows Stages Description Slides Flow Charts PowerPoint Templates
We present our 3d complicating arrows stages description Slides flow charts PowerPoint templates.Use our Arrows PowerPoint Templates because you can Adorn them with your ideas and thoughts. Use our Puzzles or Jigsaws PowerPoint Templates because generation of sales is the core of any business. Download and present our Signs PowerPoint Templates because clarity of thought has been the key to your growth. Present our Leadership PowerPoint Templates because using our templates for your colleagues will impart knowledge to feed. Download our Process and Flows PowerPoint Templates because if making a mark is your obsession, then let others get Obsessed with you.Use these PowerPoint slides for presentations relating to 3d Puzzle process, Arrow, Arrows Block, Business, Chart, Design, Development, Diagram, Direction, Element, Flow, Flowchart, Graph, Linear, Management, Organization, Process, Program, Section, Sign, Solution, Symbol. The prominent colors used in the PowerPoint template are Blue, Blue navy, Black. Customers tell us our 3d complicating arrows stages description Slides flow charts PowerPoint templates are Endearing. The feedback we get is that our Chart PowerPoint templates and PPT Slides are Radiant. Professionals tell us our 3d complicating arrows stages description Slides flow charts PowerPoint templates are Enchanting. People tell us our Arrows PowerPoint templates and PPT Slides are Upbeat. Customers tell us our 3d complicating arrows stages description Slides flow charts PowerPoint templates provide you with a vast range of viable options. Select the appropriate ones and just fill in your text. Professionals tell us our Chart PowerPoint templates and PPT Slides are Awesome. Step on it with our 3d Complicating Arrows Stages Description Slides Flow Charts PowerPoint Templates. Escalate the process with our 3d Complicating Arrows Stages Description Slides Flow Charts PowerPoint Templates.

International Business Extension Expectations After Expanding Into Global Markets Diagrams PDF
This slide showcase graph that can help organization to estimate the impact on organizational sales after global expansion. It showcases sales in thousand dollars and forecast for a period of two years. If you are looking for a format to display your unique thoughts, then the professionally designed International Business Extension Expectations After Expanding Into Global Markets Diagrams PDF is the one for you. You can use it as a Google Slides template or a PowerPoint template. Incorporate impressive visuals, symbols, images, and other charts. Modify or reorganize the text boxes as you desire. Experiment with shade schemes and font pairings. Alter, share or cooperate with other people on your work. Download International Business Extension Expectations After Expanding Into Global Markets Diagrams PDF and find out how to give a successful presentation. Present a perfect display to your team and make your presentation unforgettable.
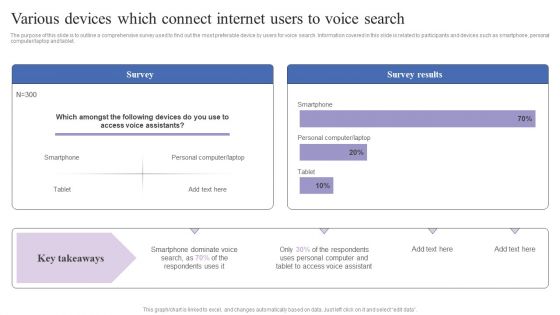
Various Devices Which Connect Internet Users To Voice Search Diagrams PDF
The purpose of this slide is to outline a comprehensive survey used to find out the most preferable device by users for voice search. Information covered in this slide is related to participants and devices such as smartphone, personal computer laptop and tablet. If you are looking for a format to display your unique thoughts, then the professionally designed Various Devices Which Connect Internet Users To Voice Search Diagrams PDF is the one for you. You can use it as a Google Slides template or a PowerPoint template. Incorporate impressive visuals, symbols, images, and other charts. Modify or reorganize the text boxes as you desire. Experiment with shade schemes and font pairings. Alter, share or cooperate with other people on your work. Download Various Devices Which Connect Internet Users To Voice Search Diagrams PDF and find out how to give a successful presentation. Present a perfect display to your team and make your presentation unforgettable.
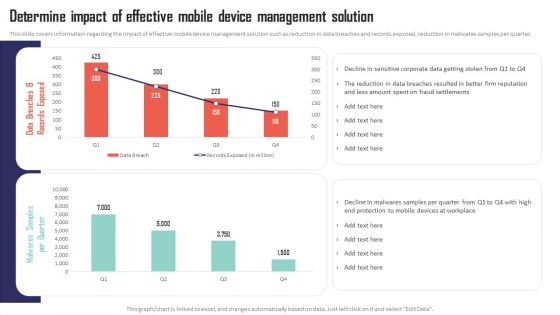
Mobile Device Management Determine Impact Of Effective Mobile Device Management Diagrams PDF
This slide covers information regarding the impact of effective mobile device management solution such as reduction in data breaches and records exposed, reduction in malwares samples per quarter. If you are looking for a format to display your unique thoughts, then the professionally designed Mobile Device Management Determine Impact Of Effective Mobile Device Management Diagrams PDF is the one for you. You can use it as a Google Slides template or a PowerPoint template. Incorporate impressive visuals, symbols, images, and other charts. Modify or reorganize the text boxes as you desire. Experiment with shade schemes and font pairings. Alter, share or cooperate with other people on your work. Download Mobile Device Management Determine Impact Of Effective Mobile Device Management Diagrams PDF and find out how to give a successful presentation. Present a perfect display to your team and make your presentation unforgettable.
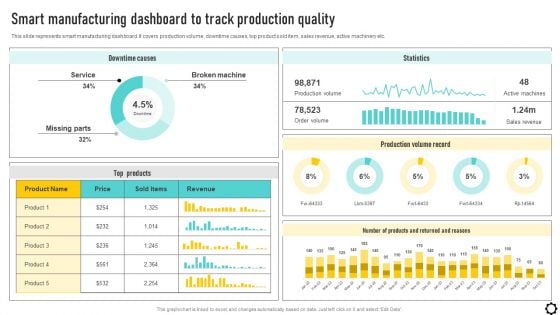
Optimizing Production Process Smart Manufacturing Dashboard To Track Production Diagrams PDF
This slide represents smart manufacturing dashboard. It covers production volume, downtime causes, top product sold item, sales revenue, active machinery etc. If you are looking for a format to display your unique thoughts, then the professionally designed Optimizing Production Process Smart Manufacturing Dashboard To Track Production Diagrams PDF is the one for you. You can use it as a Google Slides template or a PowerPoint template. Incorporate impressive visuals, symbols, images, and other charts. Modify or reorganize the text boxes as you desire. Experiment with shade schemes and font pairings. Alter, share or cooperate with other people on your work. Download Optimizing Production Process Smart Manufacturing Dashboard To Track Production Diagrams PDF and find out how to give a successful presentation. Present a perfect display to your team and make your presentation unforgettable.
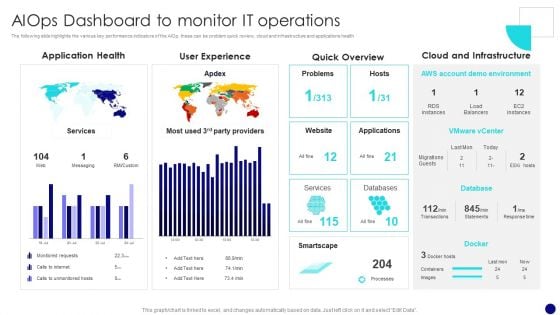
Information Technology Operations Administration With ML Aiops Dashboard To Monitor Diagrams PDF
The following slide highlights the various key performance indicators of the AIOp, these can be problem quick review, cloud and infrastructure and applications health. If you are looking for a format to display your unique thoughts, then the professionally designed Information Technology Operations Administration With ML Aiops Dashboard To Monitor Diagrams PDF is the one for you. You can use it as a Google Slides template or a PowerPoint template. Incorporate impressive visuals, symbols, images, and other charts. Modify or reorganize the text boxes as you desire. Experiment with shade schemes and font pairings. Alter, share or cooperate with other people on your work. Download Information Technology Operations Administration With ML Aiops Dashboard To Monitor Diagrams PDF and find out how to give a successful presentation. Present a perfect display to your team and make your presentation unforgettable.

Operational Strategy For ML In IT Sector Aiops Dashboard To Monitor IT Operations Diagrams PDF
The following slide highlights the various key performance indicators of the AIOps, these can be problem quick review, cloud and infrastructure and applications health If you are looking for a format to display your unique thoughts, then the professionally designed Operational Strategy For ML In IT Sector Aiops Dashboard To Monitor IT Operations Diagrams PDF is the one for you. You can use it as a Google Slides template or a PowerPoint template. Incorporate impressive visuals, symbols, images, and other charts. Modify or reorganize the text boxes as you desire. Experiment with shade schemes and font pairings. Alter, share or cooperate with other people on your work. Download Operational Strategy For ML In IT Sector Aiops Dashboard To Monitor IT Operations Diagrams PDF and find out how to give a successful presentation. Present a perfect display to your team and make your presentation unforgettable.
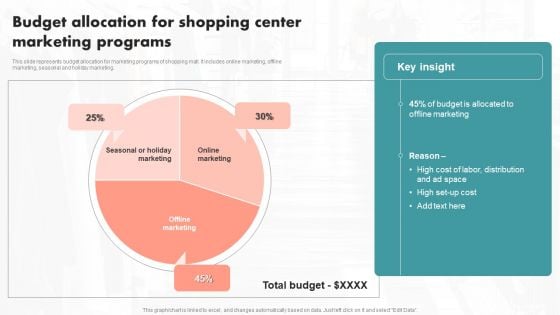
Budget Allocation For Shopping Center Marketing Programs Ppt PowerPoint Presentation File Diagrams PDF
This slide represents budget allocation for marketing programs of shopping mall. It includes online marketing, offline marketing, seasonal and holiday marketing. If you are looking for a format to display your unique thoughts, then the professionally designed Budget Allocation For Shopping Center Marketing Programs Ppt PowerPoint Presentation File Diagrams PDF is the one for you. You can use it as a Google Slides template or a PowerPoint template. Incorporate impressive visuals, symbols, images, and other charts. Modify or reorganize the text boxes as you desire. Experiment with shade schemes and font pairings. Alter, share or cooperate with other people on your work. Download Budget Allocation For Shopping Center Marketing Programs Ppt PowerPoint Presentation File Diagrams PDF and find out how to give a successful presentation. Present a perfect display to your team and make your presentation unforgettable.

Mitigating Sales Risks With Strategic Action Planning Assessing Impact Of Sales Risk Management Diagrams PDF
The following slide highlights some key performance indicators KPIs to measure the influence of executing sales risk management strategies on revenue performance. It includes elements such as target attainment rate, gross profit, annual growth rate etc. If you are looking for a format to display your unique thoughts, then the professionally designed Mitigating Sales Risks With Strategic Action Planning Assessing Impact Of Sales Risk Management Diagrams PDF is the one for you. You can use it as a Google Slides template or a PowerPoint template. Incorporate impressive visuals, symbols, images, and other charts. Modify or reorganize the text boxes as you desire. Experiment with shade schemes and font pairings. Alter, share or cooperate with other people on your work. Download Mitigating Sales Risks With Strategic Action Planning Assessing Impact Of Sales Risk Management Diagrams PDF and find out how to give a successful presentation. Present a perfect display to your team and make your presentation unforgettable.
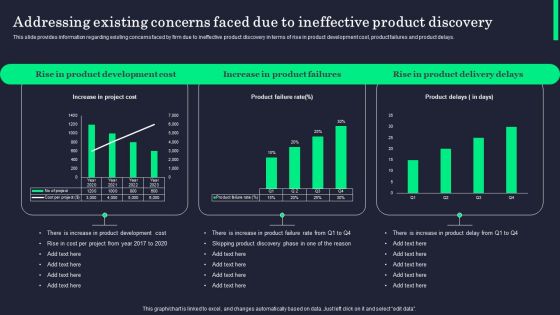
Addressing Existing Concerns Faced Due To Ineffective Product Discovery Diagrams PDF
This slide provides information regarding existing concerns faced by firm due to ineffective product discovery in terms of rise in product development cost, product failures and product delays. If you are looking for a format to display your unique thoughts, then the professionally designed Addressing Existing Concerns Faced Due To Ineffective Product Discovery Diagrams PDF is the one for you. You can use it as a Google Slides template or a PowerPoint template. Incorporate impressive visuals, symbols, images, and other charts. Modify or reorganize the text boxes as you desire. Experiment with shade schemes and font pairings. Alter, share or cooperate with other people on your work. Download Addressing Existing Concerns Faced Due To Ineffective Product Discovery Diagrams PDF and find out how to give a successful presentation. Present a perfect display to your team and make your presentation unforgettable.
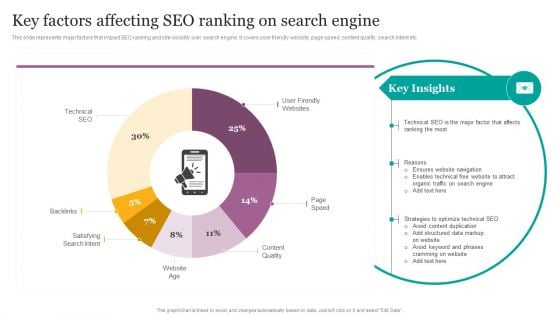
Key Factors Affecting SEO Ranking On Search Engine Ppt Infographics Diagrams PDF
This slide represents major factors that impact SEO ranking and site visibility over search engine. It covers user friendly website, page speed, content quality, search intent etc. If you are looking for a format to display your unique thoughts, then the professionally designed Key Factors Affecting SEO Ranking On Search Engine Ppt Infographics Diagrams PDF is the one for you. You can use it as a Google Slides template or a PowerPoint template. Incorporate impressive visuals, symbols, images, and other charts. Modify or reorganize the text boxes as you desire. Experiment with shade schemes and font pairings. Alter, share or cooperate with other people on your work. Download Key Factors Affecting SEO Ranking On Search Engine Ppt Infographics Diagrams PDF and find out how to give a successful presentation. Present a perfect display to your team and make your presentation unforgettable.
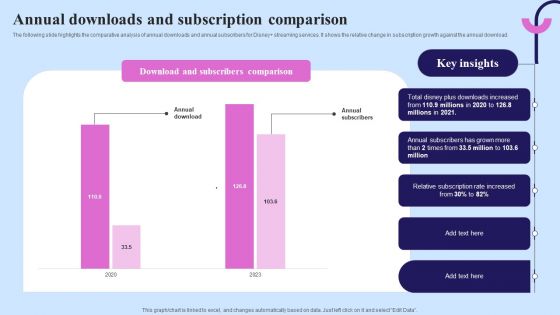
Video Streaming Technology Company Introduction Annual Downloads And Subscription Diagrams PDF
The following slide highlights the comparative analysis of annual downloads and annual subscribers for Disney plus streaming services. It shows the relative change in subscription growth against the annual download. If you are looking for a format to display your unique thoughts, then the professionally designed Video Streaming Technology Company Introduction Annual Downloads And Subscription Diagrams PDF is the one for you. You can use it as a Google Slides template or a PowerPoint template. Incorporate impressive visuals, symbols, images, and other charts. Modify or reorganize the text boxes as you desire. Experiment with shade schemes and font pairings. Alter, share or cooperate with other people on your work. Download Video Streaming Technology Company Introduction Annual Downloads And Subscription Diagrams PDF and find out how to give a successful presentation. Present a perfect display to your team and make your presentation unforgettable.
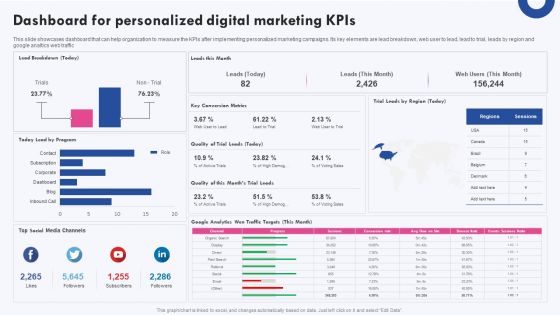
Targeted Marketing Campaigns To Improve Buyers Experience Dashboard For Personalized Digital Marketing Kpis Diagrams PDF
This slide showcases dashboard that can help organization to measure the KPIs after implementing personalized marketing campaigns. Its key elements are lead breakdown, web user to lead, lead to trial, leads by region and google analtics web traffic If you are looking for a format to display your unique thoughts, then the professionally designed Targeted Marketing Campaigns To Improve Buyers Experience Dashboard For Personalized Digital Marketing Kpis Diagrams PDF is the one for you. You can use it as a Google Slides template or a PowerPoint template. Incorporate impressive visuals, symbols, images, and other charts. Modify or reorganize the text boxes as you desire. Experiment with shade schemes and font pairings. Alter, share or cooperate with other people on your work. Download Targeted Marketing Campaigns To Improve Buyers Experience Dashboard For Personalized Digital Marketing Kpis Diagrams PDF and find out how to give a successful presentation. Present a perfect display to your team and make your presentation unforgettable.
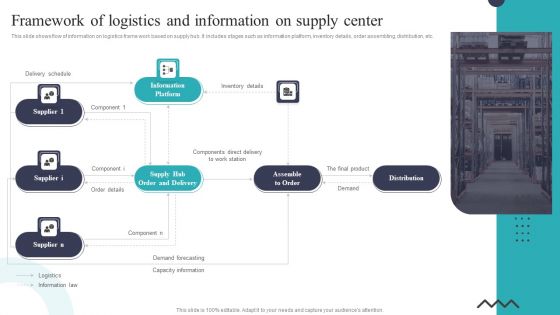
Framework Of Logistics And Information On Supply Center Ppt Summary Examples PDF
This slide shows flow of information on logistics frame work based on supply hub. It includes stages such as information platform, inventory details, order assembling, distribution, etc. Presenting Framework Of Logistics And Information On Supply Center Ppt Summary Examples PDF to dispense important information. This template comprises five stages. It also presents valuable insights into the topics including Delivery Schedule, Information Platform, Distribution, Demand Forecasting. This is a completely customizable PowerPoint theme that can be put to use immediately. So, download it and address the topic impactfully.
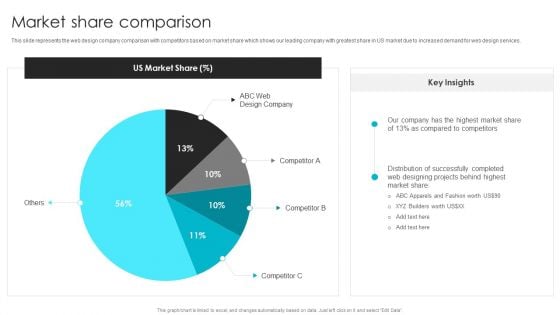
Web Design Company Overview Market Share Comparison Template PDF
This slide represents the web design company comparison with competitors based on market share which shows our leading company with greatest share in US market due to increased demand for web design services. Do you know about Slidesgeeks Web Design Company Overview Market Share Comparison Template PDF These are perfect for delivering any kind od presentation. Using it, create PowerPoint presentations that communicate your ideas and engage audiences. Save time and effort by using our pre designed presentation templates that are perfect for a wide range of topic. Our vast selection of designs covers a range of styles, from creative to business, and are all highly customizable and easy to edit. Download as a PowerPoint template or use them as Google Slides themes.


 Continue with Email

 Home
Home


