Construction Icons
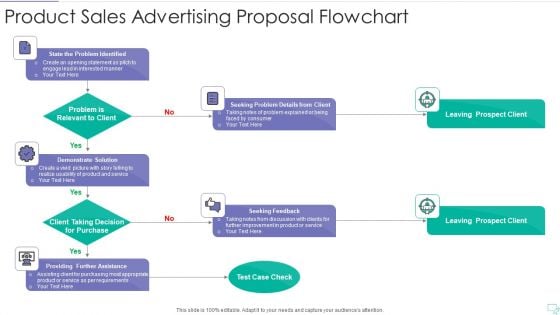
Product Sales Advertising Proposal Flowchart Designs PDF
Presenting product sales advertising proposal flowchart designs pdf to dispense important information. This template comprises three stages. It also presents valuable insights into the topics including demonstrate solution, providing further assistance, seeking feedback, leaving prospect client. This is a completely customizable PowerPoint theme that can be put to use immediately. So, download it and address the topic impactfully.
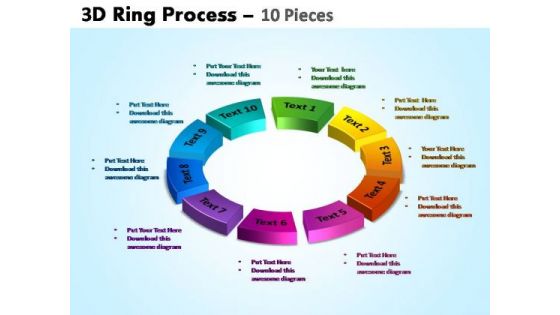
PowerPoint Layout Circular Chart Ring Process Ppt Slide
PowerPoint Layout Circular Chart Ring Process PPT Slide-These amazing PowerPoint pre-designed slides and PowerPoint templates have been carefully created by our team of experts to help you impress your audience. Our stunning collection of Powerpoint slides are 100% editable and can easily fit in any PowerPoint presentations. By using these animations and graphics in PowerPoint and you can easily make professional presentations. Any text can be entered at any point in the PowerPoint template or slide. Just DOWNLOAD our awesome PowerPoint templates and you are ready to go. Experience craftsmanship with our PowerPoint Layout Circular Chart Ring Process Ppt Slide. They are designed by excellent artisans.
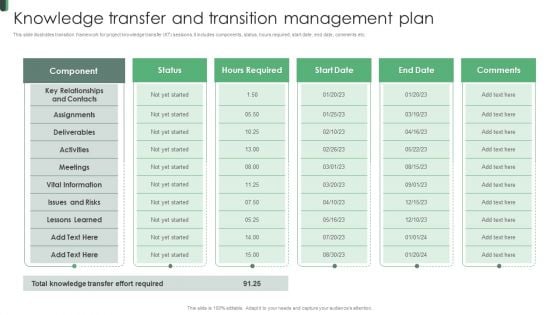
Knowledge Transfer And Transition Management Plan Themes PDF
This slide illustrates transition framework for project knowledge transfer KT sessions. It includes components, status, hours required, start date, end date, comments etc. Pitch your topic with ease and precision using this Knowledge Transfer And Transition Management Plan Themes PDF. This layout presents information on Component, Hours Required, Vital Information. It is also available for immediate download and adjustment. So, changes can be made in the color, design, graphics or any other component to create a unique layout.
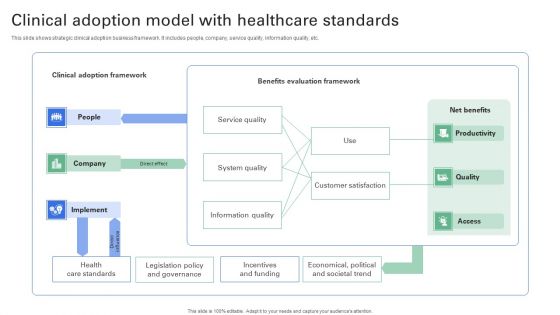
Clinical Adoption Model With Healthcare Standards Themes PDF
This slide shows strategic clinical adoption business framework. It includes people, company, service quality, information quality, etc. Showcasing this set of slides titled Clinical Adoption Model With Healthcare Standards Themes PDF. The topics addressed in these templates are Productivity, Quality, Access. All the content presented in this PPT design is completely editable. Download it and make adjustments in color, background, font etc. as per your unique business setting.
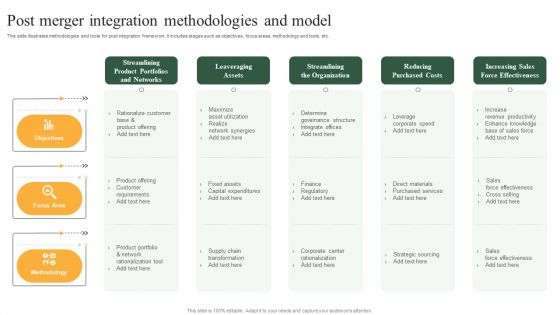
Post Merger Integration Methodologies And Model Themes PDF
This slide illustrates methodologies and tools for post integration framework. It includes stages such as objectives, focus areas, methodology and tools, etc. Showcasing this set of slides titled Post Merger Integration Methodologies And Model Themes PDF. The topics addressed in these templates are Objectives, Focus Area, Methodology, Streamlining The Organization. All the content presented in this PPT design is completely editable. Download it and make adjustments in color, background, font etc. as per your unique business setting.
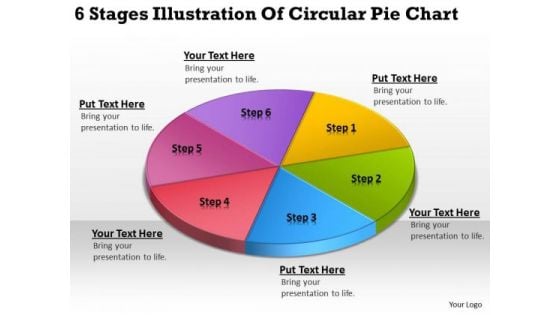
6 Stages Illustration Of Circular Pie Chart Simple Business Plan PowerPoint Slides
We present our 6 stages illustration of circular pie chart simple business plan PowerPoint Slides.Present our Circle Charts PowerPoint Templates because You have gained great respect for your brilliant ideas. Use our PowerPoint Templates and Slides to strengthen and enhance your reputation. Download our Business PowerPoint Templates because Our PowerPoint Templates and Slides are created by a hardworking bunch of busybees. Always flitting around with solutions gauranteed to please. Download and present our Shapes PowerPoint Templates because These PowerPoint Templates and Slides will give the updraft to your ideas. See them soar to great heights with ease. Use our Signs PowerPoint Templates because Our PowerPoint Templates and Slides are truly out of this world. Even the MIB duo has been keeping tabs on our team. Download and present our Metaphors-Visual Concepts PowerPoint Templates because Our PowerPoint Templates and Slides are a sure bet. Gauranteed to win against all odds. Use these PowerPoint slides for presentations relating to business, chart, circle, circular, diagram, economy, finance, framework, graph, isolated, percentage, pie chart, results, scheme, statistics, stats, strategy, success. The prominent colors used in the PowerPoint template are Purple, Yellow, Green. Resolve the feud with our 6 Stages Illustration Of Circular Pie Chart Simple Business Plan PowerPoint Slides. Take all different approaches into consideration.
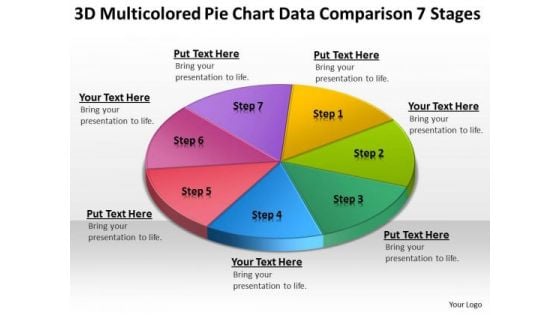
Chart Data Comparison 7 Stages Examples Of Business Plans For PowerPoint Slides
We present our chart data comparison 7 stages examples of business plans for PowerPoint Slides.Download and present our Circle Charts PowerPoint Templates because You are well armed with penetrative ideas. Our PowerPoint Templates and Slides will provide the gunpowder you need. Use our Business PowerPoint Templates because It can be used to Set your controls for the heart of the sun. Our PowerPoint Templates and Slides will be the propellant to get you there. Present our Shapes PowerPoint Templates because You will get more than you ever bargained for. Download and present our Signs PowerPoint Templates because Our PowerPoint Templates and Slides are truly out of this world. Even the MIB duo has been keeping tabs on our team. Present our Metaphors-Visual Concepts PowerPoint Templates because Our PowerPoint Templates and Slides will bullet point your ideas. See them fall into place one by one.Use these PowerPoint slides for presentations relating to business, chart, circle, circular, diagram, economy, finance, framework, graph, isolated, percentage, pie chart, results, scheme, statistics, stats, strategy, success. The prominent colors used in the PowerPoint template are Red, Pink, Green. Become a genius with our Chart Data Comparison 7 Stages Examples Of Business Plans For PowerPoint Slides. You will come out on top.
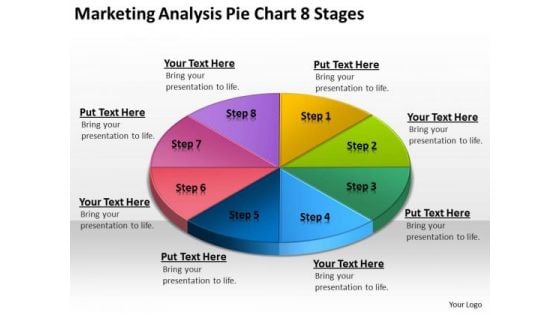
Marketing Analysis Pie Chart 8 Stages Business Plan Basics PowerPoint Templates
We present our marketing analysis pie chart 8 stages business plan basics PowerPoint templates.Download and present our Circle Charts PowerPoint Templates because Our PowerPoint Templates and Slides will Activate the energies of your audience. Get their creative juices flowing with your words. Present our Business PowerPoint Templates because Our PowerPoint Templates and Slides will let you meet your Deadlines. Use our Shapes PowerPoint Templates because Our PowerPoint Templates and Slides will effectively help you save your valuable time. They are readymade to fit into any presentation structure. Present our Signs PowerPoint Templates because You can Connect the dots. Fan expectations as the whole picture emerges. Use our Metaphors-Visual Concepts PowerPoint Templates because Our PowerPoint Templates and Slides will let your words and thoughts hit bullseye everytime.Use these PowerPoint slides for presentations relating to business, chart, circle, circular, diagram, economy, finance, framework, graph, isolated, percentage, pie chart, results, scheme, statistics, stats, strategy, success. The prominent colors used in the PowerPoint template are Yellow, Green, Blue. Examine the facts in all their combinations. Run the comb through with our Marketing Analysis Pie Chart 8 Stages Business Plan Basics PowerPoint Templates.
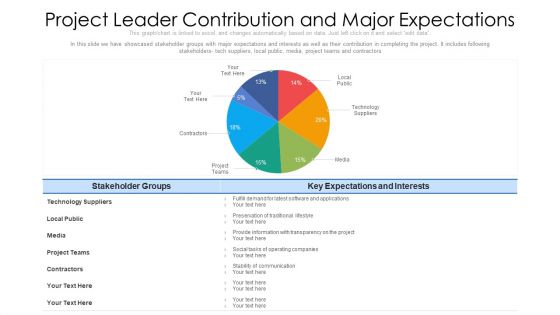
Project Leader Contribution And Major Expectations Ppt PowerPoint Presentation File Diagrams PDF
In this slide we have showcased stakeholder groups with major expectations and interests as well as their contribution in completing the project. It includes following stakeholders- tech suppliers, local public, media, project teams and contractors. Pitch your topic with ease and precision using this project leader contribution and major expectations ppt powerpoint presentation file diagrams pdf. This layout presents information on technology, media, contractors. It is also available for immediate download and adjustment. So, changes can be made in the color, design, graphics or any other component to create a unique layout.
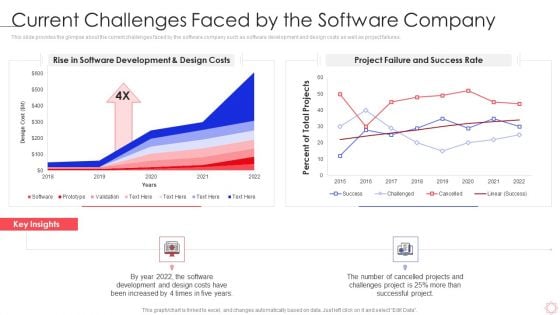
SPI Methodology Current Challenges Faced By The Software Company Ppt PowerPoint Presentation Diagram Templates PDF
This slide provides the glimpse about the current challenges faced by the software company such as software development and design costs as well as project failures. Deliver an awe inspiring pitch with this creative spi methodology current challenges faced by the software company ppt powerpoint presentation diagram templates pdf bundle. Topics like project failure and success rate, rise in software development can be discussed with this completely editable template. It is available for immediate download depending on the needs and requirements of the user.
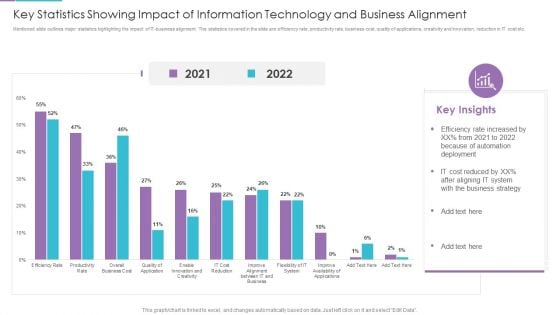
Key Statistics Showing Impact Of Information Technology And Business Alignment Diagrams PDF
Mentioned slide outlines major statistics highlighting the impact of IT business alignment. The statistics covered in the slide are efficiency rate, productivity rate, business cost, quality of applications, creativity and innovation, reduction in IT cost etc. Showcasing this set of slides titled key statistics showing impact of information technology and business alignment diagrams pdf. The topics addressed in these templates are reduced, system, business strategy. All the content presented in this PPT design is completely editable. Download it and make adjustments in color, background, font etc. as per your unique business setting.
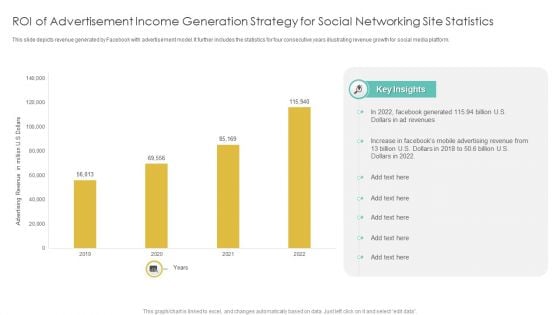
Roi Of Advertisement Income Generation Strategy For Social Networking Site Statistics Diagrams PDF
This slide depicts revenue generated by Facebook with advertisement model. It further includes the statistics for four consecutive years illustrating revenue growth for social media platform. Pitch your topic with ease and precision using this Roi Of Advertisement Income Generation Strategy For Social Networking Site Statistics Diagrams PDF. This layout presents information on Advertisement Income, Generation Strategy, Social Networking Site Statistics. It is also available for immediate download and adjustment. So, changes can be made in the color, design, graphics or any other component to create a unique layout.
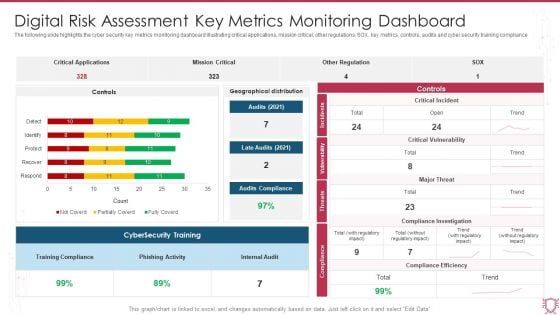
Digital Risk Assessment Key Metrics Monitoring Dashboard Ppt Ideas Diagrams PDF
The following slide highlights the cyber security key metrics monitoring dashboard illustrating critical applications, mission critical, other regulations, SOX, key metrics, controls, audits and cyber security training compliance. Showcasing this set of slides titled Digital Risk Assessment Key Metrics Monitoring Dashboard Ppt Ideas Diagrams PDF. The topics addressed in these templates are Critical Applications, Mission Critical, Other Regulation. All the content presented in this PPT design is completely editable. Download it and make adjustments in color, background, font etc. as per your unique business setting.
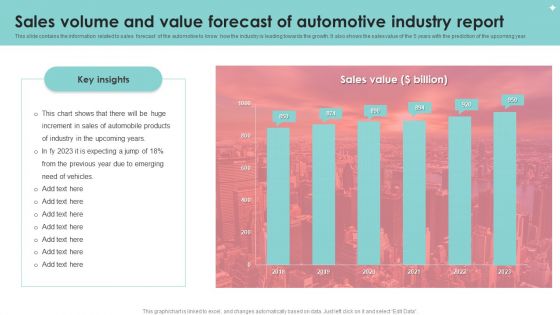
Sales Volume And Value Forecast Of Automotive Industry Report Diagrams PDF
This slide contains the information related to sales forecast of the automotive to know how the industry is leading towards the growth. It also shows the sales value of the 5 years with the prediction of the upcoming year. Showcasing this set of slides titled Sales Volume And Value Forecast Of Automotive Industry Report Diagrams PDF. The topics addressed in these templates are Sales Volume, Value Forecast, Automotive Industry Report. All the content presented in this PPT design is completely editable. Download it and make adjustments in color, background, font etc. as per your unique business setting.
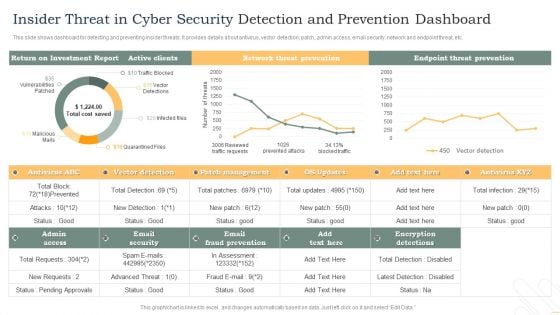
Insider Threat In Cyber Security Detection And Prevention Dashboard Diagrams PDF
This slide shows dashboard for detecting and preventing insider threats. It provides details about antivirus, vector detection, patch, admin access, email security, network and endpoint threat, etc. Pitch your topic with ease and precision using this Insider Threat In Cyber Security Detection And Prevention Dashboard Diagrams PDF. This layout presents information on Active Clients, Network Threat Prevention, Endpoint Threat Prevention. It is also available for immediate download and adjustment. So, changes can be made in the color, design, graphics or any other component to create a unique layout.
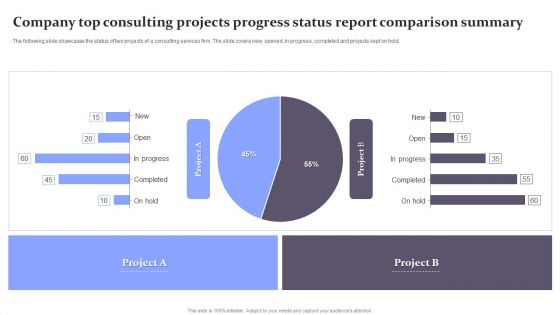
Company Top Consulting Projects Progress Status Report Comparison Summary Diagrams PDF
The following slide showcases the status of two projects of a consulting services firm. The slide covers new, opened, in progress, completed and projects kept on hold. Pitch your topic with ease and precision using this Company Top Consulting Projects Progress Status Report Comparison Summary Diagrams PDF. This layout presents information on Company Top Consulting Projects Progress, Status Report Comparison Summary. It is also available for immediate download and adjustment. So, changes can be made in the color, design, graphics or any other component to create a unique layout.

Performance Analysis Using Operating Revenue Business Operational Expenditure And Income Metrics Diagrams PDF
This slide illustrates performance analysis using operating revenue, operating expenditure opex and income metrics which can be referred by organizations to evaluate their inflows and outflows to make relevant decisions for increasing profitability. It includes information about operating revenue, operating expense and income before taxes. Pitch your topic with ease and precision using this Performance Analysis Using Operating Revenue Business Operational Expenditure And Income Metrics Diagrams PDF. This layout presents information on Taxes, Highest Operating, Recorded. It is also available for immediate download and adjustment. So, changes can be made in the color, design, graphics or any other component to create a unique layout.
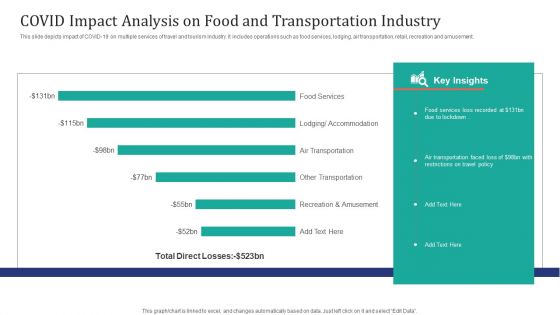
COVID Impact Analysis On Food And Transportation Industry Ppt Infographic Template Diagrams PDF
This slide depicts impact of COVID-19 on multiple services of travel and tourism industry. It includes operations such as food services, lodging, air transportation, retail, recreation and amusement. Showcasing this set of slides titled COVID Impact Analysis On Food And Transportation Industry Ppt Infographic Template Diagrams PDF. The topics addressed in these templates are Food Services, Air Transportation Faced, Restrictions Travel Policy. All the content presented in this PPT design is completely editable. Download it and make adjustments in color, background, font etc. as per your unique business setting.
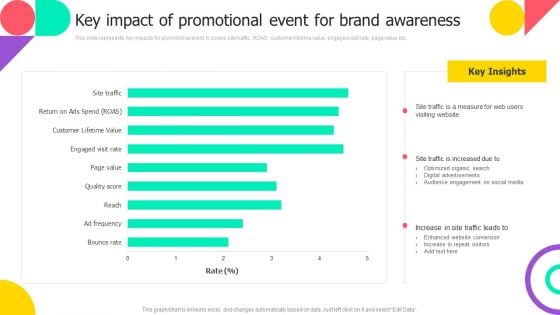
Brand Engagement Promotional Campaign Implementation Key Impact Of Promotional Event For Brand Awareness Diagrams PDF
This slide represents key impacts for promotional event. It covers site traffic, ROAS, customer lifetime value, engaged visit rate, page value etc. Find a pre designed and impeccable Brand Engagement Promotional Campaign Implementation Key Impact Of Promotional Event For Brand Awareness Diagrams PDF. The templates can ace your presentation without additional effort. You can download these easy to edit presentation templates to make your presentation stand out from others. So, what are you waiting for Download the template from Slidegeeks today and give a unique touch to your presentation.
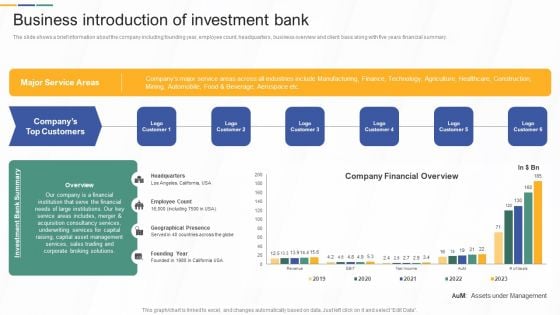
Business Introduction Of Investment Bank Investment Banking And Deal Pitchbook Diagrams PDF
The slide shows a brief information about the company including founding year, employee count, headquarters, business overview and client base along with five years financial summary. If your project calls for a presentation, then Slidegeeks is your go-to partner because we have professionally designed, easy-to-edit templates that are perfect for any presentation. After downloading, you can easily edit Business Introduction Of Investment Bank Investment Banking And Deal Pitchbook Diagrams PDF and make the changes accordingly. You can rearrange slides or fill them with different images. Check out all the handy templates.
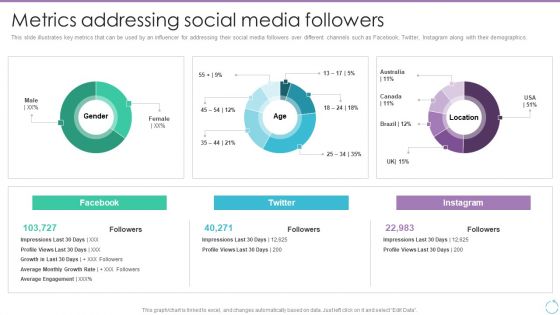
Personal Branding Plan For Executives Metrics Addressing Social Media Followers Diagrams PDF
This slide illustrates key metrics that can be used by an influencer for addressing their social media followers over different channels such as Facebook, Twitter, Instagram along with their demographics. The Personal Branding Plan For Executives Metrics Addressing Social Media Followers Diagrams PDF is a compilation of the most recent design trends as a series of slides. It is suitable for any subject or industry presentation, containing attractive visuals and photo spots for businesses to clearly express their messages. This template contains a variety of slides for the user to input data, such as structures to contrast two elements, bullet points, and slides for written information. Slidegeeks is prepared to create an impression.
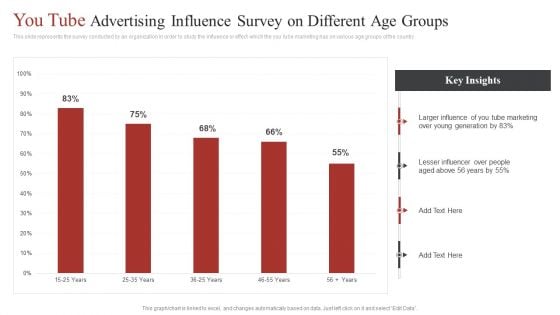
You Tube Advertising Influence Survey On Different Age Groups Ppt Diagram Ppt PDF
This slide represents the survey conducted by an organization in order to study the influence or effect which the you tube marketing has on various age groups of the country. Pitch your topic with ease and precision using this You Tube Advertising Influence Survey On Different Age Groups Ppt Diagram Ppt PDF. This layout presents information on Larger Influence, You Tube Marketing, Young Generation. It is also available for immediate download and adjustment. So, changes can be made in the color, design, graphics or any other component to create a unique layout.
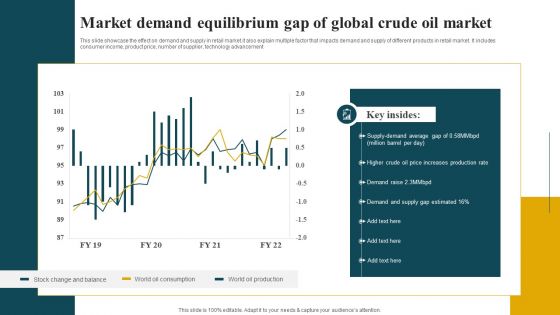
Market Demand Equilibrium Gap Of Global Crude Oil Market Diagrams PDF
This slide showcase the effect on demand and supply in retail market.it also explain multiple factor that impacts demand and supply of different products in retail market. It includes consumer income, product price, number of supplier, technology advancement. Pitch your topic with ease and precision using this Market Demand Equilibrium Gap Of Global Crude Oil Market Diagrams PDF. This layout presents information on Demand And Supply, Production Rate, Average. It is also available for immediate download and adjustment. So, changes can be made in the color, design, graphics or any other component to create a unique layout.
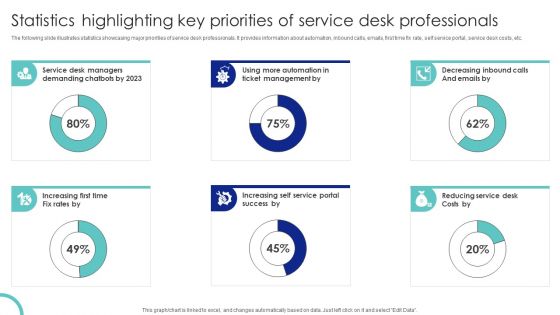
Statistics Highlighting Key Priorities Of Service Desk Professionals Ppt PowerPoint Presentation Diagram PDF
The following slide illustrates statistics showcasing major priorities of service desk professionals. It provides information about automation, inbound calls, emails, first time fix rate, self service portal, service desk costs, etc. If your project calls for a presentation, then Slidegeeks is your go to partner because we have professionally designed, easy to edit templates that are perfect for any presentation. After downloading, you can easily edit Statistics Highlighting Key Priorities Of Service Desk Professionals Ppt PowerPoint Presentation Diagram PDF and make the changes accordingly. You can rearrange slides or fill them with different images. Check out all the handy templates.
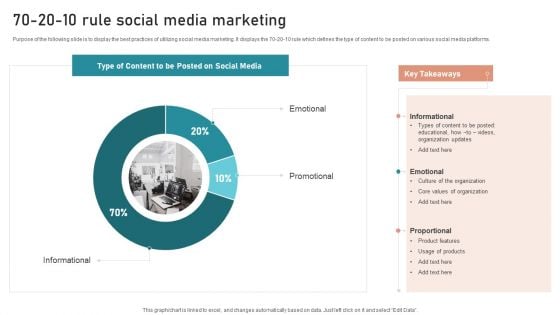
B2B And B2C Startups Marketing Mix Strategies 70 20 10 Rule Social Media Marketing Diagrams PDF
Purpose of the following slide is to display the best practices of utilizing social media marketing. It displays the 70 20 10 rule which defines the type of content to be posted on various social media platforms. Find a pre designed and impeccable B2B And B2C Startups Marketing Mix Strategies 70 20 10 Rule Social Media Marketing Diagrams PDF. The templates can ace your presentation without additional effort. You can download these easy to edit presentation templates to make your presentation stand out from others. So, what are you waiting for Download the template from Slidegeeks today and give a unique touch to your presentation.
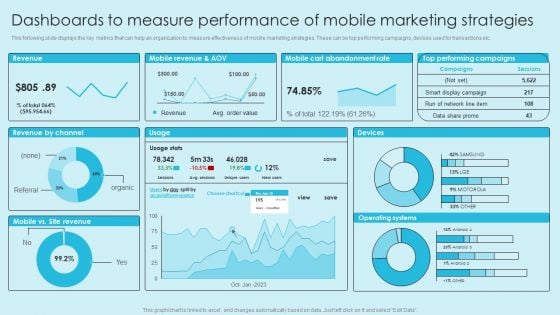
Online Marketing Techniques For Acquiring Clients Dashboards To Measure Performance Of Mobile Marketing Diagrams PDF
This following slide displays the key metrics that can help an organization to measure effectiveness of mobile marketing strategies. These can be top performing campaigns, devises used for transactions etc. Find a pre designed and impeccable Online Marketing Techniques For Acquiring Clients Dashboards To Measure Performance Of Mobile Marketing Diagrams PDF. The templates can ace your presentation without additional effort. You can download these easy to edit presentation templates to make your presentation stand out from others. So, what are you waiting for. Download the template from Slidegeeks today and give a unique touch to your presentation.
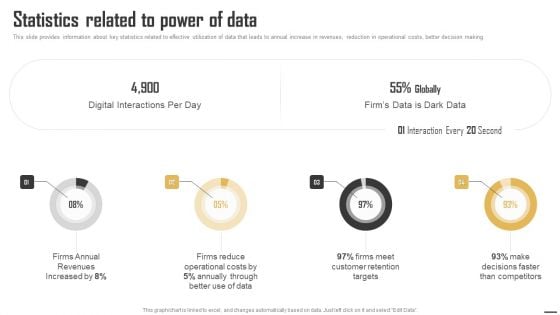
Data Monetization And Management Statistics Related To Power Of Data Diagrams PDF
This slide provides information about key statistics related to effective utilization of data that leads to annual increase in revenues, reduction in operational costs, better decision making. Find a pre-designed and impeccable Data Monetization And Management Statistics Related To Power Of Data Diagrams PDF. The templates can ace your presentation without additional effort. You can download these easy-to-edit presentation templates to make your presentation stand out from others. So, what are you waiting for Download the template from Slidegeeks today and give a unique touch to your presentation.
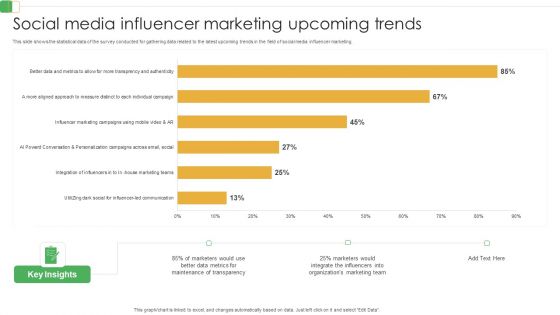
Social Media Influencer Marketing Upcoming Trends Ppt PowerPoint Presentation Diagram Templates PDF
This slide shows the statistical data of the survey conducted for gathering data related to the latest upcoming trends in the field of social media influencer marketing.Showcasing this set of slides titled Social Media Influencer Marketing Upcoming Trends Ppt PowerPoint Presentation Diagram Templates PDF. The topics addressed in these templates are Maintenance Transparency, Better Data Metrics, Integrate Influencers. All the content presented in this PPT design is completely editable. Download it and make adjustments in color, background, font etc. as per your unique business setting.
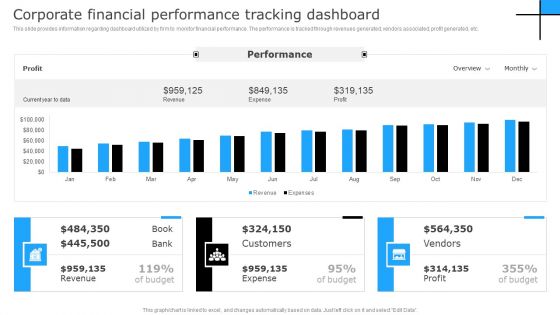
Successful Corporate Technique Enhancing Firms Performance Corporate Financial Performance Diagrams PDF
This slide provides information regarding dashboard utilized by firm to monitor financial performance. The performance is tracked through revenues generated, vendors associated, profit generated, etc. Find a pre designed and impeccable Successful Corporate Technique Enhancing Firms Performance Corporate Financial Performance Diagrams PDF. The templates can ace your presentation without additional effort. You can download these easy to edit presentation templates to make your presentation stand out from others. So, what are you waiting for Download the template from Slidegeeks today and give a unique touch to your presentation.
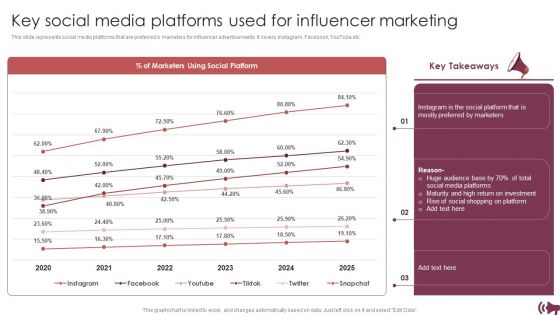
Guide Digital Advertising Optimize Lead Targeting Key Social Media Platforms Used For Influencer Marketing Diagrams PDF
This slide represents social media platforms that are preferred b marketers for influencer advertisements. It covers Instagram, Facebook, YouTube etc. Find a pre designed and impeccable Guide Digital Advertising Optimize Lead Targeting Key Social Media Platforms Used For Influencer Marketing Diagrams PDF. The templates can ace your presentation without additional effort. You can download these easy to edit presentation templates to make your presentation stand out from others. So, what are you waiting for Download the template from Slidegeeks today and give a unique touch to your presentation.
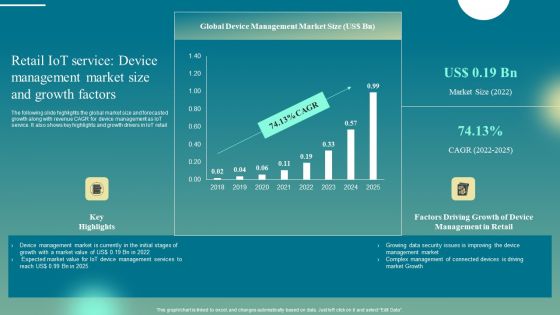
Retail Iot Service Device Management Market Size And Growth Factors Diagrams PDF
The following slide highlights the global market size and forecasted growth along with revenue CAGR for device management as IoT service. It also shows key highlights and growth drivers in IoT retail. If your project calls for a presentation, then Slidegeeks is your go-to partner because we have professionally designed, easy-to-edit templates that are perfect for any presentation. After downloading, you can easily edit Retail Iot Service Device Management Market Size And Growth Factors Diagrams PDF and make the changes accordingly. You can rearrange slides or fill them with different images. Check out all the handy templates
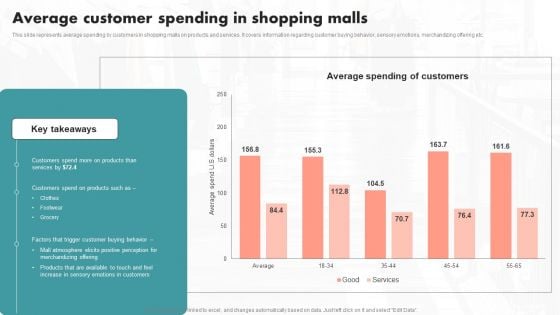
Average Customer Spending In Shopping Malls Ppt PowerPoint Presentation Diagram Images PDF
This slide represents average spending by customers in shopping malls on products and services. It covers information regarding customer buying behavior, sensory emotions, merchandizing offering etc. qIf your project calls for a presentation, then Slidegeeks is your go to partner because we have professionally designed, easy to edit templates that are perfect for any presentation. After downloading, you can easily edit Average Customer Spending In Shopping Malls Ppt PowerPoint Presentation Diagram Images PDF and make the changes accordingly. You can rearrange slides or fill them with different images. Check out all the handy templates
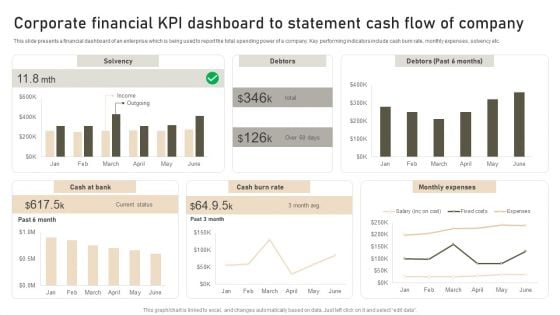
Corporate Financial KPI Dashboard To Statement Cash Flow Of Company Diagrams PDF
This slide presents a financial dashboard of an enterprise which is being used to report the total spending power of a company. Key performing indicators include cash burn rate, monthly expenses, solvency etc. Showcasing this set of slides titled Corporate Financial KPI Dashboard To Statement Cash Flow Of Company Diagrams PDF. The topics addressed in these templates are Solvency, Debtors, Monthly Expenses. All the content presented in this PPT design is completely editable. Download it and make adjustments in color, background, font etc. as per your unique business setting.
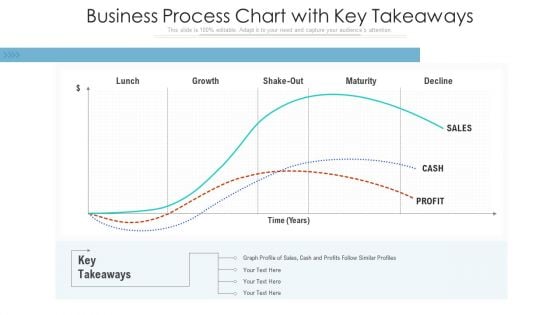
Business Process Chart With Key Takeaways Ppt Summary Files PDF
Pitch your topic with ease and precision using this business process chart with key takeaways ppt summary files pdf. This layout presents information on business process chart with key takeaways. It is also available for immediate download and adjustment. So, changes can be made in the color, design, graphics or any other component to create a unique layout.

Quarterly GDP Trends Chart Ppt Professional Slides PDF
Showcasing this set of slides titled quarterly gdp trends chart ppt professional slides pdf. The topics addressed in these templates are quarterly gdp trends chart. All the content presented in this PPT design is completely editable. Download it and make adjustments in color, background, font etc. as per your unique business setting.
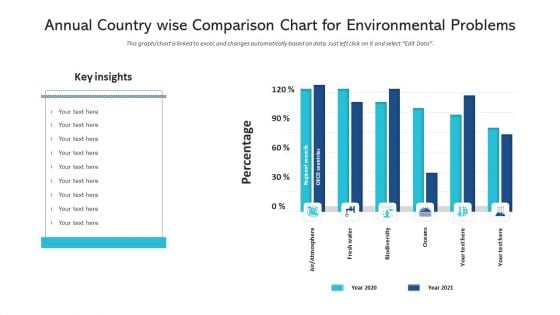
Annual Country Wise Comparison Chart For Environmental Problems Formats PDF
Showcasing this set of slides titled annual country wise comparison chart for environmental problems formats pdf. The topics addressed in these templates are annual country wise comparison chart for environmental problems. All the content presented in this PPT design is completely editable. Download it and make adjustments in color, background, font etc. as per your unique business setting.
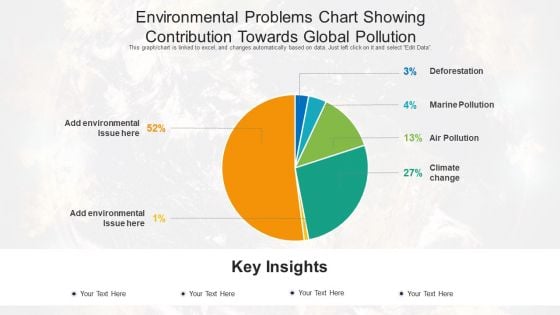
Environmental Problems Chart Showing Contribution Towards Global Pollution Elements PDF
Pitch your topic with ease and precision using this environmental problems chart showing contribution towards global pollution elements pdf. This layout presents information on environmental problems chart showing contribution towards global pollution. It is also available for immediate download and adjustment. So, changes can be made in the color, design, graphics or any other component to create a unique layout.
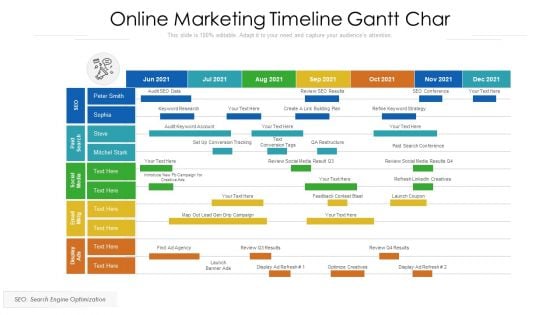
Online Marketing Timeline Gantt Chart Ppt Summary Smartart PDF
Showcasing this set of slides titled online marketing timeline gantt chart ppt summary smartart pdf. The topics addressed in these templates are online marketing timeline gantt chart. All the content presented in this PPT design is completely editable. Download it and make adjustments in color, background, font etc. as per your unique business setting.
Problem Tracker Chart With Priority And Assignee Information Download PDF
Showcasing this set of slides titled problem tracker chart with priority and assignee information download pdf. The topics addressed in these templates are problem tracker chart with priority and assignee information. All the content presented in this PPT design is completely editable. Download it and make adjustments in color, background, font etc. as per your unique business setting.
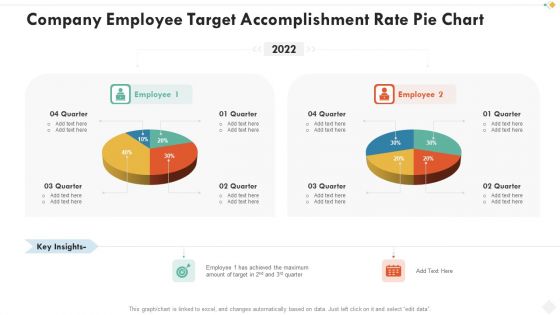
Company Employee Target Accomplishment Rate Pie Chart Download PDF
Showcasing this set of slides titled company employee target accomplishment rate pie chart download pdf. The topics addressed in these templates are company employee target accomplishment rate pie chart. All the content presented in this PPT design is completely editable. Download it and make adjustments in color, background, font etc. as per your unique business setting.
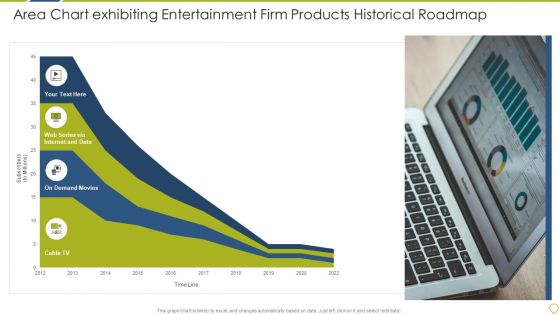
Area Chart Exhibiting Entertainment Firm Products Historical Roadmap Structure PDF
Showcasing this set of slides titled area chart exhibiting entertainment firm products historical roadmap structure pdf. The topics addressed in these templates are area chart exhibiting entertainment firm products historical roadmap. All the content presented in this PPT design is completely editable. Download it and make adjustments in color, background, font etc. as per your unique business setting.
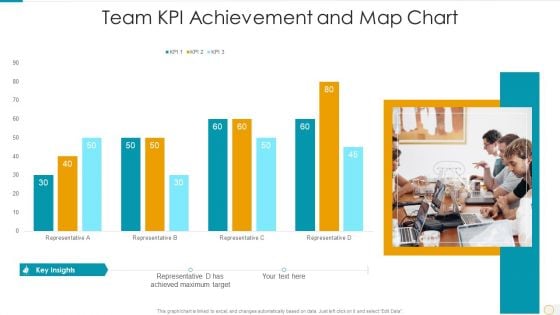
Team Kpi Achievement And Map Chart Portrait PDF
Pitch your topic with ease and precision using this team kpi achievement and map chart portrait pdf. This layout presents information on team kpi achievement and map chart. It is also available for immediate download and adjustment. So, changes can be made in the color, design, graphics or any other component to create a unique layout.
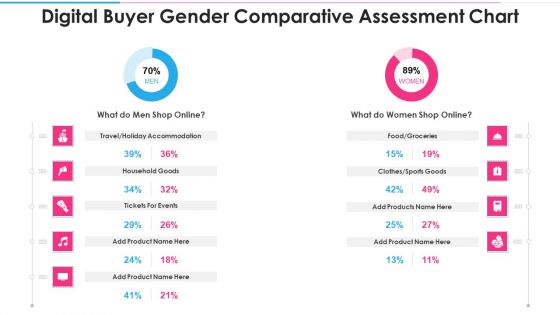
Digital Buyer Gender Comparative Assessment Chart Introduction PDF
Showcasing this set of slides titled digital buyer gender comparative assessment chart introduction pdf. The topics addressed in these templates are digital buyer gender comparative assessment chart. All the content presented in this PPT design is completely editable. Download it and make adjustments in color, background, font etc. as per your unique business setting.
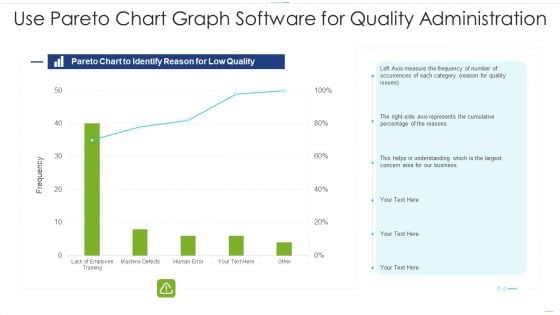
Use Pareto Chart Graph Software For Quality Administration Structure PDF
Pitch your topic with ease and precision using this use pareto chart graph software for quality administration structure pdf. This layout presents information on use pareto chart graph software for quality administration. It is also available for immediate download and adjustment. So, changes can be made in the color, design, graphics or any other component to create a unique layout.
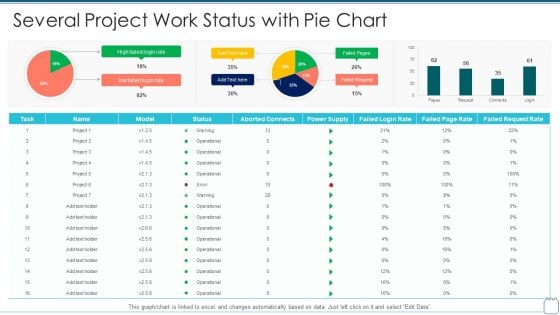
Several Project Work Status With Pie Chart Microsoft PDF
Pitch your topic with ease and precision using this several project work status with pie chart microsoft pdf . This layout presents information on several project work status with pie chart . It is also available for immediate download and adjustment. So, changes can be made in the color, design, graphics or any other component to create a unique layout.
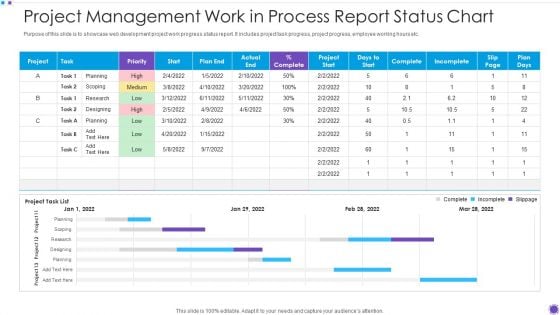
Project Management Work In Process Report Status Chart Microsoft PDF
Pitch your topic with ease and precision using this project management work in process report status chart microsoft pdf. This layout presents information on project management work in process report status chart. It is also available for immediate download and adjustment. So, changes can be made in the color, design, graphics or any other component to create a unique layout.
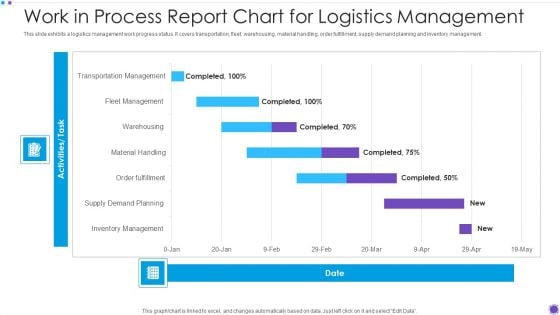
Work In Process Report Chart For Logistics Management Slides PDF
Pitch your topic with ease and precision using this work in process report chart for logistics management slides pdf. This layout presents information on work in process report chart for logistics management. It is also available for immediate download and adjustment. So, changes can be made in the color, design, graphics or any other component to create a unique layout.
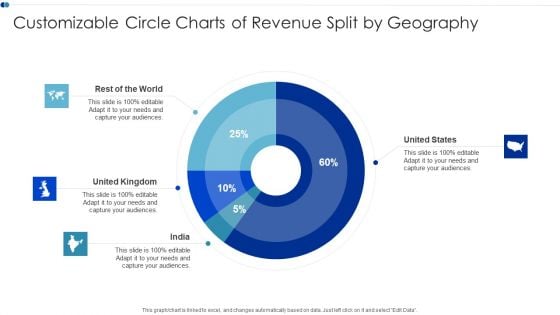
Customizable Circle Charts Of Revenue Split By Geography Elements PDF
Showcasing this set of slides titled Customizable Circle Charts Of Revenue Split By Geography Elements PDF The topics addressed in these templates are Customizable Circle, Charts Revenue, Split Geography All the content presented in this PPT design is completely editable. Download it and make adjustments in color, background, font etc. as per your unique business setting.
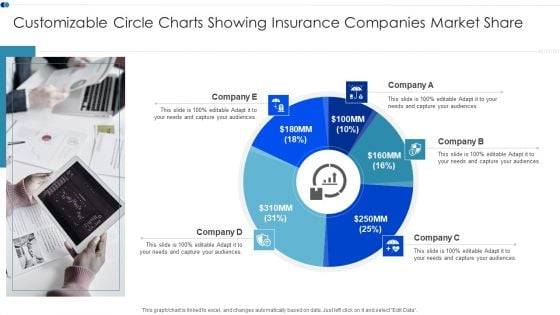
Customizable Circle Charts Showing Insurance Companies Market Share Structure PDF
Showcasing this set of slides titled Customizable Circle Charts Showing Insurance Companies Market Share Structure PDF The topics addressed in these templates are Customizable Circle, Charts Showing, Insurance Companies All the content presented in this PPT design is completely editable. Download it and make adjustments in color, background, font etc. as per your unique business setting.
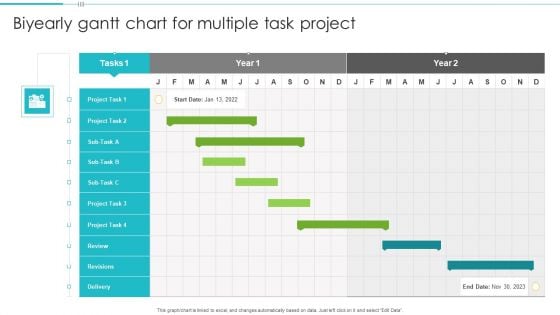
Biyearly Gantt Chart For Multiple Task Project Structure PDF
Pitch your topic with ease and precision using this Biyearly Gantt Chart For Multiple Task Project Structure PDF. This layout presents information on Biyearly Gantt Chart, Multiple Task Project. It is also available for immediate download and adjustment. So, changes can be made in the color, design, graphics or any other component to create a unique layout.
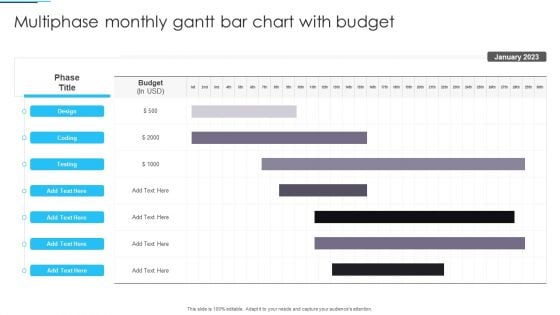
Multiphase Monthly Gantt Bar Chart With Budget Clipart PDF
Pitch your topic with ease and precision using this Multiphase Monthly Gantt Bar Chart With Budget Clipart PDF. This layout presents information on Gantt Bar Chart, Budget. It is also available for immediate download and adjustment. So, changes can be made in the color, design, graphics or any other component to create a unique layout.
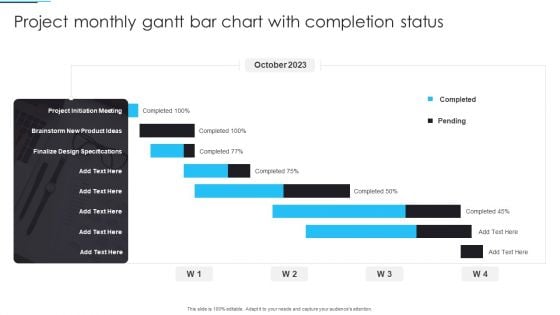
Project Monthly Gantt Bar Chart With Completion Status Infographics PDF
Pitch your topic with ease and precision using this Project Monthly Gantt Bar Chart With Completion Status Infographics PDF. This layout presents information on Project, Monthly Gantt Bar Chart. It is also available for immediate download and adjustment. So, changes can be made in the color, design, graphics or any other component to create a unique layout.
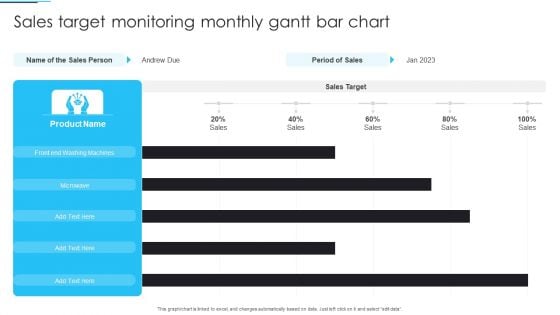
Sales Target Monitoring Monthly Gantt Bar Chart Ideas PDF
Pitch your topic with ease and precision using this Sales Target Monitoring Monthly Gantt Bar Chart Ideas PDF. This layout presents information on Sales Target Monitoring, Monthly Gantt Bar Chart. It is also available for immediate download and adjustment. So, changes can be made in the color, design, graphics or any other component to create a unique layout.
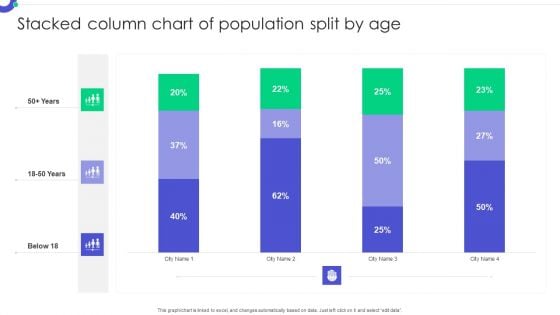
Stacked Column Chart Of Population Split By Age Information PDF
Showcasing this set of slides titled Stacked Column Chart Of Population Split By Age Information PDF. The topics addressed in these templates are Stacked Column, Chart Population, Split Age. All the content presented in this PPT design is completely editable. Download it and make adjustments in color, background, font etc. as per your unique business setting.

Sprint Monitoring Summary With Burndown Chart Portrait PDF
Pitch your topic with ease and precision using this Sprint Monitoring Summary With Burndown Chart Portrait PDF. This layout presents information on Sprint Monitoring Summary, Burndown Chart . It is also available for immediate download and adjustment. So, changes can be made in the color, design, graphics or any other component to create a unique layout.
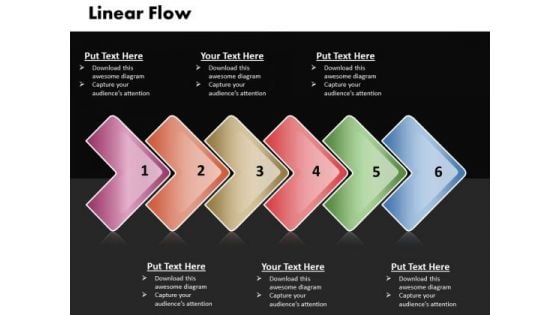
Ppt Linear Process Flow PowerPoint Template 6 State Diagram Templates
PPT linear process flow powerpoint template 6 state diagram Templates-Use this Diagram to define the mission and decide how it will be accomplished. -PPT linear process flow powerpoint template 6 state diagram Templates-Abstract, Arrow, Arrow Chart, Business, Design, Development, Diagram, Direction, Element, Flow, Flow Chart, Flow Diagram, Flowchart, Graph, Linear, Management, Model, Motion, Organization, Plan, Process, Process Arrows, Process Chart, Process Diagram, Process Flow, Program, Section, Segment, Set, Sign, Solution, Strategy, Symbol, Technology Build their faith in their ability. Beef up their confidence with our Ppt Linear Process Flow PowerPoint Template 6 State Diagram Templates.
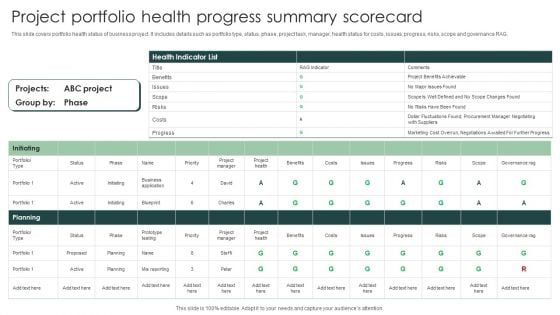
Project Portfolio Health Progress Summary Scorecard Diagrams PDF
This slide covers portfolio health status of business project. It includes details such as portfolio type, status, phase, project task, manager, health status for costs, issues, progress, risks, scope and governance RAG.Showcasing this set of slides titled Project Portfolio Health Progress Summary Scorecard Diagrams PDF. The topics addressed in these templates are Project Benefits Achievable, Procurement Manager, Negotiations Awaited. All the content presented in this PPT design is completely editable. Download it and make adjustments in color, background, font etc. as per your unique business setting.
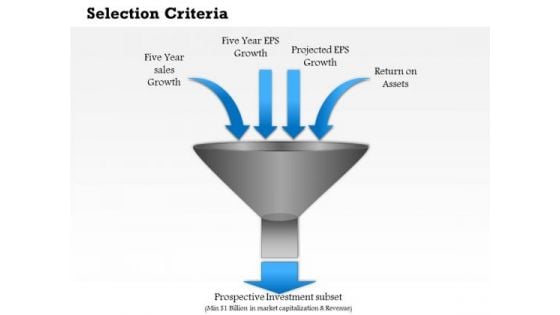
Business Diagram Selection Criteria PowerPoint Ppt Presentation
This slide displays framework for selection criteria. This diagram contains funnel diagram with four inward arrows representing five year sales growth, five year EPS growth, projected EPS growth and return on assets. You can use this funnel diagram in business and sales related presentations.
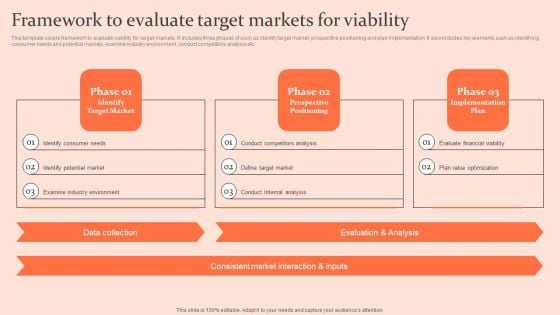
Customised Advertising Strategies Framework To Evaluate Target Markets For Viability Background PDF
This template covers framework to evaluate viability for target markets. It includes three phases of such as identify target market, prospective positioning and plan implementation. It also includes key elements such as identifying consumer needs and potential markets, examine industry environment, conduct competitors analysis etc. Are you searching for a Customised Advertising Strategies Framework To Evaluate Target Markets For Viability Background PDF that is uncluttered, straightforward, and original Its easy to edit, and you can change the colors to suit your personal or business branding. For a presentation that expresses how much effort you have put in, this template is ideal With all of its features, including tables, diagrams, statistics, and lists, its perfect for a business plan presentation. Make your ideas more appealing with these professional slides. Download Customised Advertising Strategies Framework To Evaluate Target Markets For Viability Background PDF from Slidegeeks today.
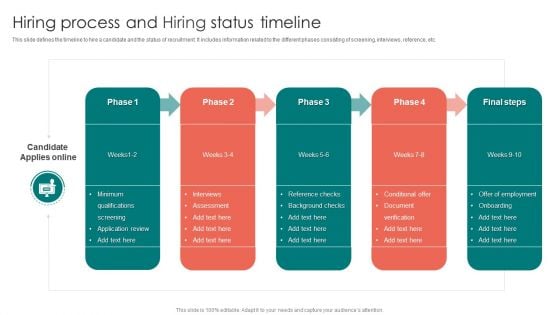
Hiring Process And Hiring Status Timeline Ppt PowerPoint Presentation Gallery Themes PDF
This slide defines the timeline to hire a candidate and the status of recruitment. It includes information related to the different phases consisting of screening, interviews, reference, etc. Persuade your audience using this Hiring Process And Hiring Status Timeline Ppt PowerPoint Presentation Gallery Themes PDF. This PPT design covers five stages, thus making it a great tool to use. It also caters to a variety of topics including Candidate Applies Online, Application Review, Assessment. Download this PPT design now to present a convincing pitch that not only emphasizes the topic but also showcases your presentation skills.


 Continue with Email

 Home
Home


