Construction Icons
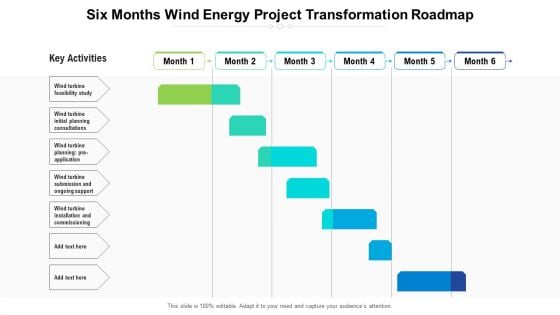
Six Months Wind Energy Project Transformation Roadmap Diagrams
Introducing our six months wind energy project transformation roadmap diagrams. This PPT presentation is Google Slides compatible, therefore, you can share it easily with the collaborators for measuring the progress. Also, the presentation is available in both standard screen and widescreen aspect ratios. So edit the template design by modifying the font size, font type, color, and shapes as per your requirements. As this PPT design is fully editable it can be presented in PDF, JPG and PNG formats.
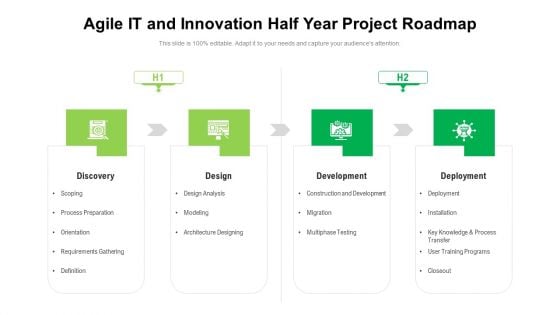
Agile IT And Innovation Half Year Project Roadmap Diagrams
Introducing our agile it and innovation half year project roadmap diagrams. This PPT presentation is Google Slides compatible, therefore, you can share it easily with the collaborators for measuring the progress. Also, the presentation is available in both standard screen and widescreen aspect ratios. So edit the template design by modifying the font size, font type, color, and shapes as per your requirements. As this PPT design is fully editable it can be presented in PDF, JPG and PNG formats.
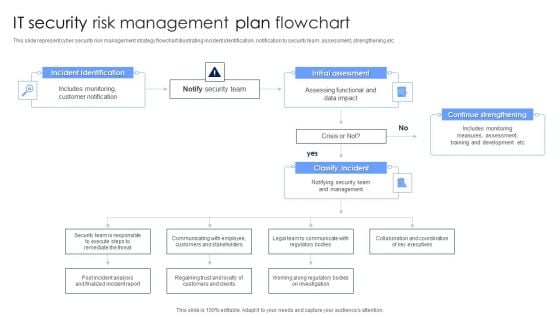
IT Security Risk Management Plan Flowchart Diagrams PDF
This slide represent cyber security risk management strategy flowchart illustrating incident identification, notification to security team, assessment, strengthening etc. Persuade your audience using this IT Security Risk Management Plan Flowchart Diagrams PDF. This PPT design covers four stages, thus making it a great tool to use. It also caters to a variety of topics including Incident Identification, Initial Assessment, Continue Strengthening. Download this PPT design now to present a convincing pitch that not only emphasizes the topic but also showcases your presentation skills.
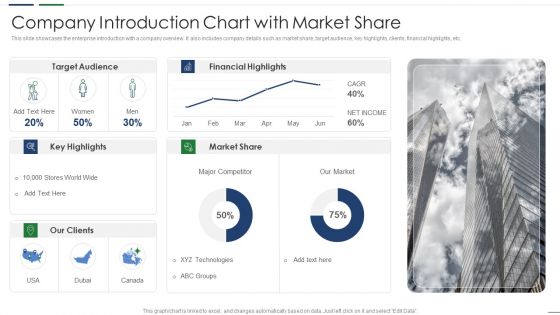
Company Introduction Chart With Market Share Portrait PDF
This slide showcases the enterprise introduction with a company overview. It also includes company details such as market share, target audience, key highlights, clients, financial highlights, etc. Showcasing this set of slides titled Company Introduction Chart With Market Share Portrait PDF. The topics addressed in these templates are Market Share, Financial Highlights, Target Audience. All the content presented in this PPT design is completely editable. Download it and make adjustments in color, background, font etc. as per your unique business setting.
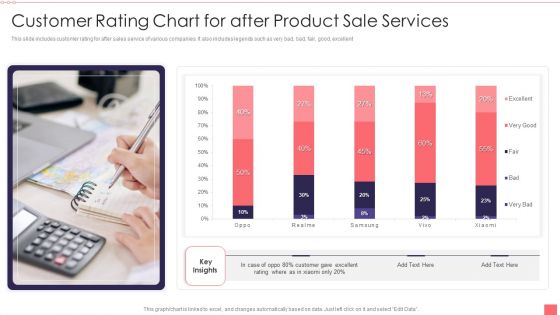
Customer Rating Chart For After Product Sale Services Download PDF
This slide includes customer rating for after sales service of various companies. It also includes legends such as very bad, bad, fair, good, excellent. Showcasing this set of slides titled Customer Rating Chart For After Product Sale Services Download PDF. The topics addressed in these templates are Customer, Product Sale Services. All the content presented in this PPT design is completely editable. Download it and make adjustments in color, background, font etc. as per your unique business setting.
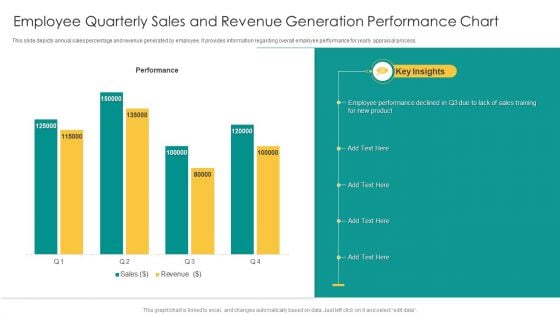
Employee Quarterly Sales And Revenue Generation Performance Chart Mockup PDF
This slide depicts annual sales percentage and revenue generated by employee. It provides information regarding overall employee performance for yearly appraisal process. Pitch your topic with ease and precision using this Employee Quarterly Sales And Revenue Generation Performance Chart Mockup PDF. This layout presents information on Performance, Sales, Revenue. It is also available for immediate download and adjustment. So, changes can be made in the color, design, graphics or any other component to create a unique layout.

Employees Quarter Wise Head Count Performance Chart Clipart PDF
This slide depicts number of existing and new hires in company. It provides details of total male and female employees for 4 quarters and key insights. Showcasing this set of slides titled Employees Quarter Wise Head Count Performance Chart Clipart PDF. The topics addressed in these templates are New Employees, Product Diversification, Advancement Opportunities. All the content presented in this PPT design is completely editable. Download it and make adjustments in color, background, font etc. as per your unique business setting.
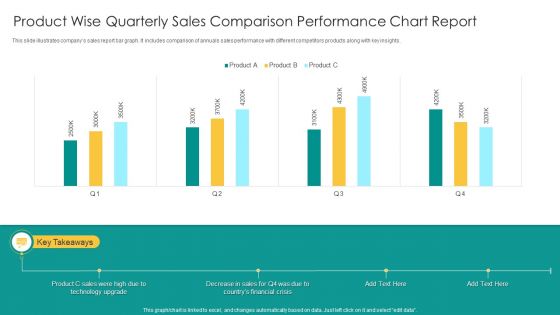
Product Wise Quarterly Sales Comparison Performance Chart Report Infographics PDF
This slide illustrates companys sales report bar graph. It includes comparison of annuals sales performance with different competitors products along with key insights. Showcasing this set of slides titled Product Wise Quarterly Sales Comparison Performance Chart Report Infographics PDF. The topics addressed in these templates are Product C Sales, Technology Upgrade, Financial Crisis. All the content presented in this PPT design is completely editable. Download it and make adjustments in color, background, font etc. as per your unique business setting.
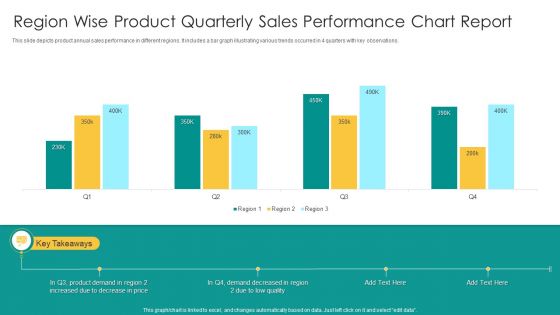
Region Wise Product Quarterly Sales Performance Chart Report Topics PDF
This slide depicts product annual sales performance in different regions. It includes a bar graph illustrating various trends occurred in 4 quarters with key observations. Showcasing this set of slides titled Region Wise Product Quarterly Sales Performance Chart Report Topics PDF. The topics addressed in these templates are Product Demand, Price, Low Quality. All the content presented in this PPT design is completely editable. Download it and make adjustments in color, background, font etc. as per your unique business setting.
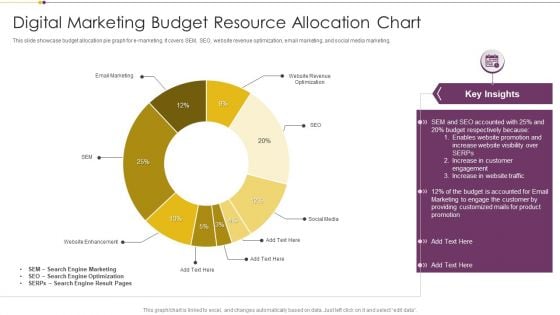
Digital Marketing Budget Resource Allocation Chart Download PDF
This slide showcase budget allocation pie graph for e marketing. It covers SEM, SEO, website revenue optimization, email marketing, and social media marketing. Pitch your topic with ease and precision using this Digital Marketing Budget Resource Allocation Chart Download PDF. This layout presents information on Search Engine Marketing, Search Engine Optimization, Budget. It is also available for immediate download and adjustment. So, changes can be made in the color, design, graphics or any other component to create a unique layout.
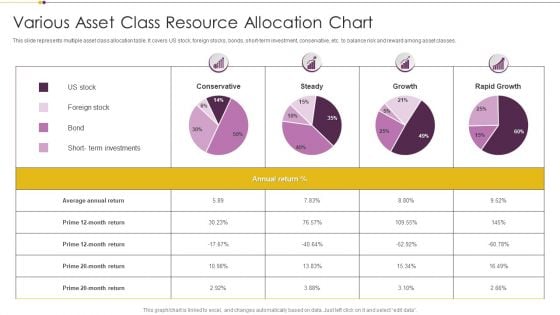
Various Asset Class Resource Allocation Chart Brochure PDF
This slide represents multiple asset class allocation table. It covers US stock, foreign stocks, bonds, short term investment, conservative, etc. to balance risk and reward among asset classes. Showcasing this set of slides titled Various Asset Class Resource Allocation Chart Brochure PDF. The topics addressed in these templates are Average Annual Return, Term Investments, Growth. All the content presented in this PPT design is completely editable. Download it and make adjustments in color, background, font etc. as per your unique business setting.
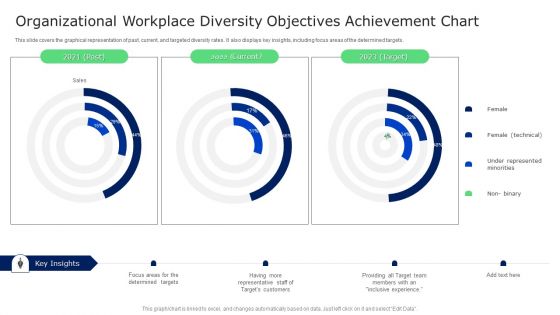
Organizational Workplace Diversity Objectives Achievement Chart Brochure PDF
This slide covers the graphical representation of past, current, and targeted diversity rates. It also displays key insights, including focus areas of the determined targets. Showcasing this set of slides titled Organizational Workplace Diversity Objectives Achievement Chart Brochure PDF. The topics addressed in these templates are Targets Customers, Determined Targets, Target Team. All the content presented in this PPT design is completely editable. Download it and make adjustments in color, background, font etc. as per your unique business setting.
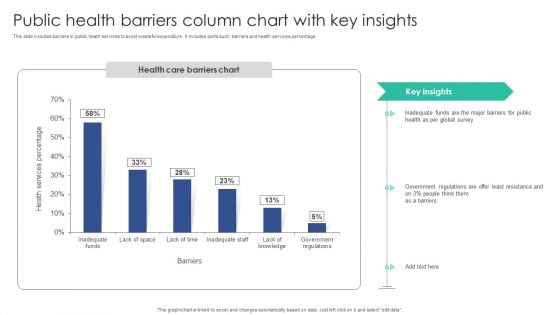
Public Health Barriers Column Chart With Key Insights Portrait PDF
This slide includes barriers in public heath services to avoid wasteful expenditure . It includes parts such barriers and health services percentage.Pitch your topic with ease and precision using this Public Health Barriers Column Chart With Key Insights Portrait PDF. This layout presents information on Inadequate Funds, Global Survey, Government Regulations. It is also available for immediate download and adjustment. So, changes can be made in the color, design, graphics or any other component to create a unique layout.
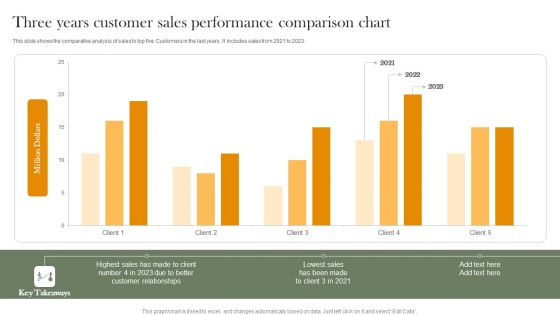
Three Years Customer Sales Performance Comparison Chart Professional PDF
This slide shows the comparative analysis of sales to top five Customers in the last years. It includes sales from 2021 to 2023. Pitch your topic with ease and precision using this Three Years Customer Sales Performance Comparison Chart Professional PDF. This layout presents information on Highest Sales, Customer Relationships, Lowest Sales. It is also available for immediate download and adjustment. So, changes can be made in the color, design, graphics or any other component to create a unique layout.
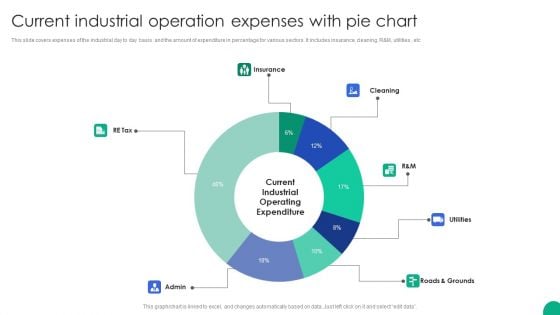
Current Industrial Operation Expenses With Pie Chart Download PDF
This slide covers expenses of the industrial day to day basis and the amount of expenditure in percentage for various sectors. It includes insurance, cleaning, R and M, utilities , etc.Showcasing this set of slides titled Current Industrial Operation Expenses With Pie Chart Download PDF. The topics addressed in these templates are Roads Grounds, Insurance, Utilities. All the content presented in this PPT design is completely editable. Download it and make adjustments in color, background, font etc. as per your unique business setting.
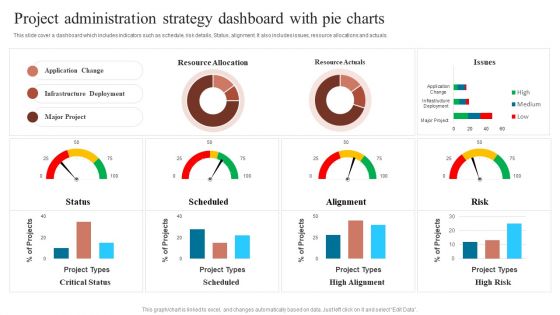
Project Administration Strategy Dashboard With Pie Charts Sample PDF
This slide cover a dashboard which includes indicators such as schedule, risk details, Status, alignment. It also includes issues, resource allocations and actuals. Pitch your topic with ease and precision using this Project Administration Strategy Dashboard With Pie Charts Sample PDF. This layout presents information on Communication Goal, Communication Tool, Increase Revenue. It is also available for immediate download and adjustment. So, changes can be made in the color, design, graphics or any other component to create a unique layout.
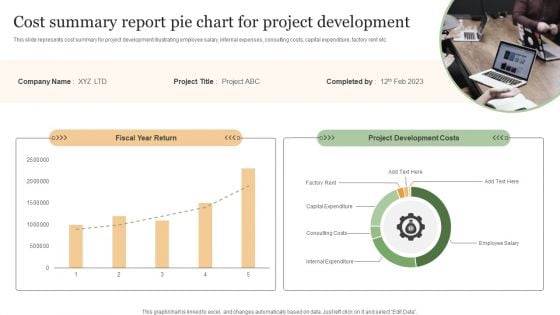
Cost Summary Report Pie Chart For Project Development Infographics PDF
This slide represents cost summary for project development illustrating employee salary, internal expenses, consulting costs, capital expenditure, factory rent etc. Showcasing this set of slides titled Cost Summary Report Pie Chart For Project Development Infographics PDF. The topics addressed in these templates are Fiscal Year Return, Project Development Costs. All the content presented in this PPT design is completely editable. Download it and make adjustments in color, background, font etc. as per your unique business setting.
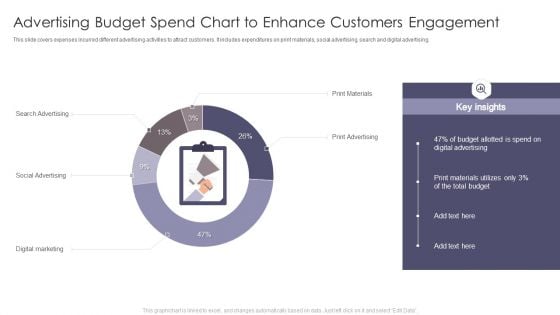
Advertising Budget Spend Chart To Enhance Customers Engagement Demonstration PDF
This slide covers expenses incurred different advertising activities to attract customers. It includes expenditures on print materials, social advertising, search and digital advertising. Showcasing this set of slides titled Advertising Budget Spend Chart To Enhance Customers Engagement Demonstration PDF. The topics addressed in these templates are Search Advertising, Print Materials. All the content presented in this PPT design is completely editable. Download it and make adjustments in color, background, font etc. as per your unique business setting.
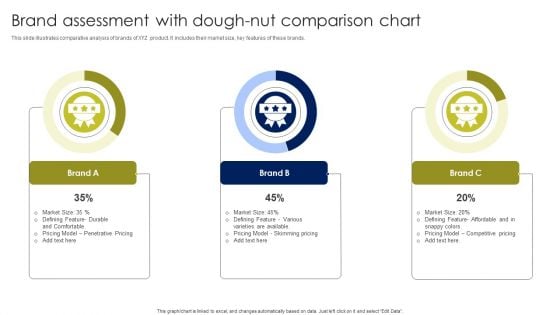
Brand Assessment With Dough Nut Comparison Chart Elements PDF
This slide illustrates comparative analysis of brands of XYZ product. It includes their market size, key features of these brands. Showcasing this set of slides titled Brand Assessment With Dough Nut Comparison Chart Elements PDF. The topics addressed in these templates are Penetrative Pricing, Skimming Pricing, Competitive Pricing. All the content presented in this PPT design is completely editable. Download it and make adjustments in color, background, font etc. as per your unique business setting.
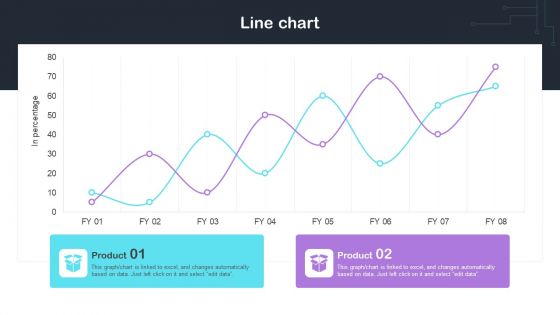
Cyber Risks And Incident Response Playbook Line Chart Professional PDF
The Cyber Risks And Incident Response Playbook Line Chart Professional PDF is a compilation of the most recent design trends as a series of slides. It is suitable for any subject or industry presentation, containing attractive visuals and photo spots for businesses to clearly express their messages. This template contains a variety of slides for the user to input data, such as structures to contrast two elements, bullet points, and slides for written information. Slidegeeks is prepared to create an impression.
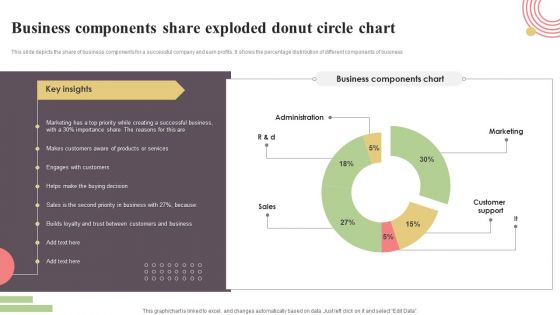
Business Components Share Exploded Donut Circle Chart Elements PDF
This slide depicts the share of business components for a successful company and earn profits. It shows the percentage distribution of different components of business. Pitch your topic with ease and precision using this Business Components Share Exploded Donut Circle Chart Elements PDF. This layout presents information on Administration, Marketing, Customer Support. It is also available for immediate download and adjustment. So, changes can be made in the color, design, graphics or any other component to create a unique layout.
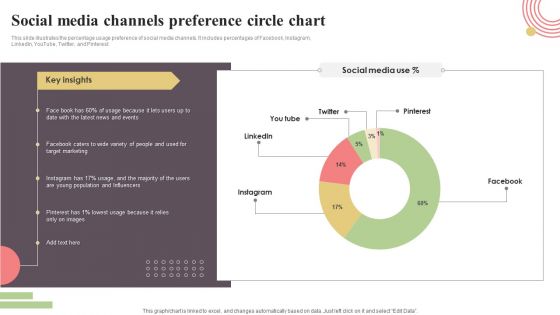
Social Media Channels Preference Circle Chart Clipart PDF
This slide illustrates the percentage usage preference of social media channels. It includes percentages of Facebook, Instagram, LinkedIn, YouTube, Twitter, and Pinterest. Showcasing this set of slides titled Social Media Channels Preference Circle Chart Clipart PDF. The topics addressed in these templates are Facebook, Instagram, Pinterest, Twitter, You Tube. All the content presented in this PPT design is completely editable. Download it and make adjustments in color, background, font etc. as per your unique business setting.
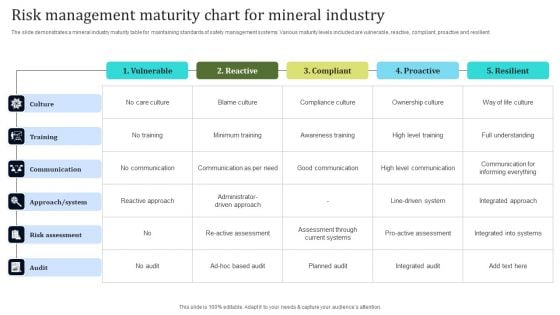
Risk Management Maturity Chart For Mineral Industry Clipart PDF
The slide demonstrates a mineral industry maturity table for maintaining standards of safety management systems. Various maturity levels included are vulnerable, reactive, compliant, proactive and resilient. Showcasing this set of slides titled Risk Management Maturity Chart For Mineral Industry Clipart PDF. The topics addressed in these templates are Communication, Risk Assessment, System. All the content presented in this PPT design is completely editable. Download it and make adjustments in color, background, font etc. as per your unique business setting.
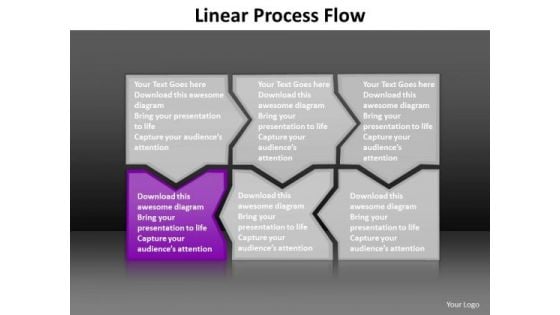
Ppt Purple Piece Live Connections In Linear Process Work Flow Chart PowerPoint Templates
PPT purple piece live connections in linear process work flow chart powerpoint Templates-Use this PowerPoint Diagram to illustrate how Linear Flow process and its components work. This Purple part which is being highlighted out of all combined Puzzles will let you explain the Beginning component of process and will help you to understand the whole mechanism of the procedure.-Can be used for presentations on abstract, algorithm, arrow, arrow, chart, block, block, diagram, business, chart, color, connection, design, development, diagram, direction, element, flow, flow, Chart, flow,diagram\n,flowchart\n,graph\n,kind,of,diagram\n,linear\n,linear,diagram\n,management\n,model\n,module\n,motion\n,organization\n,plan\n,process\n,process,arrows\n,process,chart\n,process,diagram\n,process,flow\n,program\n,section,segment,set,sign,solution,strategy,symbol-PPT purple piece live connections in linear process work flow chart powerpoint Templates Do yourself a favour by using our Ppt Purple Piece Live Connections In Linear Process Work Flow Chart PowerPoint Templates. Benefit from their effectiveness.
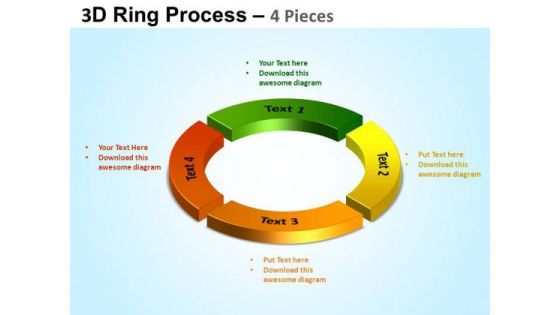
PowerPoint Process Image Ring Process Ppt Design Slides
PowerPoint Process Image ring process PPT Design Slides-The Circle of Life - a concept emmbedded in our minds and hence easy to comprehend. Life and Business is made up of processes comprising stages that flow from one to another. An excellent graphic to attract the attention of and understanding by your audience to improve earnings. Investigate problems with our PowerPoint Process Image Ring Process Ppt Design Slides. Download without worries with our money back guaranteee.
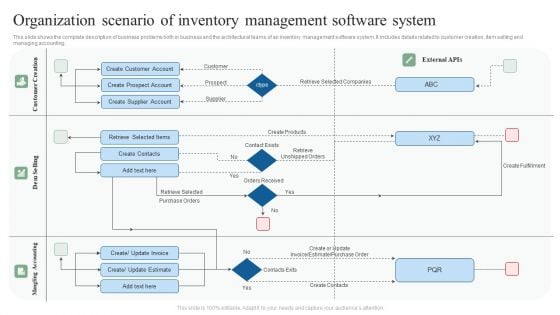
Organization Scenario Of Inventory Management Software System Ppt Ideas Elements PDF
This slide shows the complete description of business problems both in business and the architectural teams of an inventory management software system. It includes details related to customer creation, item selling and managing accounting. Presenting Organization Scenario Of Inventory Management Software System Ppt Ideas Elements PDF to dispense important information. This template comprises three stages. It also presents valuable insights into the topics including Customer Creation, Dem Selling, Mangling Accounting. This is a completely customizable PowerPoint theme that can be put to use immediately. So, download it and address the topic impactfully.
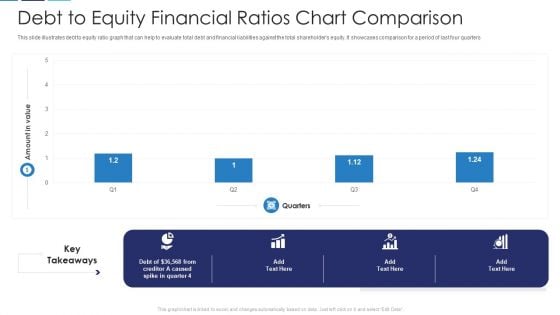
Debt To Equity Financial Ratios Chart Comparison Download PDF
This slide illustrates debt to equity ratio graph that can help to evaluate total debt and financial liabilities against the total shareholders equity. It showcases comparison for a period of last four quarters Pitch your topic with ease and precision using this debt to equity financial ratios chart comparison download pdf. This layout presents information on debt to equity financial ratios chart comparison. It is also available for immediate download and adjustment. So, changes can be made in the color, design, graphics or any other component to create a unique layout.
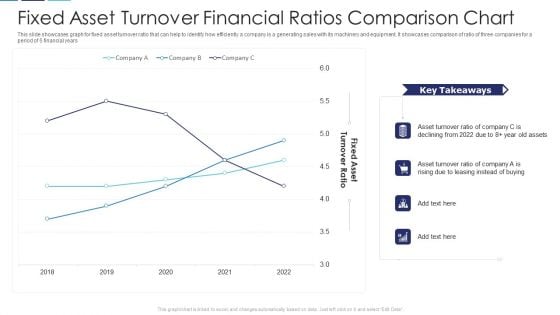
Fixed Asset Turnover Financial Ratios Comparison Chart Structure PDF
This slide showcases graph for fixed asset turnover ratio that can help to identify how efficiently a company is a generating sales with its machinery and equipment. It showcases comparison of ratio of three companies for a period of 5 financial years Showcasing this set of slides titled fixed asset turnover financial ratios comparison chart structure pdf. The topics addressed in these templates are fixed asset turnover financial ratios comparison chart. All the content presented in this PPT design is completely editable. Download it and make adjustments in color, background, font etc. as per your unique business setting.
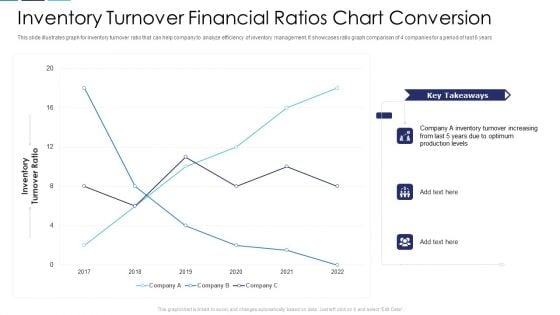
Inventory Turnover Financial Ratios Chart Conversion Portrait PDF
This slide illustrates graph for inventory turnover ratio that can help company to analyze efficiency of inventory management. It showcases ratio graph comparison of 4 companies for a period of last 6 years Pitch your topic with ease and precision using this inventory turnover financial ratios chart conversion portrait pdf. This layout presents information on inventory turnover financial ratios chart conversion. It is also available for immediate download and adjustment. So, changes can be made in the color, design, graphics or any other component to create a unique layout.
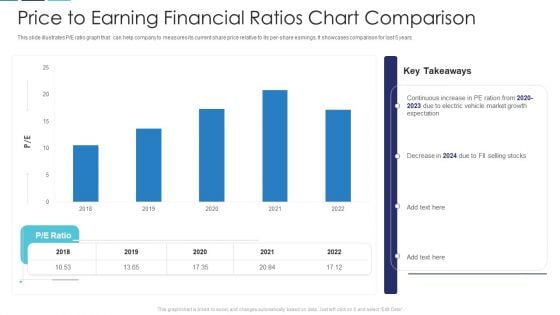
Price To Earning Financial Ratios Chart Comparison Slides PDF
This slide illustrates P or E ratio graph that can help company to measures its current share price relative to its per-share earnings. It showcases comparison for last 5 years Showcasing this set of slides titled price to earning financial ratios chart comparison slides pdf. The topics addressed in these templates are price to earning financial ratios chart comparison. All the content presented in this PPT design is completely editable. Download it and make adjustments in color, background, font etc. as per your unique business setting.
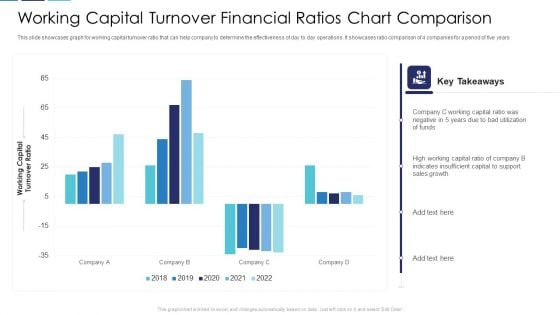
Working Capital Turnover Financial Ratios Chart Comparison Clipart PDF
This slide showcases graph for working capital turnover ratio that can help company to determine the effectiveness of day to day operations. It showcases ratio comparison of 4 companies for a period of five years Pitch your topic with ease and precision using this working capital turnover financial ratios chart comparison clipart pdf. This layout presents information on working capital turnover financial ratios chart comparison. It is also available for immediate download and adjustment. So, changes can be made in the color, design, graphics or any other component to create a unique layout.
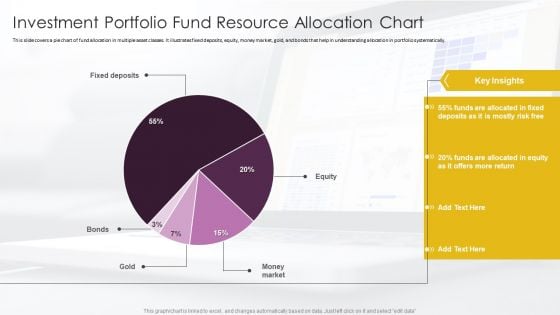
Investment Portfolio Fund Resource Allocation Chart Summary PDF
This slide covers a pie chart of fund allocation in multiple asset classes. It illustrates fixed deposits, equity, money market, gold, and bonds that help in understanding allocation in portfolio systematically. Showcasing this set of slides titled Investment Portfolio Fund Resource Allocation Chart Summary PDF. The topics addressed in these templates are Money Market, Equity, Fixed Deposits. All the content presented in this PPT design is completely editable. Download it and make adjustments in color, background, font etc. as per your unique business setting.
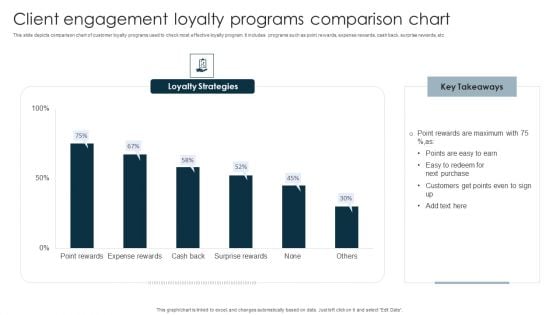
Client Engagement Loyalty Programs Comparison Chart Infographics PDF
This slide depicts comparison chart of customer loyalty programs used to check most effective loyalty program. It includes programs such as point rewards, expense rewards, cash back, surprise rewards, etc. Pitch your topic with ease and precision using this Client Engagement Loyalty Programs Comparison Chart Infographics PDF. This layout presents information on Point Rewards, Next Purchase, Customers. It is also available for immediate download and adjustment. So, changes can be made in the color, design, graphics or any other component to create a unique layout.
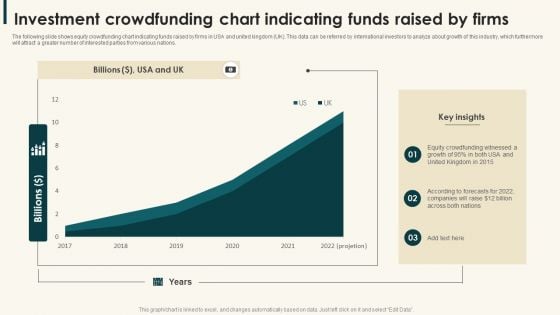
Investment Crowdfunding Chart Indicating Funds Raised By Firms Demonstration PDF
The following slide shows equity crowdfunding chart indicating funds raised by firms in USA and united kingdom UK. This data can be referred by international investors to analyze about growth of this industry, which furthermore will attract a greater number of interested parties from various nations.Showcasing this set of slides titled Investment Crowdfunding Chart Indicating Funds Raised By Firms Demonstration PDF. The topics addressed in these templates are Crowdfunding Witnessed, United Kingdom, Companies Raise. All the content presented in this PPT design is completely editable. Download it and make adjustments in color, background, font etc. as per your unique business setting.
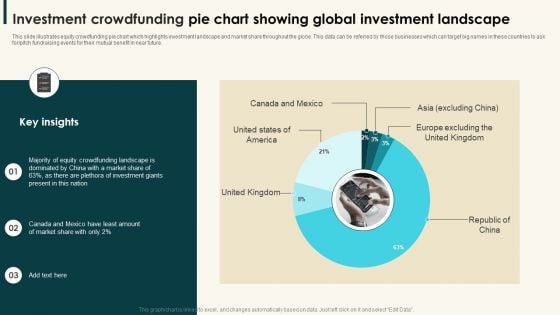
Investment Crowdfunding Pie Chart Showing Global Investment Landscape Structure PDF
This slide illustrates equity crowdfunding pie chart which highlights investment landscape and market share throughout the globe. This data can be referred by those businesses which can target big names in these countries to ask foror pitch fundraising events for their mutual benefit in near future.Showcasing this set of slides titled Investment Crowdfunding Pie Chart Showing Global Investment Landscape Structure PDF. The topics addressed in these templates are Europe Excluding, Equity Crowdfunding, Investment Giants. All the content presented in this PPT design is completely editable. Download it and make adjustments in color, background, font etc. as per your unique business setting.
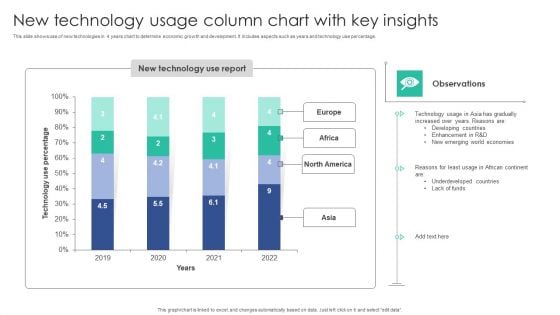
New Technology Usage Column Chart With Key Insights Brochure PDF
This slide shows use of new technologies in 4 years chart to determine economic growth and development. It Includes aspects such as years and technology use percentage.Pitch your topic with ease and precision using this New Technology Usage Column Chart With Key Insights Brochure PDF. This layout presents information on Technology Gradually, Increased Reasons, Developing Countries. It is also available for immediate download and adjustment. So, changes can be made in the color, design, graphics or any other component to create a unique layout.
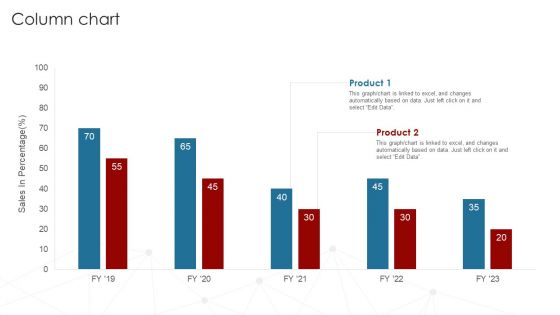
Deployment Of Business Process Column Chart Ppt Infographics Smartart PDF
Get a simple yet stunning designed Deployment Of Business Process Column Chart Ppt Infographics Smartart PDF. It is the best one to establish the tone in your meetings. It is an excellent way to make your presentations highly effective. So, download this PPT today from Slidegeeks and see the positive impacts. Our easy-to-edit Deployment Of Business Process Column Chart Ppt Infographics Smartart PDF can be your go-to option for all upcoming conferences and meetings. So, what are you waiting for Grab this template today.
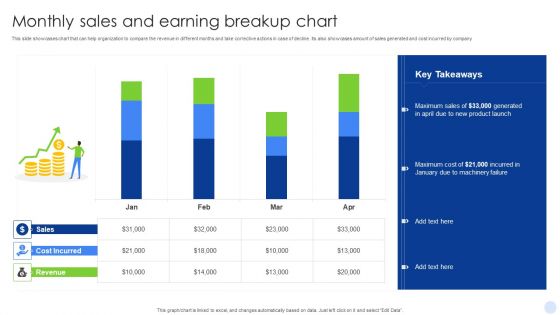
Monthly Sales And Earning Breakup Chart Clipart PDF
This slide showcases chart that can help organization to compare the revenue in different months and take corrective actions in case of decline. Its also showcases amount of sales generated and cost incurred by company. Showcasing this set of slides titled Monthly Sales And Earning Breakup Chart Clipart PDF. The topics addressed in these templates are New Product Launch, Machinery Failure. All the content presented in this PPT design is completely editable. Download it and make adjustments in color, background, font etc. as per your unique business setting.
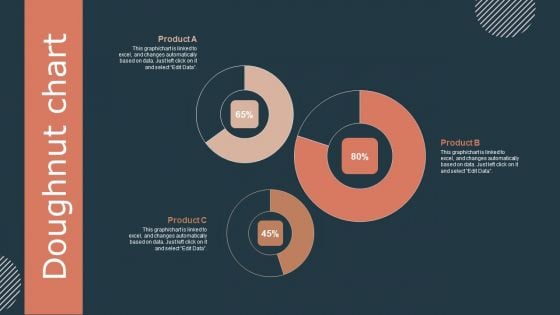
Effective Workforce Participation Action Planning Doughnut Chart Clipart PDF
Get a simple yet stunning designed Effective Workforce Participation Action Planning Doughnut Chart Clipart PDF. It is the best one to establish the tone in your meetings. It is an excellent way to make your presentations highly effective. So, download this PPT today from Slidegeeks and see the positive impacts. Our easy to edit Effective Workforce Participation Action Planning Doughnut Chart Clipart PDF can be your go to option for all upcoming conferences and meetings. So, what are you waiting for Grab this template today.
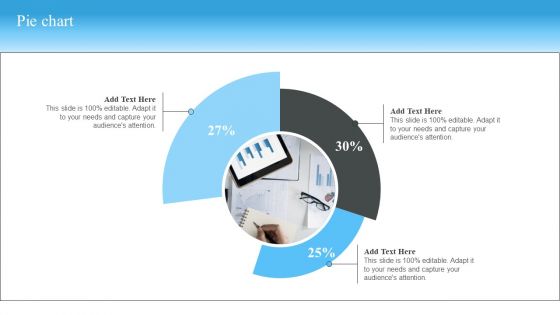
Market Evaluation Of IT Industry Pie Chart Formats PDF
Explore a selection of the finest Market Evaluation Of IT Industry Pie Chart Formats PDF here. With a plethora of professionally designed and pre made slide templates, you can quickly and easily find the right one for your upcoming presentation. You can use our Market Evaluation Of IT Industry Pie Chart Formats PDF to effectively convey your message to a wider audience. Slidegeeks has done a lot of research before preparing these presentation templates. The content can be personalized and the slides are highly editable. Grab templates today from Slidegeeks.
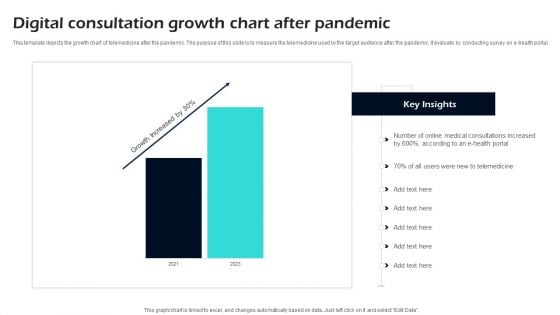
Digital Consultation Growth Chart After Pandemic Ppt Slides
This template depicts the growth chart of telemedicine after the pandemic. The purpose of this slide is to measure the telemedicine used by the target audience after the pandemic. It evaluate by conducting survey on e health portal Showcasing this set of slides titled Digital Consultation Growth Chart After Pandemic Ppt Slides. The topics addressed in these templates are Consultation, Growth, Pandemic. All the content presented in this PPT design is completely editable. Download it and make adjustments in color, background, font etc. as per your unique business setting.
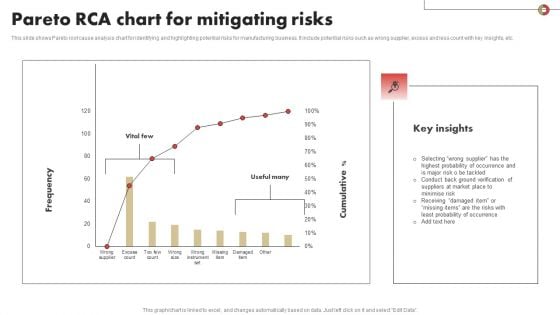
Pareto RCA Chart For Mitigating Risks Slides PDF
This slide shows Pareto root cause analysis chart for identifying and highlighting potential risks for manufacturing business. It include potential risks such as wrong supplier, excess and less count with key insights, etc. Pitch your topic with ease and precision using this Pareto RCA Chart For Mitigating Risks Slides PDF Download. This layout presents information on Mitigating, Pareto, Probability. It is also available for immediate download and adjustment. So, changes can be made in the color, design, graphics or any other component to create a unique layout.
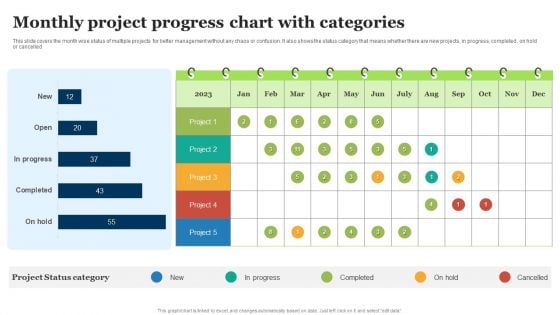
Monthly Project Progress Chart With Categories Ppt Professional Outfit PDF
This slide covers the month wise status of multiple projects for better management without any chaos or confusion. It also shows the status category that means whether there are new projects, in progress, completed , on hold or cancelled. Pitch your topic with ease and precision using this Monthly Project Progress Chart With Categories Ppt Professional Outfit PDF. This layout presents information on Project Status Category, Completed, Progress. It is also available for immediate download and adjustment. So, changes can be made in the color, design, graphics or any other component to create a unique layout.
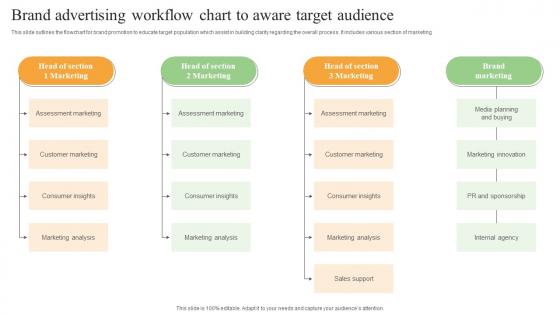
Brand Advertising Workflow Chart To Aware Target Audience Formats Pdf
This slide outlines the flowchart for brand promotion to educate target population which assist in building clarity regarding the overall process. It includes various section of marketing. Pitch your topic with ease and precision using this Brand Advertising Workflow Chart To Aware Target Audience Formats Pdf. This layout presents information on Marketing, Assessment Marketing, Customer Marketing. It is also available for immediate download and adjustment. So, changes can be made in the color, design, graphics or any other component to create a unique layout. This slide outlines the flowchart for brand promotion to educate target population which assist in building clarity regarding the overall process. It includes various section of marketing.
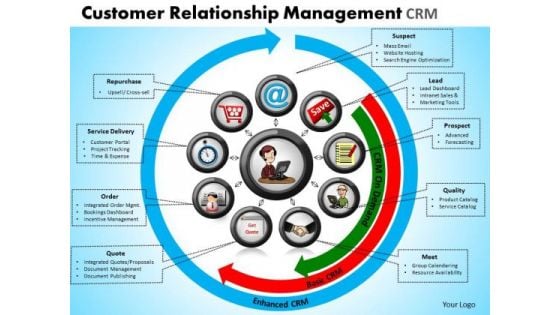
Business Circle Charts PowerPoint Templates Success Customer Relationship Management Ppt Slides
Business Circle Charts PowerPoint Templates Success customer relationship management PPT Slides-CRM systems are designed to help you identify, acquire and retain customers.This diagram demonstrates how the roles in the company work together to perform .-Business Circle Charts PowerPoint Templates Success customer relationship management PPT Slides-This template can be used for presentations relating to Analysis, Brainstorming, Business, Chart, Concept, Creative, Creativity, Crm, Customer, Diagram, Executive, Flowchart,Hand, Idea, Inspire, Interface, Layout, Legal, Management, Manager, Meeting, Note, Office, Pen, Plan, Presentation, Program, Relationship, Student, Teach, Teamwork, Technical Be expressive with our Business Circle Charts PowerPoint Templates Success Customer Relationship Management Ppt Slides. Bring in feeling to your thoughts.

Project Change Management Team Org Chart Digital Project Management Strategies
This slide represents details related to org chart of project change management team. It includes details related to steering committee, sponsor, project security officer, etc. Get a simple yet stunning designed Project Change Management Team Org Chart Digital Project Management Strategies. It is the best one to establish the tone in your meetings. It is an excellent way to make your presentations highly effective. So, download this PPT today from Slidegeeks and see the positive impacts. Our easy-to-edit Project Change Management Team Org Chart Digital Project Management Strategies can be your go-to option for all upcoming conferences and meetings. So, what are you waiting for Grab this template today. This slide represents details related to org chart of project change management team. It includes details related to steering committee, sponsor, project security officer, etc.
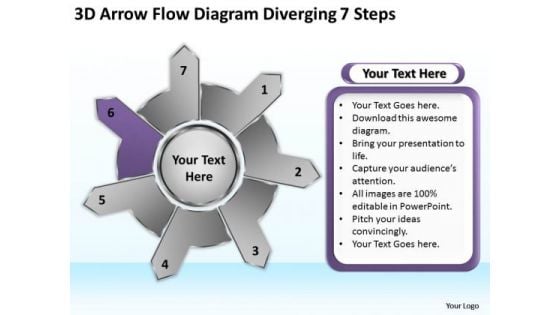
3d Arrow Flow Diagram Diverging 7 Steps Ppt Relative Cycle PowerPoint Slides
We present our 3d arrow flow diagram diverging 7 steps ppt Relative Cycle PowerPoint Slides.Use our Marketing PowerPoint Templates because they help to lay the base of your trend of thought. Use our Circle Charts PowerPoint Templates because they have fired the dreams of many fertile minds. Download our Process and Flows PowerPoint Templates because your business and plans for its growth consist of processes that are highly co-related. Download and present our Success PowerPoint Templates because the choices you make today will determine the future growth of your enterprise. Download and present our Business PowerPoint Templates because this template can project the path to sucess that you have charted.Use these PowerPoint slides for presentations relating to Access, arrow, background,banner, blue, bright, business, chart,circle, color, colorful, concept,conceptual, connection, corporate,creative, cycle, design, different, element,empty, form, frame, graphic, green,group, idea, illustration, match,message, order, part, piece, place,process, red, shape, solution, special,speech, strategy, symbol. The prominent colors used in the PowerPoint template are Purple, White, Gray. The feedback we get is that our 3d arrow flow diagram diverging 7 steps ppt Relative Cycle PowerPoint Slides are visually appealing. The feedback we get is that our background PowerPoint templates and PPT Slides are Lush. Presenters tell us our 3d arrow flow diagram diverging 7 steps ppt Relative Cycle PowerPoint Slides are Magical. The feedback we get is that our business PowerPoint templates and PPT Slides are the best it can get when it comes to presenting. PowerPoint presentation experts tell us our 3d arrow flow diagram diverging 7 steps ppt Relative Cycle PowerPoint Slides are Breathtaking. Customers tell us our banner PowerPoint templates and PPT Slides are Romantic. The corporate world can be fiercely competitive. Battle it out with our 3d Arrow Flow Diagram Diverging 7 Steps Ppt Relative Cycle PowerPoint Slides.
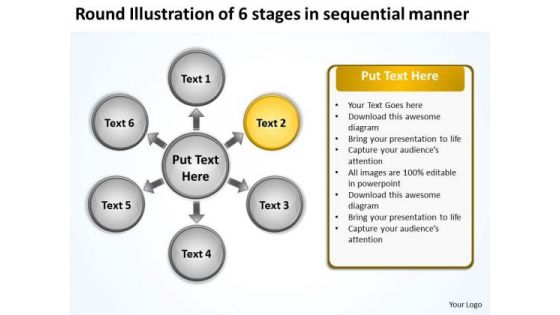
Illustration Of 6 Stages In Sequential Manner Circular Diagram PowerPoint Templates
We present our illustration of 6 stages in sequential manner Circular Diagram PowerPoint templates.Use our Process and Flows PowerPoint Templates because the concept and strategy is your strength. Download and present our Circle Charts PowerPoint Templates because it Saves your time as a prized possession, an ideal aid to give an ideal presentation. Download our Business PowerPoint Templates because you are ready to flap your wings and launch off. All poised are you to touch the sky with glory. Use our Marketing PowerPoint Templates because watching them will strengthen your companys sinews. Present our Future PowerPoint Templates because let this slide illustrates others piggyback on you to see well over the horizon.Use these PowerPoint slides for presentations relating to Access, arrow, blue, bright, business, chart,circle, color, colorful, concept,conceptual, connection, corporate,creative, cycle, design, different, element,empty, flower, form, frame, graphic,green, group, idea, illustration, match,message, order, part, piece, place,process, red, shape, solution, special,speech, strategy, symbol,. The prominent colors used in the PowerPoint template are Yellow, White, Black. Customers tell us our illustration of 6 stages in sequential manner Circular Diagram PowerPoint templates are Fabulous. Customers tell us our color PowerPoint templates and PPT Slides are Charming. Customers tell us our illustration of 6 stages in sequential manner Circular Diagram PowerPoint templates are Cheerful. People tell us our blue PowerPoint templates and PPT Slides are Dynamic. Customers tell us our illustration of 6 stages in sequential manner Circular Diagram PowerPoint templates will impress their bosses and teams. Customers tell us our circle PowerPoint templates and PPT Slides are Luxuriant. Our environment needs our care. Convey your concern with our Illustration Of 6 Stages In Sequential Manner Circular Diagram PowerPoint Templates.
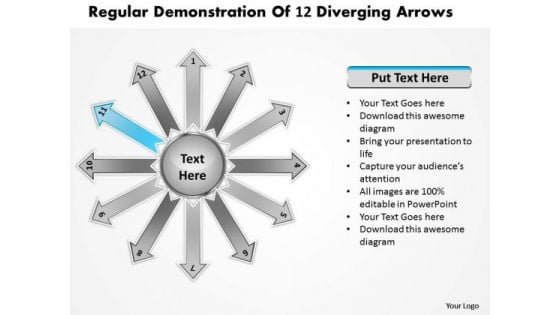
Regular Demonstration Of 12 Diverging Arrows Ppt Cycle Layout Diagram PowerPoint Templates
We present our regular demonstration of 12 diverging arrows ppt Cycle Layout Diagram PowerPoint templates.Download and present our Flow Charts PowerPoint Templates because this slide shows each path to the smallest detail. Download and present our Arrows PowerPoint Templates because you have the product you need. Use our Process and flows PowerPoint Templates because in this Slide Various threads are joining up and being stitched together providing necessary strength Now you have to take the last leap. Use our Shapes PowerPoint Templates because it Shines the light on your thoughts and motivates your team to improve the quality of celebration for all around you. Download our Business PowerPoint Templates because this template can project the path to sucess that you have charted.Use these PowerPoint slides for presentations relating to Arrow, background, banner,concept,creative, design, direction, flow, ten,illustration, infographic, instruction, label,layout, manual, marketing, modern, next,number, offer, one, options, order,pointer, process, product,promotion, sequence, simple, special,step, symbol. The prominent colors used in the PowerPoint template are Blue, Black, White. Customers tell us our regular demonstration of 12 diverging arrows ppt Cycle Layout Diagram PowerPoint templates are Vintage. We assure you our direction PowerPoint templates and PPT Slides are Clever. PowerPoint presentation experts tell us our regular demonstration of 12 diverging arrows ppt Cycle Layout Diagram PowerPoint templates will help you be quick off the draw. Just enter your specific text and see your points hit home. People tell us our concept PowerPoint templates and PPT Slides are Elegant. We assure you our regular demonstration of 12 diverging arrows ppt Cycle Layout Diagram PowerPoint templates are Bold. Use our direction PowerPoint templates and PPT Slides are Youthful. Our Regular Demonstration Of 12 Diverging Arrows Ppt Cycle Layout Diagram PowerPoint Templates are quite elevating.They help you ascend the ladder of success.
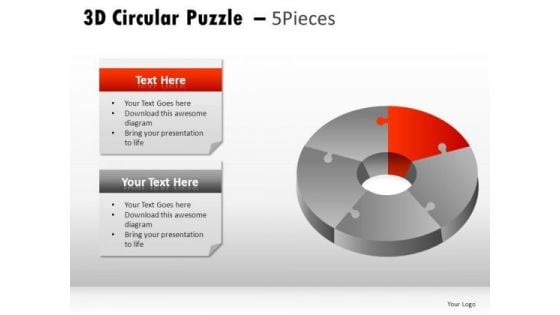
Segment 3d Circular Puzzle 5 Pieces PowerPoint Slides And Ppt Diagram Templates
Segment 3D Circular Puzzle 5 Pieces PowerPoint Slides And PPT Diagram Templates-These high quality powerpoint pre-designed slides and powerpoint templates have been carefully created by our professional team to help you impress your audience. All slides have been created and are 100% editable in powerpoint. Each and every property of any graphic - color, size, orientation, shading, outline etc. can be modified to help you build an effective powerpoint presentation. Any text can be entered at any point in the powerpoint template or slide. Simply DOWNLOAD, TYPE and PRESENT! Create a blueprint for your factory. Arrive at an apt design with our Segment 3d Circular Puzzle 5 Pieces PowerPoint Slides And Ppt Diagram Templates.
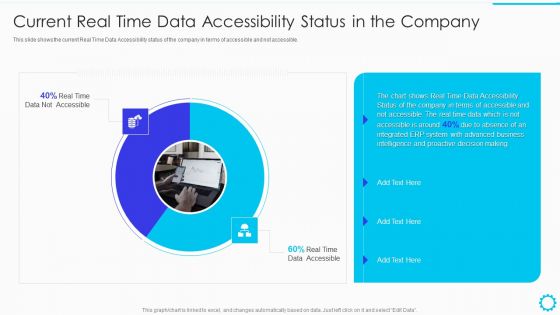
Summary Of Cloud Erp System Framework Current Real Time Data Accessibility Status In The Company Brochure PDF
This slide shows the current Real Time Data Accessibility status of the company in terms of accessible and not accessible.Deliver and pitch your topic in the best possible manner with this Summary Of Cloud Erp System Framework Current Real Time Data Accessibility Status In The Company Brochure PDF Use them to share invaluable insights on Current Real Time Data Accessibility Status In The Company and impress your audience. This template can be altered and modified as per your expectations. So, grab it now.
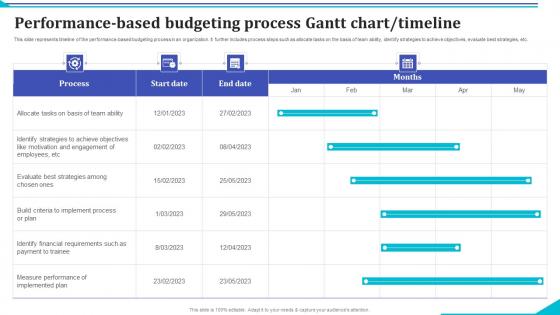
Performance Based Budgeting Process Gantt Chart Timeline Rules Pdf
This slide represents timeline of the performance based budgeting process in an organization. It further includes process steps such as allocate tasks on the basis of team ability, identify strategies to achieve objectives, evaluate best strategies, etc.Showcasing this set of slides titled Performance Based Budgeting Process Gantt Chart Timeline Rules Pdf The topics addressed in these templates are Build Criteria, Implement Process, Identify Financial Requirements, Payment Trainee All the content presented in this PPT design is completely editable. Download it and make adjustments in color, background, font etc. as per your unique business setting. This slide represents timeline of the performance based budgeting process in an organization. It further includes process steps such as allocate tasks on the basis of team ability, identify strategies to achieve objectives, evaluate best strategies, etc.
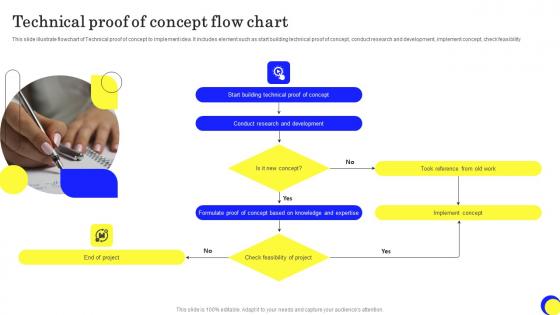
Technical Proof Of Concept Flow Chart Ppt Outline Pdf
This slide illustrate flowchart of Technical proof of concept to implement idea. It includes element such as start building technical proof of concept, conduct research and development, implement concept, check feasibility. Showcasing this set of slides titled Technical Proof Of Concept Flow Chart Ppt Outline Pdf. The topics addressed in these templates are Conduct Research, Development, Implement Concept, Check Feasibility. All the content presented in this PPT design is completely editable. Download it and make adjustments in color, background, font etc. as per your unique business setting. This slide illustrate flowchart of Technical proof of concept to implement idea. It includes element such as start building technical proof of concept, conduct research and development, implement concept, check feasibility.
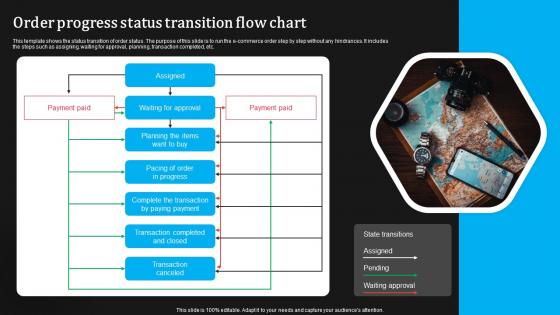
Order Progress Status Transition Flow Chart Formats Pdf
This template shows the status transition of order status. The purpose of this slide is to run the e commerce order step by step without any hindrances. It includes the steps such as assigning, waiting for approval, planning, transaction completed, etc.Pitch your topic with ease and precision using this Order Progress Status Transition Flow Chart Formats Pdf This layout presents information on Waiting Approval, Transaction Completed, Complete Transaction It is also available for immediate download and adjustment. So, changes can be made in the color, design, graphics or any other component to create a unique layout. This template shows the status transition of order status. The purpose of this slide is to run the e commerce order step by step without any hindrances. It includes the steps such as assigning, waiting for approval, planning, transaction completed, etc.
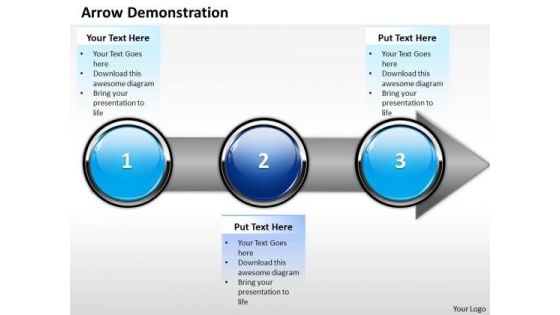
Ppt Consecutive Description Of Banking Process Using 3 State Diagram PowerPoint Templates
PPT consecutive description of banking process using 3 state diagram PowerPoint Templates-With this pre-designed process arrows diagram you can visualize almost any type of concept, chronological process or steps of your strategies.-PPT consecutive description of banking process using 3 state diagram PowerPoint Templates-Arrow, Bank, Benefit, Business, Calculate, Calculation, Capitalist, Communication, Company, Concern, Connection, Data, Diagram, Digital, Drawing, Earnings, Economic, Finance, Financial, Flow, Forecast, Gain, Goal, Graph, Growth, Illustration, Increase, Information, Interest, Investing, Management, Market, Money, Move, Network, Objective, Plan, Process, Profit, Progress, Report, Rise, Risk, Shares, Statistics, Stock, System, Technology Turn the heat up with our Ppt Consecutive Description Of Banking Process Using 3 State Diagram PowerPoint Templates. Make sure your presentation gets the attention it deserves.
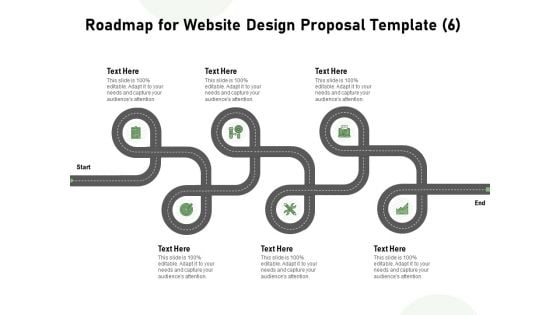
Web Designing Roadmap For Website Design Proposal Template Six Stage Process Ppt Outline Diagrams PDF
Presenting this set of slides with name web designing roadmap for website design proposal template six stage process ppt outline diagrams pdf. This is a six stage process. The stages in this process are roadmap, website design. This is a completely editable PowerPoint presentation and is available for immediate download. Download now and impress your audience.
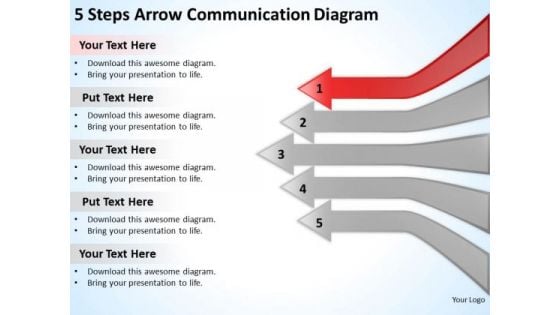
5 Steps Arrow Communication Diagram Cell Phone Business Plans PowerPoint Slides
We present our 5 steps arrow communication diagram cell phone business plans PowerPoint Slides.Download and present our Process and Flows PowerPoint Templates because Watching this your Audience will Grab their eyeballs, they wont even blink. Use our Flow charts PowerPoint Templates because You can Inspire your team with our PowerPoint Templates and Slides. Let the force of your ideas flow into their minds. Present our Arrows PowerPoint Templates because Our PowerPoint Templates and Slides are the chords of your song. String them along and provide the lilt to your views. Use our Marketing PowerPoint Templates because Your audience will believe you are the cats whiskers. Download and present our Shapes PowerPoint Templates because Our PowerPoint Templates and Slides will definately Enhance the stature of your presentation. Adorn the beauty of your thoughts with their colourful backgrounds.Use these PowerPoint slides for presentations relating to Arrow, business, chart,steps, diagram, drop, isometric, perspective, steps flows, point, process, reflection, set, shadow, silver, process and flows, flow charts, process charts, shapes, colorful arrows, white, gray, arrow process. The prominent colors used in the PowerPoint template are Red, Gray, White. You can be sure our 5 steps arrow communication diagram cell phone business plans PowerPoint Slides are the best it can get when it comes to presenting. You can be sure our isometric PowerPoint templates and PPT Slides will make the presenter look like a pro even if they are not computer savvy. Professionals tell us our 5 steps arrow communication diagram cell phone business plans PowerPoint Slides have awesome images to get your point across. Presenters tell us our steps PowerPoint templates and PPT Slides look good visually. The feedback we get is that our 5 steps arrow communication diagram cell phone business plans PowerPoint Slides are incredible easy to use. You can be sure our perspective PowerPoint templates and PPT Slides are designed to make your presentations professional. Continue growing with our 5 Steps Arrow Communication Diagram Cell Phone Business Plans PowerPoint Slides. Download without worries with our money back guaranteee.
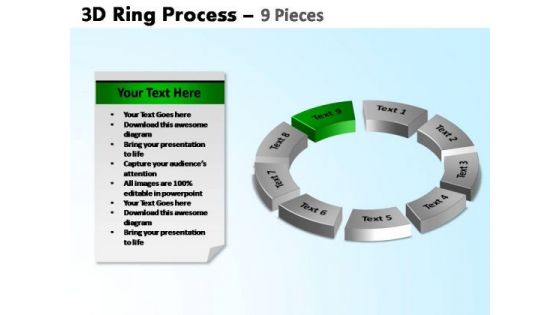
PowerPoint Presentation Designs Success Ring Process Ppt Presentation
PowerPoint Presentation Designs Success ring process PPT Presentation-The Circle of Life - a concept emmbedded in our minds and hence easy to comprehend. Life and Business is made up of processes comprising stages that flow from one to another. An excellent graphic to attract the attention of and understanding by your audience to improve earnings.-These amazing PowerPoint pre-designed slides and PowerPoint templates have been carefully created by our team of experts to help you impress your audience. Our stunning collection of Powerpoint slides are 100% editable and can easily fit in any PowerPoint presentations. By using these animations and graphics in PowerPoint and you can easily make professional presentations. Any text can be entered at any point in the PowerPoint template or slide. Just DOWNLOAD our awesome PowerPoint templates and you are ready to go. Ideas flow fast with our PowerPoint Presentation Designs Success Ring Process Ppt Presentation. Make ambitions flourish with your advice.
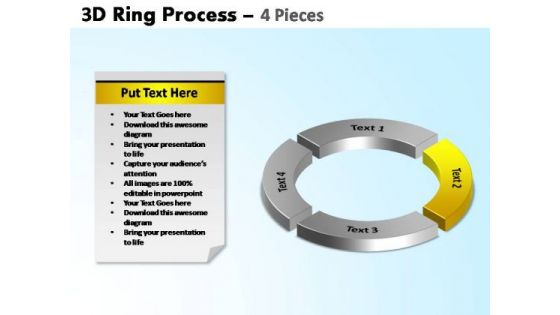
PowerPoint Slide Designs Process Ring Process Ppt Presentation
PowerPoint Slide Designs Process ring process PPT Presentation-The Circle of Life - a concept emmbedded in our minds and hence easy to comprehend. Life and Business is made up of processes comprising stages that flow from one to another. An excellent graphic to attract the attention of and understanding by your audience to improve earnings.-These amazing PowerPoint pre-designed slides and PowerPoint templates have been carefully created by our team of experts to help you impress your audience. Our stunning collection of Powerpoint slides are 100% editable and can easily fit in any PowerPoint presentations. By using these animations and graphics in PowerPoint and you can easily make professional presentations. Any text can be entered at any point in the PowerPoint template or slide. Just DOWNLOAD our awesome PowerPoint templates and you are ready to go. Build on your charisma with our PowerPoint Slide Designs Process Ring Process Ppt Presentation. Create a definite aura around you.
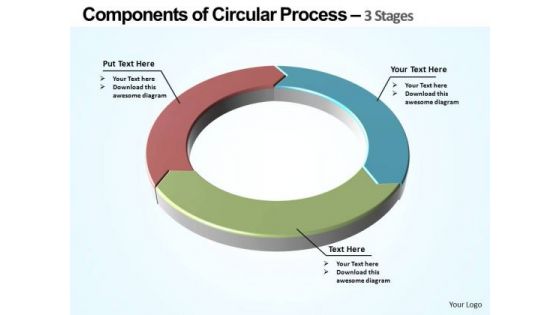
PowerPoint Presentation Designs Sales Components Of Circular Ppt Slide
PowerPoint Presentation Designs Sales Components of Circular PPT Slide-The Circle of Life - a concept emmbedded in our minds and hence easy to comprehend. Life and Business is made up of processes comprising stages that flow from one to another. An excellent graphic to attract the attention of and understanding by your audience to improve earnings.-These amazing PowerPoint pre-designed slides and PowerPoint templates have been carefully created by our team of experts to help you impress your audience. Our stunning collection of Powerpoint slides are 100% editable and can easily fit in any PowerPoint presentations. By using these animations and graphics in PowerPoint and you can easily make professional presentations. Any text can be entered at any point in the PowerPoint template or slide. Just DOWNLOAD our awesome PowerPoint templates and you are ready to go. Our PowerPoint Presentation Designs Sales Components Of Circular Ppt Slide make the audience ache for more. They will ask for your views again and again.


 Continue with Email

 Home
Home


