Construction Icons
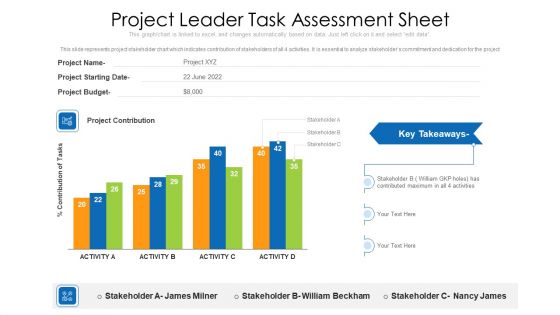
Project Leader Task Assessment Sheet Ppt PowerPoint Presentation Gallery Outline PDF
This slide represents project stakeholder chart which indicates contribution of stakeholders of all 4 activities. It is essential to analyze stakeholders commitment and dedication for the project. Pitch your topic with ease and precision using this project leader task assessment sheet ppt powerpoint presentation gallery outline pdf. This layout presents information on project leader task assessment sheet. It is also available for immediate download and adjustment. So, changes can be made in the color, design, graphics or any other component to create a unique layout.
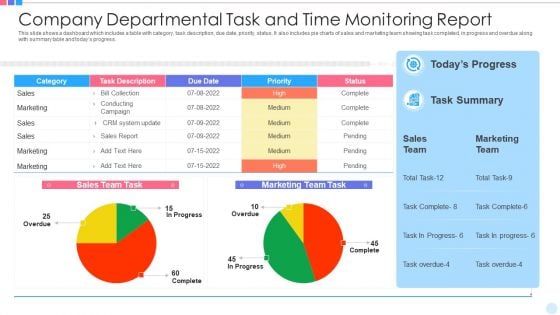
Company Departmental Task And Time Monitoring Report Clipart PDF
This slide shows a dashboard which includes a table with category, task description, due date, priority, status. It also includes pie charts of sales and marketing team showing task completed, in progress and overdue along with summary table and todays progress. Showcasing this set of slides titled company departmental task and time monitoring report clipart pdf. The topics addressed in these templates are system, sales, marketing. All the content presented in this PPT design is completely editable. Download it and make adjustments in color, background, font etc. as per your unique business setting.
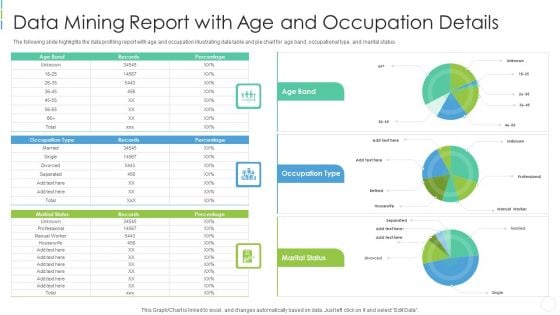
Data Mining Report With Age And Occupation Details Background PDF
The following slide highlights the data profiling report with age and occupation illustrating data table and pie chart for age band, occupational type, and marital status Showcasing this set of slides titled data mining report with age and occupation details background pdf . The topics addressed in these templates are data mining report with age and occupation details . All the content presented in this PPT design is completely editable. Download it and make adjustments in color, background, font etc. as per your unique business setting.
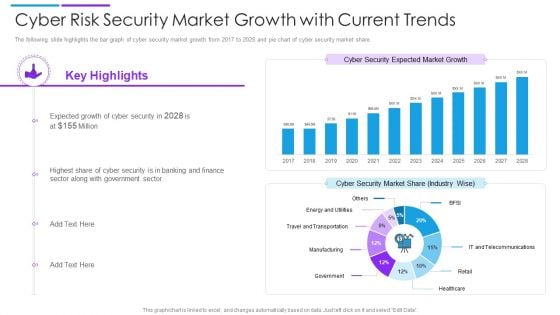
Cyber Risk Security Market Growth With Current Trends Summary PDF
The following slide highlights the bar graph of cyber security market growth from 2017 to 2028 and pie chart of cyber security market share. Showcasing this set of slides titled cyber risk security market growth with current trends summary pdf. The topics addressed in these templates are cyber security market share, cyber security expected market growth, banking and finance. All the content presented in this PPT design is completely editable. Download it and make adjustments in color, background, font etc. as per your unique business setting.
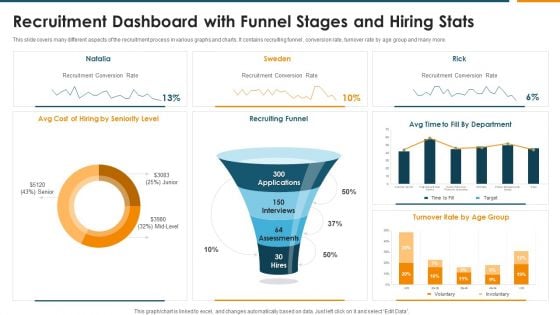
Recruitment Dashboard With Funnel Stages And Hiring Stats Rules PDF
This slide covers many different aspects of the recruitment process in various graphs and charts. It contains recruiting funnel , conversion rate, turnover rate by age group and many more. Pitch your topic with ease and precision using this Recruitment Dashboard With Funnel Stages And Hiring Stats Rules PDF. This layout presents information on Recruiting Funnel, Recruitment Conversion Rate, Seniority Level. It is also available for immediate download and adjustment. So, changes can be made in the color, design, graphics or any other component to create a unique layout.
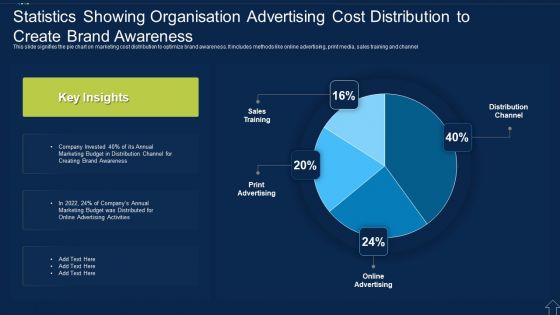
Statistics Showing Organisation Advertising Cost Distribution To Create Brand Awareness Slides PDF
This slide signifies the pie chart on marketing cost distribution to optimize brand awareness. It includes methods like online advertising, print media, sales training and channel.Showcasing this set of slides titled Statistics Showing Organisation Advertising Cost Distribution To Create Brand Awareness Slides PDF The topics addressed in these templates are Creating Brand Awareness, Marketing Budget, Advertising Activities All the content presented in this PPT design is completely editable. Download it and make adjustments in color, background, font etc. as per your unique business setting.
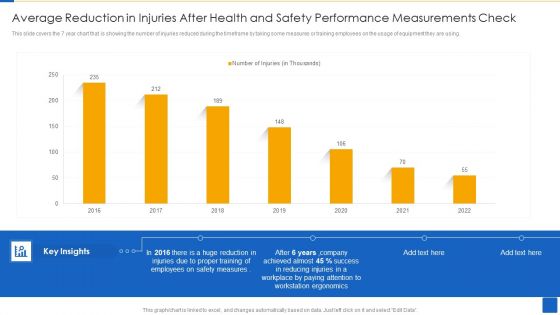
Average Reduction In Injuries After Health And Safety Performance Measurements Check Template PDF
This slide covers the 7 year chart that is showing the number of injuries reduced during the timeframe by taking some measures or training employees on the usage of equipment they are using. Showcasing this set of slides titled Average Reduction In Injuries After Health And Safety Performance Measurements Check Template PDF The topics addressed in these templates are Employees Safety Measures, Workstation Ergonomics, Workplace Paying Attention All the content presented in this PPT design is completely editable. Download it and make adjustments in color, background, font etc. as per your unique business setting.
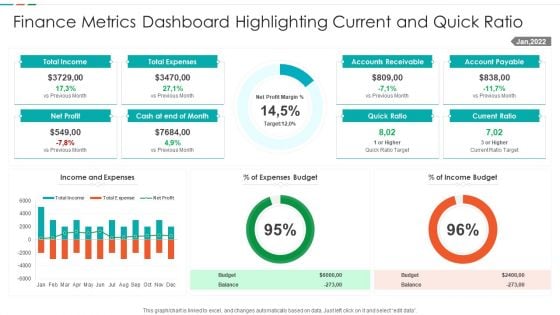
Finance Metrics Dashboard Highlighting Current And Quick Ratio Template PDF
This graph or chart is linked to excel, and changes automatically based on data. Just left click on it and select edit data. Showcasing this set of slides titled Finance Metrics Dashboard Highlighting Current And Quick Ratio Template PDF. The topics addressed in these templates are Total Income Budget, Total Expenses Balance, Net Profit Quick, Ratio Current Ratio. All the content presented in this PPT design is completely editable. Download it and make adjustments in color, background, font etc. as per your unique business setting.
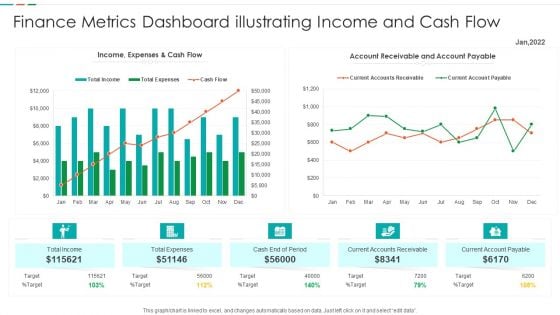
Finance Metrics Dashboard Illustrating Income And Cash Flow Template PDF
This graph or chart is linked to excel, and changes automatically based on data. Just left click on it and select edit data. Pitch your topic with ease and precision using this Finance Metrics Dashboard Illustrating Income And Cash Flow Template PDF. This layout presents information on Current Accounts Receivable, Current Account Payable, Cash End Period, Account Receivable Account. It is also available for immediate download and adjustment. So, changes can be made in the color, design, graphics or any other component to create a unique layout.
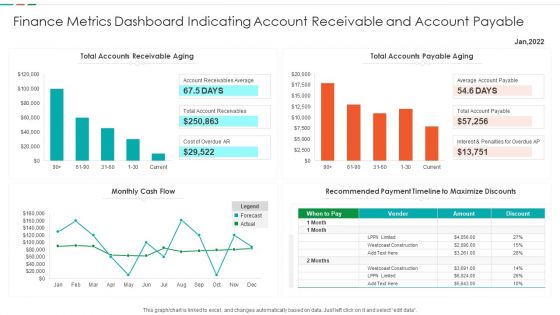
Finance Metrics Dashboard Indicating Account Receivable And Account Payable Demonstration PDF
This graph or chart is linked to excel, and changes automatically based on data. Just left click on it and select edit data. Showcasing this set of slides titled Finance Metrics Dashboard Indicating Account Receivable And Account Payable Demonstration PDF. The topics addressed in these templates are Total Accounts Receivable, Total Accounts Payable, Recommended Payment Timeline, Monthly Cash Flow. All the content presented in this PPT design is completely editable. Download it and make adjustments in color, background, font etc. as per your unique business setting.
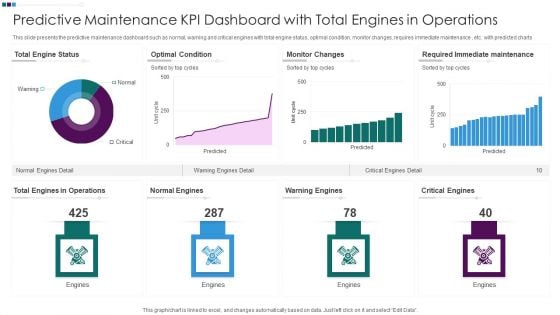
Predictive Maintenance KPI Dashboard With Total Engines In Operations Ppt Professional Inspiration PDF
This slide presents the predictive maintenance dashboard such as normal, warning and critical engines with total engine status, optimal condition, monitor changes, requires immediate maintenance , etc. with predicted charts. Pitch your topic with ease and precision using this Predictive Maintenance KPI Dashboard With Total Engines In Operations Ppt Professional Inspiration PDF. This layout presents information on Total Engine Status, Optimal Condition Monitor, Changes Warning Engines, Required Immediate Maintenance. It is also available for immediate download and adjustment. So, changes can be made in the color, design, graphics or any other component to create a unique layout.
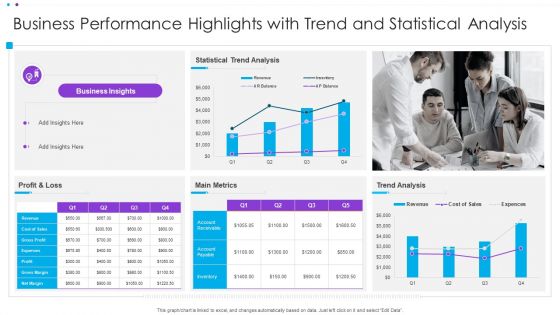
Business Performance Highlights With Trend And Statistical Analysis Ppt Infographic Template Display PDF
This graph or chart is linked to excel, and changes automatically based on data. Just left click on it and select Edit Data. Pitch your topic with ease and precision using this Business Performance Highlights With Trend And Statistical Analysis Ppt Infographic Template Display PDF. This layout presents information on Statistical Trend Analysis, Main Metrics, Profit And Loss. It is also available for immediate download and adjustment. So, changes can be made in the color, design, graphics or any other component to create a unique layout.
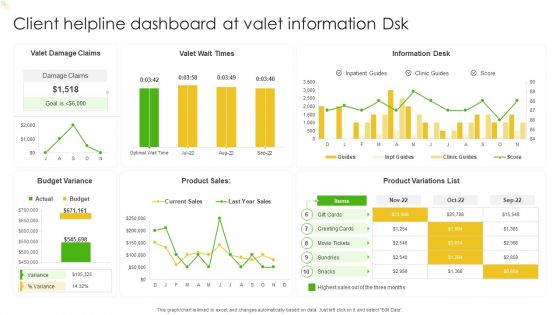
Client Helpline Dashboard At Valet Information Dsk Ppt Gallery Slide Portrait PDF
This graph or chart is linked to excel, and changes automatically based on data. Just left click on it and select Edit Data. Pitch your topic with ease and precision using this Client Helpline Dashboard At Valet Information Dsk Ppt Gallery Slide Portrait PDF. This layout presents information on Valet Damage Claims, Valet Wait Times, Information Desk. It is also available for immediate download and adjustment. So, changes can be made in the color, design, graphics or any other component to create a unique layout.
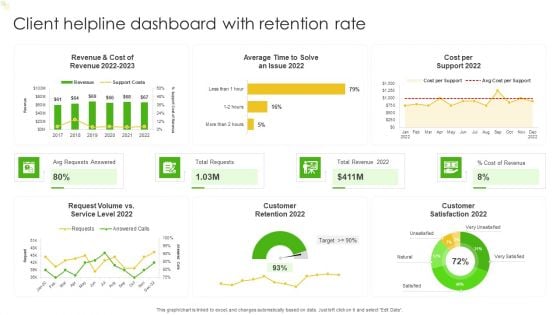
Client Helpline Dashboard With Retention Rate Ppt Gallery Ideas PDF
This graph or chart is linked to excel, and changes automatically based on data. Just left click on it and select Edit Data. Pitch your topic with ease and precision using this Client Helpline Dashboard With Retention Rate Ppt Gallery Ideas PDF. This layout presents information on Cost per Support 2022, Total Requests, Total Revenue 2022, Avg Requests Answered. It is also available for immediate download and adjustment. So, changes can be made in the color, design, graphics or any other component to create a unique layout.
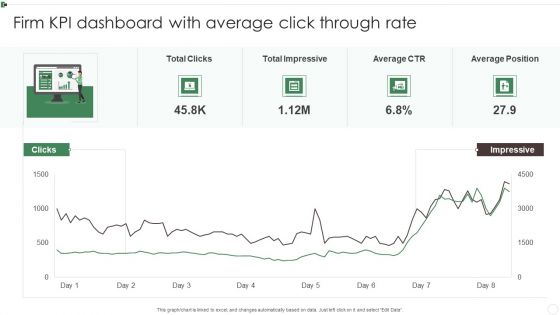
Firm KPI Dashboard With Average Click Through Rate Ppt Inspiration Sample PDF
This graph or chart is linked to excel, and changes automatically based on data. Just left click on it and select Edit Data. Pitch your topic with ease and precision using this Firm KPI Dashboard With Average Click Through Rate Ppt Inspiration Sample PDF. This layout presents information on Total Clicks, Total Impressive, Average CTR, Average Position. It is also available for immediate download and adjustment. So, changes can be made in the color, design, graphics or any other component to create a unique layout.

Firm KPI Dashboard With Schedule Performance Index Ppt Visual Aids PDF
This graph or chart is linked to excel, and changes automatically based on data. Just left click on it and select Edit Data. Pitch your topic with ease and precision using this Firm KPI Dashboard With Schedule Performance Index Ppt Visual Aids PDF. This layout presents information on Project Cost Performance, Project Planning Stage, Monitor And Control. It is also available for immediate download and adjustment. So, changes can be made in the color, design, graphics or any other component to create a unique layout.
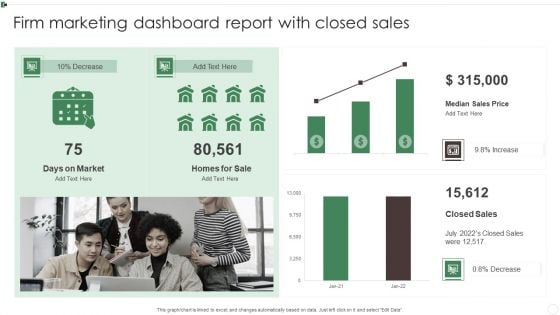
Firm Marketing Dashboard Report With Closed Sales Ppt Slides Graphics Example PDF
This graph or chart is linked to excel, and changes automatically based on data. Just left click on it and select Edit Data. Showcasing this set of slides titled Firm Marketing Dashboard Report With Closed Sales Ppt Slides Graphics Example PDF. The topics addressed in these templates are Days On Market, Homes For Sale, Median Sales Price, Closed Sales. All the content presented in this PPT design is completely editable. Download it and make adjustments in color, background, font etc. as per your unique business setting.
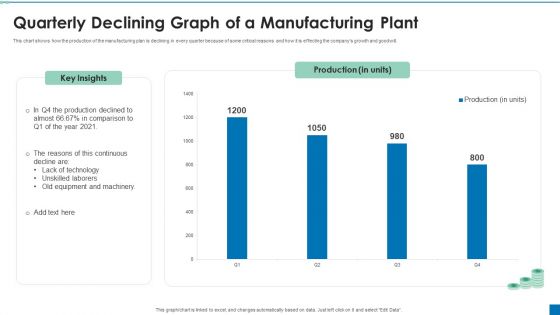
Quarterly Declining Graph Of A Manufacturing Plant Ppt PowerPoint Presentation File Example Topics PDF
This chart shows how the production of the manufacturing plan is declining in every quarter because of some critical reasons and how it is effecting the companys growth and goodwill. Showcasing this set of slides titled Quarterly Declining Graph Of A Manufacturing Plant Ppt PowerPoint Presentation File Example Topics PDF. The topics addressed in these templates are Production Declined, Lack Of Technology, Unskilled Laborers. All the content presented in this PPT design is completely editable. Download it and make adjustments in color, background, font etc. as per your unique business setting.
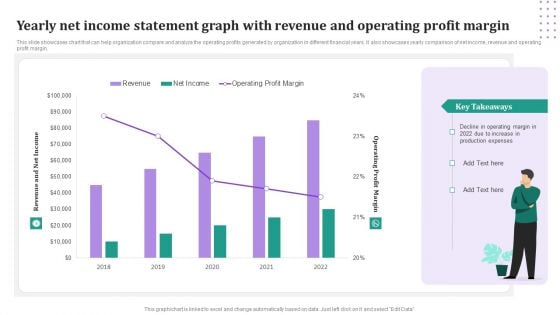
Yearly Net Income Statement Graph With Revenue And Operating Profit Margin Download PDF
This slide showcases chart that can help organization compare and analyze the operating profits generated by organization in different financial years. It also showcases yearly comparison of net income, revenue and operating profit margin. Pitch your topic with ease and precision using this Yearly Net Income Statement Graph With Revenue And Operating Profit Margin Download PDF. This layout presents information on Revenue, Net Income, Operating Profit Margin. It is also available for immediate download and adjustment. So, changes can be made in the color, design, graphics or any other component to create a unique layout.
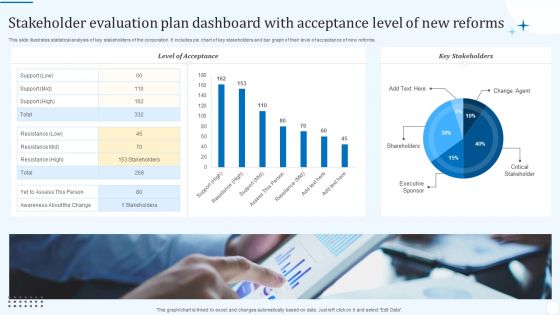
Stakeholder Evaluation Plan Dashboard With Acceptance Level Of New Reforms Background PDF
This slide illustrates statistical analysis of key stakeholders of the corporation. It includes pie chart of key stakeholders and bar graph of their level of acceptance of new reforms. Showcasing this set of slides titled Stakeholder Evaluation Plan Dashboard With Acceptance Level Of New Reforms Background PDF. The topics addressed in these templates are Level Acceptance, Key Stakeholders, Critical Stakeholder. All the content presented in this PPT design is completely editable. Download it and make adjustments in color, background, font etc. as per your unique business setting.
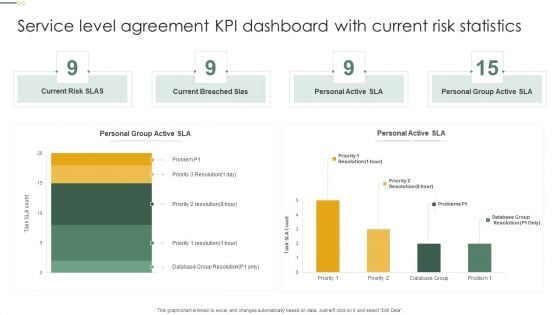
Service Level Agreement KPI Dashboard With Current Risk Statistics Topics PDF
This graph or chart is linked to excel, and changes automatically based on data. Just left click on it and select Edit Data. Pitch your topic with ease and precision using this Service Level Agreement KPI Dashboard With Current Risk Statistics Topics PDF. This layout presents information on Current Risk SLAS, Current Breached Slas, Personal Active SLA It is also available for immediate download and adjustment. So, changes can be made in the color, design, graphics or any other component to create a unique layout.
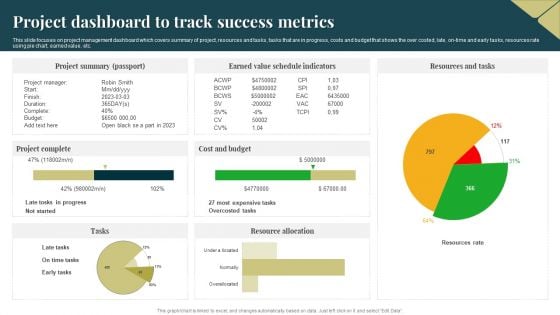
Project Dashboard To Track Success Metrics Background PDF
This slide focuses on project management dashboard which covers summary of project, resources and tasks, tasks that are in progress, costs and budget that shows the over costed, late, on time and early tasks, resources rate using pie chart, earned value, etc. Pitch your topic with ease and precision using this Project Dashboard To Track Success Metrics Background PDF. This layout presents information on Cost And Budget, Project Summary, Resource Allocation. It is also available for immediate download and adjustment. So, changes can be made in the color, design, graphics or any other component to create a unique layout.
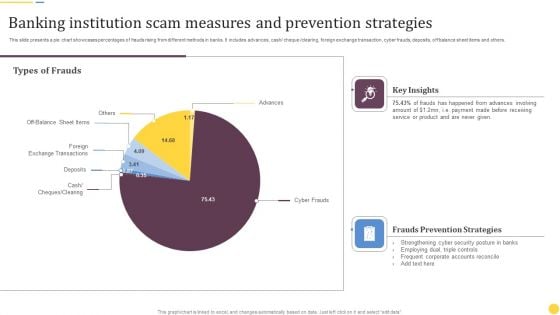
Banking Institution Scam Measures And Prevention Strategies Information PDF
This slide presents a pie chart showcases percentages of frauds rising from different methods in banks. It includes advances, cash or cheque or clearing, foreign exchange transaction, cyber frauds, deposits, off balance sheet items and others. Showcasing this set of slides titled Banking Institution Scam Measures And Prevention Strategies Information PDF. The topics addressed in these templates are Key Insights, Frauds Prevention Strategies, Types Of Frauds. All the content presented in this PPT design is completely editable. Download it and make adjustments in color, background, font etc. as per your unique business setting.
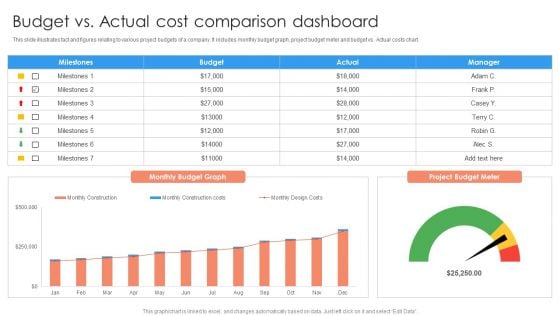
Budget Vs Actual Cost Comparison Dashboard Ppt PowerPoint Presentation Professional Format Ideas PDF
This slide illustrates fact and figures relating to various project budgets of a company. It includes monthly budget graph, project budget meter and budget vs. Actual costs chart.Pitch your topic with ease and precision using this Budget Vs Actual Cost Comparison Dashboard Ppt PowerPoint Presentation Professional Format Ideas PDF. This layout presents information on Milestones, Budget Graph, Manager. It is also available for immediate download and adjustment. So, changes can be made in the color, design, graphics or any other component to create a unique layout.
New Staff Onboarding Process KPI Tracking Dashboard Inspiration PDF
This slide showcase the KPI dashboard for tracking new hire onboarding completion progress. It includes KPIs such as onboarding completion status, employees per office, progress chart, hires starting in current and next week. Showcasing this set of slides titled New Staff Onboarding Process KPI Tracking Dashboard Inspiration PDF. The topics addressed in these templates are New Staff Onboarding Process, KPI Tracking Dashboard. All the content presented in this PPT design is completely editable. Download it and make adjustments in color, background, font etc. as per your unique business setting.
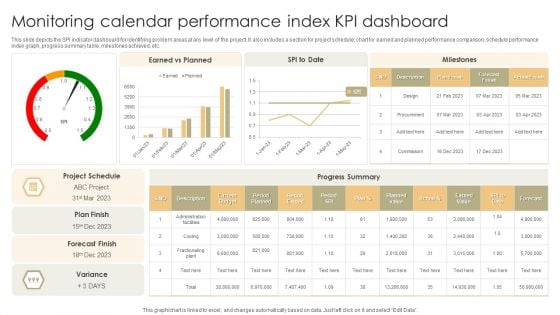
Monitoring Calendar Performance Index KPI Dashboard Slides PDF
This slide depicts the SPI indicator dashboard for identifying problem areas at any level of the project. It also includes a section for project schedule, chart for earned and planned performance comparison, schedule performance index graph, progress summary table, milestones achieved, etc. Pitch your topic with ease and precision using this Monitoring Calendar Performance Index KPI Dashboard Slides PDF. This layout presents information on Current Budget, Planned Value, Earned Value. It is also available for immediate download and adjustment. So, changes can be made in the color, design, graphics or any other component to create a unique layout.
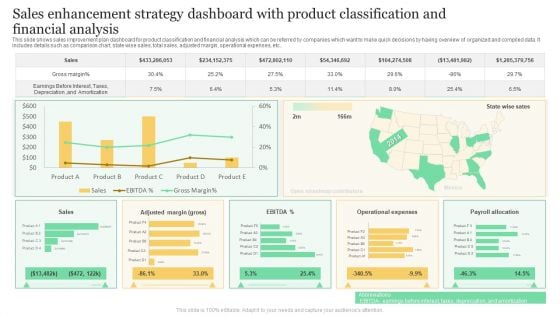
Sales Enhancement Strategy Dashboard With Product Classification And Financial Analysis Formats PDF
This slide shows sales improvement plan dashboard for product classification and financial analysis which can be referred by companies which want to make quick decisions by having overview of organized and compiled data. It includes details such as comparison chart, state wise sales, total sales, adjusted margin, operational expenses, etc. Showcasing this set of slides titled Sales Enhancement Strategy Dashboard With Product Classification And Financial Analysis Formats PDF. The topics addressed in these templates are Gross Margin, Sales, Operational Expenses. All the content presented in this PPT design is completely editable. Download it and make adjustments in color, background, font etc. as per your unique business setting.
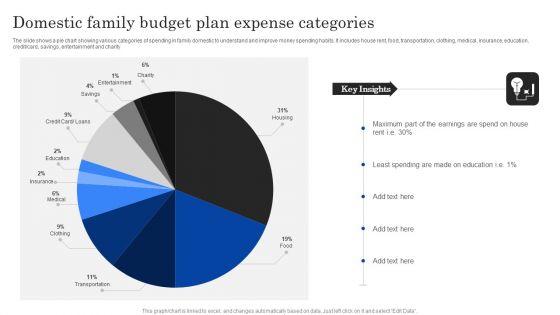
Domestic Family Budget Plan Expense Categories Ppt PowerPoint Presentation Styles Graphics Example PDF
The slide shows a pie chart showing various categories of spending in family domestic to understand and improve money spending habits. It includes house rent, food, transportation, clothing, medical, insurance, education, credit or card, savings, entertainment and charity.Showcasing this set of slides titled Domestic Family Budget Plan Expense Categories Ppt PowerPoint Presentation Styles Graphics Example PDF. The topics addressed in these templates are Least Spending, Earnings Spend, Key Insights. All the content presented in this PPT design is completely editable. Download it and make adjustments in color, background, font etc. as per your unique business setting.
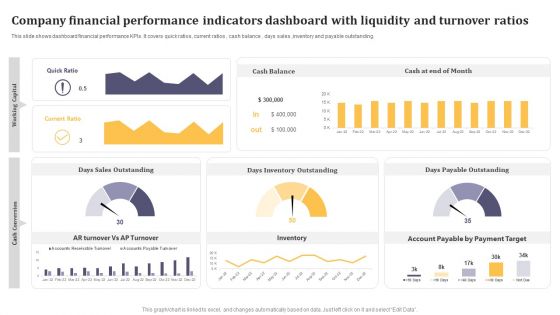
Company Financial Performance Indicators Dashboard With Liquidity And Turnover Ratios Formats PDF
This graph or chart is linked to excel, and changes automatically based on data. Just left click on it and select Edit Data. Pitch your topic with ease and precision using this Company Financial Performance Indicators Dashboard With Liquidity And Turnover Ratios Formats PDF. This layout presents information on Cash Balance, Days Inventory Outstanding, Days Payable Outstanding. It is also available for immediate download and adjustment. So, changes can be made in the color, design, graphics or any other component to create a unique layout.
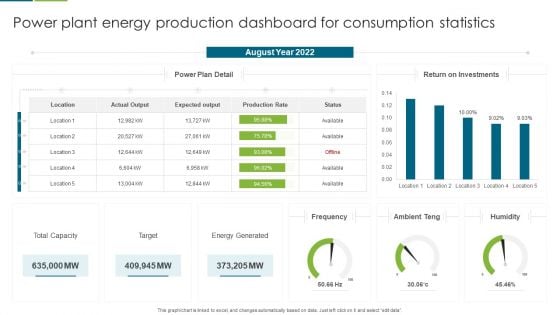
Power Plant Energy Production Dashboard For Consumption Statistics Download PDF
This graph or chart is linked to excel, and changes automatically based on data. Just left click on it and select edit data. Pitch your topic with ease and precision using this Multiple Country Energy Consumption Statistics Comparison Dashboard Formats PDF. This layout presents information on August Year 2022, Return on Investments, Power Plan Detail . It is also available for immediate download and adjustment. So, changes can be made in the color, design, graphics or any other component to create a unique layout.
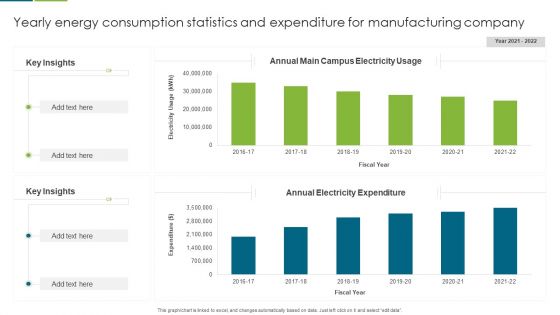
Yearly Energy Consumption Statistics And Expenditure For Manufacturing Company Guidelines PDF
This graph or chart is linked to excel, and changes automatically based on data. Just left click on it and select edit data. Pitch your topic with ease and precision using this Yearly Energy Consumption Statistics And Expenditure For Manufacturing Company Guidelines PDF. This layout presents information on Key Insights, Annual Electricity Expenditure, Annual Main Campus, Electricity Usage. It is also available for immediate download and adjustment. So, changes can be made in the color, design, graphics or any other component to create a unique layout.
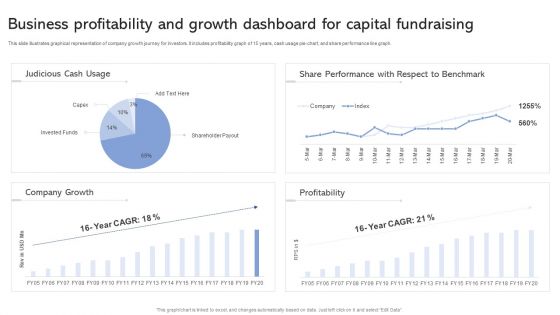
Business Profitability And Growth Dashboard For Capital Fundraising Ppt Slides Guide PDF
This slide illustrates graphical representation of company growth journey for investors. It includes profitability graph of 15 years, cash usage pie-chart, and share performance line graph. Showcasing this set of slides titled Business Profitability And Growth Dashboard For Capital Fundraising Ppt Slides Guide PDF. The topics addressed in these templates are Judicious Cash Usage, Share Performance, Respect To Benchmark. All the content presented in this PPT design is completely editable. Download it and make adjustments in color, background, font etc. as per your unique business setting.
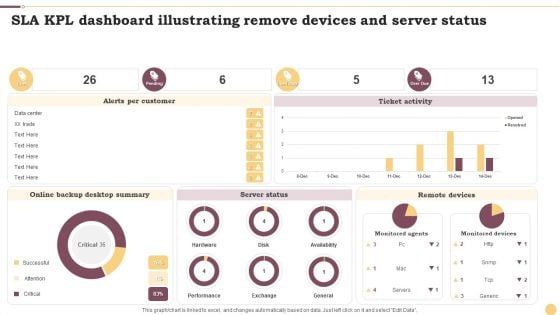
SLA KPL Dashboard Illustrating Remove Devices And Server Status Ppt Inspiration Layout Ideas PDF
This graph or chart is linked to excel, and changes automatically based on data. Just left click on it and select Edit Data. Showcasing this set of slides titled SLA KPL Dashboard Illustrating Remove Devices And Server Status Ppt Inspiration Layout Ideas PDF. The topics addressed in these templates are Alerts Per Customer, Ticket Activity, Server Status. All the content presented in this PPT design is completely editable. Download it and make adjustments in color, background, font etc. as per your unique business setting.
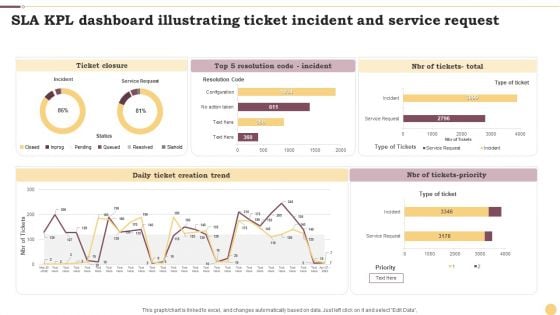
SLA KPL Dashboard Illustrating Ticket Incident And Service Request Ppt File Portrait PDF
This graph or chart is linked to excel, and changes automatically based on data. Just left click on it and select Edit Data. Showcasing this set of slides titled SLA KPL Dashboard Illustrating Ticket Incident And Service Request Ppt File Portrait PDF. The topics addressed in these templates are Ticket Closure, Daily Ticket, Creation Trend, NBR Tickets Priority. All the content presented in this PPT design is completely editable. Download it and make adjustments in color, background, font etc. as per your unique business setting.
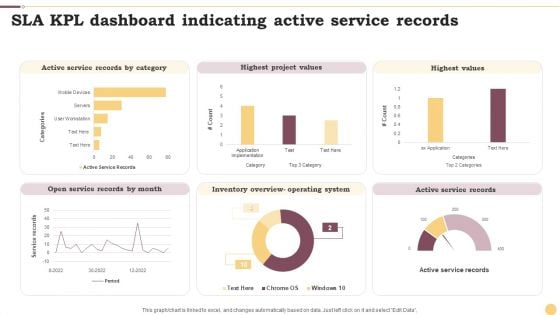
SLA KPL Dashboard Indicating Active Service Records Ppt Professional Graphics Example PDF
This graph or chart is linked to excel, and changes automatically based on data. Just left click on it and select Edit Data. Pitch your topic with ease and precision using this SLA KPL Dashboard Indicating Active Service Records Ppt Professional Graphics Example PDF. This layout presents information on Active Service Records, Highest Project Values, Highest Values. It is also available for immediate download and adjustment. So, changes can be made in the color, design, graphics or any other component to create a unique layout.
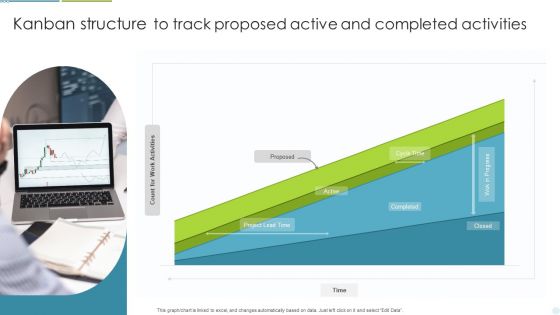
Kanban Structure To Track Proposed Active And Completed Activities Ppt Outline Slide Portrait PDF
This graph or chart is linked to excel, and changes automatically based on data. Just left click on it and select Edit Data. Pitch your topic with ease and precision using this Kanban Structure To Track Proposed Active And Completed Activities Ppt Outline Slide Portrait PDF. This layout presents information on Project Lead Time, Cycle Time, Completed. It is also available for immediate download and adjustment. So, changes can be made in the color, design, graphics or any other component to create a unique layout.
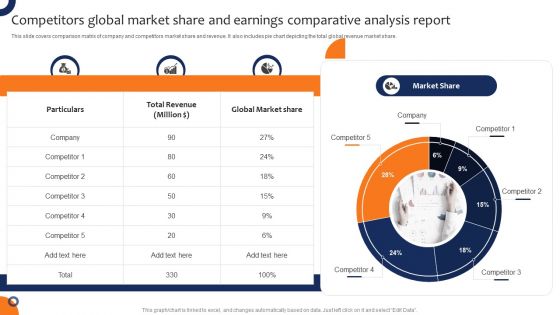
Competitors Global Market Share And Earnings Comparative Analysis Report Slides PDF
This slide covers comparison matrix of company and competitors market share and revenue. It also includes pie chart depicting the total global revenue market share. Showcasing this set of slides titled Competitors Global Market Share And Earnings Comparative Analysis Report Slides PDF. The topics addressed in these templates are Revenue, Global Market Share, Earnings Comparative Analysis Report. All the content presented in this PPT design is completely editable. Download it and make adjustments in color, background, font etc. as per your unique business setting.

HR KPI Dashboard With Staff Payroll Details Ppt PowerPoint Presentation File Layout Ideas PDF
This slide represents the key performance indicator dashboard with salary details of employee working in an organisation. It includes turnover rate, pie chart of employment contract and status, bar graph based on employee gender. Showcasing this set of slides titled HR KPI Dashboard With Staff Payroll Details Ppt PowerPoint Presentation File Layout Ideas PDF. The topics addressed in these templates are Turnover Rate, Absenteeism Rate, Permanent Rate. All the content presented in this PPT design is completely editable. Download it and make adjustments in color, background, font etc. as per your unique business setting.
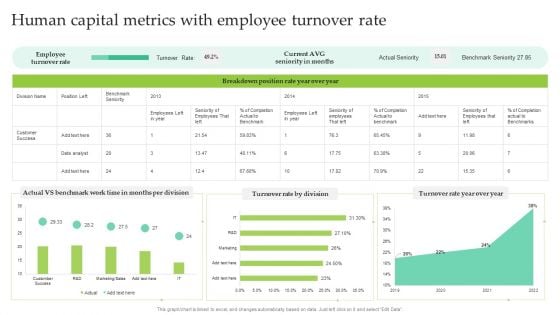
Human Capital Metrics With Employee Turnover Rate Ppt File Mockup PDF
This graph or chart is linked to excel, and changes automatically based on data. Just left click on it and select Edit Data. Showcasing this set of slides titled Human Capital Metrics With Employee Turnover Rate Ppt File Mockup PDF. The topics addressed in these templates are Employee Turnover Rate, Turnover Rate Division, Turnover Rate Year, Over Year. All the content presented in this PPT design is completely editable. Download it and make adjustments in color, background, font etc. as per your unique business setting.
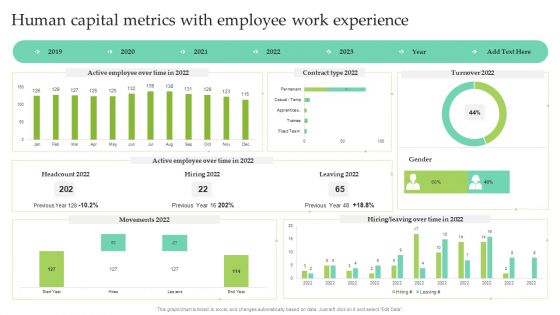
Human Capital Metrics With Employee Work Experience Ppt Show Images PDF
This graph or chart is linked to excel, and changes automatically based on data. Just left click on it and select Edit Data. Pitch your topic with ease and precision using this Human Capital Metrics With Employee Work Experience Ppt Show Images PDF. This layout presents information on Active Employee, Over Time, Contract Type 2022, Leaving 2022. It is also available for immediate download and adjustment. So, changes can be made in the color, design, graphics or any other component to create a unique layout.
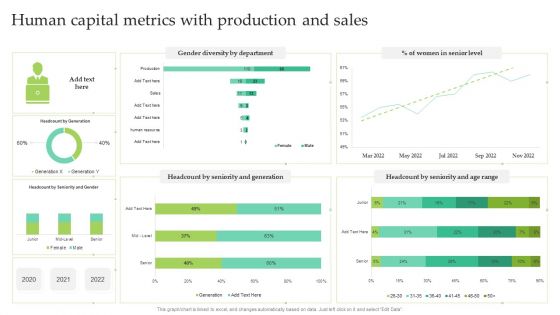
Human Capital Metrics With Production And Sales Ppt Infographic Template Summary PDF
This graph or chart is linked to excel, and changes automatically based on data. Just left click on it and select Edit Data. Showcasing this set of slides titled Human Capital Metrics With Production And Sales Ppt Infographic Template Summary PDF. The topics addressed in these templates are Women Senior Level, Gender Diversity Department, Seniority And Generation. All the content presented in this PPT design is completely editable. Download it and make adjustments in color, background, font etc. as per your unique business setting.
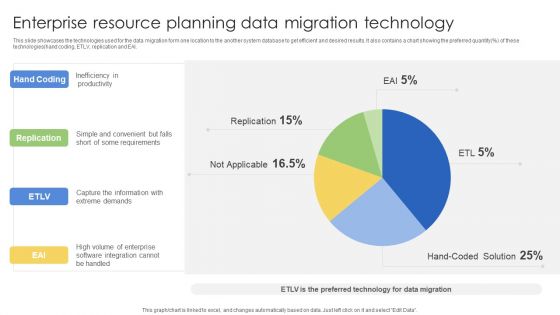
Enterprise Resource Planning Data Migration Technology Ppt Pictures Layout PDF
This slide showcases the technologies used for the data migration form one location to the another system database to get efficient and desired results. It also contains a chart showing the preferred quantity percent of these technologies hand coding, ETLV, replication and EAI. Showcasing this set of slides titled Enterprise Resource Planning Data Migration Technology Ppt Pictures Layout PDF. The topics addressed in these templates are Hand Coding, Replication, ETLV, EAI. All the content presented in this PPT design is completely editable. Download it and make adjustments in color, background, font etc. as per your unique business setting.
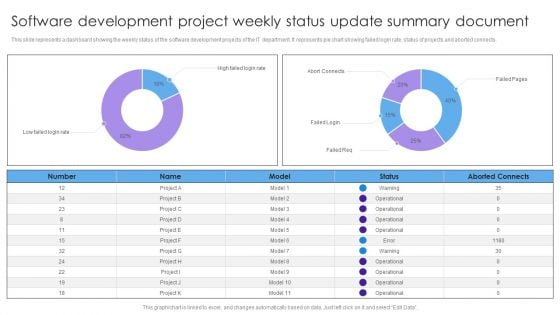
Software Development Project Weekly Status Update Summary Document Inspiration PDF
This slide represents a dashboard showing the weekly status of the software development projects of the IT department. It represents pie chart showing failed login rate, status of projects and aborted connects. Pitch your topic with ease and precision using this Software Development Project Weekly Status Update Summary Document Inspiration PDF. This layout presents information on High Failed, Login Rate, Abort Connects, Failed Login. It is also available for immediate download and adjustment. So, changes can be made in the color, design, graphics or any other component to create a unique layout.
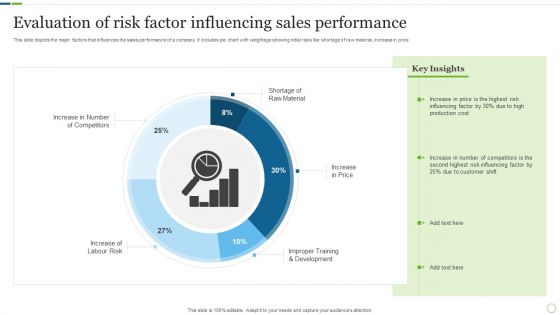
Evaluation Of Risk Factor Influencing Sales Performance Inspiration PDF
This slide depicts the major factors that influences the sales performance of a company. It includes pie chart with weightage showing initial risks like shortage of raw material, increase in price. Pitch your topic with ease and precision using this Evaluation Of Risk Factor Influencing Sales Performance Inspiration PDF. This layout presents information on Production Cost, Customer Shift, Risk Influencing. It is also available for immediate download and adjustment. So, changes can be made in the color, design, graphics or any other component to create a unique layout.
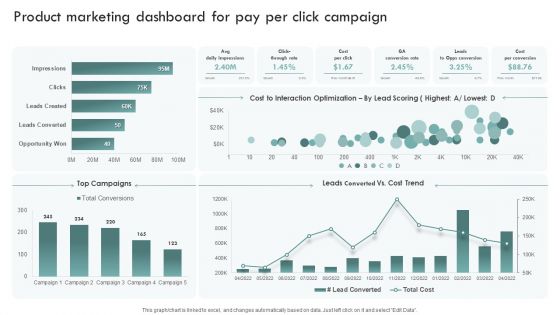
Brand Awareness Plan Product Marketing Dashboard For Pay Per Click Campaign Template PDF
This graph or chart is linked to excel, and changes automatically based on data. Just left click on it and select Edit Data. Get a simple yet stunning designed Brand Awareness Plan Product Marketing Dashboard For Pay Per Click Campaign Template PDF. It is the best one to establish the tone in your meetings. It is an excellent way to make your presentations highly effective. So, download this PPT today from Slidegeeks and see the positive impacts. Our easy-to-edit Brand Awareness Plan Product Marketing Dashboard For Pay Per Click Campaign Template PDF can be your go-to option for all upcoming conferences and meetings. So, what are you waiting for Grab this template today.
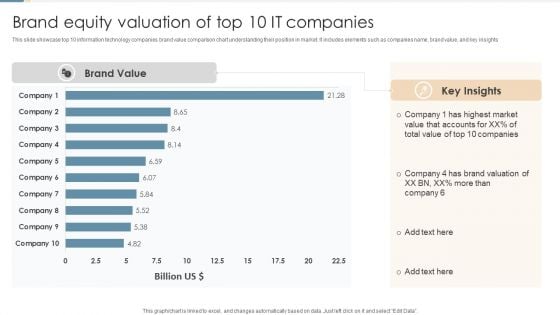
Brand Equity Valuation Of Top 10 IT Companies Ppt Portfolio Rules PDF
This slide showcase top 10 information technology companies brand value comparison chart understanding their position in market. It includes elements such as companies name, brand value, and key insights. Pitch your topic with ease and precision using this Brand Equity Valuation Of Top 10 IT Companies Ppt Portfolio Rules PDF. This layout presents information on Highest Market Value, Total Value, Brand Valuation. It is also available for immediate download and adjustment. So, changes can be made in the color, design, graphics or any other component to create a unique layout.
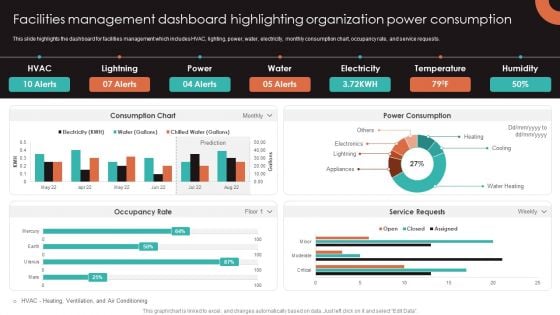
Facilities Management Dashboard Highlighting Organization Power Consumption Background PDF
This slide highlights the dashboard for facilities management which includes HVAC, lighting, power, water, electricity, monthly consumption chart, occupancy rate, and service requests. This Facilities Management Dashboard Highlighting Organization Power Consumption Background PDF from Slidegeeks makes it easy to present information on your topic with precision. It provides customization options, so you can make changes to the colors, design, graphics, or any other component to create a unique layout. It is also available for immediate download, so you can begin using it right away. Slidegeeks has done good research to ensure that you have everything you need to make your presentation stand out. Make a name out there for a brilliant performance.
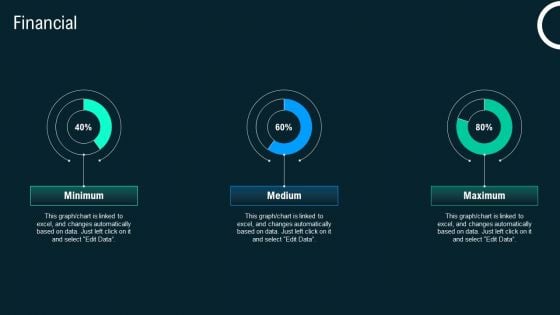
Financial Business Application Development Playbook Pictures PDF
If you are looking for a format to display your unique thoughts, then the professionally designed Financial Business Application Development Playbook Pictures PDF is the one for you. You can use it as a Google Slides template or a PowerPoint template. Incorporate impressive visuals, symbols, images, and other charts. Modify or reorganize the text boxes as you desire. Experiment with shade schemes and font pairings. Alter, share or cooperate with other people on your work. Download Financial Business Application Development Playbook Pictures PDF and find out how to give a successful presentation. Present a perfect display to your team and make your presentation unforgettable.
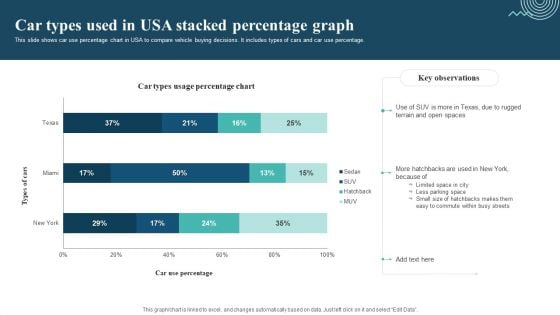
Car Types Used In Usa Stacked Percentage Graph Sample PDF
This slide shows car use percentage chart in USA to compare vehicle buying decisions. It includes types of cars and car use percentage. Pitch your topic with ease and precision using this Car Types Used In Usa Stacked Percentage Graph Sample PDF. This layout presents information on Limited Space In City, Less Parking Space, Easy To Commute. It is also available for immediate download and adjustment. So, changes can be made in the color, design, graphics or any other component to create a unique layout.
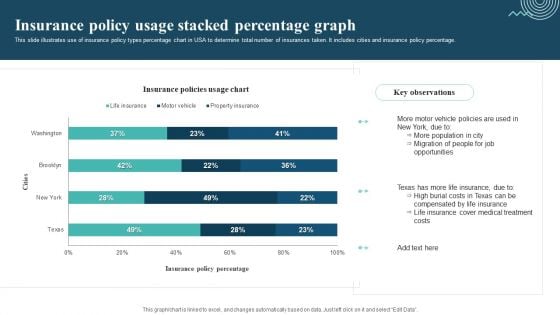
Insurance Policy Usage Stacked Percentage Graph Template PDF
This slide illustrates use of insurance policy types percentage chart in USA to determine total number of insurances taken. It includes cities and insurance policy percentage. Pitch your topic with ease and precision using this Insurance Policy Usage Stacked Percentage Graph Template PDF. This layout presents information on Motor Vehicle Policies, More Population, Migration Of People. It is also available for immediate download and adjustment. So, changes can be made in the color, design, graphics or any other component to create a unique layout.
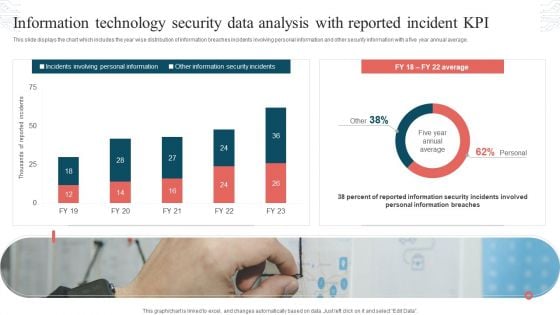
Information Technology Security Data Analysis With Reported Incident KPI Download PDF
This slide displays the chart which includes the year wise distribution of information breaches incidents involving personal information and other security information with a five year annual average. Showcasing this set of slides titled Information Technology Security Data Analysis With Reported Incident KPI Download PDF. The topics addressed in these templates are Incidents Involving, Personal Information, Other Information, Security Incidents. All the content presented in this PPT design is completely editable. Download it and make adjustments in color, background, font etc. as per your unique business setting.
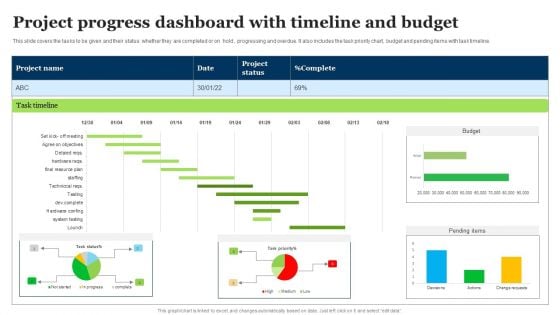
Project Progress Dashboard With Timeline And Budget Mockup PDF
This slide covers the tasks to be given and their status whether they are completed or on hold , progressing and overdue. It also includes the task priority chart, budget and pending items with task timeline. Pitch your topic with ease and precision using this Project Progress Dashboard With Timeline And Budget Mockup PDF. This layout presents information on Task Timeline, Project Status, Pending Items. It is also available for immediate download and adjustment. So, changes can be made in the color, design, graphics or any other component to create a unique layout.
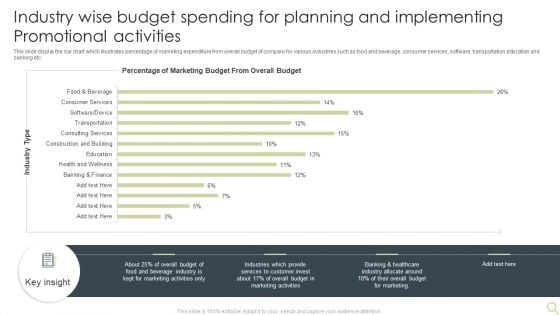
Industry Wise Budget Spending For Planning And Implementing Promotional Activities Introduction PDF
This slide display the bar chart which illustrates percentage of marketing expenditure from overall budget of company for various industries such as food and beverage, consumer services, software, transportation,education and banking etc. Showcasing this set of slides titled Industry Wise Budget Spending For Planning And Implementing Promotional Activities Introduction PDF. The topics addressed in these templates are Marketing, Beverage Industry, Budget. All the content presented in this PPT design is completely editable. Download it and make adjustments in color, background, font etc. as per your unique business setting.

Term Life Insurance Plan Claims Management Dashboard Portrait PDF
This slide illustrates facts and figures related to status of total claims and closed claims made in an insurance company. It includes yearly claim status pie-chart, total claims quarter-wise and total closed claims quarter-wise. Pitch your topic with ease and precision using this Term Life Insurance Plan Claims Management Dashboard Portrait PDF. This layout presents information on Yearly Claim Status, Total Claims, Quarter Wise. It is also available for immediate download and adjustment. So, changes can be made in the color, design, graphics or any other component to create a unique layout.
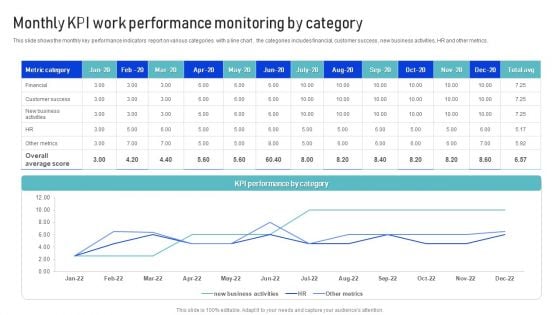
Monthly KPI Work Performance Monitoring By Category Microsoft PDF
This slide shows the monthly key performance indicators report on various categories with a line chart . the categories includes financial, customer success , new business activities, HR and other metrics. Pitch your topic with ease and precision using this Monthly KPI Work Performance Monitoring By Category Microsoft PDF. This layout presents information on Metrics, Financial, Customer Success. It is also available for immediate download and adjustment. So, changes can be made in the color, design, graphics or any other component to create a unique layout.
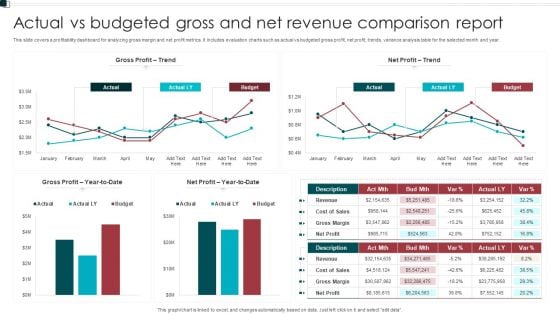
Actual Vs Budgeted Gross And Net Revenue Comparison Report Sample PDF
This slide covers a profitability dashboard for analyzing gross margin and net profit metrics. It includes evaluation charts such as actual vs budgeted gross profit, net profit, trends, variance analysis table for the selected month and year. Pitch your topic with ease and precision using this Actual Vs Budgeted Gross And Net Revenue Comparison Report Sample PDF. This layout presents information on Gross Profit, Net Profit, Budget. It is also available for immediate download and adjustment. So, changes can be made in the color, design, graphics or any other component to create a unique layout.
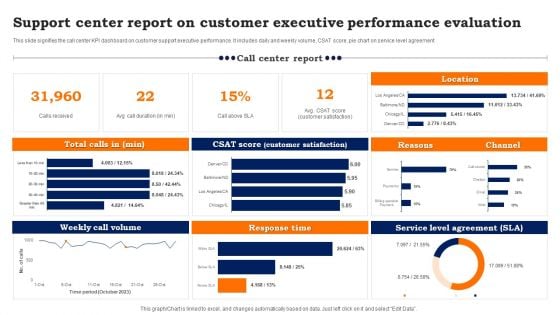
Support Center Report On Customer Executive Performance Evaluation Background PDF
This slide signifies the call center KPI dashboard on customer support executive performance. It includes daily and weekly volume, CSAT score, pie chart on service level agreement. Pitch your topic with ease and precision using this Support Center Report On Customer Executive Performance Evaluation Background PDF. This layout presents information on Weekly Call Volume, Response Time, Service Level Agreement. It is also available for immediate download and adjustment. So, changes can be made in the color, design, graphics or any other component to create a unique layout.
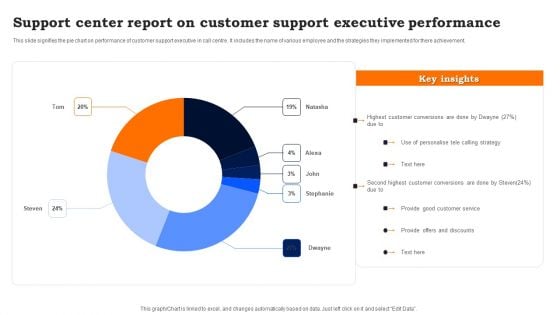
Support Center Report On Customer Support Executive Performance Sample PDF
This slide signifies the pie chart on performance of customer support executive in call centre. It includes the name of various employee and the strategies they implemented for there achievement. Showcasing this set of slides titled Support Center Report On Customer Support Executive Performance Sample PDF. The topics addressed in these templates are Use Of Personalise Telecalling, Provide Good Customer Service, Provide Offers And Discounts. All the content presented in this PPT design is completely editable. Download it and make adjustments in color, background, font etc. as per your unique business setting.
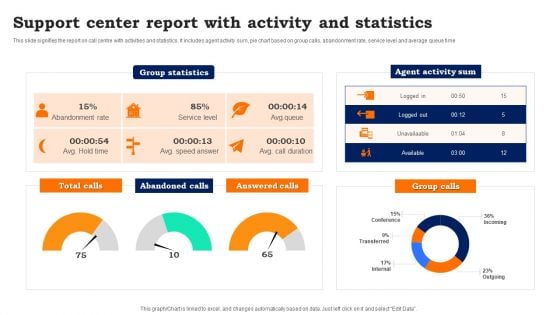
Support Center Report With Activity And Statistics Guidelines PDF
This slide signifies the report on call centre with activities and statistics. It includes agent activity sum, pie chart based on group calls, abandonment rate, service level and average queue time. Pitch your topic with ease and precision using this Support Center Report With Activity And Statistics Guidelines PDF. This layout presents information on Support Center Report, Activity And Statistics. It is also available for immediate download and adjustment. So, changes can be made in the color, design, graphics or any other component to create a unique layout.
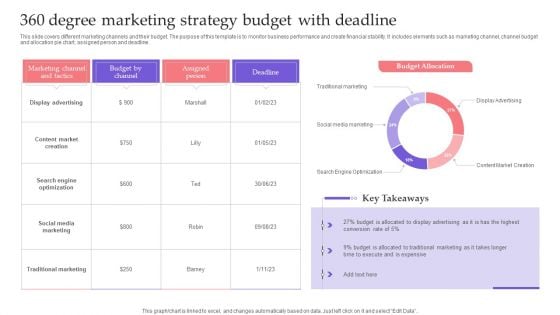
360 Degree Marketing Strategy Budget With Deadline Topics PDF
This slide covers different marketing channels and their budget. The purpose of this template is to monitor business performance and create financial stability. It includes elements such as marketing channel, channel budget and allocation pie chart, assigned person and deadline. Showcasing this set of slides titled 360 Degree Marketing Strategy Budget With Deadline Topics PDF. The topics addressed in these templates are Marketing Channel Tactics, Budget Channel, Assigned Person. All the content presented in this PPT design is completely editable. Download it and make adjustments in color, background, font etc. as per your unique business setting.
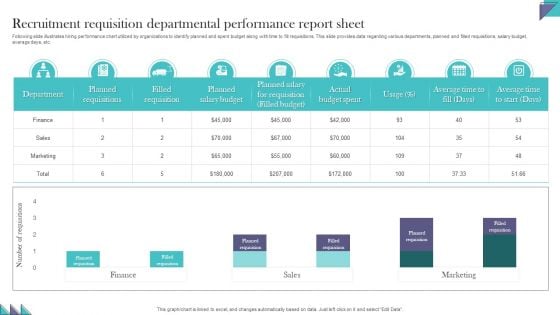
Recruitment Requisition Departmental Performance Report Sheet Demonstration PDF
Following slide illustrates hiring performance chart utilized by organizations to identify planned and spent budget along with time to fill requisitions. This slide provides data regarding various departments, planned and filled requisitions, salary budget, average days, etc. Pitch your topic with ease and precision using this Recruitment Requisition Departmental Performance Report Sheet Demonstration PDF. This layout presents information on Recruitment Requisition, Departmental Performance, Report Sheet. It is also available for immediate download and adjustment. So, changes can be made in the color, design, graphics or any other component to create a unique layout.
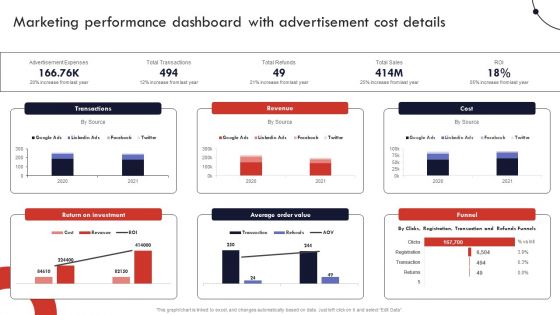
Product And Services Promotion Marketing Performance Dashboard With Advertisement Graphics PDF
This graph or chart is linked to excel, and changes automatically based on data. Just left click on it and select Edit Data. Slidegeeks is here to make your presentations a breeze with Product And Services Promotion Marketing Performance Dashboard With Advertisement Graphics PDF With our easy-to-use and customizable templates, you can focus on delivering your ideas rather than worrying about formatting. With a variety of designs to choose from, youre sure to find one that suits your needs. And with animations and unique photos, illustrations, and fonts, you can make your presentation pop. So whether youre giving a sales pitch or presenting to the board, make sure to check out Slidegeeks first.
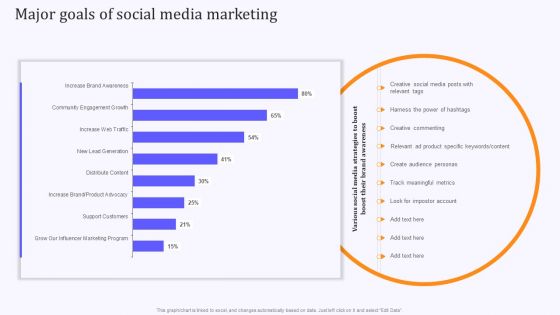
Product Marketing And Awareness Programs Major Goals Of Social Media Marketing Mockup PDF
This graph or chart is linked to excel, and changes automatically based on data. Just left click on it and select Edit Data. Find a pre-designed and impeccable Product Marketing And Awareness Programs Major Goals Of Social Media Marketing Mockup PDF. The templates can ace your presentation without additional effort. You can download these easy-to-edit presentation templates to make your presentation stand out from others. So, what are you waiting for Download the template from Slidegeeks today and give a unique touch to your presentation.
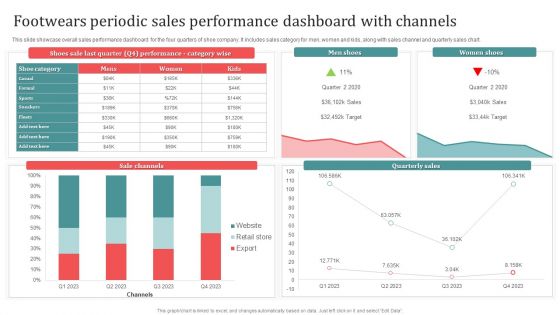
Footwears Periodic Sales Performance Dashboard With Channels Download PDF
This slide showcase overall sales performance dashboard for the four quarters of shoe company. It includes sales category for men, women and kids, along with sales channel and quarterly sales chart. Showcasing this set of slides titled Footwears Periodic Sales Performance Dashboard With Channels Download PDF. The topics addressed in these templates are Men Shoes, Women Shoes, Sale Channels. All the content presented in this PPT design is completely editable. Download it and make adjustments in color, background, font etc. as per your unique business setting.
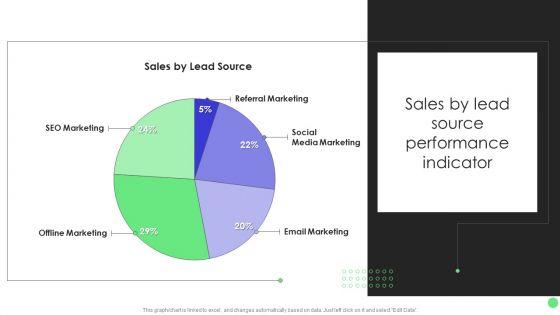
Comprehensive Guide For Launch Sales By Lead Source Performance Indicator Inspiration PDF
This graph or chart is linked to excel, and changes automatically based on data. Just left click on it and select Edit Data. The Comprehensive Guide For Launch Sales By Lead Source Performance Indicator Inspiration PDF is a compilation of the most recent design trends as a series of slides. It is suitable for any subject or industry presentation, containing attractive visuals and photo spots for businesses to clearly express their messages. This template contains a variety of slides for the user to input data, such as structures to contrast two elements, bullet points, and slides for written information. Slidegeeks is prepared to create an impression.
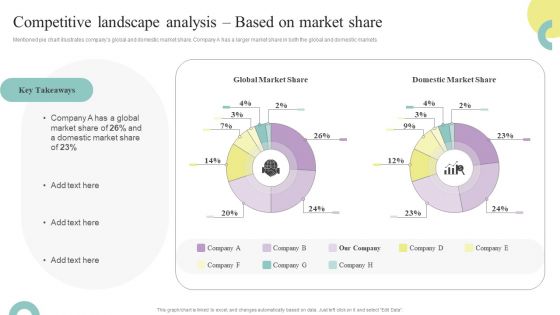
Comprehensive Guide To Enhance Competitive Landscape Analysis Based On Market Ideas PDF
Mentioned pie chart illustrates companys global and domestic market share. Company A has a larger market share in both the global and domestic markets. If your project calls for a presentation, then Slidegeeks is your go-to partner because we have professionally designed, easy-to-edit templates that are perfect for any presentation. After downloading, you can easily edit Comprehensive Guide To Enhance Competitive Landscape Analysis Based On Market Ideas PDF and make the changes accordingly. You can rearrange slides or fill them with different images. Check out all the handy templates.
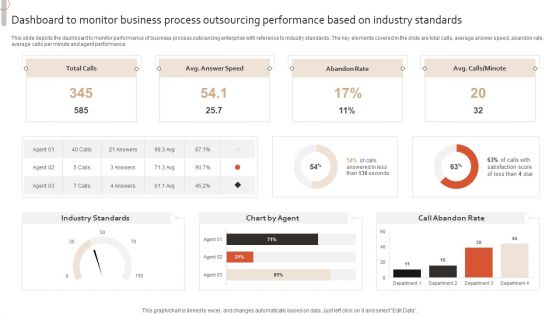
Dashboard To Monitor Business Process Outsourcing Performance Based On Industry Standards Infographics PDF
This slide depicts the dashboard to monitor performance of business process outsourcing enterprise with reference to industry standards. The key elements covered in the slide are total calls, average answer speed, abandon rate, average calls per minute and agent performanc. Showcasing this set of slides titled Dashboard To Monitor Business Process Outsourcing Performance Based On Industry Standards Infographics PDF. The topics addressed in these templates are Industry Standards, Chart By Agent, Call Abandon Rate, Total Calls. All the content presented in this PPT design is completely editable. Download it and make adjustments in color, background, font etc. as per your unique business setting.
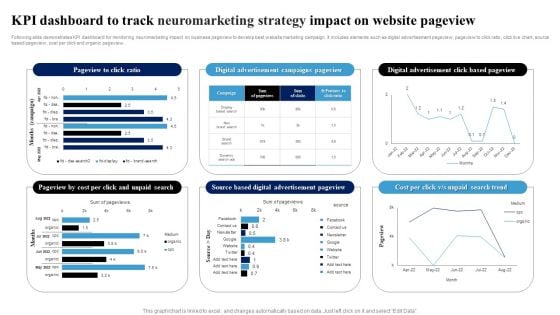
KPI Dashboard To Track Neuromarketing Strategy Impact On Website Pageview Ppt Model Templates PDF
Following slide demonstrates KPI dashboard for monitoring neuromarketing impact on business pageview to develop best website marketing campaign. It includes elements such as digital advertisement pageview, pageview to click ratio, click live chart, source based pageview, cost per click and organic pageview. Showcasing this set of slides titled KPI Dashboard To Track Neuromarketing Strategy Impact On Website Pageview Ppt Model Templates PDF. The topics addressed in these templates are Digital Advertisement, Campaigns Pageview, Click Based Pageview. All the content presented in this PPT design is completely editable. Download it and make adjustments in color, background, font etc. as per your unique business setting.
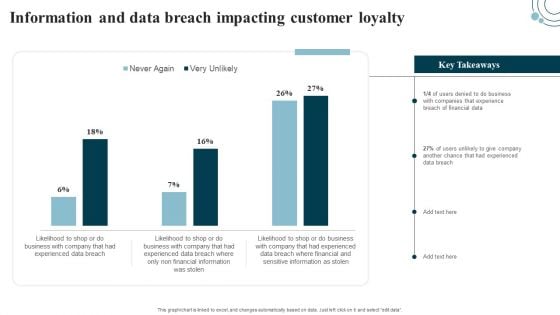
Developing IT Security Strategy Information And Data Breach Impacting Customer Loyalty Template PDF
This graph or chart is linked to excel, and changes automatically based on data. Just left click on it and select edit data. Get a simple yet stunning designed Developing IT Security Strategy Information And Data Breach Impacting Customer Loyalty Template PDF. It is the best one to establish the tone in your meetings. It is an excellent way to make your presentations highly effective. So, download this PPT today from Slidegeeks and see the positive impacts. Our easy-to-edit Developing IT Security Strategy Information And Data Breach Impacting Customer Loyalty Template PDF can be your go-to option for all upcoming conferences and meetings. So, what are you waiting for Grab this template today.
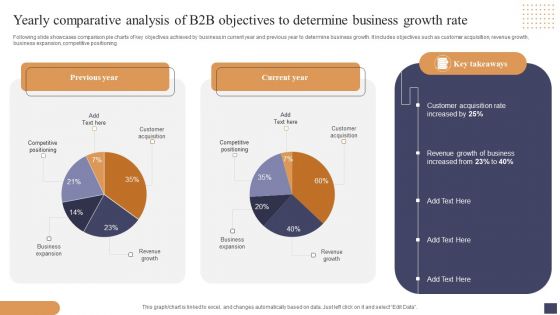
Yearly Comparative Analysis Of B2b Objectives To Determine Business Growth Rate Mockup PDF
Following slide showcases comparison pie charts of key objectives achieved by business in current year and previous year to determine business growth. It includes objectives such as customer acquisition, revenue growth, business expansion, competitive positioning. Showcasing this set of slides titled Yearly Comparative Analysis Of B2b Objectives To Determine Business Growth Rate Mockup PDF. The topics addressed in these templates are Customer Acquisition, Revenue Growth Business, Business Expansion. All the content presented in this PPT design is completely editable. Download it and make adjustments in color, background, font etc. as per your unique business setting.
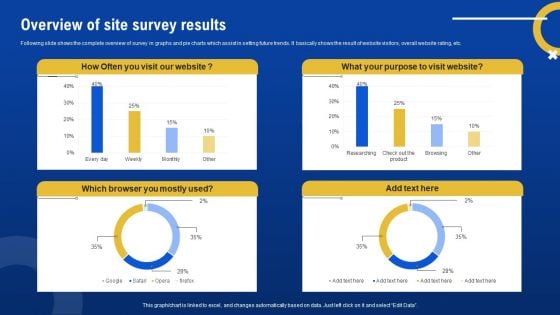
Overview Of Site Survey Results Survey SS
Following slide shows the complete overview of survey in graphs and pie charts which assist in setting future trends. It basically shows the result of website visitors, overall website rating, etc. Pitch your topic with ease and precision using this Overview Of Site Survey Results Survey SS. This layout presents information on Overview, Site Survey Results. It is also available for immediate download and adjustment. So, changes can be made in the color, design, graphics or any other component to create a unique layout.
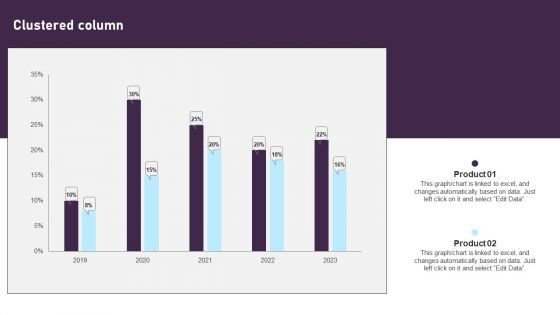
Clustered Column Comprehensive Plan For IT And Business Integration Brochure PDF
If you are looking for a format to display your unique thoughts, then the professionally designed Clustered Column Comprehensive Plan For IT And Business Integration Brochure PDF is the one for you. You can use it as a Google Slides template or a PowerPoint template. Incorporate impressive visuals, symbols, images, and other charts. Modify or reorganize the text boxes as you desire. Experiment with shade schemes and font pairings. Alter, share or cooperate with other people on your work. Download Clustered Column Comprehensive Plan For IT And Business Integration Brochure PDF and find out how to give a successful presentation. Present a perfect display to your team and make your presentation unforgettable.
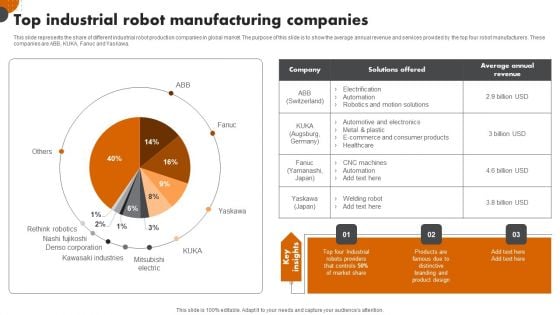
Robotic Automation In Workplace Top Industrial Robot Manufacturing Companies Ideas PDF
If you are looking for a format to display your unique thoughts, then the professionally designed Robotic Automation In Workplace Top Industrial Robot Manufacturing Companies Ideas PDF is the one for you. You can use it as a Google Slides template or a PowerPoint template. Incorporate impressive visuals, symbols, images, and other charts. Modify or reorganize the text boxes as you desire. Experiment with shade schemes and font pairings. Alter, share or cooperate with other people on your work. Download Robotic Automation In Workplace Top Industrial Robot Manufacturing Companies Ideas PDF and find out how to give a successful presentation. Present a perfect display to your team and make your presentation unforgettable.
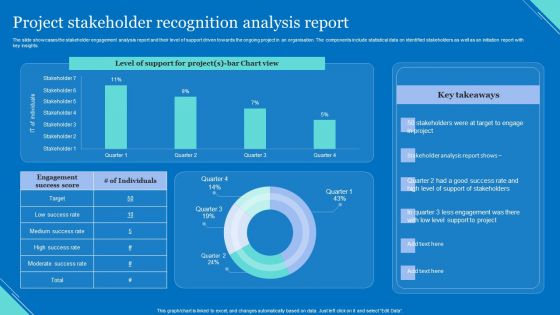
Project Stakeholder Recognition Analysis Report Elements PDF
The slide showcases the stakeholder engagement analysis report and their level of support driven towards the ongoing project in an organisation. The components include statistical data on identified stakeholders as well as an initiation report with key insights. Showcasing this set of slides titled Project Stakeholder Recognition Analysis Report Elements PDF. The topics addressed in these templates are Level Support, Chart View, Support Stakeholders. All the content presented in this PPT design is completely editable. Download it and make adjustments in color, background, font etc. as per your unique business setting.
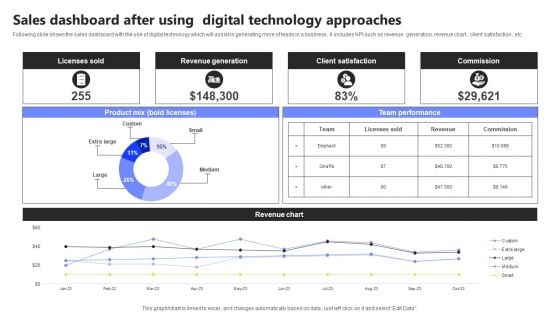
Sales Dashboard After Using Digital Technology Approaches Infographics PDF
Following slide shows the sales dashboard with the use of digital technology which will assist in generating more of leads in a business . It includes KPI such as revenue generation, revenue chart , client satisfaction , etc. Showcasing this set of slides titled Sales Dashboard After Using Digital Technology Approaches Infographics PDF. The topics addressed in these templates are Licenses Sold, Revenue Generation, Client Satisfaction. All the content presented in this PPT design is completely editable. Download it and make adjustments in color, background, font etc. as per your unique business setting.
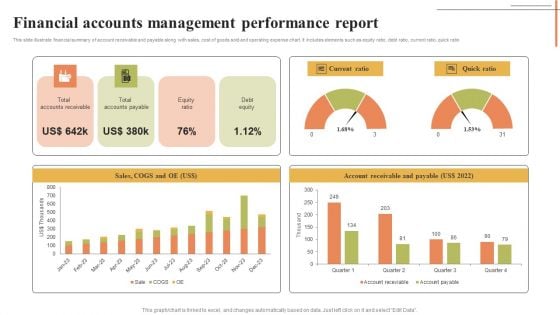
Financial Accounts Management Performance Report Mockup PDF
This slide illustrate financial summary of account receivable and payable along with sales, cost of goods sold and operating expense chart. It includes elements such as equity ratio, debt ratio, current ratio, quick ratio. Showcasing this set of slides titled Financial Accounts Management Performance Report Mockup PDF. The topics addressed in these templates are Current Ratio, Quick Ratio, Account Receivable Payable. All the content presented in this PPT design is completely editable. Download it and make adjustments in color, background, font etc. as per your unique business setting.
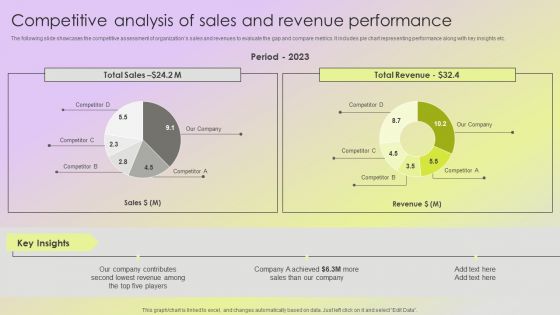
Mitigating Sales Risks With Strategic Action Planning Competitive Analysis Of Sales And Revenue Performance Slides PDF
The following slide showcases the competitive assessment of organizations sales and revenues to evaluate the gap and compare metrics. It includes pie chart representing performance along with key insights etc. Find a pre designed and impeccable Mitigating Sales Risks With Strategic Action Planning Competitive Analysis Of Sales And Revenue Performance Slides PDF. The templates can ace your presentation without additional effort. You can download these easy to edit presentation templates to make your presentation stand out from others. So, what are you waiting for Download the template from Slidegeeks today and give a unique touch to your presentation.
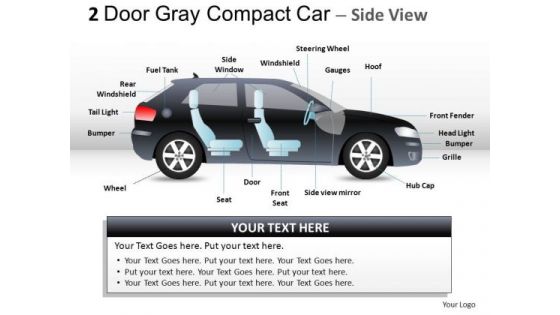
Driving Effortless 2 Door Gray Car Side PowerPoint Slides And Ppt Diagram Templates
Driving Effortless 2 Door Gray Car Side PowerPoint Slides And PPT Diagram Templates-These high quality powerpoint pre-designed slides and powerpoint templates have been carefully created by our professional team to help you impress your audience. All slides have been created and are 100% editable in powerpoint. Each and every property of any graphic - color, size, orientation, shading, outline etc. can be modified to help you build an effective powerpoint presentation. Any text can be entered at any point in the powerpoint template or slide. Simply DOWNLOAD, TYPE and PRESENT! Our Driving Effortless 2 Door Gray Car Side PowerPoint Slides And Ppt Diagram Templates are clear to even the farthest. They are designed for distance.
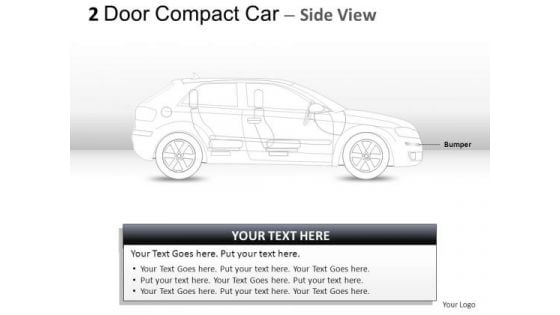
Fuel 2 Door Blue Car Side PowerPoint Slides And Ppt Diagram Templates
Fuel 2 Door Blue Car Side PowerPoint Slides And PPT Diagram Templates-These high quality powerpoint pre-designed slides and powerpoint templates have been carefully created by our professional team to help you impress your audience. All slides have been created and are 100% editable in powerpoint. Each and every property of any graphic - color, size, orientation, shading, outline etc. can be modified to help you build an effective powerpoint presentation. Any text can be entered at any point in the powerpoint template or slide. Simply DOWNLOAD, TYPE and PRESENT! Amuse your audience with our Fuel 2 Door Blue Car Side PowerPoint Slides And Ppt Diagram Templates. Some of them are designed to be far out.
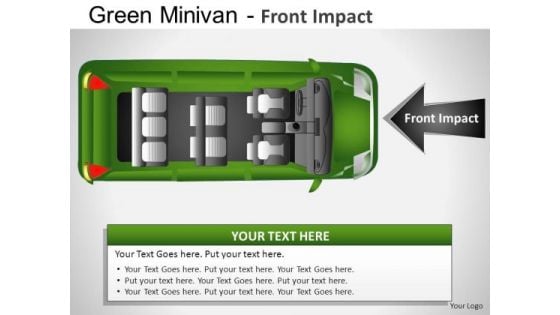
Sideview Green Minivan Top View PowerPoint Slides And Ppt Diagrams Templates
Sideview Green Minivan Top View PowerPoint Slides And PPT Diagrams Templates-These high quality powerpoint pre-designed slides and powerpoint templates have been carefully created by our professional team to help you impress your audience. All slides have been created and are 100% editable in powerpoint. Each and every property of any graphic - color, size, orientation, shading, outline etc. can be modified to help you build an effective powerpoint presentation. Any text can be entered at any point in the powerpoint template or slide. Simply DOWNLOAD, TYPE and PRESENT! You will find our Sideview Green Minivan Top View PowerPoint Slides And Ppt Diagrams Templates are cut out for it. Designed to draw in audience appreciation.
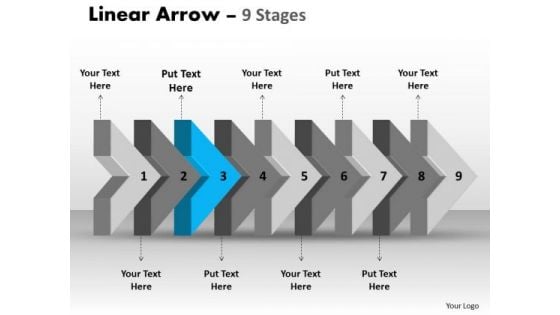
Ppt Template Beeline Flow Arrow Free Fishbone Diagram PowerPoint 4 Image
We present our PPT template beeline flow arrow free fishbone diagram PowerPoint 4 Image. Use our Symbol PowerPoint Templates because; enlighten them with your brilliant understanding of mental health. Use our Shapes PowerPoint Templates because, designed to attract the attention of your audience. Use our Signs PowerPoint Templates because, the lessons have been analyzed, studied and conclusions drawn. Use our Arrows PowerPoint Templates because, an occasion for gifting and giving. Use our Process and Flows PowerPoint Templates because, you have the moves to sway the market. Use these PowerPoint slides for presentations relating to Abstract, Age, Ancient, Antique, Arrows, Art, Artistic, Background, Colors, Decoration, Design, Dynamic, Elegant, Element, Future, Illustration, Index, Linear, Lines, Modern, Old, Paper, Pattern, Scratch, Text, Texture, Up, Vintage. The prominent colors used in the PowerPoint template are Blue, Gray, and Black Amaze yourself with our Ppt Template Beeline Flow Arrow Free Fishbone Diagram PowerPoint 4 Image. You will be astounded by what is on offer.
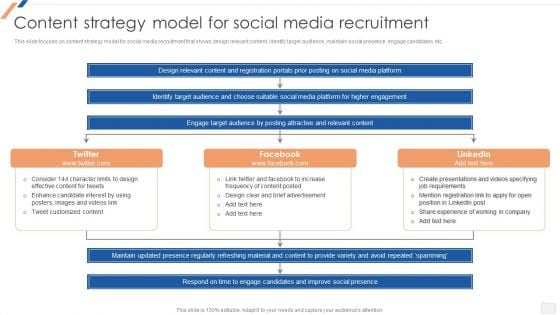
Content Strategy Model For Social Media Recruitment Enhancing Social Media Recruitment Process Diagrams PDF
This slide focuses on content strategy model for social media recruitment that shows design relevant content, identify target audience, maintain social presence, engage candidates, etc.Explore a selection of the finest Content Strategy Model For Social Media Recruitment Enhancing Social Media Recruitment Process Diagrams PDF here. With a plethora of professionally designed and pre-made slide templates, you can quickly and easily find the right one for your upcoming presentation. You can use our Content Strategy Model For Social Media Recruitment Enhancing Social Media Recruitment Process Diagrams PDF to effectively convey your message to a wider audience. Slidegeeks has done a lot of research before preparing these presentation templates. The content can be personalized and the slides are highly editable. Grab templates today from Slidegeeks.
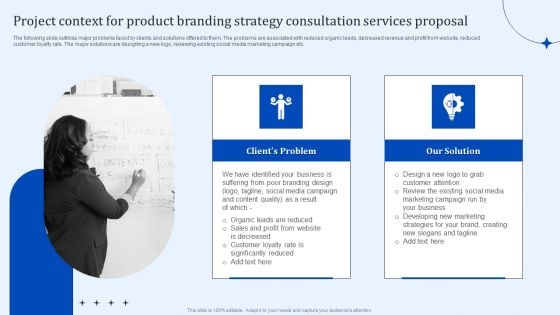
Project Context For Product Branding Strategy Consultation Services Proposal Diagrams PDF
The following slide outlines major problems faced by clients and solutions offered to them. The problems are associated with reduced organic leads, decreased revenue and profit from website, reduced customer loyalty rate. The major solutions are designing a new logo, reviewing existing social media marketing campaign etc. Get a simple yet stunning designed Project Context For Product Branding Strategy Consultation Services Proposal Diagrams PDF. It is the best one to establish the tone in your meetings. It is an excellent way to make your presentations highly effective. So, download this PPT today from Slidegeeks and see the positive impacts. Our easy-to-edit Project Context For Product Branding Strategy Consultation Services Proposal Diagrams PDF can be your go-to option for all upcoming conferences and meetings. So, what are you waiting for Grab this template today.
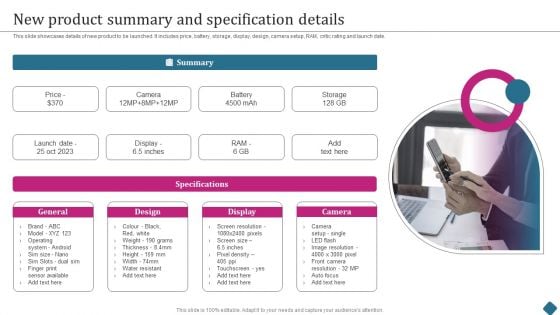
Smart Phone Launch Event Management Tasks New Product Summary And Specification Diagrams PDF
This slide showcases details of new product to be launched. It includes price, battery, storage, display, design, camera setup, RAM, critic rating and launch date. Get a simple yet stunning designed Smart Phone Launch Event Management Tasks New Product Summary And Specification Diagrams PDF. It is the best one to establish the tone in your meetings. It is an excellent way to make your presentations highly effective. So, download this PPT today from Slidegeeks and see the positive impacts. Our easy to edit Smart Phone Launch Event Management Tasks New Product Summary And Specification Diagrams PDF can be your go to option for all upcoming conferences and meetings. So, what are you waiting for Grab this template today.
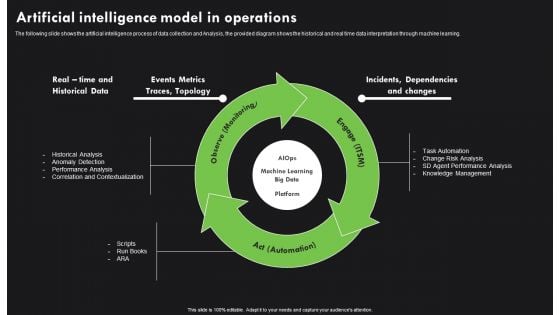
AI Deployment In IT Process Artificial Intelligence Model In Operations Diagrams PDF
The following slide shows the artificial intelligence process of data collection and Analysis, the provided diagram shows the historical and real time data interpretation through machine learning. Coming up with a presentation necessitates that the majority of the effort goes into the content and the message you intend to convey. The visuals of a PowerPoint presentation can only be effective if it supplements and supports the story that is being told. Keeping this in mind our experts created AI Deployment In IT Process Artificial Intelligence Model In Operations Diagrams PDF to reduce the time that goes into designing the presentation. This way, you can concentrate on the message while our designers take care of providing you with the right template for the situation.
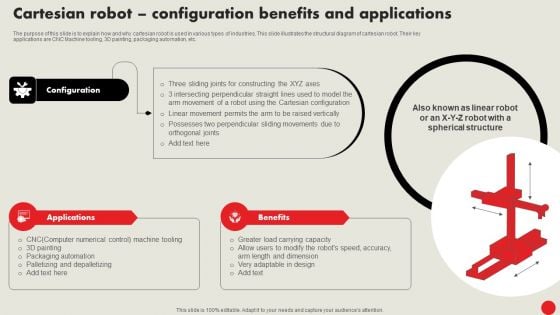
Types Of Robots For Industrial Operations Cartesian Robot Configuration Benefits And Applications Diagrams PDF
The purpose of this slide is to explain how and why cartesian robot is used in various types of industries. This slide illustrates the structural diagram of cartesian robot. Their key applications are CNC Machine tooling, 3D painting, packaging automation, etc. Coming up with a presentation necessitates that the majority of the effort goes into the content and the message you intend to convey. The visuals of a PowerPoint presentation can only be effective if it supplements and supports the story that is being told. Keeping this in mind our experts created Types Of Robots For Industrial Operations Cartesian Robot Configuration Benefits And Applications Diagrams PDF to reduce the time that goes into designing the presentation. This way, you can concentrate on the message while our designers take care of providing you with the right template for the situation.
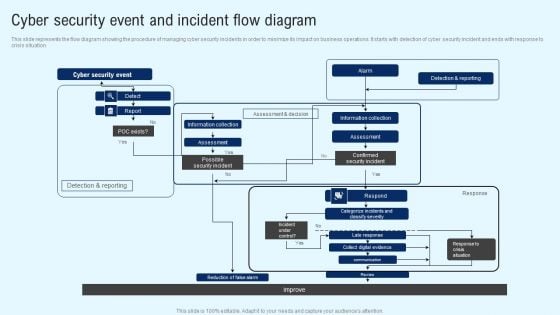
Implementing Cyber Security Incident Cyber Security Event And Incident Flow Diagram Download PDF
This slide represents the flow diagram showing the procedure of managing cyber security incidents in order to minimize its impact on business operations. It starts with detection of cyber security incident and ends with response to crisis situation. Coming up with a presentation necessitates that the majority of the effort goes into the content and the message you intend to convey. The visuals of a PowerPoint presentation can only be effective if it supplements and supports the story that is being told. Keeping this in mind our experts created Implementing Cyber Security Incident Cyber Security Event And Incident Flow Diagram Download PDF to reduce the time that goes into designing the presentation. This way, you can concentrate on the message while our designers take care of providing you with the right template for the situation.
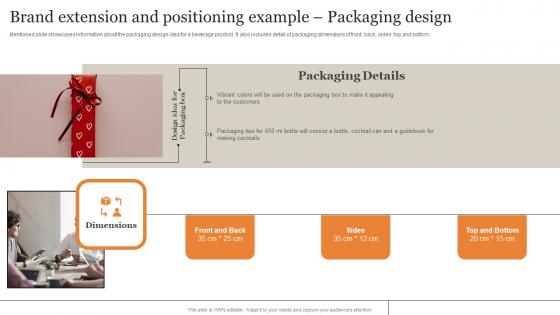
Brand Extension And Positioning Example Packaging Ultimate Guide Implementing Diagrams Pdf
Mentioned slide showcases information about the packaging design idea for a beverage product. It also includes detail of packaging dimensions of front, back, sides, top and bottom. Do you have to make sure that everyone on your team knows about any specific topic I yes, then you should give Brand Extension And Positioning Example Packaging Ultimate Guide Implementing Diagrams Pdf a try. Our experts have put a lot of knowledge and effort into creating this impeccable Brand Extension And Positioning Example Packaging Ultimate Guide Implementing Diagrams Pdf You can use this template for your upcoming presentations, as the slides are perfect to represent even the tiniest detail. You can download these templates from the Slidegeeks website and these are easy to edit. So grab these today. Mentioned slide showcases information about the packaging design idea for a beverage product. It also includes detail of packaging dimensions of front, back, sides, top and bottom.
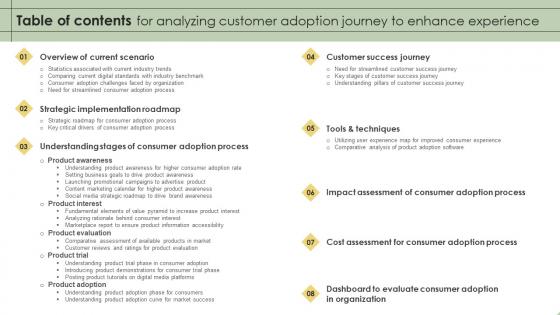
Table Of Contents For Analyzing Customer Adoption Journey To Enhance Experience Diagrams Pdf
The Table Of Contents For Analyzing Customer Adoption Journey To Enhance Experience Diagrams Pdf is a compilation of the most recent design trends as a series of slides. It is suitable for any subject or industry presentation, containing attractive visuals and photo spots for businesses to clearly express their messages. This template contains a variety of slides for the user to input data, such as structures to contrast two elements, bullet points, and slides for written information. Slidegeeks is prepared to create an impression. Our Table Of Contents For Analyzing Customer Adoption Journey To Enhance Experience Diagrams Pdf are topically designed to provide an attractive backdrop to any subject. Use them to look like a presentation pro.

Contact Us Mobile App Analytics Company Fund Raising Pitch Deck Diagrams Pdf
This Contact Us Mobile App Analytics Company Fund Raising Pitch Deck Diagrams Pdf from Slidegeeks makes it easy to present information on your topic with precision. It provides customization options, so you can make changes to the colors, design, graphics, or any other component to create a unique layout. It is also available for immediate download, so you can begin using it right away. Slidegeeks has done good research to ensure that you have everything you need to make your presentation stand out. Make a name out there for a brilliant performance. Our Contact Us Mobile App Analytics Company Fund Raising Pitch Deck Diagrams Pdf are topically designed to provide an attractive backdrop to any subject. Use them to look like a presentation pro.
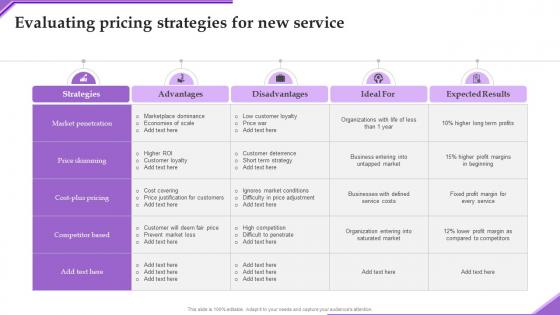
Evaluating Pricing Strategies Adverting New Sarvice Via Social Network Platform Diagrams Pdf
Slidegeeks is here to make your presentations a breeze with Evaluating Pricing Strategies Adverting New Sarvice Via Social Network Platform Diagrams Pdf With our easy to use and customizable templates, you can focus on delivering your ideas rather than worrying about formatting. With a variety of designs to choose from, you are sure to find one that suits your needs. And with animations and unique photos, illustrations, and fonts, you can make your presentation pop. So whether you are giving a sales pitch or presenting to the board, make sure to check out Slidegeeks first Our Evaluating Pricing Strategies Adverting New Sarvice Via Social Network Platform Diagrams Pdf are topically designed to provide an attractive backdrop to any subject. Use them to look like a presentation pro.
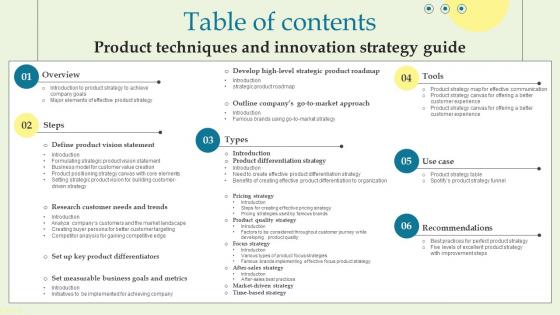
Table Of Contents Product Techniques And Innovation Strategy Guide Diagrams PDF
This Table Of Contents Product Techniques And Innovation Strategy Guide Diagrams PDF from Slidegeeks makes it easy to present information on your topic with precision. It provides customization options, so you can make changes to the colors, design, graphics, or any other component to create a unique layout. It is also available for immediate download, so you can begin using it right away. Slidegeeks has done good research to ensure that you have everything you need to make your presentation stand out. Make a name out there for a brilliant performance. Our Table Of Contents Product Techniques And Innovation Strategy Guide Diagrams PDF are topically designed to provide an attractive backdrop to any subject. Use them to look like a presentation pro.
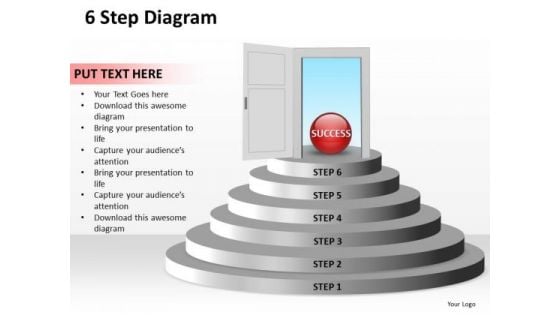
Ppt 6 Create PowerPoint Macro Staircase Diagram Free To Success Templates
PPT 6 create powerpoint macro staircase diagram free to success Templates-Use this Interconnected PowerPoint Diagram to represent hierarchical relationship. This Diagram shows Staircase to reach the door of Success. It Consists of six steps to reach the Destination. It signifies ancestry, birth, bourgeoisie, breed, caliber, caste, circle, company, condition, connection, coterie, cultural level, degree, derivation, extraction etc.-Can be used for presentations on 3d, abstract, achieve, achievement, blue, bright, business, climb, colorful, concept, design, empty, exhibit, exhibition, glossy, illustration, isolated, light, pedestal, plan, podium, rainbow, red, render, rise, shape, shiny, six step, solution, stage, stair, staircase, stairway, step, structure, success, symbol, top, up, way, white-PPT 6 create powerpoint macro staircase diagram free to success Templates Make your competition seem feeble with our Ppt 6 Create PowerPoint Macro Staircase Diagram Free To Success Templates. Just download, type and present.
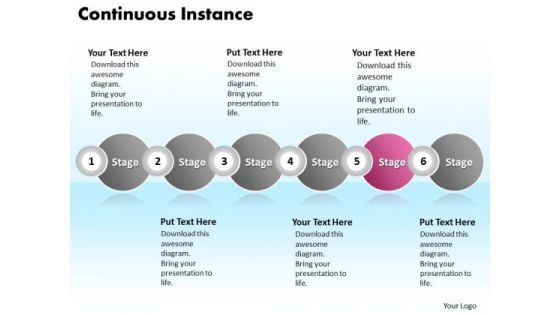
Ppt Continuous Instance Of Marketing Process Using 6 State Diagram PowerPoint Templates
PPT continuous instance of marketing process using 6 state diagram PowerPoint Templates-This diagram offers a great visualization tool, It is a type of diagram that represents an algorithm or process, showing the steps as showing the steps as circles, and their order by connecting these with connectors. Process operations are represented in these circles, and connectors represent flow of control.-PPT continuous instance of marketing process using 6 state diagram PowerPoint Templates-Abstract, Art, Stic, Background, Beautiful, Circles, Concept, Create, Decorative, Design, Detail, Digital, Faded, Fun, Gradient, Graphic, Illustration, Ink, Multicolored, Nostalgia, Outline, Pattern, Scattered, Shape, Spot, Spring, Stylistic Export your ideas through our Ppt Continuous Instance Of Marketing Process Using 6 State Diagram PowerPoint Templates. Gain duty free entry into the minds of your audience.
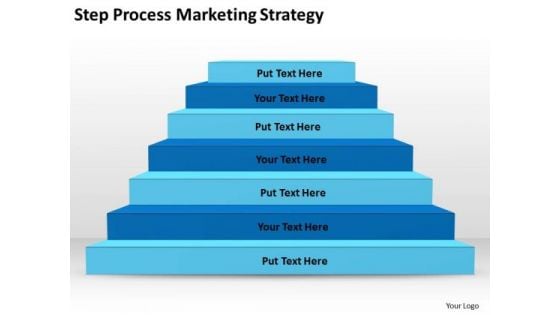
Step Process Marketing Strategy Ppt Business Plan Models PowerPoint Templates
We present our step process marketing strategy ppt business plan models PowerPoint templates.Present our Flow Charts PowerPoint Templates because They will Put your wonderful verbal artistry on display. Our PowerPoint Templates and Slides will provide you the necessary glam and glitter. Present our Business PowerPoint Templates because Our PowerPoint Templates and Slides will fulfill your every need. Use them and effectively satisfy the desires of your audience. Use our Process and Flows PowerPoint Templates because Our PowerPoint Templates and Slides will let you Clearly mark the path for others to follow. Download our Marketing PowerPoint Templates because Our PowerPoint Templates and Slides are conceived by a dedicated team. Use them and give form to your wondrous ideas. Download our Shapes PowerPoint Templates because It can Bubble and burst with your ideas.Use these PowerPoint slides for presentations relating to Stairs, bar, black, business, concept, corporate, design, development, diagram, document, economics, element, growth,illustration, infochart, infographics, information, layout, marketing, media, modern, number, options, presentation, process, retro, stair, statistics, stats, step,success, symbol, vector, vintage, visualization. The prominent colors used in the PowerPoint template are Blue, Blue light, Black. Our Step Process Marketing Strategy Ppt Business Plan Models PowerPoint Templates help you think on your feet. They provide you with ready answers.
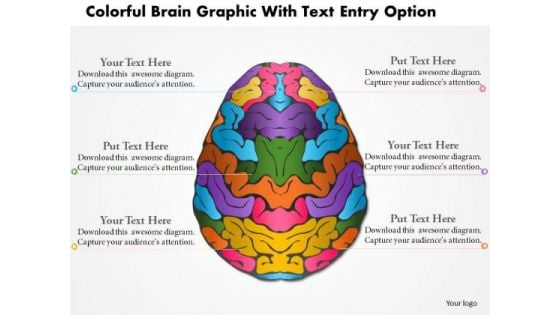
Business Diagram Colorful Brain Graphic With Text Entry Option Presentation Template
This image slide displays business consulting diagram of colorful brain graphic with text entry option. This image slide has been designed with graphic of brain. Text boxes are also provided on the sides. This image slide is 100% editable. Use this PowerPoint template, in your presentations to express various business ideas. May also be used in educational presentations. This image slide will enhance the quality of your presentations.

Business Diagram Cute Smiley Face With Graduation Cap For Education Presentation Template
This image slide displays business consulting diagram of cute smiley face with graduation cap. This image slide has been designed with graphic of smiley face and graduation cap. Text boxes are also provided on the side. This image slide is 100% editable. Use this PowerPoint template, in your presentations to express ideas in business. May also be used in education related presentations. This image slide will make your presentations attractive.
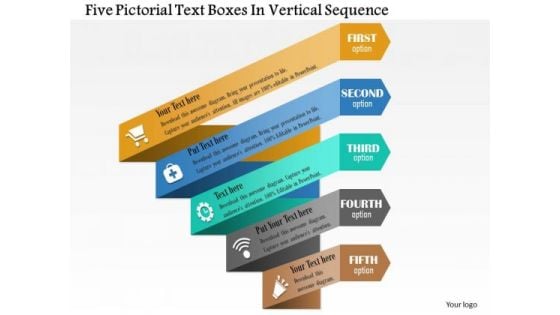
Business Diagram Five Pictorial Text Boxes In Vertical Sequence Presentation Template
This image slide displays business consulting diagram of five pictorial text boxes in vertical sequence. This image slide has been designed with graphic of colorful textboxes with symbols. This image slide is 100% editable. Use this PowerPoint template, in your presentations to explain concepts of management and various processes in business. May also be used in technology related presentations. This image slide will enhance the quality of your presentations.
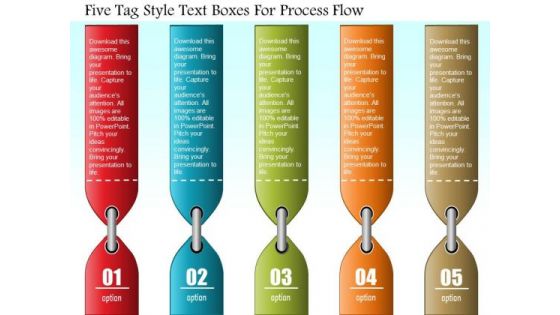
Business Diagram Five Tag Style Text Boxes For Process Flow Presentation Template
This image slide displays business consulting diagram of five tag style textboxes. This image slide has been designed with graphic of colorful textboxes. Numbers have been displayed in text boxes and depict process flow. This image slide is 100% editable. Use this PowerPoint template, in your presentations to explain concepts of management and various processes in business. May also be used in education related presentations. This image slide will enhance the quality of your presentations.
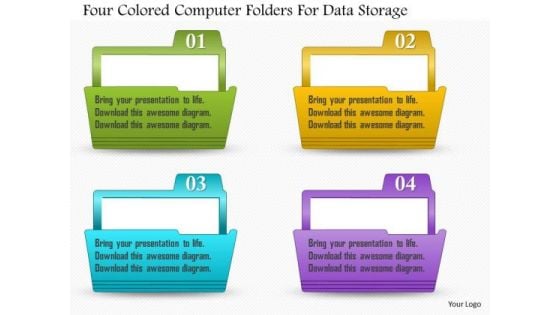
Business Diagram Four Colored Computer Folders For Data Storage Presentation Template
This image slide displays business consulting diagram of four colored computer folder for data storage. This image slide has been designed with graphic of colorful computer folders. Text spaces have also been provided. This image slide is 100% editable. Use this PowerPoint template, in your presentations to explain concepts of management and various processes in business. May also be used in computer related presentations. This image slide will enhance the quality of your presentations.
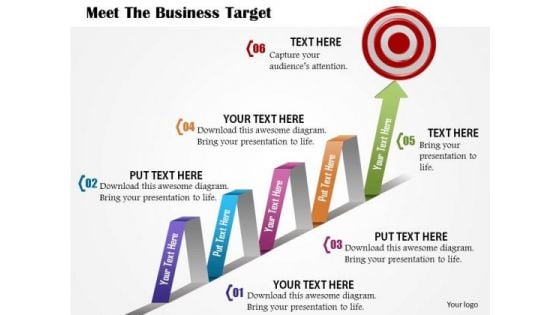
Business Diagram Meet The Business Target With Growth Arrow And Dart Presentation Template
This image slide displays business consulting diagram of meet the business target with growth arrow and dartboard. This image slide has been designed with graphic of colorful arrow and dart board. Text spaces have also been provided on arrow. This image slide is 100% editable. Use this PowerPoint template, in your presentations to explain concepts of management, targets, goals and various processes in business. May also be used in education related presentations. This image slide will enhance the quality of your presentations.
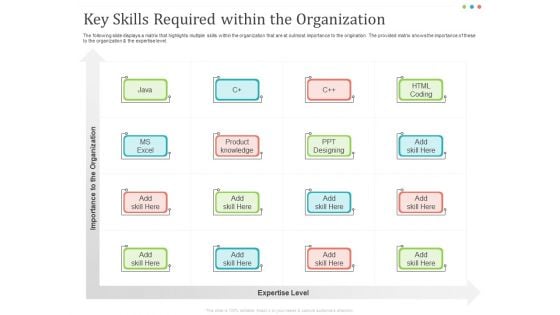
Establishing And Implementing HR Online Learning Program Key Skills Required Within The Organization Diagrams PDF
Presenting this set of slides with name establishing and implementing hr online learning program key skills required within the organization diagrams pdf. This is a one stage process. The stages in this process are product knowledge, ppt designing, html coding, ms excel, importance organization, expertise level. This is a completely editable PowerPoint presentation and is available for immediate download. Download now and impress your audience.

Five Tips For Sales Executive To Improve Productivity Ppt PowerPoint Presentation File Diagrams PDF
Presenting this set of slides with name five tips for sales executive to improve productivity ppt powerpoint presentation file diagrams pdf. This is a five stage process. The stages in this process are map customer acquisition process, design and execute contextual plays, clearly define service-level agreement, stop focusing efficiency, integrate and automate your playbook. This is a completely editable PowerPoint presentation and is available for immediate download. Download now and impress your audience.
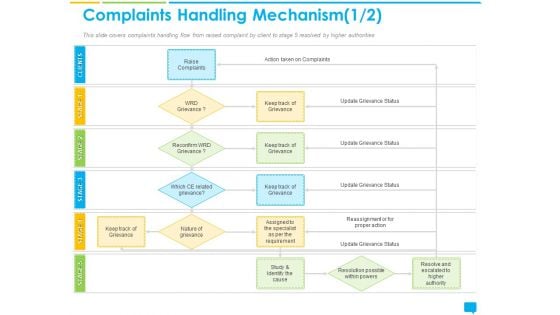
Introducing Management System Effectively Handling Customer Queries Complaints Handling Mechanism Action Diagrams PDF
Presenting introducing management system effectively handling customer queries complaints handling mechanism action diagrams pdf to provide visual cues and insights. Share and navigate important information on five stages that need your due attention. This template can be used to pitch topics like complaints handling mechanism. In addtion, this PPT design contains high resolution images, graphics, etc, that are easily editable and available for immediate download.

High Power Cleansing Work Client Testimonials For Pressure Washing Business Proposal Diagrams PDF
Presenting high power cleansing work client testimonials for pressure washing business proposal diagrams pdf to provide visual cues and insights. Share and navigate important information on three stages that need your due attention. This template can be used to pitch topics like client testimonials, pressure washing business. In addition, this PPT design contains high-resolution images, graphics, etc, that are easily editable and available for immediate download.

Hollywood Word In Los Angles United States Of America Ppt PowerPoint Presentation Gallery Diagrams PDF
Pitch your topic with ease and precision using this hollywood word in los angles united states of america ppt powerpoint presentation gallery diagrams pdf. This layout presents information on hollywood word in los angles united states of america. It is also available for immediate download and adjustment. So, changes can be made in the color, design, graphics or any other component to create a unique layout.
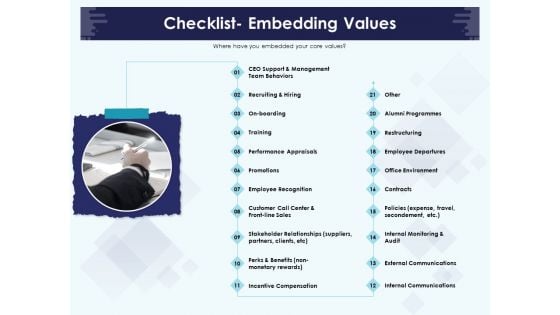
Role Of Human Resource In Workplace Culture Checklist Embedding Values Diagrams PDF
Presenting role of human resource in workplace culture checklist embedding values diagrams pdf to provide visual cues and insights. Share and navigate important information on twelve stages that need your due attention. This template can be used to pitch topics like recruiting and hiring, training, performance appraisals, promotions, employee recognition, incentive compensation, alumni programmes, restructuring, employee departures, internal communications, external communications. In addtion, this PPT design contains high-resolution images, graphics, etc, that are easily editable and available for immediate download.
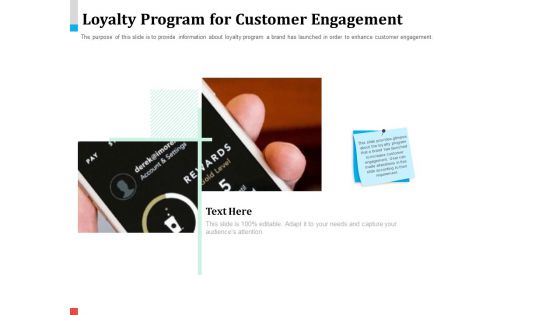
Product Share In Customer Wallet Loyalty Program For Customer Engagement Diagrams PDF
Presenting product share in customer wallet loyalty program for customer engagement diagrams pdf to provide visual cues and insights. Share and navigate important information on three stages that need your due attention. This template can be used to pitch topics like loyalty program for customer engagement. In addtion, this PPT design contains high resolution images, graphics, etc, that are easily editable and available for immediate download.
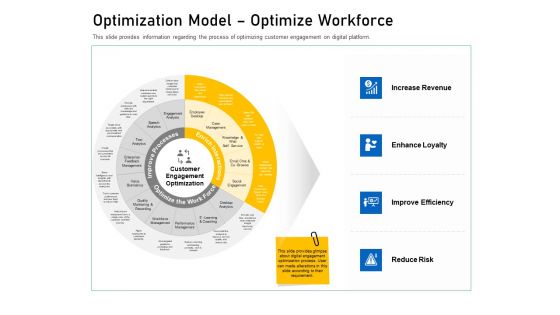
Enhancing Customer Engagement Digital Platform Optimization Model Optimize Workforce Diagrams PDF
Presenting enhancing customer engagement digital platform optimization model optimize workforce diagrams pdf to provide visual cues and insights. Share and navigate important information on four stages that need your due attention. This template can be used to pitch topics like increase revenue, enhance loyalty, improve efficiency, reduce risk. In addtion, this PPT design contains high resolution images, graphics, etc, that are easily editable and available for immediate download.
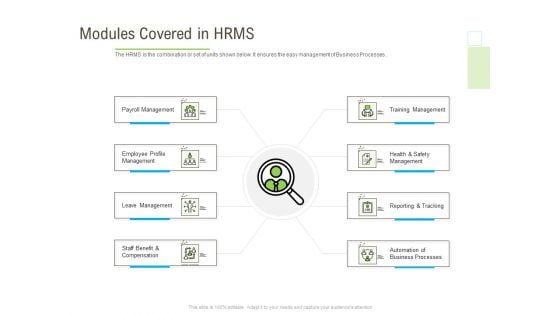
Rapid Innovation In HR Technology Space Modules Covered In HRMS Diagrams PDF
Presenting rapid innovation in hr technology space modules covered in hrms diagrams pdf to provide visual cues and insights. Share and navigate important information on eight stages that need your due attention. This template can be used to pitch topics like management, compensation, processes, business, training. In addtion, this PPT design contains high resolution images, graphics, etc, that are easily editable and available for immediate download.
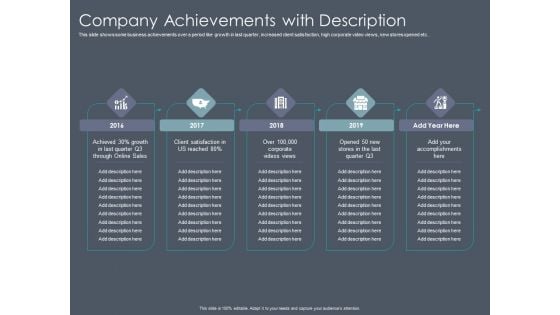
Private Equity Fund Pitch Deck To Raise Series C Funding Company Achievements With Description Diagrams PDF
Presenting private equity fund pitch deck to raise series c funding company achievements with description diagrams pdf to provide visual cues and insights. Share and navigate important information on five stages that need your due attention. This template can be used to pitch topics like 2016 to 2020. In addtion, this PPT design contains high-resolution images, graphics, etc, that are easily editable and available for immediate download.

Promotional Channels And Action Plan For Increasing Revenues Channel Sales Local And Global Partners Diagrams PDF
Presenting promotional channels and action plan for increasing revenues channel sales local and global partners diagrams pdf to provide visual cues and insights. Share and navigate important information on three stages that need your due attention. This template can be used to pitch topics like channel sales local and global partners. In addtion, this PPT design contains high resolution images, graphics, etc, that are easily editable and available for immediate download.
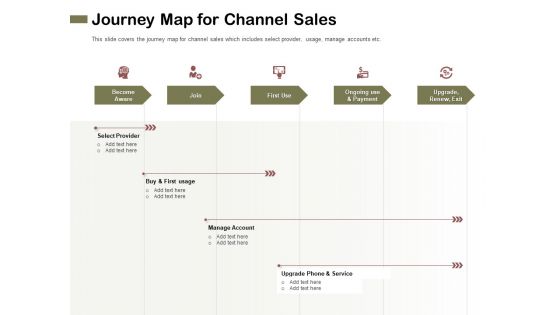
Promotional Channels And Action Plan For Increasing Revenues Journey Map For Channel Sales Diagrams PDF
Presenting promotional channels and action plan for increasing revenues journey map for channel sales diagrams pdf to provide visual cues and insights. Share and navigate important information on five stages that need your due attention. This template can be used to pitch topics like service, payment, provider, manage. In addtion, this PPT design contains high resolution images, graphics, etc, that are easily editable and available for immediate download.
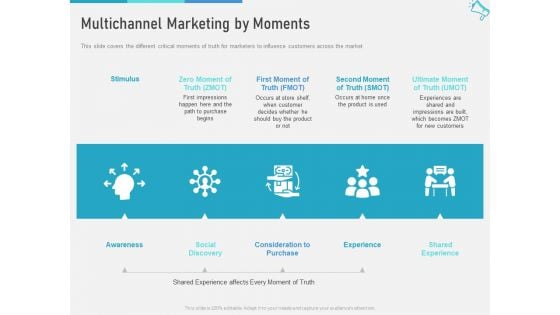
Multi Channel Marketing To Maximize Brand Exposure Multichannel Marketing By Moments Diagrams PDF
Presenting multi channel marketing to maximize brand exposure multichannel marketing by moments diagrams pdf to provide visual cues and insights. Share and navigate important information on five stages that need your due attention. This template can be used to pitch topics like awareness, social discovery, experience, consideration to purchase, shared experience. In addtion, this PPT design contains high resolution images, graphics, etc, that are easily editable and available for immediate download.
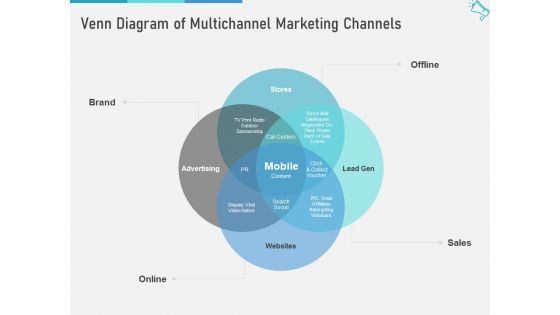
Multi Channel Marketing To Maximize Brand Exposure Venn Diagram Of Multichannel Marketing Channels Sample PDF
Presenting multi channel marketing to maximize brand exposure venn diagram of multichannel marketing channels sample pdf to provide visual cues and insights. Share and navigate important information on four stages that need your due attention. This template can be used to pitch topics like brand, online, sales, offline. In addtion, this PPT design contains high resolution images, graphics, etc, that are easily editable and available for immediate download.

Mv 22B Osprey Landing On United States Navy Aircraft Carrier Ppt PowerPoint Presentation Diagram Lists PDF
Showcasing this set of slides titled mv 22b osprey landing on united states navy aircraft carrier ppt powerpoint presentation diagram lists pdf. The topics addressed in these templates are mv 22b osprey landing on united states navy aircraft carrier. All the content presented in this PPT design is completely editable. Download it and make adjustments in color, background, font etc. as per your unique business setting.
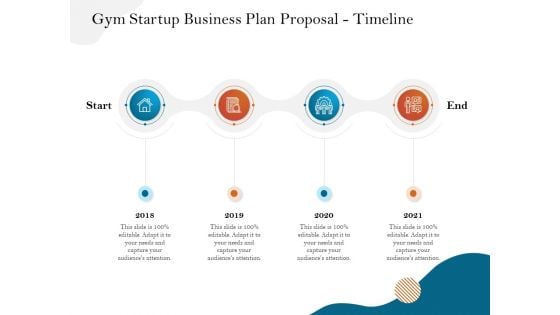
Gym And Fitness Center Business Plan Gym Startup Business Plan Proposal Timeline Diagrams PDF
Presenting gym and fitness center business plan gym startup business plan proposal timeline diagrams pdf to provide visual cues and insights. Share and navigate important information on four stages that need your due attention. This template can be used to pitch topics like timeline, 2018 to 2021. In addtion, this PPT design contains high-resolution images, graphics, etc, that are easily editable and available for immediate download.

Enterprise Thesis Abstract Summary Of Whole Study Ppt Summary Diagrams PDF
Presenting enterprise thesis abstract summary of whole study ppt summary diagrams pdf to provide visual cues and insights. Share and navigate important information on five stages that need your due attention. This template can be used to pitch topics like beginning of the thesis, opportunity of the thesis, expectation of the thesis, methods of the thesis, finding of the thesis. In addition, this PPT design contains high-resolution images, graphics, etc, that are easily editable and available for immediate download.

For Launching Company Site Work Contract Cont Ppt PowerPoint Presentation File Diagrams PDF
Presenting for launching company site work contract cont ppt powerpoint presentation file diagrams pdf to provide visual cues and insights. Share and navigate important information on four stages that need your due attention. This template can be used to pitch topics like confidentiality, termination clause, general provisions. In addtion, this PPT design contains high-resolution images, graphics, etc, that are easily editable and available for immediate download.
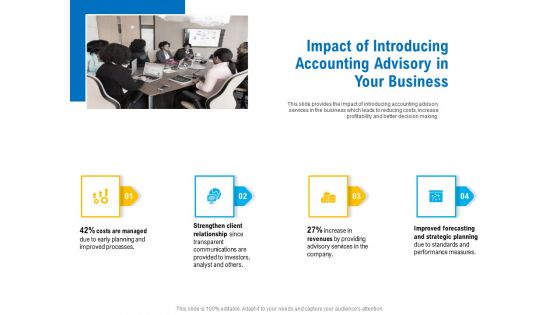
Business Service Provider Impact Of Introducing Accounting Advisory In Your Business Diagrams PDF
Presenting business service provider impact of introducing accounting advisory in your business diagrams pdf to provide visual cues and insights. Share and navigate important information on four stages that need your due attention. This template can be used to pitch topics like processes, planning, investors, communications, analyst. In addtion, this PPT design contains high resolution images, graphics, etc, that are easily editable and available for immediate download.

 Home
Home