Construction Icons
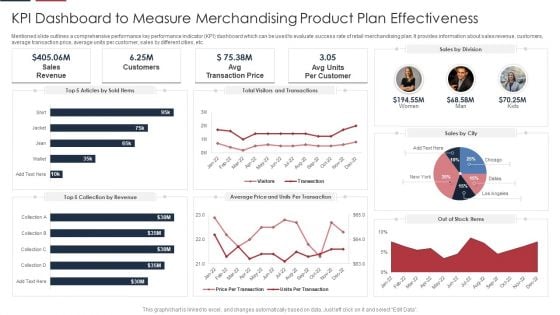
KPI Dashboard To Measure Merchandising Product Plan Effectiveness Guidelines PDF
Mentioned slide outlines a comprehensive performance key performance indicator KPI dashboard which can be used to evaluate success rate of retail merchandising plan. It provides information about sales revenue, customers, average transaction price, average units per customer, sales by different cities, etc. Showcasing this set of slides titled KPI Dashboard To Measure Merchandising Product Plan Effectiveness Guidelines PDF. The topics addressed in these templates are Sales, Customers, Price. All the content presented in this PPT design is completely editable. Download it and make adjustments in color, background, font etc. as per your unique business setting.
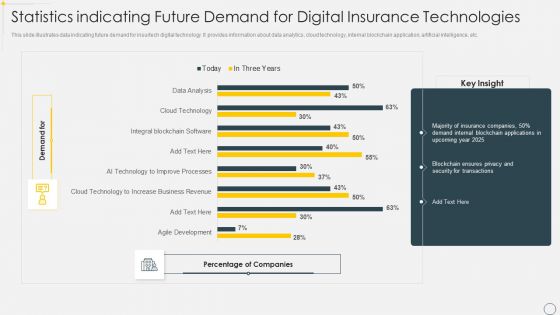
Statistics Indicating Future Demand For Digital Insurance Technologies Brochure PDF
This slide illustrates data indicating future demand for insurtech digital technology. It provides information about data analytics, cloud technology, internal blockchain application, artificial intelligence, etc. Pitch your topic with ease and precision using this Statistics Indicating Future Demand For Digital Insurance Technologies Brochure PDF. This layout presents information on Data Analytics, Cloud Technology, Internal Blockchain Application. It is also available for immediate download and adjustment. So, changes can be made in the color, design, graphics or any other component to create a unique layout.
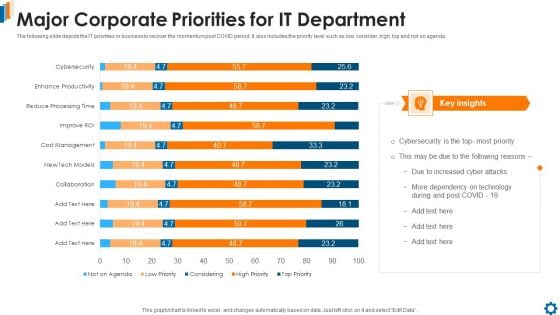
Major Corporate Priorities For It Department Ideas PDF
The following slide depicts the IT priorities in business to recover the momentum post COVID period. It also includes the priority level such as low, consider, high, top and not on agenda. Showcasing this set of slides titled Major Corporate Priorities For It Department Ideas PDF. The topics addressed in these templates are Major Corporate Priorities For It Department. All the content presented in this PPT design is completely editable. Download it and make adjustments in color, background, font etc. as per your unique business setting.
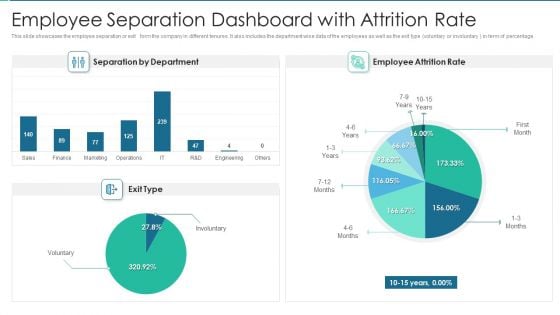
Employee Separation Dashboard With Attrition Rate Elements PDF
This slide showcases the employee separation or exit form the company in different tenures. It also includes the department wise data of the employees as well as the exit type voluntary or involuntary in term of percentage.Showcasing this set of slides titled Employee Separation Dashboard With Attrition Rate Elements PDF The topics addressed in these templates are Separation By Department, Employee Attrition Rate All the content presented in this PPT design is completely editable. Download it and make adjustments in color, background, font etc. as per your unique business setting.
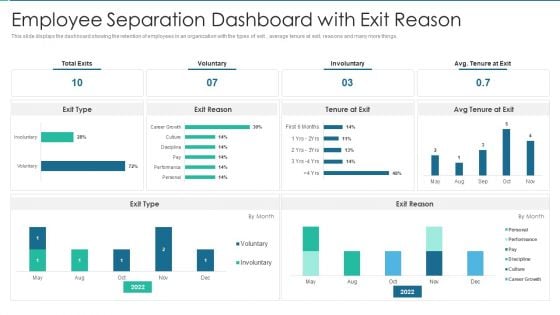
Employee Separation Dashboard With Exit Reason Rules PDF
This slide displays the dashboard showing the retention of employees in an organization with the types of exit , average tenure at exit, reasons and many more things. Pitch your topic with ease and precision using this Employee Separation Dashboard With Exit Reason Rules PDF This layout presents information on Employee Separation Dashboard With Exit Reason It is also available for immediate download and adjustment. So, changes can be made in the color, design, graphics or any other component to create a unique layout.
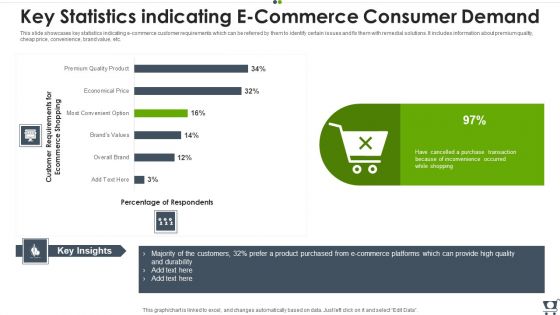
Key Statistics Indicating E Commerce Consumer Demand Professional PDF
This slide showcases key statistics indicating e commerce customer requirements which can be referred by them to identify certain issues and fix them with remedial solutions. It includes information about premium quality, cheap price, convenience, brand value, etc. Showcasing this set of slides titled Key Statistics Indicating E Commerce Consumer Demand Professional PDF. The topics addressed in these templates are E Commerce, Purchased, Product. All the content presented in this PPT design is completely editable. Download it and make adjustments in color, background, font etc. as per your unique business setting.
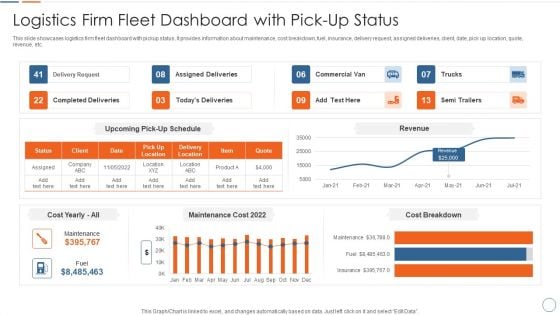
Logistics Firm Fleet Dashboard With Pick Up Status Introduction PDF
This slide showcases logistics firm fleet dashboard with pickup status. It provides information about maintenance, cost breakdown, fuel, insurance, delivery request, assigned deliveries, client, date, pick up location, quote, revenue, etc. Pitch your topic with ease and precision using this Logistics Firm Fleet Dashboard With Pick Up Status Introduction PDF. This layout presents information on Logistics Firm Fleet Dashboard With Pick Up Status. It is also available for immediate download and adjustment. So, changes can be made in the color, design, graphics or any other component to create a unique layout.
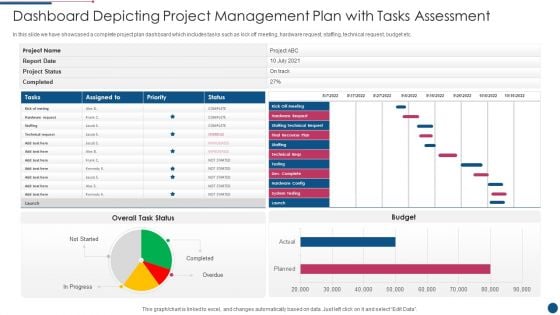
Dashboard Depicting Project Management Plan With Tasks Assessment Elements PDF
In this slide we have showcased a complete project plan dashboard which includes tasks such as kick off meeting, hardware request, staffing, technical request, budget etc. Showcasing this set of slides titled Dashboard Depicting Project Management Plan With Tasks Assessment Elements PDF. The topics addressed in these templates are Dashboard Depicting Project Management Plan With Tasks Assessment. All the content presented in this PPT design is completely editable. Download it and make adjustments in color, background, font etc. as per your unique business setting.
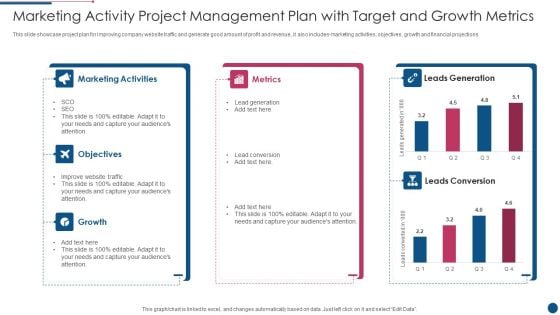
Marketing Activity Project Management Plan With Target And Growth Metrics Introduction PDF
This slide showcase project plan for improving company website traffic and generate good amount of profit and revenue, it also includes marketing activities, objectives, growth and financial projections. Pitch your topic with ease and precision using this Marketing Activity Project Management Plan With Target And Growth Metrics Introduction PDF. This layout presents information on Marketing Activities, Metrics, Growth. It is also available for immediate download and adjustment. So, changes can be made in the color, design, graphics or any other component to create a unique layout.
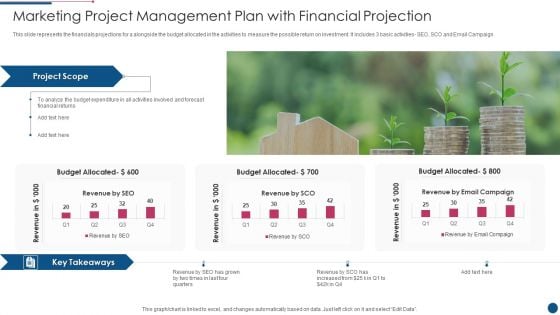
Marketing Project Management Plan With Financial Projection Sample PDF
This slide represents the financials projections for a alongside the budget allocated in the activities to measure the possible return on investment. It includes 3 basic activities- SEO, SCO and Email Campaign. Showcasing this set of slides titled Marketing Project Management Plan With Financial Projection Sample PDF. The topics addressed in these templates are Analyze, Financial, Revenue. All the content presented in this PPT design is completely editable. Download it and make adjustments in color, background, font etc. as per your unique business setting.
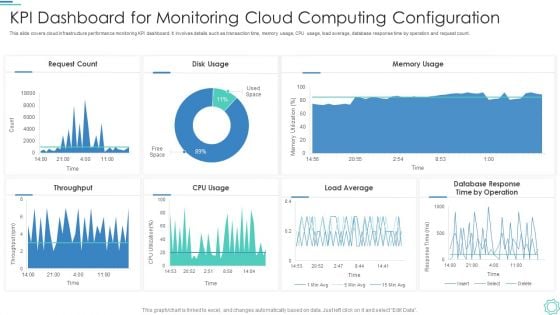
Kpi Dashboard For Monitoring Cloud Computing Configuration Portrait PDF
This slide covers cloud infrastructure performance monitoring KPI dashboard. It involves details such as transaction time, memory usage, CPU usage, load average, database response time by operation and request count.Showcasing this set of slides titled Kpi Dashboard For Monitoring Cloud Computing Configuration Portrait PDF. The topics addressed in these templates are Request Count, Disk Usage, Memory Usage. All the content presented in this PPT design is completely editable. Download it and make adjustments in color, background, font etc. as per your unique business setting.
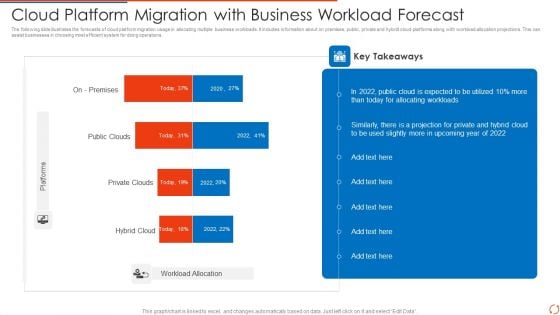
Cloud Platform Migration With Business Workload Forecast Introduction PDF Structure PDF
The following slide illustrates the forecasts of cloud platform migration usage in allocating multiple business workloads. It includes information about on premises, public, private and hybrid cloud platforms along with workload allocation projections. This can assist businesses in choosing most efficient system for doing operations.Showcasing this set of slides titled Cloud Platform Migration With Business Workload Forecast Introduction PDF Structure PDF. The topics addressed in these templates are Cloud Platform Migration With Business Workload Forecast. All the content presented in this PPT design is completely editable. Download it and make adjustments in color, background, font etc. as per your unique business setting.
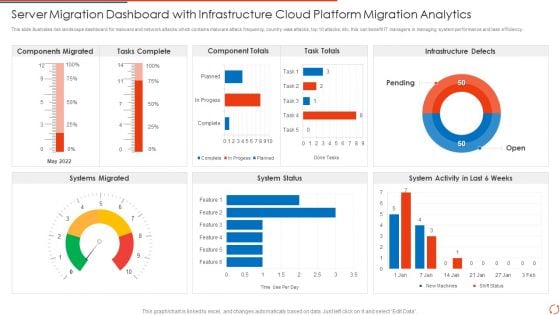
Server Migration Dashboard With Infrastructure Cloud Platform Migration Analytics Elements PDF Portrait PDF
This slide illustrates risk landscape dashboard for malware and network attacks which contains malware attack frequency, country wise attacks, top 10 attacks, etc. this can benefit IT managers in managing system performance and task efficiency Pitch your topic with ease and precision using this Server Migration Dashboard With Infrastructure Cloud Platform Migration Analytics Elements PDF Portrait PDF. This layout presents information on Tasks Complete, Component Totals, Task Totals. It is also available for immediate download and adjustment. So, changes can be made in the color, design, graphics or any other component to create a unique layout.
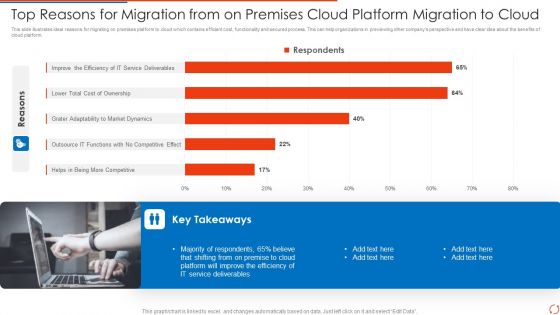
Top Reasons For Migration From On Premises Cloud Platform Migration To Cloud Introduction PDF Download PDF
This slide illustrates ideal reasons for migrating on premises platform to cloud which contains efficient cost, functionality and secured process. This can help organizations in previewing other companys perspective and have clear idea about the benefits of cloud platform.Showcasing this set of slides titled Top Reasons For Migration From On Premises Cloud Platform Migration To Cloud Introduction PDF Download PDF The topics addressed in these templates are Cost, Service Deliverables, Market. All the content presented in this PPT design is completely editable. Download it and make adjustments in color, background, font etc. as per your unique business setting.
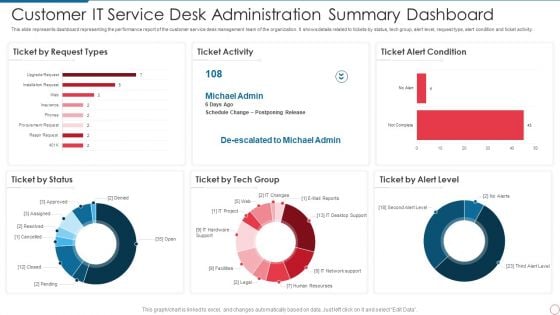
Customer IT Service Desk Administration Summary Dashboard Information PDF
This slide represents dashboard representing the performance report of the customer service desk management team of the organization. It shows details related to tickets by status, tech group, alert level, request type, alert condition and ticket activity. Showcasing this set of slides titled Customer IT Service Desk Administration Summary Dashboard Information PDF. The topics addressed in these templates are Customer It Service Desk Administration Summary Dashboard. All the content presented in this PPT design is completely editable. Download it and make adjustments in color, background, font etc. as per your unique business setting.
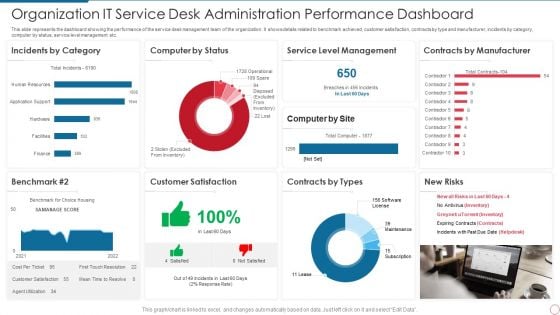
Organization IT Service Desk Administration Performance Dashboard Infographics PDF
This slide represents the dashboard showing the performance of the service desk management team of the organization. It shows details related to benchmark achieved, customer satisfaction, contracts by type and manufacturer, incidents by category, computer by status, service level management etc. Showcasing this set of slides titled Organization IT Service Desk Administration Performance Dashboard Infographics PDF. The topics addressed in these templates are Service, Management, Manufacturer. All the content presented in this PPT design is completely editable. Download it and make adjustments in color, background, font etc. as per your unique business setting.
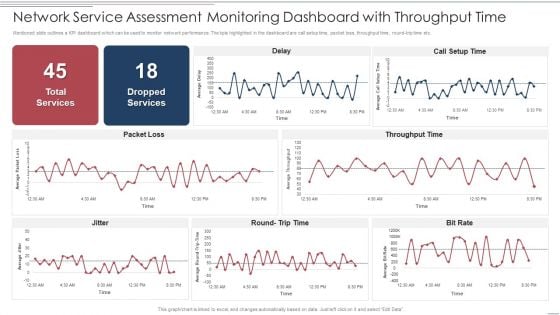
Network Service Assessment Monitoring Dashboard With Throughput Time Structure PDF
Mentioned slide outlines a KPI dashboard which can be used to monitor network performance. The kpis highlighted in the dashboard are call setup time, packet loss, throughput time, round trip time etc. Showcasing this set of slides titled Network Service Assessment Monitoring Dashboard With Throughput Time Structure PDF. The topics addressed in these templates are Network Service Assessment Monitoring Dashboard With Throughput Time. All the content presented in this PPT design is completely editable. Download it and make adjustments in color, background, font etc. as per your unique business setting.
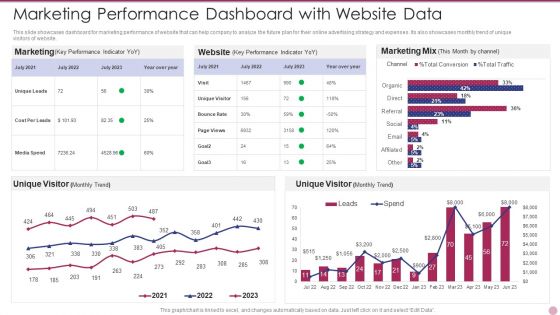
Marketing Performance Dashboard With Website Data Elements PDF
This slide showcases dashboard for marketing performance of website that can help company to analyze the future plan for their online advertising strategy and expenses. Its also showcases monthly trend of unique visitors of website. Pitch your topic with ease and precision using this Marketing Performance Dashboard With Website Data Elements PDF. This layout presents information on Marketing Performance Dashboard With Website Data. It is also available for immediate download and adjustment. So, changes can be made in the color, design, graphics or any other component to create a unique layout.
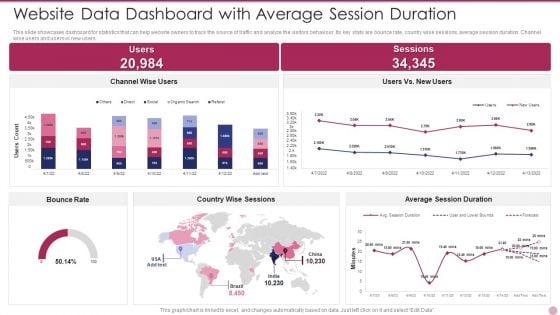
Website Data Dashboard With Average Session Duration Ideas PDF
This slide showcases dashboard for statistics that can help website owners to track the source of traffic and analyze the visitors behaviour. Its key stats are bounce rate, country wise sessions, average session duration. Channel wise users and users vs new users. Pitch your topic with ease and precision using this Website Data Dashboard With Average Session Duration Ideas PDF. This layout presents information on Website Data Dashboard With Average Session Duration. It is also available for immediate download and adjustment. So, changes can be made in the color, design, graphics or any other component to create a unique layout.
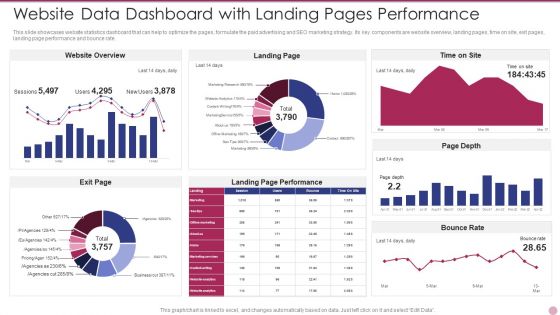
Website Data Dashboard With Landing Pages Performance Formats PDF
This slide showcases website statistics dashboard that can help to optimize the pages, formulate the paid advertising and SEO marketing strategy. Its key components are website overview, landing pages, time on site, exit pages, landing page performance and bounce rate. Showcasing this set of slides titled Website Data Dashboard With Landing Pages Performance Formats PDF. The topics addressed in these templates are Website Data Dashboard With Landing Pages Performance. All the content presented in this PPT design is completely editable. Download it and make adjustments in color, background, font etc. as per your unique business setting.
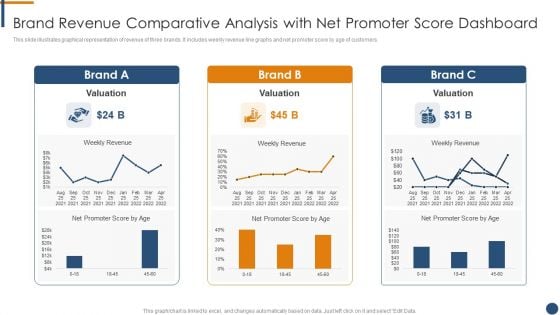
Brand Revenue Comparative Analysis With Net Promoter Score Dashboard Mockup PDF
This slide illustrates graphical representation of revenue of three brands. It includes weekly revenue line graphs and net promoter score by age of customers.Pitch your topic with ease and precision using this Brand Revenue Comparative Analysis With Net Promoter Score Dashboard Mockup PDF. This layout presents information on Brand Revenue Comparative Analysis With Net Promoter Score Dashboard. It is also available for immediate download and adjustment. So, changes can be made in the color, design, graphics or any other component to create a unique layout.
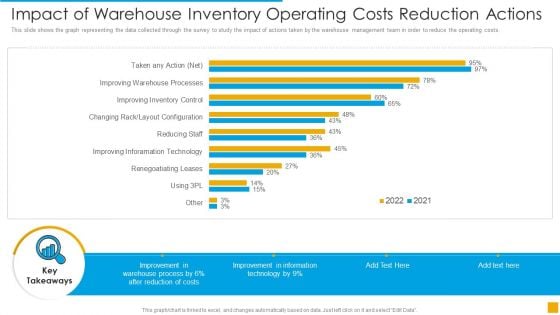
Impact Of Warehouse Inventory Operating Costs Reduction Actions Sample PDF
This slide shows the graph representing the data collected through the survey to study the impact of actions taken by the warehouse management team in order to reduce the operating costs Showcasing this set of slides titled Impact Of Warehouse Inventory Operating Costs Reduction Actions Sample PDF. The topics addressed in these templates are Information, Technology, Cost. All the content presented in this PPT design is completely editable. Download it and make adjustments in color, background, font etc. as per your unique business setting.
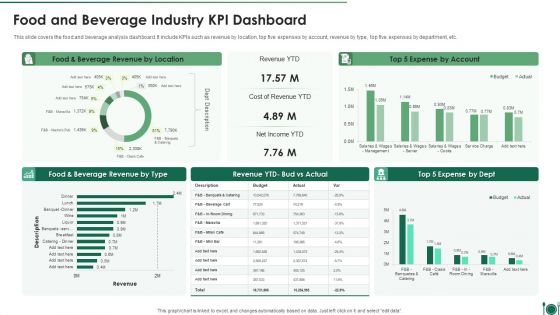
Food And Beverage Industry Kpi Dashboard Professional PDF
This slide covers the food and beverage analysis dashboard. It include KPIs such as revenue by location, top five expenses by account, revenue by type, top five expenses by department, etc.Showcasing this set of slides titled Food And Beverage Industry Kpi Dashboard Professional PDF. The topics addressed in these templates are Food And Beverage Industry KPI Dashboard. All the content presented in this PPT design is completely editable. Download it and make adjustments in color, background, font etc. as per your unique business setting
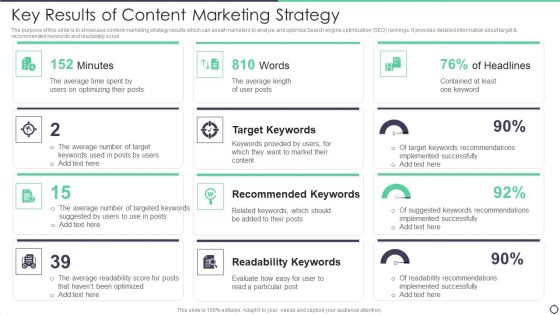
Key Results Of Content Marketing Strategy Background PDF
The purpose of this slide is to showcase content marketing strategy results which can assist marketers to analyze and optimize Search engine optimization SEO rankings. It provides detailed information about target and recommended keywords and readability score. Pitch your topic with ease and precision using this Key Results Of Content Marketing Strategy Background PDF. This layout presents information on Average, Target Keywords, Readability Keywords. It is also available for immediate download and adjustment. So, changes can be made in the color, design, graphics or any other component to create a unique layout.
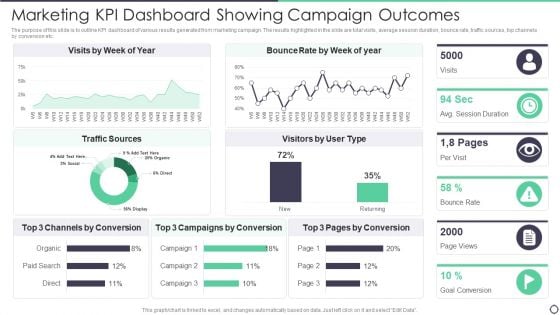
Marketing Kpi Dashboard Showing Campaign Outcomes Pictures PDF
The purpose of this slide is to outline KPI dashboard of various results generated from marketing campaign. The results highlighted in the slide are total visits, average session duration, bounce rate, traffic sources, top channels by conversion etc. Pitch your topic with ease and precision using this Marketing Kpi Dashboard Showing Campaign Outcomes Pictures PDF. This layout presents information on Marketing Kpi Dashboard Showing Campaign Outcomes. It is also available for immediate download and adjustment. So, changes can be made in the color, design, graphics or any other component to create a unique layout.
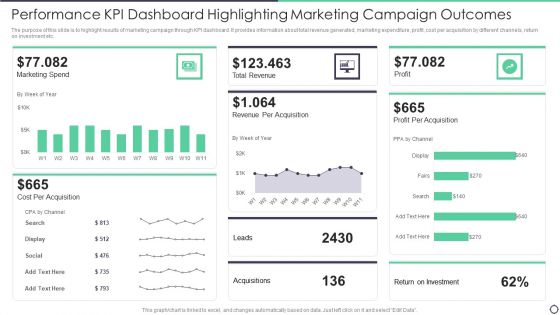
Performance Kpi Dashboard Highlighting Marketing Campaign Outcomes Topics PDF
The purpose of this slide is to highlight results of marketing campaign through KPI dashboard. It provides information about total revenue generated, marketing expenditure, profit, cost per acquisition by different channels, return on investment etc. Pitch your topic with ease and precision using this Performance Kpi Dashboard Highlighting Marketing Campaign Outcomes Topics PDF. This layout presents information on Cost, Marketing, Revenue. It is also available for immediate download and adjustment. So, changes can be made in the color, design, graphics or any other component to create a unique layout.
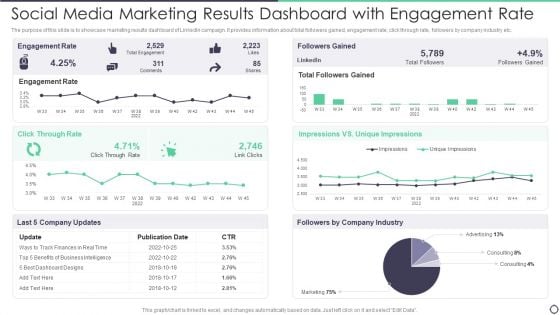
Social Media Marketing Results Dashboard With Engagement Rate Brochure PDF
The purpose of this slide is to showcase marketing results dashboard of LinkedIn campaign. It provides information about total followers gained, engagement rate, click through rate, followers by company industry etc. Pitch your topic with ease and precision using this Social Media Marketing Results Dashboard With Engagement Rate Brochure PDF. This layout presents information on Social Media Marketing Results Dashboard With Engagement Rate. It is also available for immediate download and adjustment. So, changes can be made in the color, design, graphics or any other component to create a unique layout.
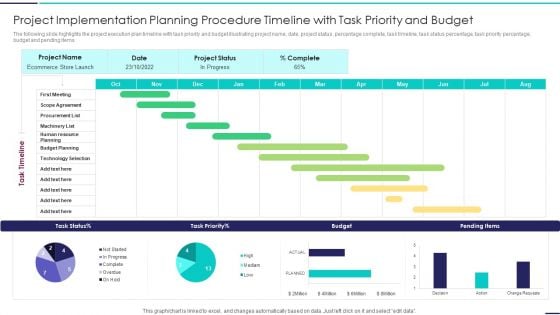
Project Implementation Planning Procedure Timeline With Task Priority And Budget Guidelines PDF
The following slide highlights the project execution plan timeline with task priority and budget illustrating project name, date, project status, percentage complete, task timeline, task status percentage, task priority percentage, budget and pending items. Showcasing this set of slides titled Project Implementation Planning Procedure Timeline With Task Priority And Budget Guidelines PDF. The topics addressed in these templates are Project Implementation Planning Procedure Timeline With Task Priority And Budget. All the content presented in this PPT design is completely editable. Download it and make adjustments in color, background, font etc. as per your unique business setting.
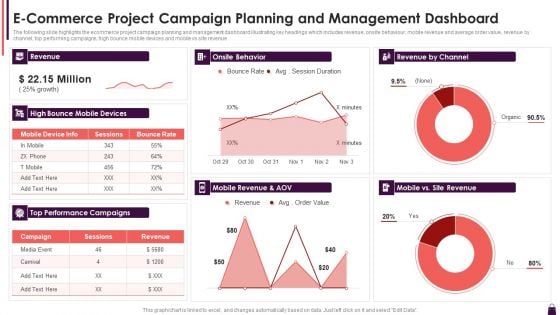
E Commerce Project Campaign Planning And Management Dashboard Structure PDF
The following slide highlights the ecommerce project campaign planning and management dashboard illustrating key headings which includes revenue, onsite behaviour, mobile revenue and average order value, revenue by channel, top performing campaigns, high bounce mobile devices and mobile vs site revenue Showcasing this set of slides titled E Commerce Project Campaign Planning And Management Dashboard Structure PDF. The topics addressed in these templates are E Commerce Project Campaign Planning And Management Dashboard. All the content presented in this PPT design is completely editable. Download it and make adjustments in color, background, font etc. as per your unique business setting.
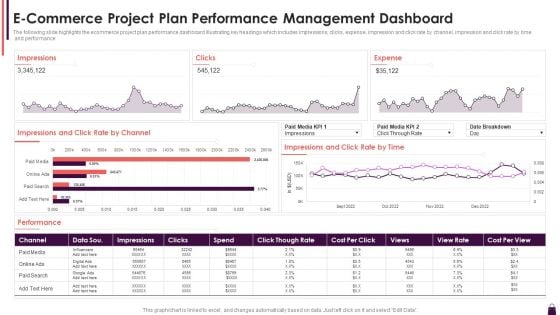
E Commerce Project Plan Performance Management Dashboard Slides PDF
The following slide highlights the ecommerce project plan performance dashboard illustrating key headings which includes impressions, clicks, expense, impression and click rate by channel, impression and click rate by time and performance. Showcasing this set of slides titled E Commerce Project Plan Performance Management Dashboard Slides PDF. The topics addressed in these templates are E Commerce Project Plan Performance Management Dashboard. All the content presented in this PPT design is completely editable. Download it and make adjustments in color, background, font etc. as per your unique business setting.
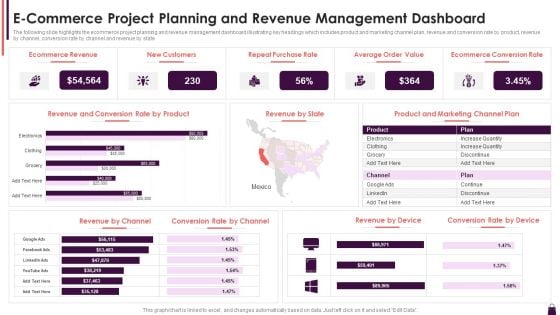
E Commerce Project Planning And Revenue Management Dashboard Introduction PDF
The following slide highlights the ecommerce project planning and revenue management dashboard illustrating key headings which includes product and marketing channel plan, revenue and conversion rate by product, revenue by channel, conversion rate by channel and revenue by state. Showcasing this set of slides titled E Commerce Project Planning And Revenue Management Dashboard Introduction PDF. The topics addressed in these templates are New Customers, Ecommerce Revenue, Repeat Purchase Rate. All the content presented in this PPT design is completely editable. Download it and make adjustments in color, background, font etc. as per your unique business setting.
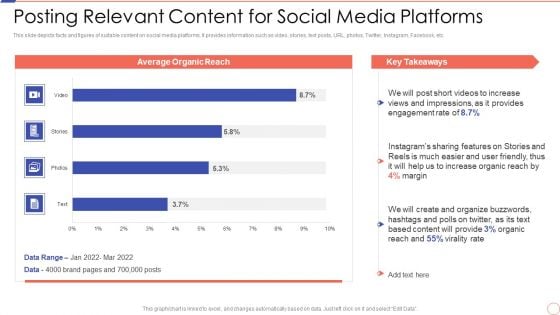
Social Media Engagement To Increase Customer Engagement Posting Relevant Content For Social Media Platforms Structure PDF
This slide depicts facts and figures of suitable content on social media platforms. It provides information such as video, stories, text posts, URL, photos, Twitter, Instagram, Facebook, etc. Showcasing this set of slides titled Social Media Engagement To Increase Customer Engagement Posting Relevant Content For Social Media Platforms Structure PDF. The topics addressed in these templates are Posting Relevant Content For Social Media Platforms. All the content presented in this PPT design is completely editable. Download it and make adjustments in color, background, font etc. as per your unique business setting.
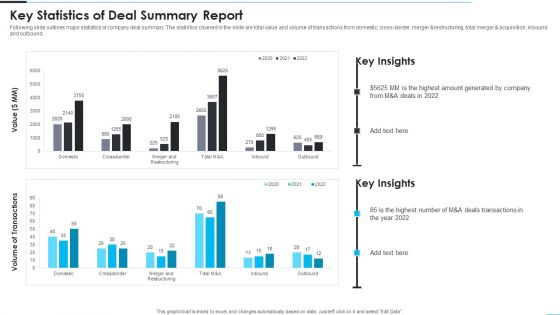
Key Statistics Of Deal Summary Report Formats PDF
Following slide outlines major statistics of company deal summary. The statistics covered in the slide are total value and volume of transactions from domestic, cross-border, merger and restructuring, total merger and acquisition, inbound and outbound. Pitch your topic with ease and precision using this Key Statistics Of Deal Summary Report Formats PDF. This layout presents information on Key Statistics Of Deal Summary Report. It is also available for immediate download and adjustment. So, changes can be made in the color, design, graphics or any other component to create a unique layout.
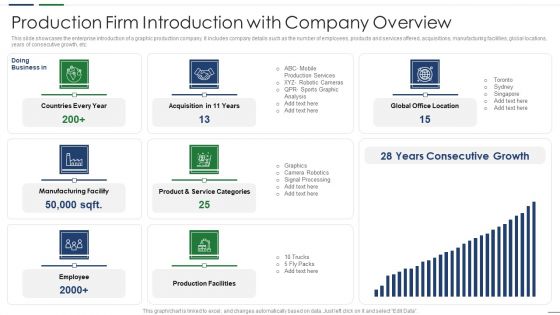
Production Firm Introduction With Company Overview Portrait PDF
This slide showcases the enterprise introduction of a graphic production company. It includes company details such as the number of employees, products and services offered, acquisitions, manufacturing facilities, global locations, years of consecutive growth, etc. Showcasing this set of slides titled Production Firm Introduction With Company Overview Portrait PDF. The topics addressed in these templates are Graphic, Services, Global. All the content presented in this PPT design is completely editable. Download it and make adjustments in color, background, font etc. as per your unique business setting.
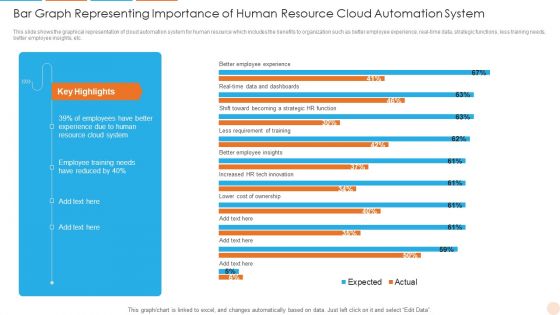
Bar Graph Representing Importance Of Human Resource Cloud Automation System Background PDF
This slide shows the graphical representation of cloud automation system for human resource which includes the benefits to organization such as better employee experience, real time data, strategic functions, less training needs, better employee insights, etc. Showcasing this set of slides titled Bar Graph Representing Importance Of Human Resource Cloud Automation System Background PDF. The topics addressed in these templates are System, Resource, Reduced. All the content presented in this PPT design is completely editable. Download it and make adjustments in color, background, font etc. as per your unique business setting.
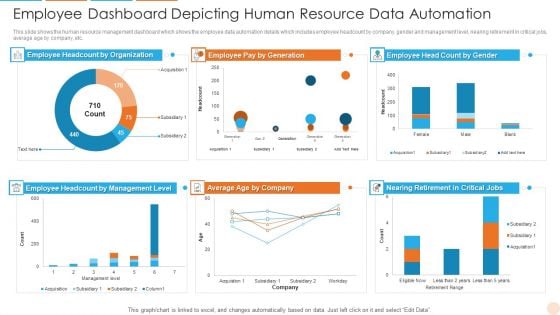
Employee Dashboard Depicting Human Resource Data Automation Professional PDF
This slide shows the human resource management dashboard which shows the employee data automation details which includes employee headcount by company, gender and management level, nearing retirement in critical jobs, average age by company, etc. Showcasing this set of slides titled Employee Dashboard Depicting Human Resource Data Automation Professional PDF. The topics addressed in these templates are Employee Dashboard Depicting Human Resource Data Automation. All the content presented in this PPT design is completely editable. Download it and make adjustments in color, background, font etc. as per your unique business setting.
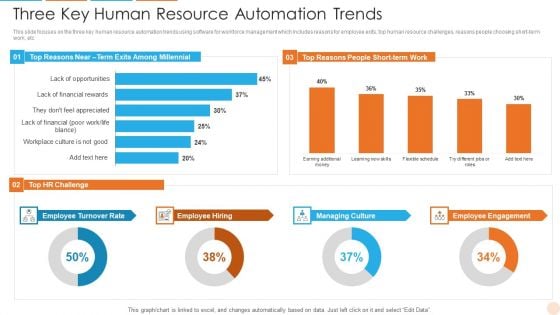
Three Key Human Resource Automation Trends Elements PDF
This slide focuses on the three key human resource automation trends using software for workforce management which includes reasons for employee exits, top human resource challenges, reasons people choosing short term work, etc. Showcasing this set of slides titled Three Key Human Resource Automation Trends Elements PDF. The topics addressed in these templates are Three Key Human Resource Automation Trends. All the content presented in this PPT design is completely editable. Download it and make adjustments in color, background, font etc. as per your unique business setting.
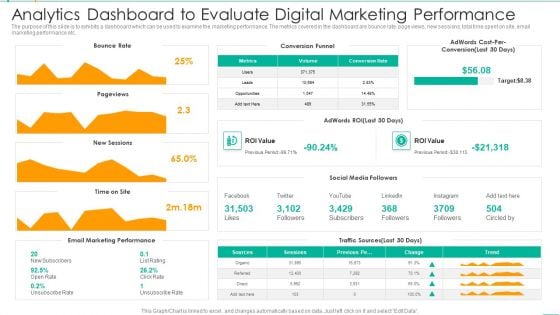
Analytics Dashboard To Evaluate Digital Marketing Performance Mockup PDF
The purpose of this slide is to exhibits a dashboard which can be used to examine the marketing performance. The metrics covered in the dashboard are bounce rate, page views, new sessions, total time spent on site, email marketing performance etc. Showcasing this set of slides titled Analytics Dashboard To Evaluate Digital Marketing Performance Mockup PDF. The topics addressed in these templates are Conversion Funnel, Target, Marketing Performance. All the content presented in this PPT design is completely editable. Download it and make adjustments in color, background, font etc. as per your unique business setting.
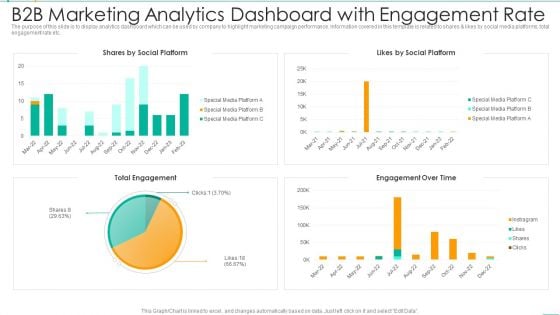
B2b Marketing Analytics Dashboard With Engagement Rate Microsoft PDF
The purpose of this slide is to display analytics dashboard which can be used by company to highlight marketing campaign performance. Information covered in this template is related to shares and likes by social media platforms, total engagement rate etc. Showcasing this set of slides titled B2b Marketing Analytics Dashboard With Engagement Rate Microsoft PDF. The topics addressed in these templates are B2b Marketing Analytics Dashboard With Engagement Rate. All the content presented in this PPT design is completely editable. Download it and make adjustments in color, background, font etc. as per your unique business setting.
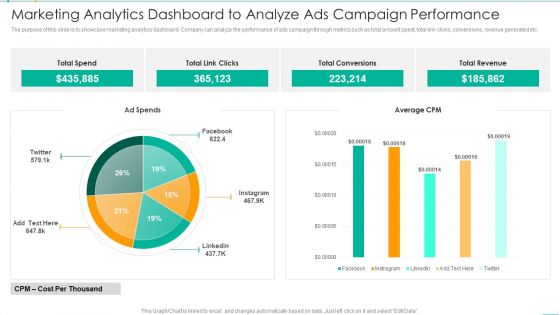
Marketing Analytics Dashboard To Analyze Ads Campaign Performance Microsoft PDF
The purpose of this slide is to showcase marketing analytics dashboard. Company can analyze the performance of ads campaign through metrics such as total amount spent, total link clicks, conversions, revenue generated etc. Showcasing this set of slides titled Marketing Analytics Dashboard To Analyze Ads Campaign Performance Microsoft PDF. The topics addressed in these templates are Marketing Analytics Dashboard To Analyze Ads Campaign Performance. All the content presented in this PPT design is completely editable. Download it and make adjustments in color, background, font etc. as per your unique business setting.
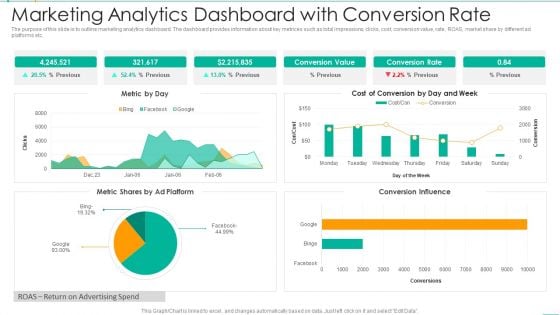
Marketing Analytics Dashboard With Conversion Rate Summary PDF
The purpose of this slide is to outline marketing analytics dashboard. The dashboard provides information about key metrices such as total impressions, clicks, cost, conversion value, rate, ROAS, market share by different ad platforms etc. Pitch your topic with ease and precision using this Marketing Analytics Dashboard With Conversion Rate Summary PDF. This layout presents information on Marketing Analytics Dashboard With Conversion Rate. It is also available for immediate download and adjustment. So, changes can be made in the color, design, graphics or any other component to create a unique layout.
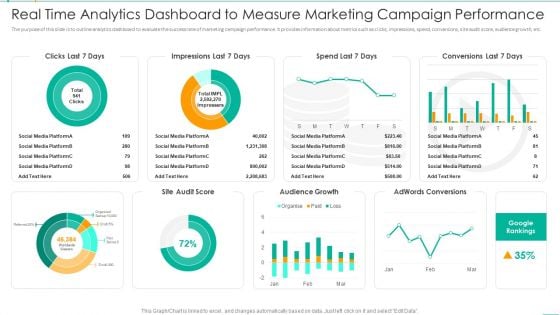
Real Time Analytics Dashboard To Measure Marketing Campaign Performance Information PDF
The purpose of this slide is to outline analytics dashboard to evaluate the success rate of marketing campaign performance. It provides information about metrics such as clicks, impressions, spend, conversions, site audit score, audience growth, etc. Pitch your topic with ease and precision using this Real Time Analytics Dashboard To Measure Marketing Campaign Performance Information PDF. This layout presents information on Real Time Analytics Dashboard To Measure Marketing Campaign Performance. It is also available for immediate download and adjustment. So, changes can be made in the color, design, graphics or any other component to create a unique layout.
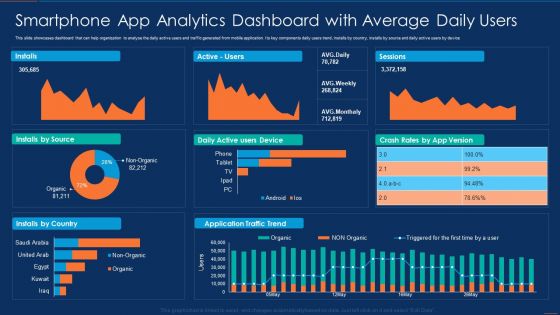
Smartphone App Analytics Dashboard With Average Daily Users Microsoft PDF
This slide showcases dashboard that can help organization to analyse the daily active users and traffic generated from mobile application. Its key components daily users trend, installs by country, installs by source and daily active users by device. Showcasing this set of slides titled Smartphone App Analytics Dashboard With Average Daily Users Microsoft PDF. The topics addressed in these templates are Smartphone App Analytics Dashboard With Average Daily Users. All the content presented in this PPT design is completely editable. Download it and make adjustments in color, background, font etc. as per your unique business setting.
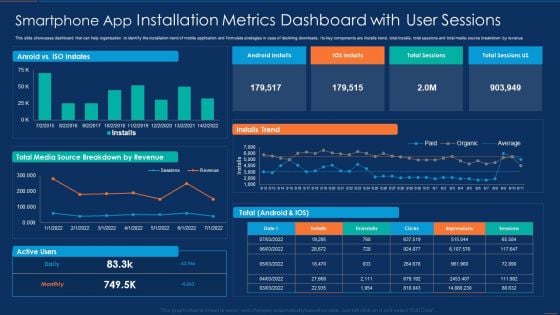
Smartphone App Installation Metrics Dashboard With User Sessions Microsoft PDF
This slide showcases dashboard that can help organization to identify the installation trend of mobile application and formulate strategies in case of declining downloads. Its key components are installs trend, total installs, total sessions and total media source breakdown by revenue. Pitch your topic with ease and precision using this Smartphone App Installation Metrics Dashboard With User Sessions Microsoft PDF. This layout presents information on Smartphone App Installation Metrics Dashboard With User Sessions. It is also available for immediate download and adjustment. So, changes can be made in the color, design, graphics or any other component to create a unique layout.
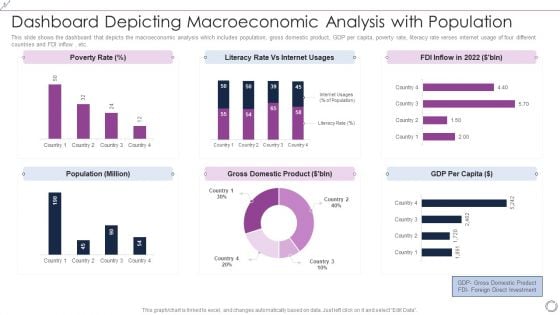
Dashboard Depicting Macroeconomic Analysis With Population Inspiration PDF
This slide shows the dashboard that depicts the macroeconomic analysis which includes population, gross domestic product, GDP per capita, poverty rate, literacy rate verses internet usage of four different countries and FDI inflow, etc. Pitch your topic with ease and precision using this Dashboard Depicting Macroeconomic Analysis With Population Inspiration PDF. This layout presents information on Poverty Rate, Literacy Rate Vs Internet Usages, FDI Inflow In 2022. It is also available for immediate download and adjustment. So, changes can be made in the color, design, graphics or any other component to create a unique layout.
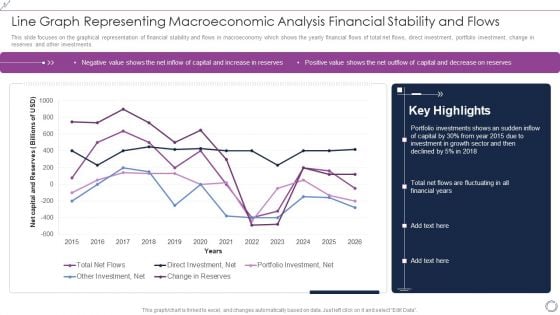
Line Graph Representing Macroeconomic Analysis Financial Stability And Flows Rules PDF
This slide focuses on the graphical representation of financial stability and flows in macroeconomy which shows the yearly financial flows of total net flows, direct investment, portfolio investment, change in reserves and other investments. Showcasing this set of slides titled Line Graph Representing Macroeconomic Analysis Financial Stability And Flows Rules PDF. The topics addressed in these templates are Total Net Flows, Direct Investment, Net, Portfolio Investment, Net. All the content presented in this PPT design is completely editable. Download it and make adjustments in color, background, font etc. as per your unique business setting.
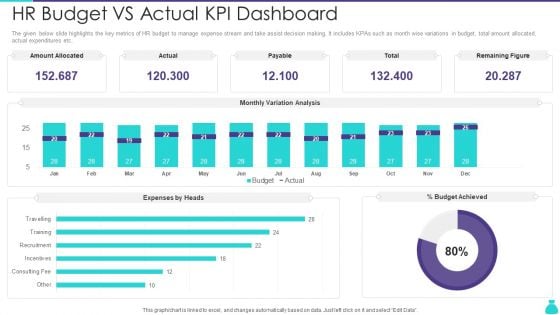
HR Budget Vs Actual KPI Dashboard Ppt PowerPoint Presentation File Structure PDF
The given below slide highlights the key metrics of HR budget to manage expense stream and take assist decision making. It includes KPAs such as month wise variations in budget, total amount allocated, actual expenditures etc. Pitch your topic with ease and precision using this HR Budget Vs Actual KPI Dashboard Ppt PowerPoint Presentation File Structure PDF. This layout presents information on Amount Allocated, Expenses by Heads, Budget Achieved. It is also available for immediate download and adjustment. So, changes can be made in the color, design, graphics or any other component to create a unique layout.
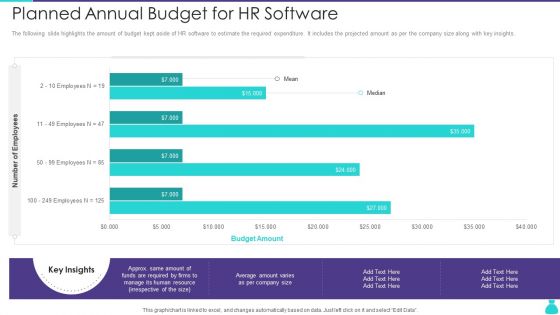
Planned Annual Budget For HR Software Ppt PowerPoint Presentation Gallery Outfit PDF
The following slide highlights the amount of budget kept aside of HR software to estimate the required expenditure. It includes the projected amount as per the company size along with key insights. Pitch your topic with ease and precision using this Planned Annual Budget For HR Software Ppt PowerPoint Presentation Gallery Outfit PDF. This layout presents information on Budget Amount, Employee. It is also available for immediate download and adjustment. So, changes can be made in the color, design, graphics or any other component to create a unique layout.
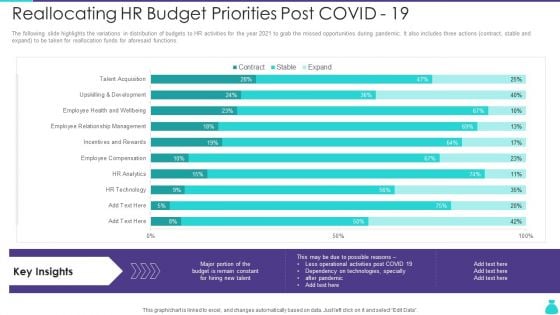
Reallocating HR Budget Priorities Post Covid 19 Ppt PowerPoint Presentation Gallery Graphics Download PDF
The following slide highlights the variations in distribution of budgets to HR activities for the year 2021 to grab the missed opportunities during pandemic. It also includes three actions contract, stable and expand to be taken for reallocation funds for aforesaid functions. Pitch your topic with ease and precision using this Reallocating HR Budget Priorities Post Covid 19 Ppt PowerPoint Presentation Gallery Graphics Download PDF. This layout presents information on HR Technology, HR Analytics, Employee Compensation. It is also available for immediate download and adjustment. So, changes can be made in the color, design, graphics or any other component to create a unique layout.
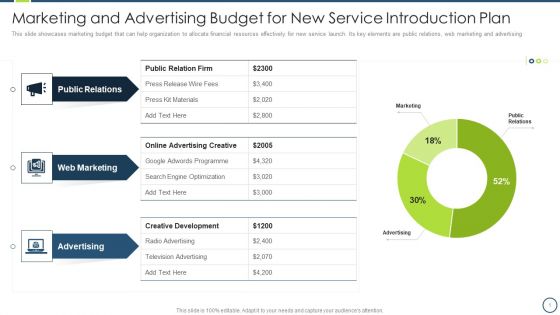
Marketing And Advertising Budget For New Service Introduction Plan Formats PDF
This slide showcases marketing budget that can help organization to allocate financial resources effectively for new service launch. Its key elements are public relations, web marketing and advertising. Showcasing this set of slides titled Marketing And Advertising Budget For New Service Introduction Plan Formats PDF. The topics addressed in these templates are Public Relations, Web Marketing, Advertising. All the content presented in this PPT design is completely editable. Download it and make adjustments in color, background, font etc. as per your unique business setting.
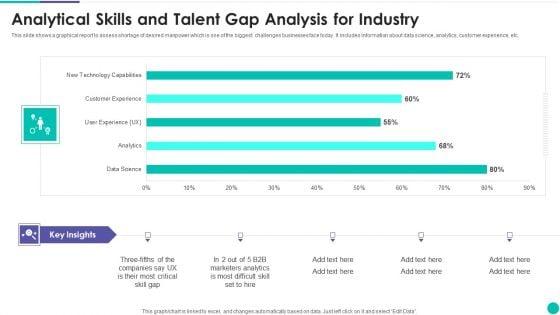
Analytical Skills And Talent Gap Analysis For Industry Template PDF
This slide shows a graphical report to assess shortage of desired manpower which is one of the biggest challenges businesses face today. It includes information about data science, analytics, customer experience, etc. Showcasing this set of slides titled Analytical Skills And Talent Gap Analysis For Industry Template PDF. The topics addressed in these templates are Marketers, Analytics, Data Science. All the content presented in this PPT design is completely editable. Download it and make adjustments in color, background, font etc. as per your unique business setting.
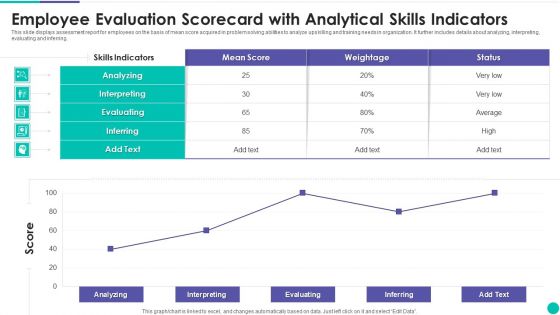
Employee Evaluation Scorecard With Analytical Skills Indicators Clipart PDF
This slide displays assessment report for employees on the basis of mean score acquired in problem solving abilities to analyze upskilling and training needs in organization. It further includes details about analyzing, interpreting, evaluating and inferring. Pitch your topic with ease and precision using this Employee Evaluation Scorecard With Analytical Skills Indicators Clipart PDF. This layout presents information on Analyzing, Interpreting, Evaluating. It is also available for immediate download and adjustment. So, changes can be made in the color, design, graphics or any other component to create a unique layout.
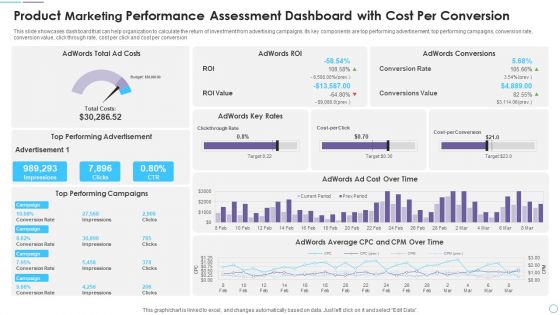
Product Marketing Performance Assessment Dashboard With Cost Per Conversion Professional PDF
This slide showcases dashboard that can help organization to calculate the return of investment from advertising campaigns. Its key components are top performing advertisement, top performing campaigns, conversion rate, conversion value, click through rate, cost per click and cost per conversion. Showcasing this set of slides titled Product Marketing Performance Assessment Dashboard With Cost Per Conversion Professional PDF. The topics addressed in these templates are Top Performing Advertisement, Top Performing Campaigns, AdWords Conversions. All the content presented in this PPT design is completely editable. Download it and make adjustments in color, background, font etc. as per your unique business setting.
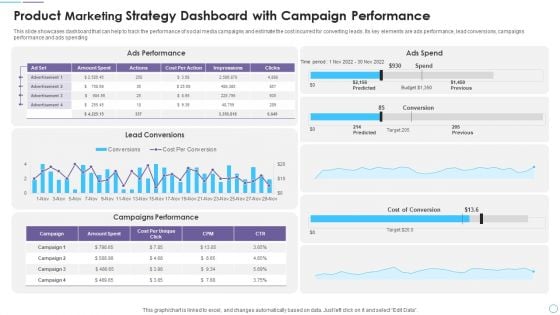
Product Marketing Strategy Dashboard With Campaign Performance Inspiration PDF
This slide showcases dashboard that can help to track the performance of social media campaigns and estimate the cost incurred for converting leads. Its key elements are ads performance, lead conversions, campaigns performance and ads spending. Showcasing this set of slides titled Product Marketing Strategy Dashboard With Campaign Performance Inspiration PDF. The topics addressed in these templates are Ads Performance, Ads Spend, Lead Conversions, Campaigns Performance. All the content presented in this PPT design is completely editable. Download it and make adjustments in color, background, font etc. as per your unique business setting.

Risk Assessment Software Dashboard For Cybersecurity Ppt PowerPoint Presentation Gallery Pictures PDF
This slide represents risk assessment software dashboard for cybersecurity. It includes risk percentage, number of risks, risk analysis progress, risk response progress, risk rating etc. Showcasing this set of slides titled Risk Assessment Software Dashboard For Cybersecurity Ppt PowerPoint Presentation Gallery Pictures PDF. The topics addressed in these templates are Risk Rating Breakdown, Action Plan Breakdown, Top 5 Entities Prone To Risk. All the content presented in this PPT design is completely editable. Download it and make adjustments in color, background, font etc. as per your unique business setting.
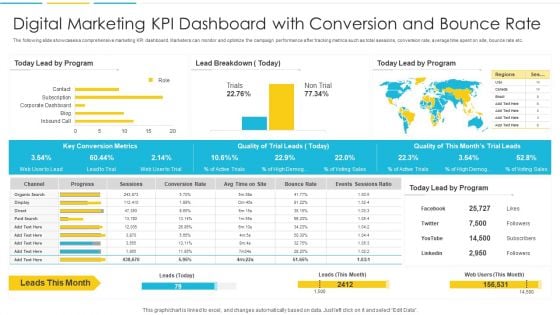
Digital Marketing KPI Dashboard With Conversion And Bounce Rate Introduction PDF
The following slide showcases a comprehensive marketing KPI dashboard. Marketers can monitor and optimize the campaign performance after tracking metrics such as total sessions, conversion rate, average time spent on site, bounce rate etc. Pitch your topic with ease and precision using this Digital Marketing KPI Dashboard With Conversion And Bounce Rate Introduction PDF. This layout presents information on Organic, Progress, Conversion Rate. It is also available for immediate download and adjustment. So, changes can be made in the color, design, graphics or any other component to create a unique layout
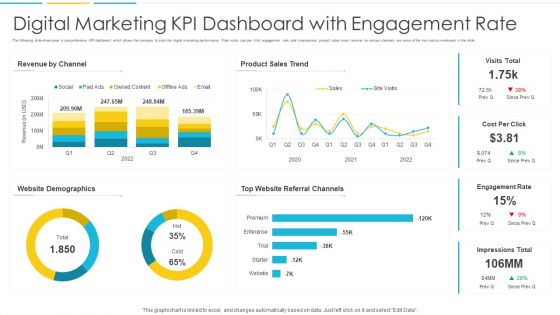
Digital Marketing KPI Dashboard With Engagement Rate Background PDF
The following slide showcases a comprehensive KPI dashboard which allows the company to track the digital marketing performance. Total visits, cost per click, engagement rate, total impressions, product sales trend, revenue by various channels are some of the key metrics mentioned in the slide. Showcasing this set of slides titled Digital Marketing KPI Dashboard With Engagement Rate Background PDF. The topics addressed in these templates are Demographics, Revenue, Sales. All the content presented in this PPT design is completely editable. Download it and make adjustments in color, background, font etc. as per your unique business setting.
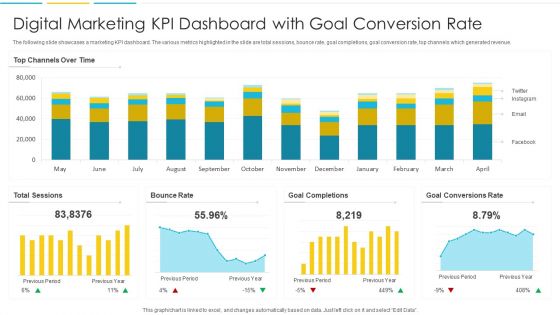
Digital Marketing KPI Dashboard With Goal Conversion Rate Ideas PDF
The following slide showcases a marketing KPI dashboard. The various metrics highlighted in the slide are total sessions, bounce rate, goal completions, goal conversion rate, top channels which generated revenue. Pitch your topic with ease and precision using this Digital Marketing KPI Dashboard With Goal Conversion Rate Ideas PDF. This layout presents information on Rate, Goal, Conversions. It is also available for immediate download and adjustment. So, changes can be made in the color, design, graphics or any other component to create a unique layout.
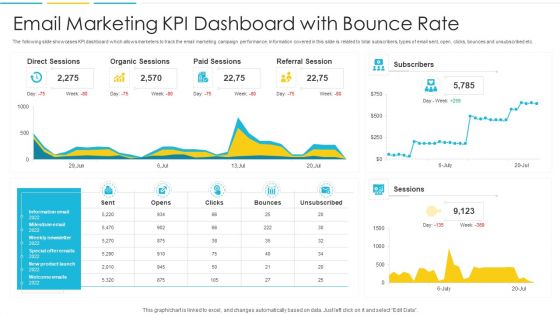
Email Marketing KPI Dashboard With Bounce Rate Demonstration PDF
The following slide showcases KPI dashboard which allows marketers to track the email marketing campaign performance. Information covered in this slide is related to total subscribers, types of email sent, open, clicks, bounces and unsubscribed etc. Showcasing this set of slides titled Email Marketing KPI Dashboard With Bounce Rate Demonstration PDF. The topics addressed in these templates are Organic, Paid, Information. All the content presented in this PPT design is completely editable. Download it and make adjustments in color, background, font etc. as per your unique business setting
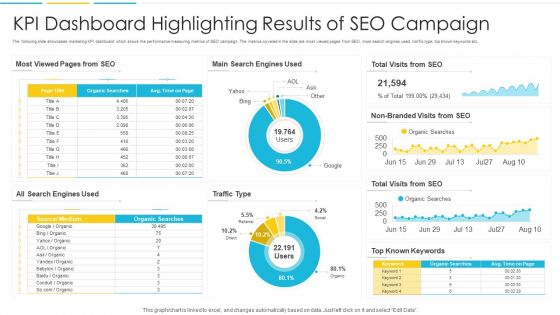
KPI Dashboard Highlighting Results Of SEO Campaign Topics PDF
The following slide showcases marketing KPI dashboard which shows the performance measuring metrics of SEO campaign. The metrics covered in the slide are most viewed pages from SEO, most search engines used, traffic type, top known keywords etc. Pitch your topic with ease and precision using this KPI Dashboard Highlighting Results Of SEO Campaign Topics PDF. This layout presents information on Search Engines, Traffic, Organic. It is also available for immediate download and adjustment. So, changes can be made in the color, design, graphics or any other component to create a unique layout.


 Continue with Email

 Home
Home


