Content Analysis
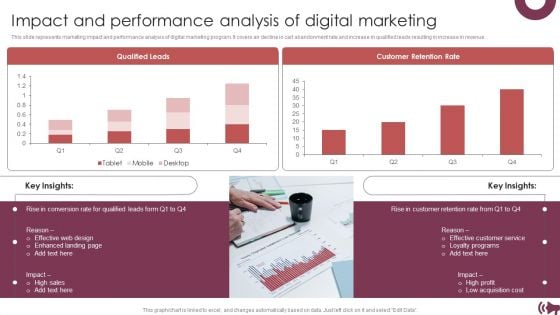
Guide Digital Advertising Optimize Lead Targeting Impact And Performance Analysis Of Digital Marketing Summary PDF
This slide represents marketing impact and performance analysis of digital marketing program. It covers an decline in cart abandonment rate and increase in qualified leads resulting in increase in revenue. Here you can discover an assortment of the finest PowerPoint and Google Slides templates. With these templates, you can create presentations for a variety of purposes while simultaneously providing your audience with an eye catching visual experience. Download Guide Digital Advertising Optimize Lead Targeting Impact And Performance Analysis Of Digital Marketing Summary PDF to deliver an impeccable presentation. These templates will make your job of preparing presentations much quicker, yet still, maintain a high level of quality. Slidegeeks has experienced researchers who prepare these templates and write high quality content for you. Later on, you can personalize the content by editing the Guide Digital Advertising Optimize Lead Targeting Impact And Performance Analysis Of Digital Marketing Summary PDF.
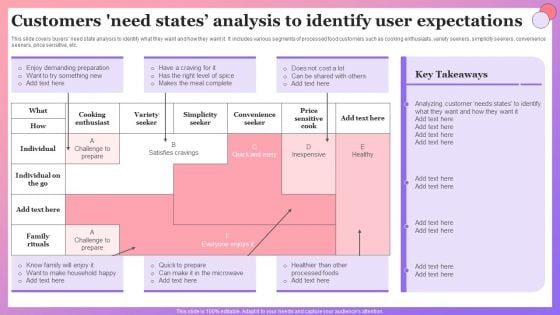
Enabling Brand Portfolio Customers Need States Analysis To Identify User Expectations Pictures PDF
This slide covers buyers need state analysis to identify what they want and how they want it. It includes various segments of processed food customers such as cooking enthusiasts, variety seekers, simplicity seekers, convenience seekers, price sensitive, etc. Formulating a presentation can take up a lot of effort and time, so the content and message should always be the primary focus. The visuals of the PowerPoint can enhance the presenters message, so our Enabling Brand Portfolio Customers Need States Analysis To Identify User Expectations Pictures PDF was created to help save time. Instead of worrying about the design, the presenter can concentrate on the message while our designers work on creating the ideal templates for whatever situation is needed. Slidegeeks has experts for everything from amazing designs to valuable content, we have put everything into Enabling Brand Portfolio Customers Need States Analysis To Identify User Expectations Pictures PDF.
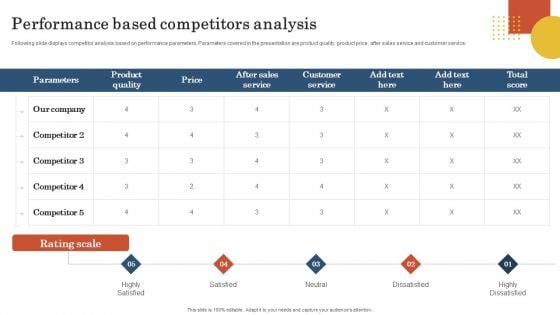
Retail Business Operation Management To Optimize Customer Experience Performance Based Competitors Analysis Designs PDF
Following slide displays competitor analysis based on performance parameters. Parameters covered in the presentation are product quality, product price, after sales service and customer service. Formulating a presentation can take up a lot of effort and time, so the content and message should always be the primary focus. The visuals of the PowerPoint can enhance the presenters message, so our Retail Business Operation Management To Optimize Customer Experience Performance Based Competitors Analysis Designs PDF was created to help save time. Instead of worrying about the design, the presenter can concentrate on the message while our designers work on creating the ideal templates for whatever situation is needed. Slidegeeks has experts for everything from amazing designs to valuable content, we have put everything into Retail Business Operation Management To Optimize Customer Experience Performance Based Competitors Analysis Designs PDF
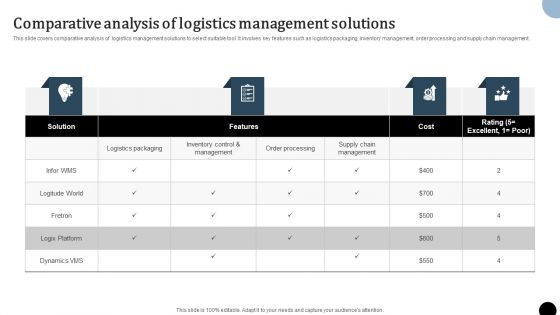
Strategy To Enhance Supply Chain Operations Comparative Analysis Of Logistics Management Solutions Themes PDF
This slide covers comparative analysis of logistics management solutions to select suitable tool. It involves key features such as logistics packaging, inventory management, order processing and supply chain management. Formulating a presentation can take up a lot of effort and time, so the content and message should always be the primary focus. The visuals of the PowerPoint can enhance the presenters message, so our Strategy To Enhance Supply Chain Operations Comparative Analysis Of Logistics Management Solutions Themes PDF was created to help save time. Instead of worrying about the design, the presenter can concentrate on the message while our designers work on creating the ideal templates for whatever situation is needed. Slidegeeks has experts for everything from amazing designs to valuable content, we have put everything into Strategy To Enhance Supply Chain Operations Comparative Analysis Of Logistics Management Solutions Themes PDF
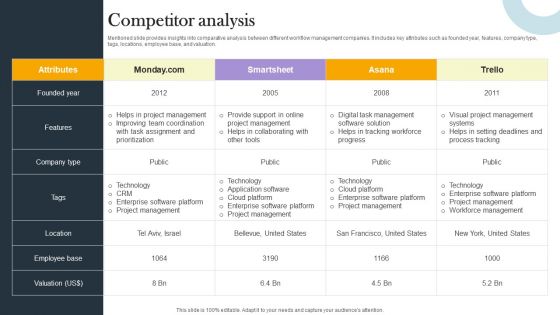
Business Process Optimization Platform Investors Funding Presentation Competitor Analysis Template PDF
Mentioned slide provides insights into comparative analysis between different workflow management companies. It includes key attributes such as founded year, features, company type, tags, locations, employee base, and valuation. Formulating a presentation can take up a lot of effort and time, so the content and message should always be the primary focus. The visuals of the PowerPoint can enhance the presenters message, so our Business Process Optimization Platform Investors Funding Presentation Competitor Analysis Template PDF was created to help save time. Instead of worrying about the design, the presenter can concentrate on the message while our designers work on creating the ideal templates for whatever situation is needed. Slidegeeks has experts for everything from amazing designs to valuable content, we have put everything into Business Process Optimization Platform Investors Funding Presentation Competitor Analysis Template PDF
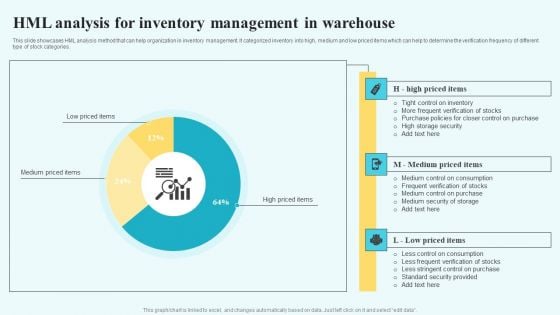
Adopting Multiple Tactics To Improve Inventory Optimization Hml Analysis For Inventory Management In Warehouse Brochure PDF
This slide showcases HML analysis method that can help organization in inventory management. It categorized inventory into high, medium and low priced items which can help to determine the verification frequency of different type of stock categories. Here you can discover an assortment of the finest PowerPoint and Google Slides templates. With these templates, you can create presentations for a variety of purposes while simultaneously providing your audience with an eye catching visual experience. Download Adopting Multiple Tactics To Improve Inventory Optimization Hml Analysis For Inventory Management In Warehouse Brochure PDF to deliver an impeccable presentation. These templates will make your job of preparing presentations much quicker, yet still, maintain a high level of quality. Slidegeeks has experienced researchers who prepare these templates and write high quality content for you. Later on, you can personalize the content by editing the Adopting Multiple Tactics To Improve Inventory Optimization Hml Analysis For Inventory Management In Warehouse Brochure PDF.
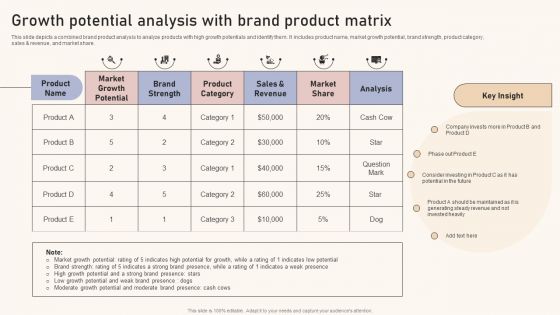
Optimizing Brand Equity Through Strategic Management Growth Potential Analysis With Brand Product Matrix Graphics PDF
This slide depicts a combined brand product analysis to analyze products with high growth potentials and identify them. It includes product name, market growth potential, brand strength, product category, sales and revenue, and market share. Formulating a presentation can take up a lot of effort and time, so the content and message should always be the primary focus. The visuals of the PowerPoint can enhance the presenters message, so our Optimizing Brand Equity Through Strategic Management Growth Potential Analysis With Brand Product Matrix Graphics PDF was created to help save time. Instead of worrying about the design, the presenter can concentrate on the message while our designers work on creating the ideal templates for whatever situation is needed. Slidegeeks has experts for everything from amazing designs to valuable content, we have put everything into Optimizing Brand Equity Through Strategic Management Growth Potential Analysis With Brand Product Matrix Graphics PDF

Integrated Risk Management Methodology With Data Set Analysis Ppt PowerPoint Presentation Infographics Microsoft PDF
This slide covers different risk measurement approach that will help project managers to do historical loss analysis and scenario analysis. Pitch your topic with ease and precision using this integrated risk management methodology with data set analysis ppt powerpoint presentation infographics microsoft pdf. This layout presents information on historical loss analysis, severity distribution analysis, integration risk measure. It is also available for immediate download and adjustment. So, changes can be made in the color, design, graphics or any other component to create a unique layout.
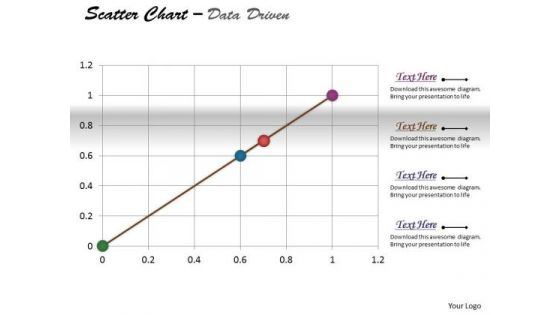
Excel Data Analysis Data Methods Statistical Tool Survey Driven PowerPoint Slides Templates
Be The Duke Of The Dais With Our excel data analysis data methods statistical tool survey driven powerpoint slides Templates . Acquire Royalty Status With Your Thoughts.

How Sentiment Analysis Operates With Machine Learning Emotionally Intelligent Insights Leveraging AI SS V
This slide provides information regarding the functioning of sentiment analysis techniques with machine learning to assess the polarity of text and whether the sense of text is positive or negative. It includes feature extraction technique which includes tokenization, lemmatization, and stop-word removal. Retrieve professionally designed How Sentiment Analysis Operates With Machine Learning Emotionally Intelligent Insights Leveraging AI SS V to effectively convey your message and captivate your listeners. Save time by selecting pre-made slideshows that are appropriate for various topics, from business to educational purposes. These themes come in many different styles, from creative to corporate, and all of them are easily adjustable and can be edited quickly. Access them as PowerPoint templates or as Google Slides themes. You do not have to go on a hunt for the perfect presentation because Slidegeeks got you covered from everywhere. This slide provides information regarding the functioning of sentiment analysis techniques with machine learning to assess the polarity of text and whether the sense of text is positive or negative. It includes feature extraction technique which includes tokenization, lemmatization, and stop-word removal.
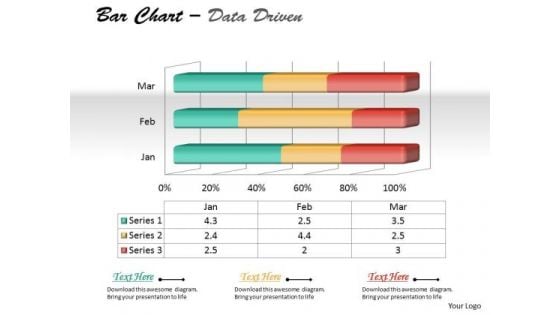
Data Analysis On Excel 3d Chart To Represent Quantitative Differences PowerPoint Templates
Draft It Out On Our data analysis on excel 3d chart to represent quantitative differences Powerpoint Templates . Give The Final Touches With Your Ideas.
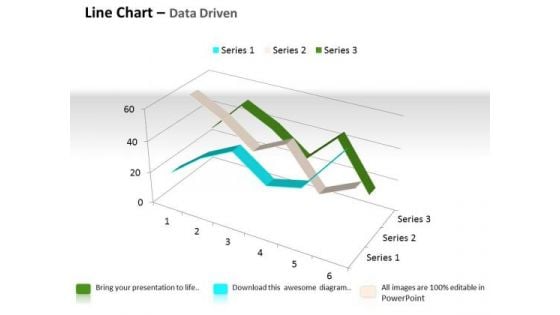
Quantitative Data Analysis 3d Line Chart For Comparison Of PowerPoint Templates
Touch Base With Our quantitative data analysis 3d line chart for comparison of Powerpoint Templates . Review Your Growth With Your Audience.

Quantitative Data Analysis 3d Pie Chart For Business Process PowerPoint Templates
Put Them On The Same Page With Our quantitative data analysis 3d pie chart for business process Powerpoint Templates . Your Team Will Sing From The Same Sheet.
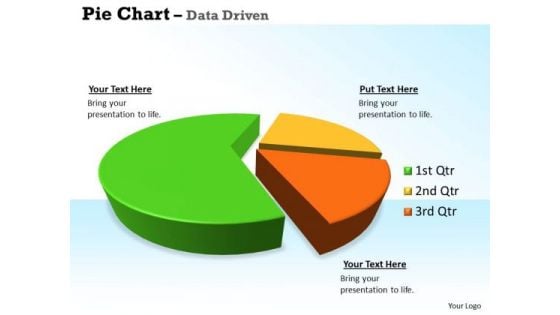
Quantitative Data Analysis 3d Pie Chart For Business Statistics PowerPoint Templates
Our quantitative data analysis 3d pie chart for business statistics Powerpoint Templates Allow You To Do It With Ease. Just Like Picking The Low Hanging Fruit.
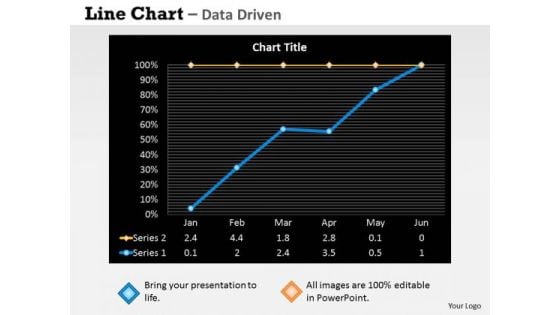
Quantitative Data Analysis Driven Economic Status Line Chart PowerPoint Slides Templates
Be The Dramatist With Our quantitative data analysis driven economic status line chart powerpoint slides Templates . Script Out The Play Of Words.
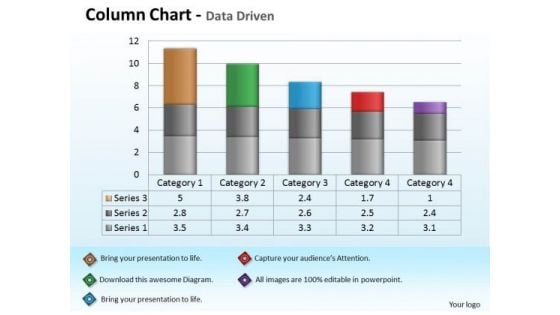
Quantitative Data Analysis Driven Economic With Column Chart PowerPoint Slides Templates
Add Some Dramatization To Your Thoughts. Our quantitative data analysis driven economic with column chart powerpoint slides Templates Make Useful Props.
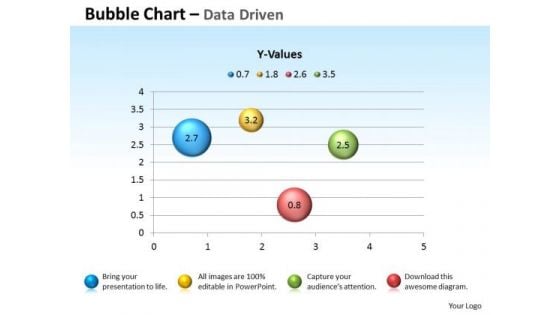
Excel Data Analysis Data Tools Data Methods Statistical Chart For Process PowerPoint Templates
Blend Your Views With Our excel data analysis data tools data methods statistical chart for process Powerpoint Templates . They Are Made For Each Other.
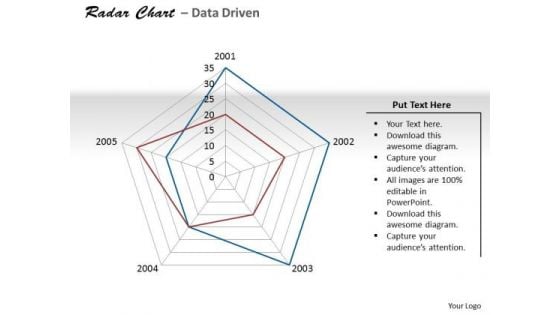
Excel Data Analysis Data Tools Data Methods Statistical Driven PowerPoint Slides Templates
There Is No Subject Too Dull For Our excel data analysis data tools data methods statistical driven powerpoint slides Templates . They Will Always Generate Keenness.
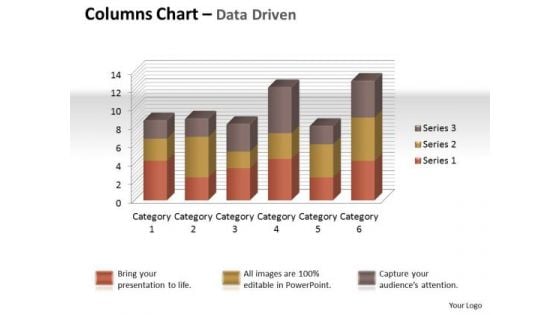
Excel Data Analysis Data Tools Data Methods Statistical Tool Chart PowerPoint Templates
Give Your Thoughts Some Durability. Coat Them With Our excel data analysis data tools data methods statistical tool chart Powerpoint Templates .
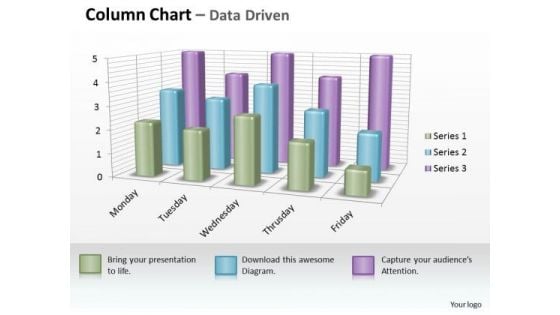
Examples Of Data Analysis Market 3d Business Inspection Procedure Chart PowerPoint Templates
However Dry Your Topic Maybe. Make It Catchy With Our examples of data analysis market 3d business inspection procedure chart Powerpoint Templates .
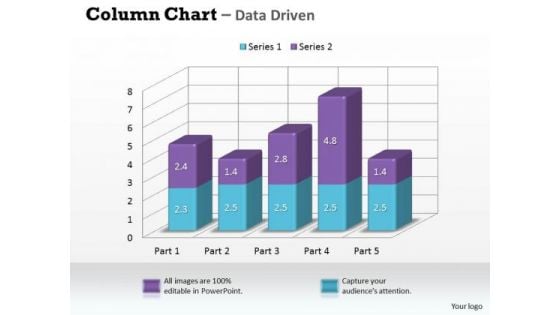
Data Analysis In Excel 3d Column Chart For Market Surveys PowerPoint Templates
Our data analysis in excel 3d column chart for market surveys Powerpoint Templates Leave No One In Doubt. Provide A Certainty To Your Views.
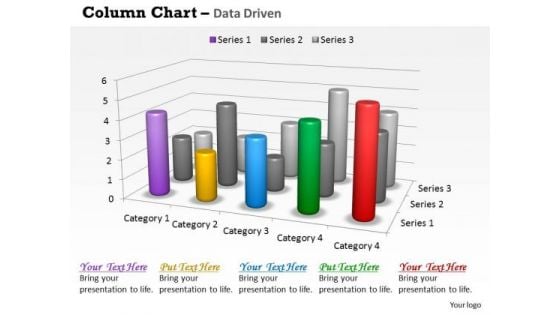
Data Analysis In Excel 3d Survey For Sales Chart PowerPoint Templates
Good Camaraderie Is A Key To Teamwork. Our data analysis in excel 3d survey for sales chart Powerpoint Templates Can Be A Cementing Force.
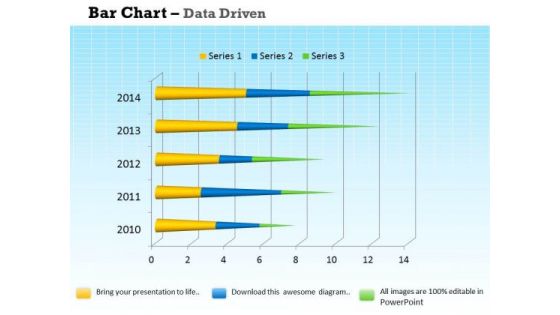
Data Analysis Programs 3d Bar Chart For Market Surveys PowerPoint Templates
Draw On The Experience Of Our data analysis programs 3d bar chart for market surveys Powerpoint Templates . They Imbibe From Past Masters.
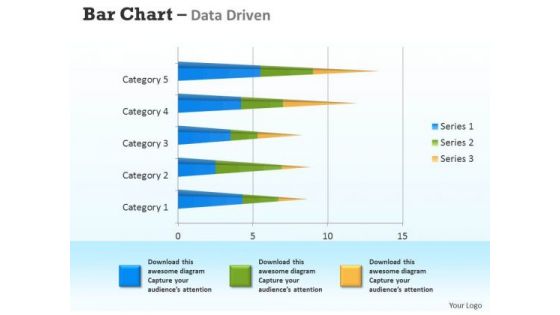
Microsoft Excel Data Analysis 3d Bar Chart For Analyzing Survey PowerPoint Templates
Connect The Dots With Our microsoft excel data analysis 3d bar chart for analyzing survey Powerpoint Templates . Watch The Whole Picture Clearly Emerge.
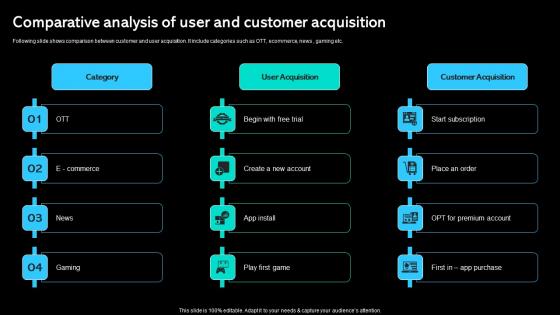
Comparative Analysis Of User And Customer Acquisition Paid Marketing Approach Diagrams Pdf
Following slide shows comparison between customer and user acquisition. It include categories such as OTT, ecommerce, news , gaming etc. If you are looking for a format to display your unique thoughts, then the professionally designed Comparative Analysis Of User And Customer Acquisition Paid Marketing Approach Diagrams Pdf is the one for you. You can use it as a Google Slides template or a PowerPoint template. Incorporate impressive visuals, symbols, images, and other charts. Modify or reorganize the text boxes as you desire. Experiment with shade schemes and font pairings. Alter, share or cooperate with other people on your work. Download Comparative Analysis Of User And Customer Acquisition Paid Marketing Approach Diagrams Pdf and find out how to give a successful presentation. Present a perfect display to your team and make your presentation unforgettable. Following slide shows comparison between customer and user acquisition. It include categories such as OTT, ecommerce, news , gaming etc.
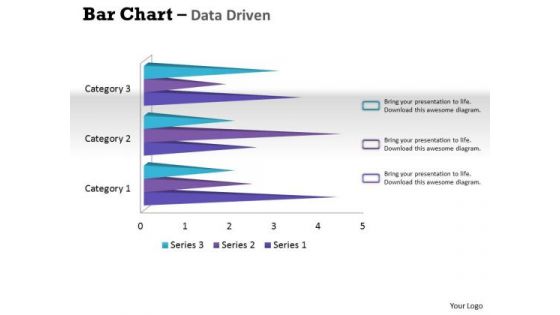
Data Analysis Techniques 3d Bar Chart For Financial Solutions PowerPoint Templates
Make Your Dreams A Reality With Our data analysis techniques 3d bar chart for financial solutions Powerpoint Templates . Your Ideas Will Begin To Take Shape.

Data Analysis Excel 3d Pie Chart For Marketing Process PowerPoint Templates
Our data analysis excel 3d pie chart for marketing process Powerpoint Templates Team Are A Dogged Lot. They Keep At It Till They Get It Right.
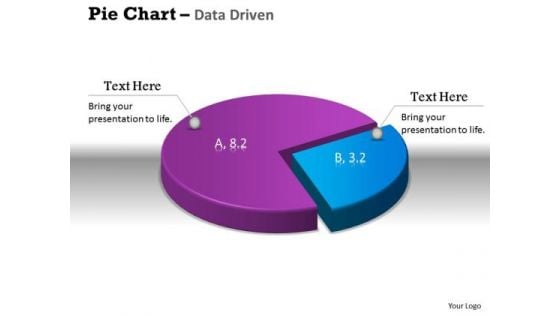
Data Analysis Excel 3d Pie Chart Shows Relative Size Of PowerPoint Templates
Get The Doers Into Action. Activate Them With Our data analysis excel 3d pie chart shows relative size of Powerpoint Templates.
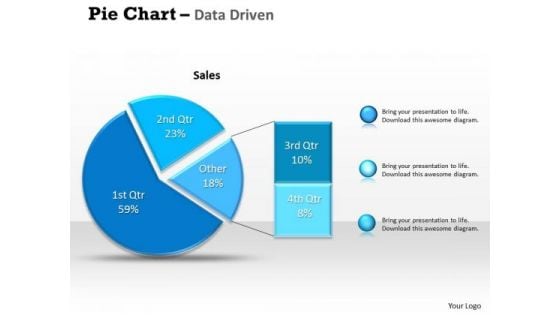
Data Analysis Excel Driven Percentage Breakdown Pie Chart PowerPoint Slides Templates
Be A Donor Of Great Ideas. Display Your Charity On Our data analysis excel driven percentage breakdown pie chart powerpoint slides Templates.
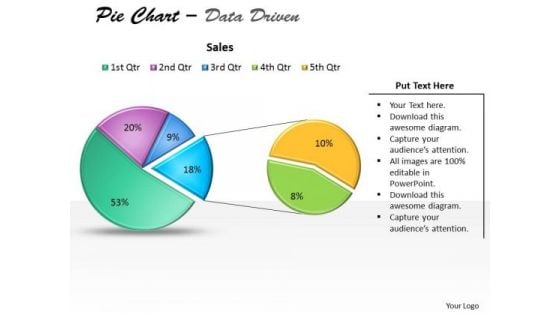
Data Analysis Excel Driven Pie Chart For Business Stratregy PowerPoint Slides Templates
Open Up Doors That Lead To Success. Our data analysis excel driven pie chart for business stratregy powerpoint slides Templates Provide The Handles.

Data Analysis Excel Driven Pie Chart For Easy Comparison PowerPoint Slides Templates
Our data analysis excel driven pie chart for easy comparison powerpoint slides Templates Abhor Doodling. They Never Let The Interest Flag.
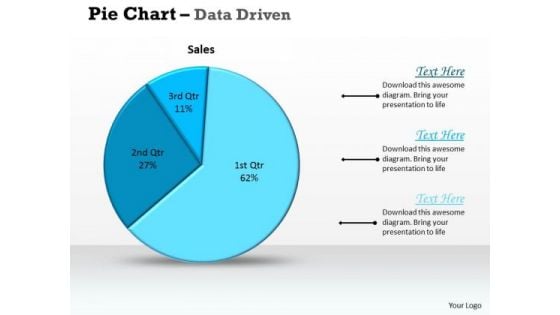
Data Analysis Excel Driven Pie Chart For Sales Process PowerPoint Slides Templates
Deliver The Right Dose With Our data analysis excel driven pie chart for sales process powerpoint slides Templates . Your Ideas Will Get The Correct Illumination.
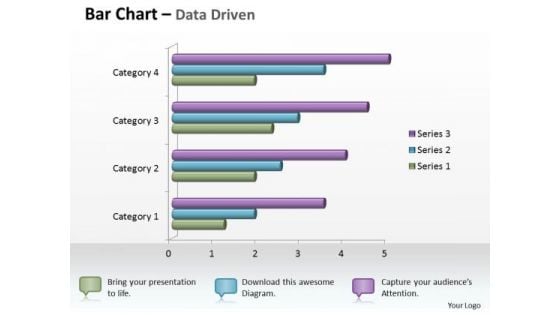
Data Analysis In Excel 3d Bar Chart For Business Statistics PowerPoint Templates
Knock On The Door To Success With Our data analysis in excel 3d bar chart for business statistics Powerpoint Templates . Be Assured Of Gaining Entry.
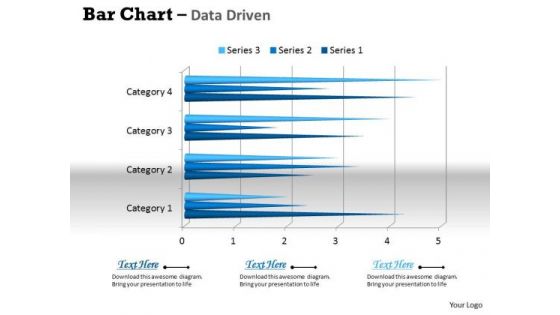
Data Analysis In Excel 3d Bar Chart For Business Trends PowerPoint Templates
Connect The Dots With Our data analysis in excel 3d bar chart for business trends Powerpoint Templates . Watch The Whole Picture Clearly Emerge.
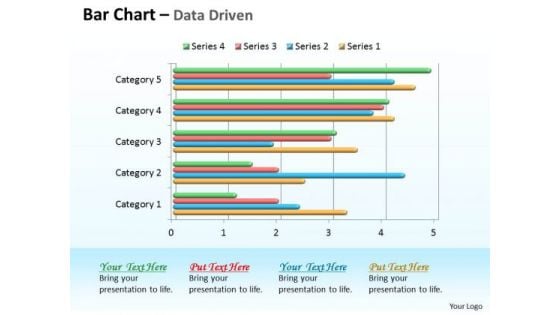
Data Analysis In Excel 3d Bar Chart For Comparison Of Time Series PowerPoint Templates
Double Your Chances With Our data analysis in excel 3d bar chart for comparison of time series Powerpoint Templates . The Value Of Your Thoughts Will Increase Two-Fold.
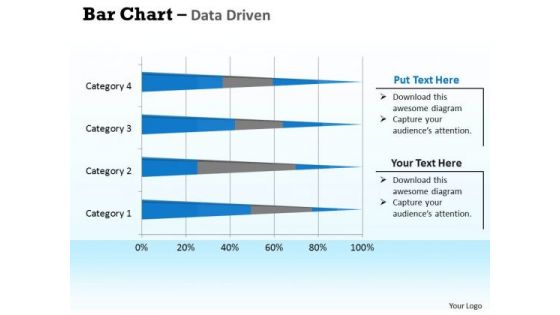
Data Analysis In Excel 3d Bar Chart For Interpretation PowerPoint Templates
Double Up Our data analysis in excel 3d bar chart for interpretation Powerpoint Templates With Your Thoughts. They Will Make An Awesome Pair.
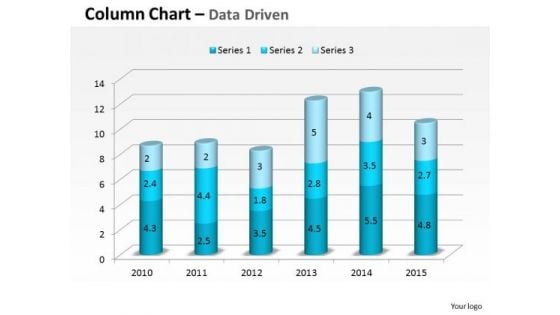
Data Analysis In Excel 3d Compare Yearly Business Performance PowerPoint Templates
Plan For All Contingencies With Our data analysis in excel 3d compare yearly business performance Powerpoint Templates . Douse The Fire Before It Catches.
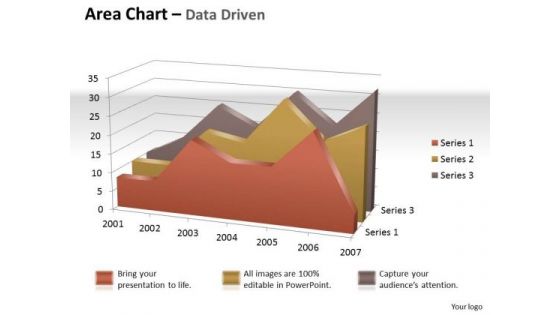
Data Analysis In Excel 3d Visual Display Of Area Chart PowerPoint Templates
Brace Yourself, Arm Your Thoughts. Prepare For The Hustle With Our data analysis in excel 3d visual display of area chart Powerpoint Templates .
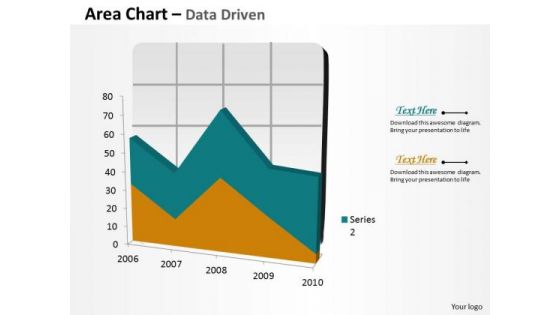
Data Analysis In Excel Area Chart For Business Process PowerPoint Templates
Your Grasp Of Economics Is Well Known. Help Your Audience Comprehend Issues With Our data analysis in excel area chart for business process Powerpoint Templates .
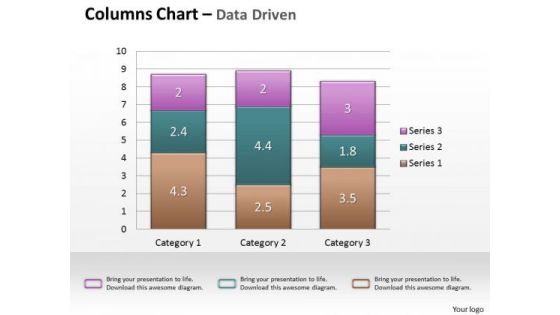
Data Analysis In Excel Column Chart For Business Analytics PowerPoint Templates
Our data analysis in excel column chart for business analytics Powerpoint Templates Heighten Concentration. Your Audience Will Be On The Edge.
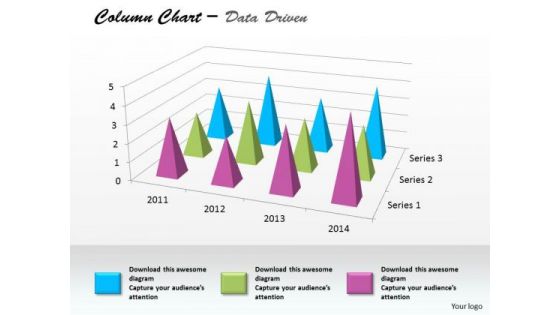
Data Analysis In Excel Column Chart For Business Project PowerPoint Templates
Edit Your Work With Our data analysis in excel column chart for business project Powerpoint Templates . They Will Help You Give The Final Form.
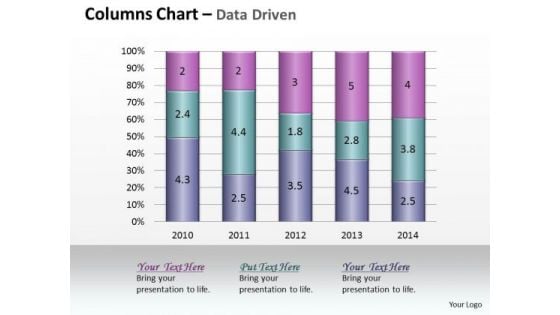
Data Analysis In Excel Column Chart Of Various Fields PowerPoint Templates
Land The Idea With Our data analysis in excel column chart of various fields Powerpoint Templates . Help It Grow With Your Thoughts.
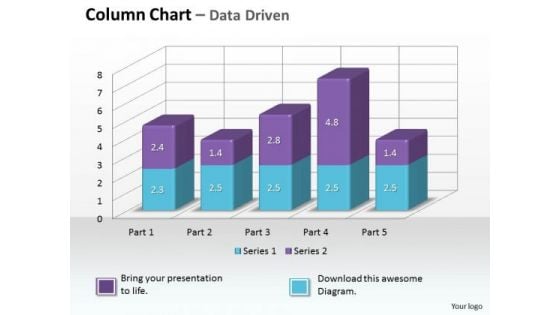
Data Analysis On Excel 3d Chart To Monitor Business Process PowerPoint Templates
Make Some Dough With Our data analysis on excel 3d chart to monitor business process Powerpoint Templates . Your Assets Will Rise Significantly.
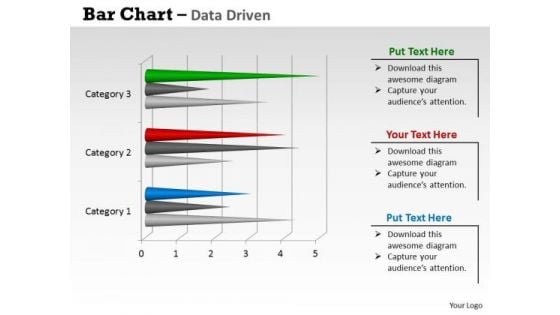
Data Analysis On Excel 3d Chart With Sets Of PowerPoint Templates
Reduce The Drag With Our data analysis on excel 3d chart with sets of Powerpoint Templates . Give More Lift To Your Thoughts.
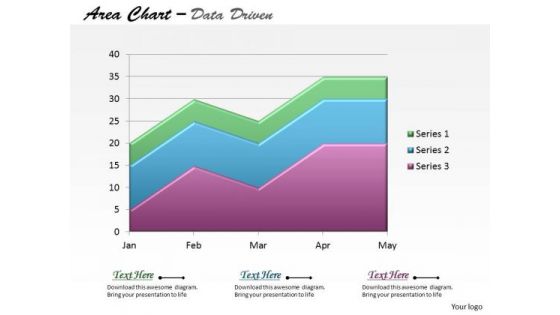
Data Analysis On Excel Driven Stacked Area Chart PowerPoint Slides Templates
Be The Dramatist With Our data analysis on excel driven stacked area chart powerpoint slides Templates . Script Out The Play Of Words.
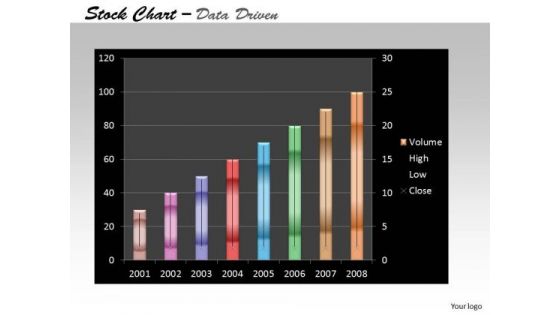
Data Analysis On Excel Driven Stock Chart For Business Growth PowerPoint Slides Templates
Add Some Dramatization To Your Thoughts. Our data analysis on excel driven stock chart for business growth powerpoint slides Templates Make Useful Props.
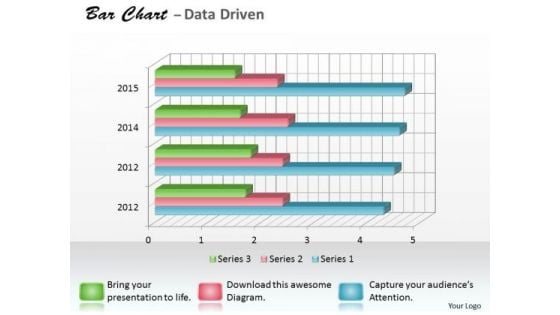
Data Analysis Programs 3d Bar Chart For Research In Statistics PowerPoint Templates
Draw It Out On Our data analysis programs 3d bar chart for research in statistics Powerpoint Templates . Provide Inspiration To Your Colleagues.
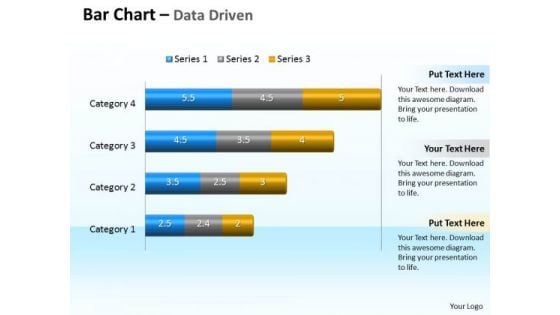
Data Analysis Programs 3d Bar Chart To Compare Categories PowerPoint Templates
Discover Decisive Moments With Our data analysis programs 3d bar chart to compare categories Powerpoint Templates . They Help Make That Crucial Difference.

Data Analysis Template Driven Express Business Facts Pie Chart PowerPoint Slides Templates
Display Your Drive On Our data analysis template driven express business facts pie chart powerpoint slides Templates . Invigorate The Audience With Your Fervor.
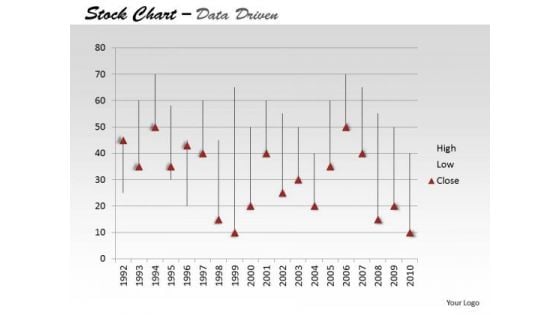
Data Analysis Template Driven Ineract With Stock Chart PowerPoint Slides Templates
Drive Your Passion With Our data analysis template driven ineract with stock chart powerpoint slides Templates . Steer Yourself To Achieve Your Aims.
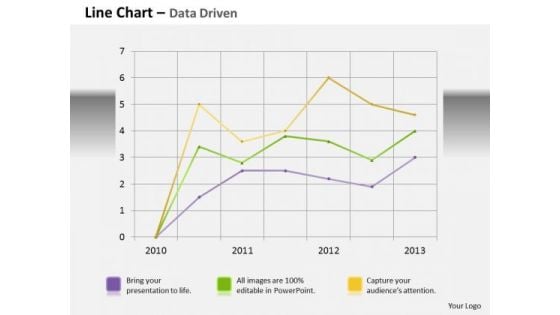
Data Analysis Template Driven Line Chart Business Graph PowerPoint Slides Templates
Bottle Your Thoughts In Our data analysis template driven line chart business graph powerpoint slides Templates . Pass It Around For Your Audience To Sip.
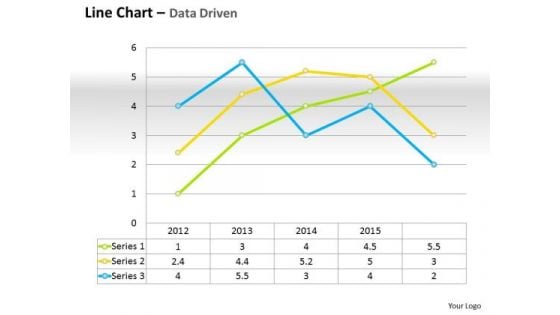
Data Analysis Template Driven Line Chart For Business Performance PowerPoint Slides Templates
Do Not Allow Things To Drift. Ring In Changes With Our data analysis template driven line chart for business performance powerpoint slides Templates .
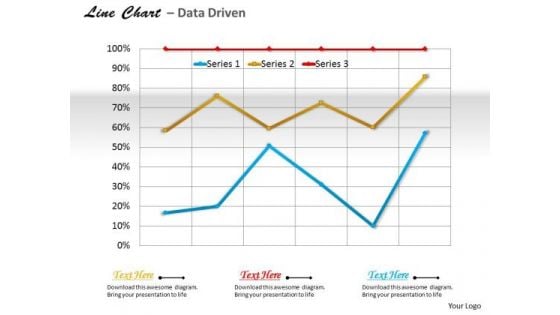
Data Analysis Template Driven Line Chart For Business Trends PowerPoint Slides Templates
Use Our data analysis template driven line chart for business trends powerpoint slides Templates As The Bit. Drill Your Thoughts Into Their Minds.
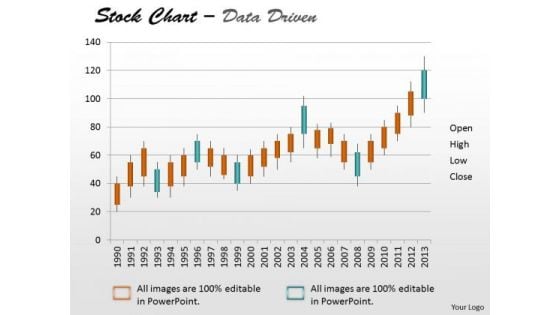
Data Analysis Template Driven Stock Chart For Market Trends PowerPoint Slides Templates
Drive Your Team Along The Road To Success. Take The Wheel With Our data analysis template driven stock chart for market trends powerpoint slides Templates .
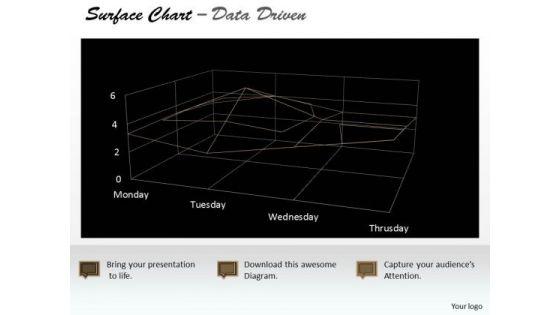
Data Analysis Template Driven Surface Chart Indicating Areas PowerPoint Slides Templates
Highlight Your Drive With Our data analysis template driven surface chart indicating areas powerpoint slides Templates . Prove The Fact That You Have Control.
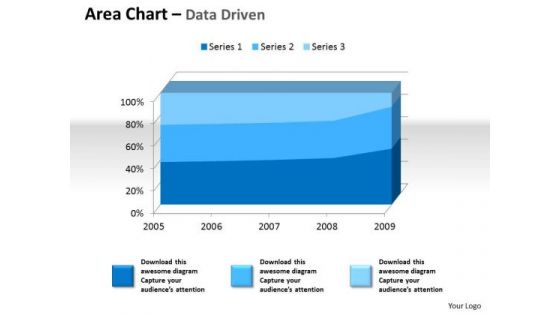
Examples Of Data Analysis Market 3d Area Chart For Quantiative PowerPoint Templates
Drum It Up With Our examples of data analysis market 3d area chart for quantiative Powerpoint Templates . Your Thoughts Will Raise The Tempo.
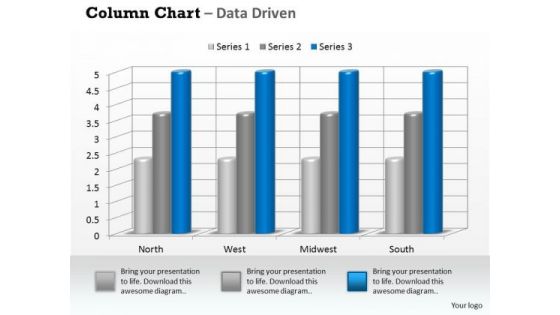
Examples Of Data Analysis Market 3d Business On Regular Intervals PowerPoint Templates
Drum It Out Loud And Clear On Our examples of data analysis market 3d business on regular intervals Powerpoint Templates . Your Words Will Ring In Their Ears.
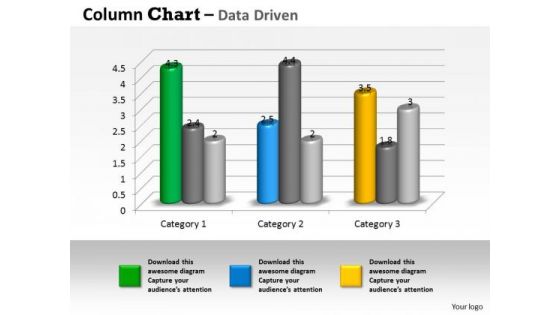
Examples Of Data Analysis Market 3d Business Trend Series Chart PowerPoint Templates
Duct It Through With Our examples of data analysis market 3d business trend series chart Powerpoint Templates . Your Ideas Will Reach Into Their Minds Intact.
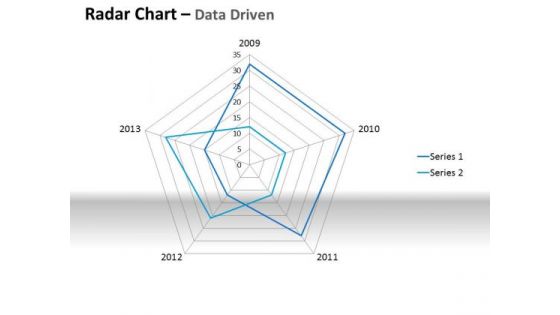
Examples Of Data Analysis Market Driven Plotting The Business Values PowerPoint Slides Templates
Ring The Duck With Our examples of data analysis market driven plotting the business values powerpoint slides Templates . Acquire The Points With Your Ideas.
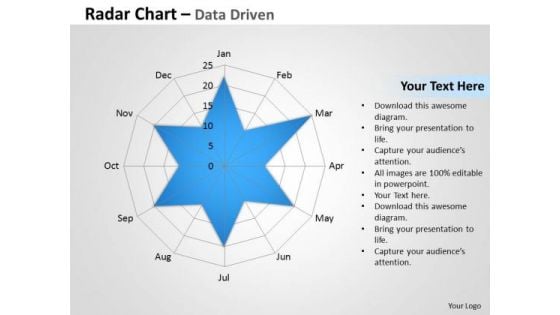
Examples Of Data Analysis Market Driven Radar Chart To Compare PowerPoint Slides Templates
Rely On Our examples of data analysis market driven radar chart to compare powerpoint slides Templates In Any Duel. They Will Drive Home Your Point.


 Continue with Email

 Home
Home


