Content Analysis
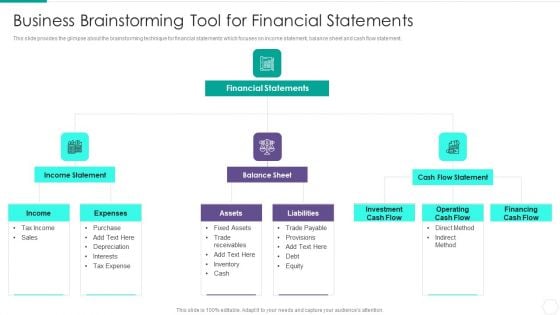
Quantitative Risk Assessment Business Brainstorming Tool For Financial Statements Introduction PDF
This slide provides the glimpse about the brainstorming technique for financial statements which focuses on income statement, balance sheet and cash flow statement. Presenting Quantitative Risk Assessment Business Brainstorming Tool For Financial Statements Introduction PDF to provide visual cues and insights. Share and navigate important information on three stages that need your due attention. This template can be used to pitch topics like Financial Statements, Expenses, Purchase, Tax Income, Sales. In addtion, this PPT design contains high resolution images, graphics, etc, that are easily editable and available for immediate download.
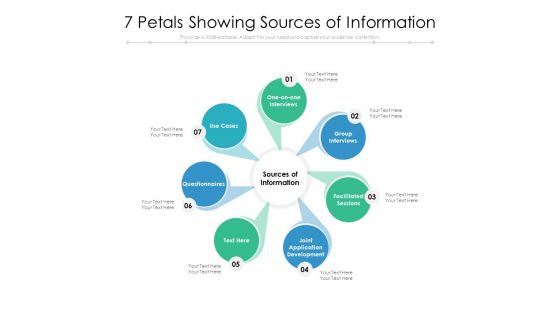
7 Petals Showing Sources Of Information Ppt PowerPoint Presentation Inspiration Demonstration PDF
Persuade your audience using this 7 petals showing sources of information ppt powerpoint presentation inspiration demonstration pdf. This PPT design covers seven stages, thus making it a great tool to use. It also caters to a variety of topics including one on one interviews, group interviews, facilitated sessions, joint application, questionnaires, use cases. Download this PPT design now to present a convincing pitch that not only emphasizes the topic but also showcases your presentation skills.
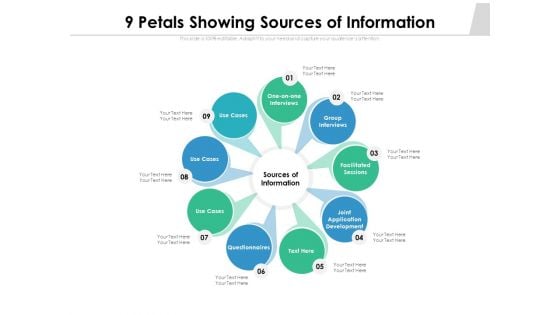
9 Petals Showing Sources Of Information Ppt PowerPoint Presentation Styles Model PDF
Persuade your audience using this 9 petals showing sources of information ppt powerpoint presentation styles model pdf. This PPT design covers nine stages, thus making it a great tool to use. It also caters to a variety of topics including one on one interviews, group interviews, facilitated sessions, joint application development questionnaires. Download this PPT design now to present a convincing pitch that not only emphasizes the topic but also showcases your presentation skills.
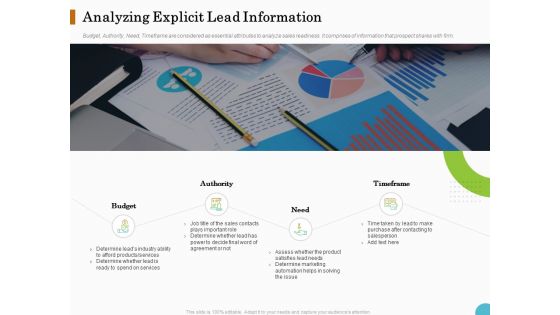
Lead Ranking Sales Methodology Model Analyzing Explicit Lead Information Need Ppt PowerPoint Presentation Show Background Images PDF
Presenting this set of slides with name lead ranking sales methodology model analyzing explicit lead information need ppt powerpoint presentation show background images pdf. This is a four stage process. The stages in this process are budget, authority, need, timeframe . This is a completely editable PowerPoint presentation and is available for immediate download. Download now and impress your audience.
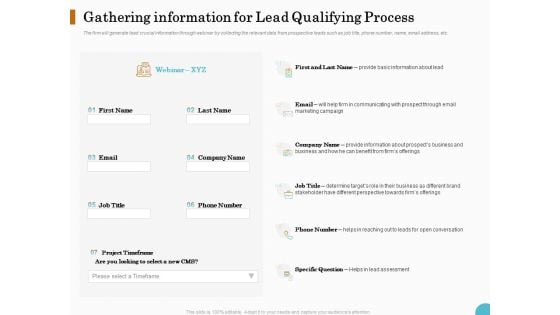
Lead Ranking Sales Methodology Model Gathering Information For Lead Qualifying Process Ppt PowerPoint Presentation Show Graphic Tips PDF
Presenting this set of slides with name lead ranking sales methodology model gathering information for lead qualifying process ppt powerpoint presentation show graphic tips pdf. The topics discussed in these slides are project timeframe, cms, lead assessment, open conversation, determine targets, role business. This is a completely editable PowerPoint presentation and is available for immediate download. Download now and impress your audience.
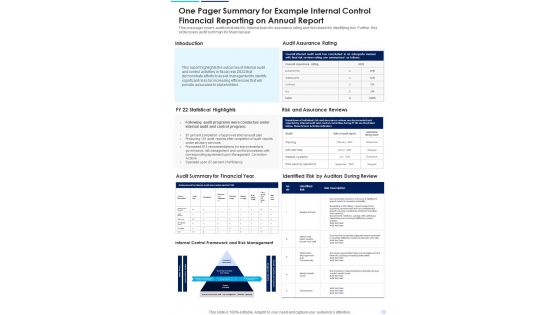
One Pager Summary For Example Internal Control Financial Reporting On Annual Report One Pager Documents
This one pager covers audit conducted by internal team for assurance rating and risk review for identifying risk. Further, this slide covers audit summary for financial year. Presenting you a fantastic One Pager Summary For Example Internal Control Financial Reporting On Annual Report One Pager Documents. This piece is crafted on hours of research and professional design efforts to ensure you have the best resource. It is completely editable and its design allow you to rehash its elements to suit your needs. Get this One Pager Summary For Example Internal Control Financial Reporting On Annual Report One Pager Documents A4 One-pager now.
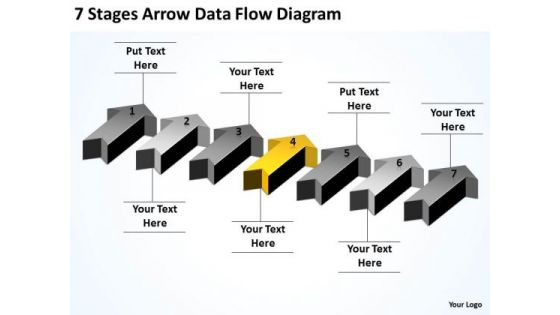
Advantage Of Parallel Processing 7 Stages Arrow Data Flow Diagram PowerPoint Slides
We present our advantage of parallel processing 7 stages arrow data flow diagram PowerPoint Slides.Download and present our Flow Charts PowerPoint Templates because Our PowerPoint Templates and Slides are conceived by a dedicated team. Use them and give form to your wondrous ideas. Download and present our Process and Flows PowerPoint Templates because Our PowerPoint Templates and Slides offer you the needful to organise your thoughts. Use them to list out your views in a logical sequence. Download and present our Arrows PowerPoint Templates because You can Channelise the thoughts of your team with our PowerPoint Templates and Slides. Urge them to focus on the goals you have set. Present our Marketing PowerPoint Templates because Our PowerPoint Templates and Slides will let your words and thoughts hit bullseye everytime. Use our Business PowerPoint Templates because Our PowerPoint Templates and Slides help you pinpoint your timelines. Highlight the reasons for your deadlines with their use.Use these PowerPoint slides for presentations relating to Arrow, completed, completion, concept, confirmation,design, flow, four, graphic, illustration, indication, indicator, information, layout, measurement, modern, number, one, order, phase, pointer, process, progress, purple, reflection, scale, send, set, shape, sign, two, violet, web, web design, websites, work flow. The prominent colors used in the PowerPoint template are Yellow, Gray, Black. The feedback we get is that our advantage of parallel processing 7 stages arrow data flow diagram PowerPoint Slides have awesome images to get your point across. Professionals tell us our flow PowerPoint templates and PPT Slides are designed to make your presentations professional. Use our advantage of parallel processing 7 stages arrow data flow diagram PowerPoint Slides have awesome images to get your point across. Presenters tell us our design PowerPoint templates and PPT Slides will make the presenter successul in his career/life. You can be sure our advantage of parallel processing 7 stages arrow data flow diagram PowerPoint Slides will make you look like a winner. PowerPoint presentation experts tell us our four PowerPoint templates and PPT Slides will help them to explain complicated concepts. Our Advantage Of Parallel Processing 7 Stages Arrow Data Flow Diagram PowerPoint Slides get you a promotion. With our money back guarantee you have nothing to lose.
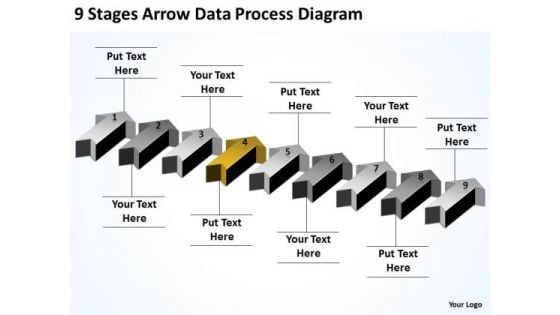
Applications Of Parallel Processing 9 Stages Arrow Data Diagram PowerPoint Templates
We present our applications of parallel processing 9 stages arrow data diagram PowerPoint templates.Present our Process and Flows PowerPoint Templates because You can Be the puppeteer with our PowerPoint Templates and Slides as your strings. Lead your team through the steps of your script. Download and present our Arrows PowerPoint Templates because Our PowerPoint Templates and Slides ensures Effective communication. They help you put across your views with precision and clarity. Download our Steps PowerPoint Templates because Our PowerPoint Templates and Slides will let you Leave a lasting impression to your audiences. They possess an inherent longstanding recall factor. Download our Success PowerPoint Templates because Our PowerPoint Templates and Slides are specially created by a professional team with vast experience. They diligently strive to come up with the right vehicle for your brilliant Ideas. Download our Business PowerPoint Templates because Our PowerPoint Templates and Slides will let you Leave a lasting impression to your audiences. They possess an inherent longstanding recall factor.Use these PowerPoint slides for presentations relating to Arrow, completed, completion, concept, confirmation,design, flow, four, graphic, illustration, indication, indicator, information, layout, measurement, modern, number, one, order, phase, pointer, process, progress, purple, reflection, scale, send, set, shape, sign, two, violet, web, web design, websites, work flow. The prominent colors used in the PowerPoint template are Yellow, Gray, Black. The feedback we get is that our applications of parallel processing 9 stages arrow data diagram PowerPoint templates are incredible easy to use. Professionals tell us our concept PowerPoint templates and PPT Slides will get their audience's attention. Use our applications of parallel processing 9 stages arrow data diagram PowerPoint templates will save the presenter time. Presenters tell us our design PowerPoint templates and PPT Slides have awesome images to get your point across. You can be sure our applications of parallel processing 9 stages arrow data diagram PowerPoint templates are visually appealing. PowerPoint presentation experts tell us our graphic PowerPoint templates and PPT Slides are effectively colour coded to prioritise your plans They automatically highlight the sequence of events you desire. Drive to success with our Applications Of Parallel Processing 9 Stages Arrow Data Diagram PowerPoint Templates. You will come out on top.
Annual Milestone Plan Quarterly Timeline Template Ppt Icon Designs PDF
Presenting annual milestone plan quarterly timeline template ppt icon designs pdf to provide visual cues and insights. Share and navigate important information on four stages that need your due attention. This template can be used to pitch topics like quarterly timeline template. In addition, this PPT design contains high-resolution images, graphics, etc, that are easily editable and available for immediate download.

How Security Concerns Affect Firm In Present Times Pictures PDF
This slide portrays information regarding the concerns that are currently existing in the organizations. It is essential for top level management to keep check on existing concerns as they have severe impact on firms growth in terms of huge financial losses and bad public image. Deliver an awe inspiring pitch with this creative how security concerns affect firm in present times pictures pdf bundle. Topics like reported financial losses due to increase security threats, data breaches and records exposed, security threat incidents can be discussed with this completely editable template. It is available for immediate download depending on the needs and requirements of the user.
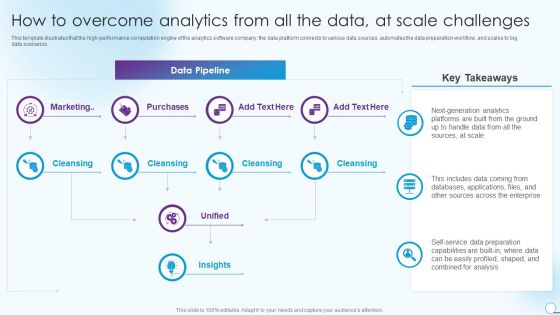
How To Overcome Analytics From All The Data At Scale Challenges Topics PDF
This template illustrates that the high performance computation engine of the analytics software company, the data platform connects to various data sources, automates the data preparation workflow, and scales to big data scenarios. Deliver and pitch your topic in the best possible manner with this How To Overcome Analytics From All The Data At Scale Challenges Topics PDF. Use them to share invaluable insights on Purchases, Marketing, Data Pipeline and impress your audience. This template can be altered and modified as per your expectations. So, grab it now.
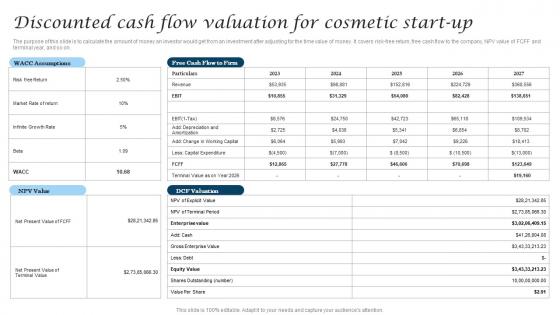
Discounted Cash Flow Valuation For Cosmetic Start Cosmetic Industry Business Information Pdf
The purpose of this slide is to calculate the amount of money an investor would get from an investment after adjusting for the time value of money. It covers risk-free return, free cash flow to the company, NPV value of FCFF and terminal year, and so on. Crafting an eye-catching presentation has never been more straightforward. Let your presentation shine with this tasteful yet straightforward Discounted Cash Flow Valuation For Cosmetic Start Cosmetic Industry Business Information Pdf template. It offers a minimalistic and classy look that is great for making a statement. The colors have been employed intelligently to add a bit of playfulness while still remaining professional. Construct the ideal Discounted Cash Flow Valuation For Cosmetic Start Cosmetic Industry Business Information Pdf that effortlessly grabs the attention of your audience Begin now and be certain to wow your customers The purpose of this slide is to calculate the amount of money an investor would get from an investment after adjusting for the time value of money. It covers risk-free return, free cash flow to the company, NPV value of FCFF and terminal year, and so on.
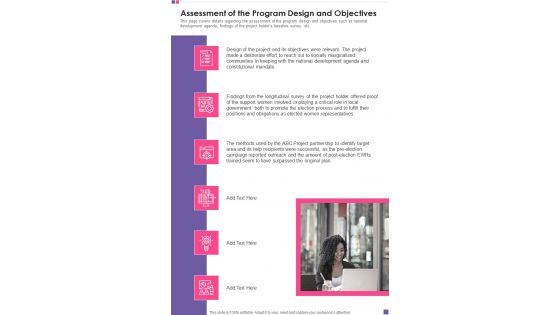
Assessment Of The Program Design And Objectives Template 110 One Pager Documents
This page covers details regarding the assessment of the program design and objectives such as national development agenda, findings of the project holders baseline survey, etc. Presenting you a fantastic Assessment Of The Program Design And Objectives Template 110 One Pager Documents. This piece is crafted on hours of research and professional design efforts to ensure you have the best resource. It is completely editable and its design allow you to rehash its elements to suit your needs. Get this Assessment Of The Program Design And Objectives Template 110 One Pager Documents A4 One-pager now.
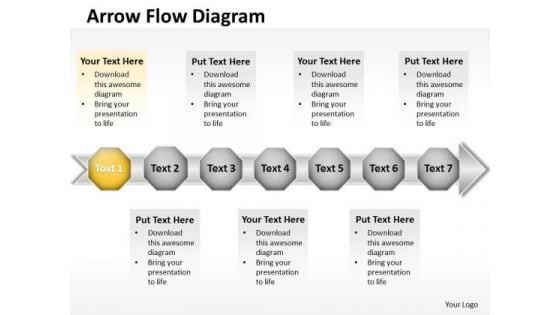
Ppt 7 Continuous Stages Free Business PowerPoint Templates Data Flow Diagram
PPT 7 continuous stages free business PowerPoint templates data flow diagram-The Create a consensus with your thoughts. Erase differences with our Ppt 7 Continuous Stages Free Business PowerPoint Templates Data Flow Diagram.
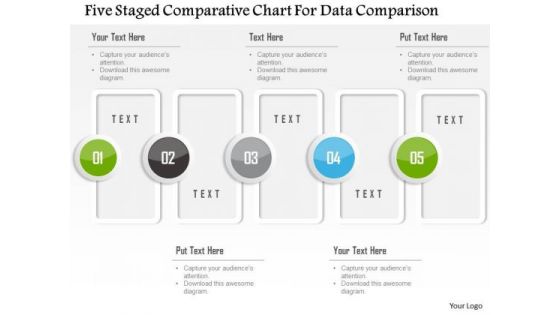
Business Diagram Five Staged Comparative Chart For Data Comparison Presentation Template
Five staged comparative chart has been used to design this power point template. This PPT contains the concept of data comparison. Use this PPT for your business and finance based data comparison in any financial presentation.
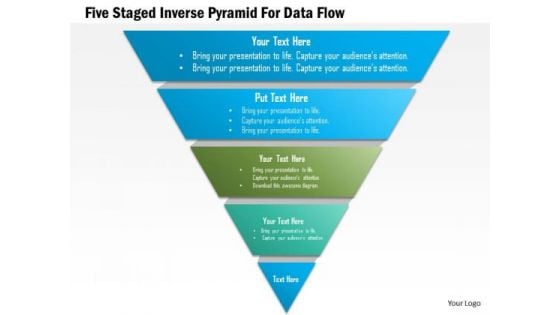
Business Diagram Five Staged Inverse Pyramid For Data Flow Presentation Template
Five staged inverse pyramid has been used to craft this power point template. This PPT contains the concept of data flow. Use this PPT for your data communication related presentations and create an impact on your viewers.
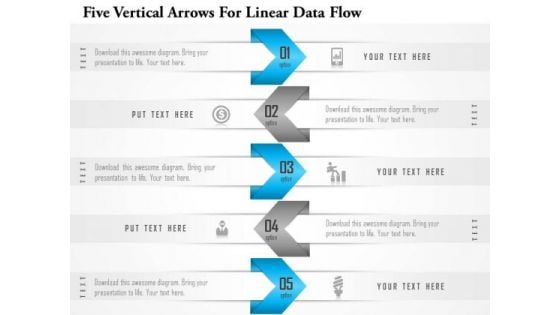
Business Diagram Five Vertical Arrows For Linear Data Flow Presentation Template
This business diagram displays graphic of five vertical arrows linear data flow. This business slide contains the concept of business data representation. Use this diagram to build professional presentation for your viewers.
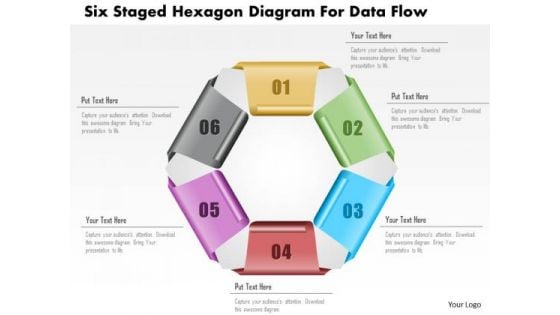
Business Diagram Six Staged Hexagon Diagram For Data Flow PowerPoint Template
Six staged hexagon diagram has been used to craft this power point template. This PPT diagram contains the concept of data flow. Use this PPT for your business and marketing related data representation.

Business Diagram Three Staged Infographics With Diary For Data Flow PowerPoint Template
Three staged info graphic with diary has been used to design this power point template. This PPT contains the concept of data flow. Use this PPT diagram to represent the marketing and business data in any presentation.
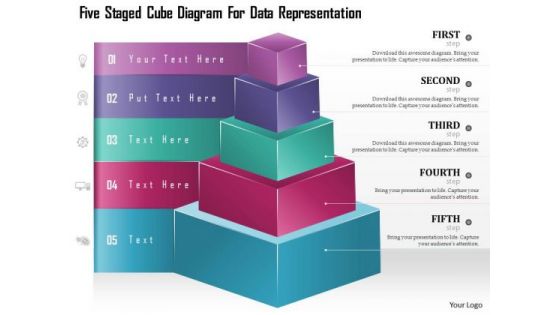
Business Diagram Five Staged Cube Diagram For Data Representation Presentation Template
Five staged cube diagram has been used to craft this power point diagram template. This PPT contains the concept of marketing strategy and data representation. Use this PPT for business and data related presentations.
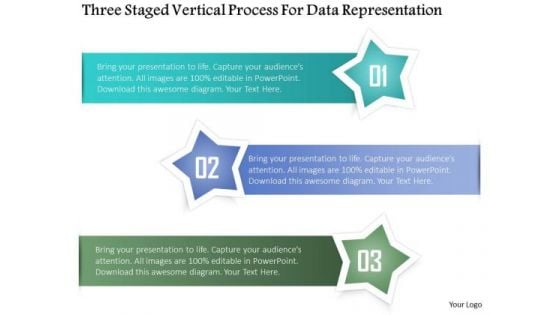
Business Diagram Three Staged Vertical Process For Data Representation Presentation Template
Three staged vertical process diagram has been used to craft this power point template diagram. This PPT contains the concept of data representation. Use this PPT for business and marketing data related presentations.
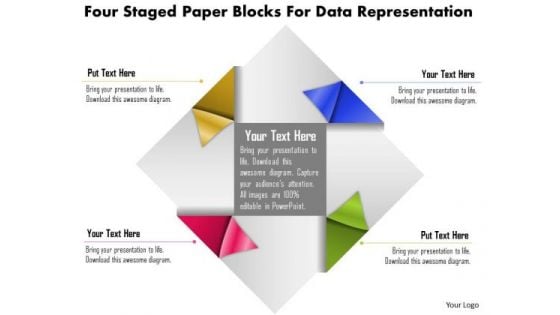
Business Diagram Four Staged Paper Blocks For Data Representation PowerPoint Template
Four staged paper blocks graphic has been used to craft this power point template slide. This PPT slide contains the concept of data flow and representation. Use this PPT to build an innovative presentation on data related topics..
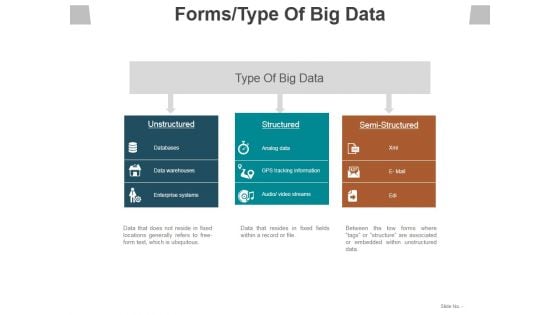
Forms Type Of Big Data Ppt PowerPoint Presentation Infographic Template Ideas
This is a forms type of big data ppt powerpoint presentation infographic template ideas. This is a three stage process. The stages in this process are unstructured, structured, semi structured, type of big data, databases.
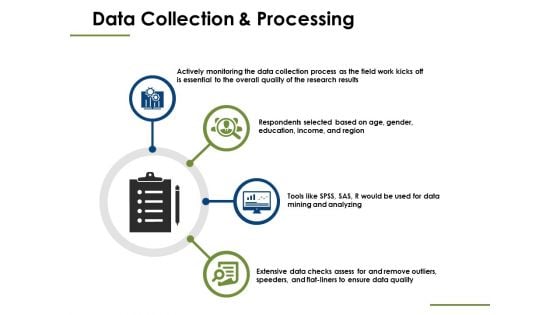
Data Collection And Processing Ppt PowerPoint Presentation Infographic Template Graphics Pictures
This is a data collection and processing ppt powerpoint presentation infographic template graphics pictures. This is a four stage process. The stages in this process are data collection and processing, marketing, strategy, management, planning.
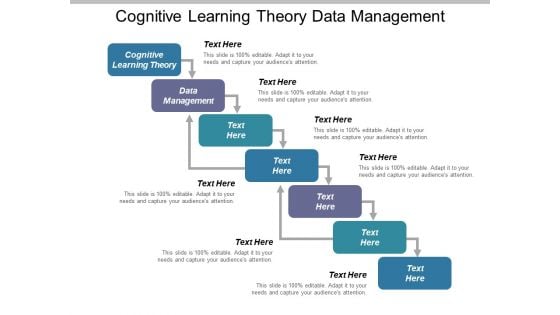
Cognitive Learning Theory Data Management Ppt PowerPoint Presentation Infographics Clipart Images
This is a cognitive learning theory data management ppt powerpoint presentation infographics clipart images. This is a seven stage process. The stages in this process are cognitive learning theory, data management.
Employer Employee Relationship Data Management Ppt PowerPoint Presentation Styles Graphics Template
This is a employer employee relationship data management ppt powerpoint presentation styles graphics template. This is a seven stage process. The stages in this process are employer employee relationship, data management.

Supplier Performance Management Product Data Quality Business Communication Ppt PowerPoint Presentation Layouts Skills
This is a supplier performance management product data quality business communication ppt powerpoint presentation layouts skills. This is a seven stage process. The stages in this process are supplier performance management, product data quality, business communication.
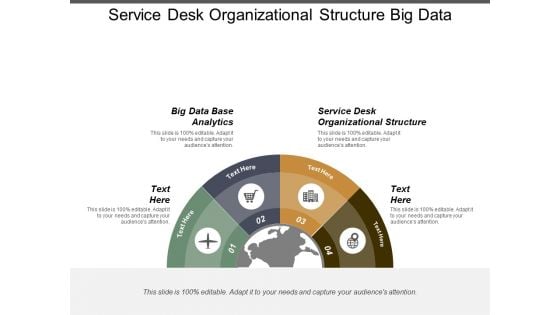
Service Desk Organizational Structure Big Data Base Analytics Ppt PowerPoint Presentation Outline Infographic Template
This is a service desk organizational structure big data base analytics ppt powerpoint presentation outline infographic template. This is a four stage process. The stages in this process are service desk organizational structure, big data base analytics.
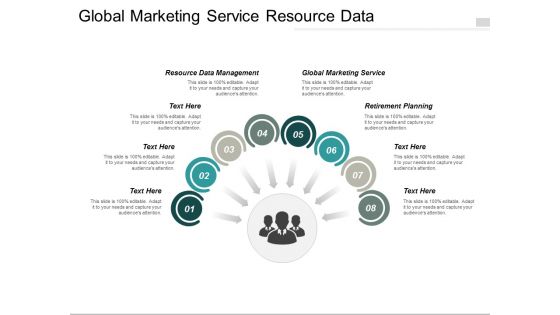
Global Marketing Service Resource Data Management Retirement Planning Ppt PowerPoint Presentation Layouts Infographics
This is a global marketing service resource data management retirement planning ppt powerpoint presentation layouts infographics. This is a four stage process. The stages in this process are global marketing service, resource data management, retirement planning.
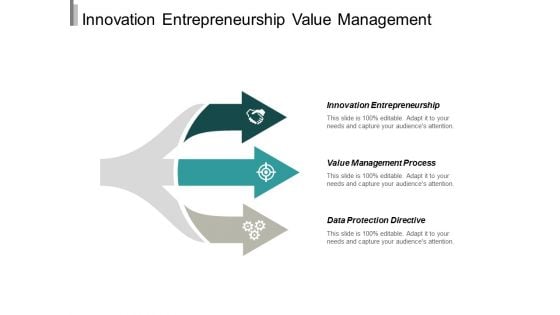
Innovation Entrepreneurship Value Management Process Data Protection Directive Ppt PowerPoint Presentation Professional Layout
This is a innovation entrepreneurship value management process data protection directive ppt powerpoint presentation professional layout. This is a three stage process. The stages in this process are innovation entrepreneurship, value management process, data protection directive.
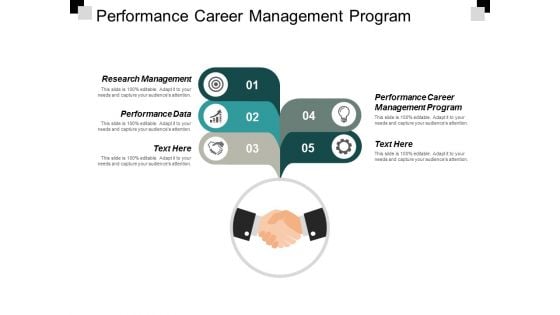
Performance Career Management Program Research Management Performance Data Ppt PowerPoint Presentation Outline Design Inspiration
This is a performance career management program research management performance data ppt powerpoint presentation outline design inspiration. This is a fivr stage process. The stages in this process are performance career management program, research management, performance data.
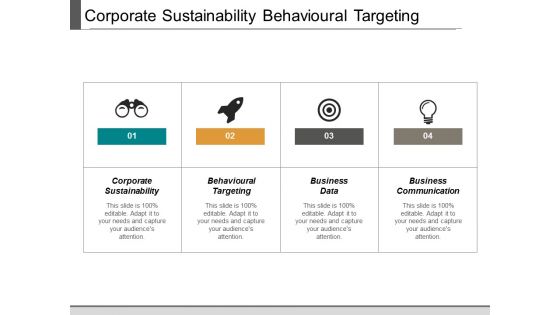
Corporate Sustainability Behavioural Targeting Business Data Business Communication Ppt PowerPoint Presentation Infographics Demonstration
This is a corporate sustainability behavioural targeting business data business communication ppt powerpoint presentation infographics demonstration. This is a four stage process. The stages in this process are corporate sustainability, behavioural targeting, business data, business communication.
Professional Development Data Protection Seeing Dogs Market Research Ppt PowerPoint Presentation Icon Graphics Template
This is a professional development data protection seeing dogs market research ppt powerpoint presentation icon graphics template. This is a five stage process. The stages in this process are professional development, data protection, seeing dogs, market research.
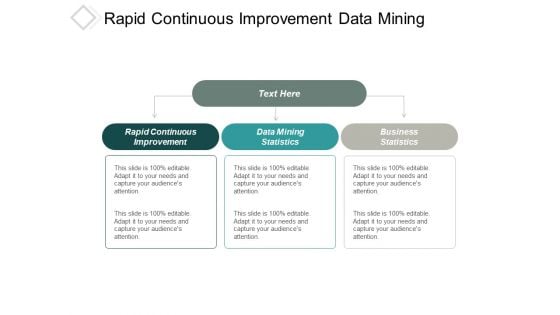
Rapid Continuous Improvement Data Mining Statistics Business Statistics Ppt PowerPoint Presentation Pictures Introduction
This is a rapid continuous improvement data mining statistics business statistics ppt powerpoint presentation pictures introduction. This is a three stage process. The stages in this process are rapid continuous improvement, data mining statistics, business statistics.
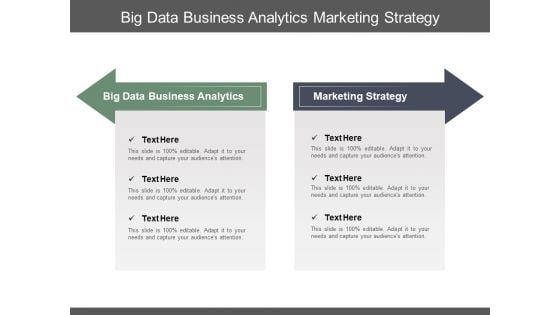
Big Data Business Analytics Marketing Strategy Marketing Demographics Ppt PowerPoint Presentation Gallery Inspiration
This is a big data business analytics marketing strategy marketing demographics ppt powerpoint presentation gallery inspiration. This is a twostage process. The stages in this process are big data business analytics, marketing strategy, marketing demographics.
Cloud Computer Data Management Icons Ppt PowerPoint Presentation Infographic Template Aids
This is a cloud computer data management icons ppt powerpoint presentation infographic template aids. This is a three stage process. The stages in this process are transform and load, data wore housing, etl, extract.
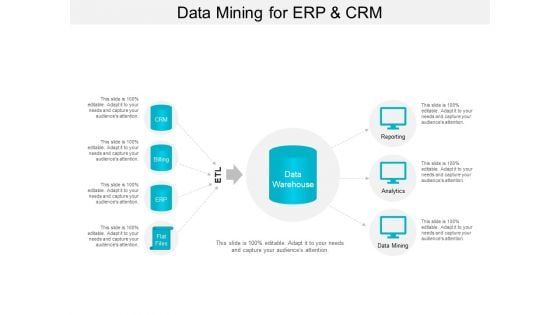
Data Mining For Erp And Crm Ppt PowerPoint Presentation Infographic Template Picture
This is a data mining for erp and crm ppt powerpoint presentation infographic template picture. This is a six stage process. The stages in this process are transform and load, data wore housing, etl, extract.
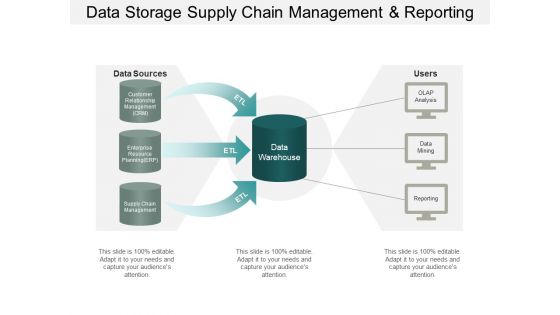
Data Storage Supply Chain Management And Reporting Ppt PowerPoint Presentation Outline
This is a data storage supply chain management and reporting ppt powerpoint presentation outline. This is a six stage process. The stages in this process are transform and load, data wore housing, etl, extract.
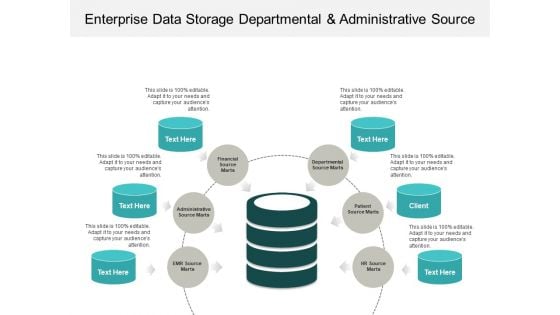
Enterprise Data Storage Departmental And Administrative Source Ppt PowerPoint Presentation Inspiration Clipart
This is a enterprise data storage departmental and administrative source ppt powerpoint presentation inspiration clipart. This is a six stage process. The stages in this process are transform and load, data wore housing, etl, extract.
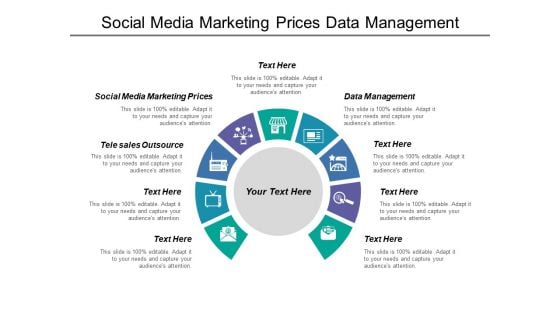
Social Media Marketing Prices Data Management Tele Sales Outsource Ppt PowerPoint Presentation Infographic Template Background
This is a social media marketing prices data management tele sales outsource ppt powerpoint presentation infographic template background. This is a nine stage process. The stages in this process are social media marketing prices, data management, tele sales outsource.
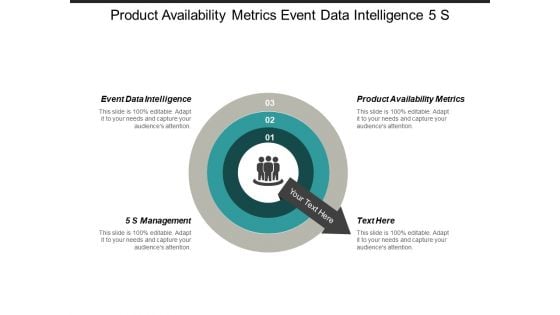
Product Availability Metrics Event Data Intelligence 5 S Management Ppt PowerPoint Presentation Gallery Graphic Tips
This is a product availability metrics event data intelligence 5 s management ppt powerpoint presentation gallery graphic tips. This is a three stage process. The stages in this process are product availability metrics, event data intelligence, 5 s management.
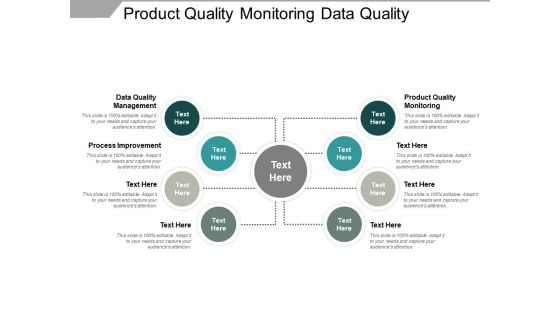
Product Quality Monitoring Data Quality Management Process Improvement Ppt PowerPoint Presentation Show File Formats
This is a product quality monitoring data quality management process improvement ppt powerpoint presentation show file formats. This is a eight stage process. The stages in this process are product quality monitoring, data quality management, process improvement.
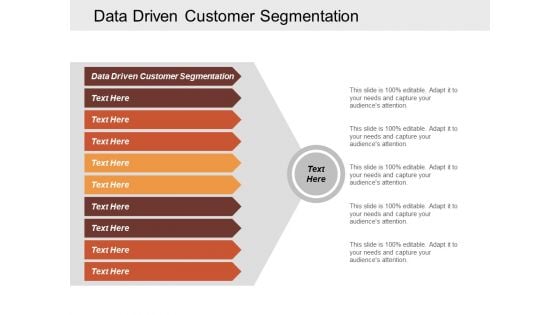
Data Driven Customer Segmentation Ppt Powerpoint Presentation Infographic Template Outfit Cpb
This is a data driven customer segmentation ppt powerpoint presentation infographic template outfit cpb. This is a five stage process. The stages in this process are data driven customer segmentation.
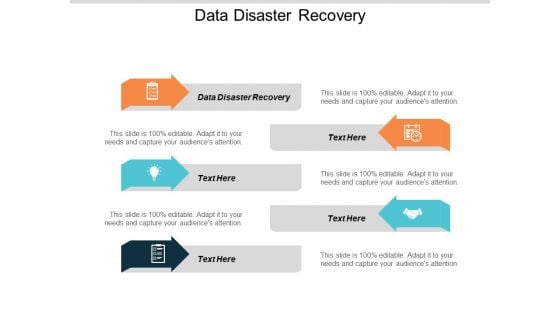
Data Disaster Recovery Ppt PowerPoint Presentation Infographic Template Example File Cpb
This is a data disaster recovery ppt powerpoint presentation infographic template example file cpb. This is a five stage process. The stages in this process are data disaster recovery, business, management, marketing.
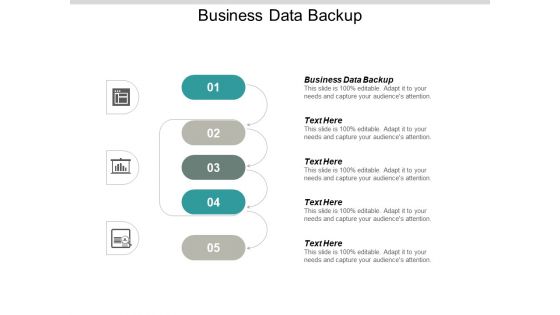
Business Data Backup Ppt PowerPoint Presentation Infographic Template Graphics Tutorials Cpb
This is a business data backup ppt powerpoint presentation infographic template graphics tutorials cpb. This is a five stage process. The stages in this process are business data backup.
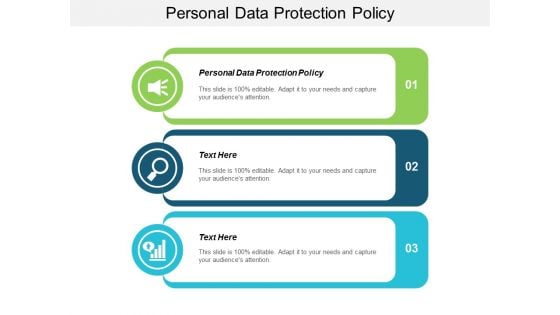
Personal Data Protection Policy Ppt Powerpoint Presentation Infographics Graphic Tips Cpb
This is a personal data protection policy ppt powerpoint presentation infographics graphic tips cpb. This is a three stage process. The stages in this process are personal data protection policy.
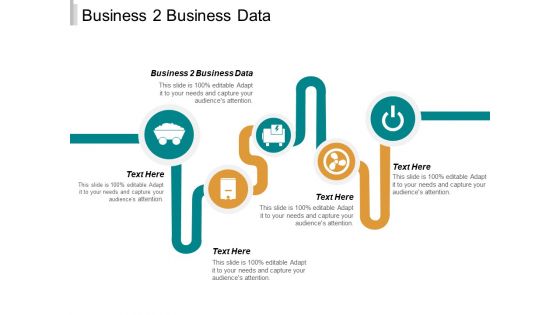
Business 2 Business Data Ppt PowerPoint Presentation Infographic Template Inspiration Cpb
This is a business 2 business data ppt powerpoint presentation infographic template inspiration cpb. This is a five stage process. The stages in this process are business 2 business data.
Business Value Data Visualization Ppt PowerPoint Presentation Infographic Template Background Images Cpb
This is a business value data visualization ppt powerpoint presentation infographic template background images cpb. This is a three stage process. The stages in this process are business value data visualization.
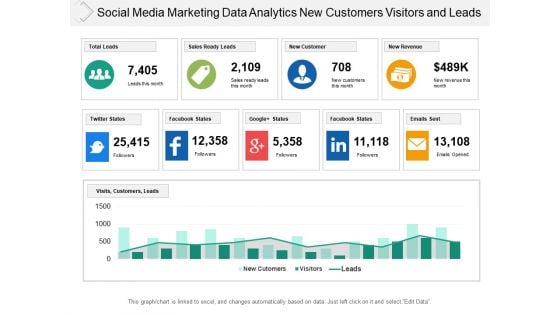
Social Media Marketing Data Analytics New Customers Visitors And Leads Ppt PowerPoint Presentation Professional Pictures
This is a social media marketing data analytics new customers visitors and leads ppt powerpoint presentation professional pictures. This is a two stage process. The stages in this process are business analytics, ba, organizations data.
Social Media Data Tools Ppt PowerPoint Presentation Show Example File Cpb
This is a social media data tools ppt powerpoint presentation show example file cpb. This is a five stage process. The stages in this process are social media data tools.
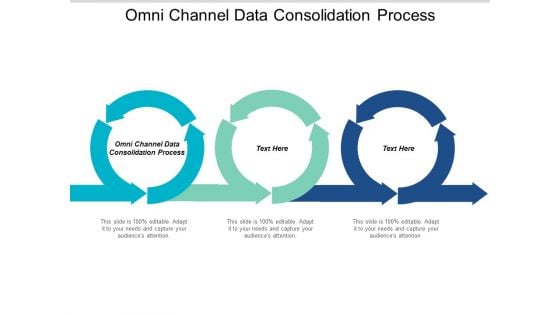
Omni Channel Data Consolidation Process Ppt PowerPoint Presentation Gallery Graphics Design Cpb
This is a omni channel data consolidation process ppt powerpoint presentation gallery graphics design cpb. This is a three stage process. The stages in this process are omni channel data consolidation process.
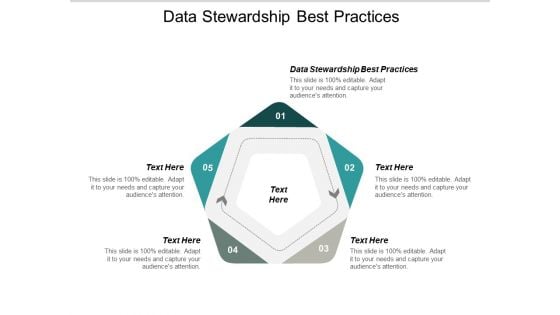
Data Stewardship Best Practices Ppt PowerPoint Presentation Slides File Formats Cpb
This is a data stewardship best practices ppt powerpoint presentation slides file formats cpb. This is a five stage process. The stages in this process are data stewardship best practices.
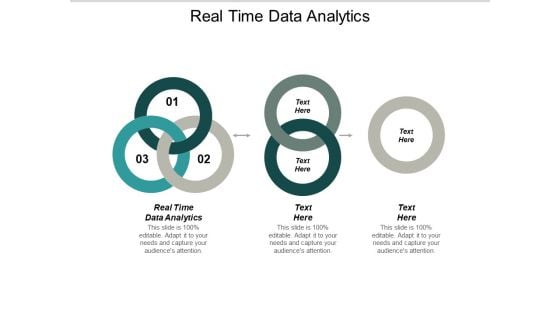
Real Time Data Analytics Ppt PowerPoint Presentation Model Background Designs Cpb
This is a real time data analytics ppt powerpoint presentation model background designs cpb. This is a three stage process. The stages in this process are real time data analytics.
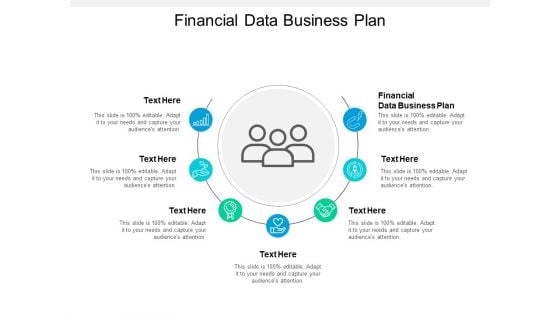
Financial Data Business Plan Ppt PowerPoint Presentation Slides Design Ideas Cpb
This is a financial data business plan ppt powerpoint presentation slides design ideas cpb. This is a seven stage process. The stages in this process are financial data business plan.
Enterprise Data Warehouse Best Practices Ppt PowerPoint Presentation Ideas Infographics Cpb
This is a enterprise data warehouse best practices ppt powerpoint presentation ideas infographics cpb. This is a four stage process. The stages in this process are enterprise data warehouse best practices.
Data Quality Dimensions Ppt PowerPoint Presentation Infographic Template Graphics Download Cpb
This is a data quality dimensions ppt powerpoint presentation infographic template graphics download cpb. This is a three stage process. The stages in this process are data quality dimensions.

Advantage And Disadvantages Of Using Developing Strategic Insights Using Big Data Analytics SS V
This slide showcases benefits and drawbacks of implementing descriptive analytics in business. It includes elements such as complex datasets, inaccurate data, data correlations, performance assessment, data driven decision making etc. Create an editable Advantage And Disadvantages Of Using Developing Strategic Insights Using Big Data Analytics SS V that communicates your idea and engages your audience. Whether you are presenting a business or an educational presentation, pre-designed presentation templates help save time. Advantage And Disadvantages Of Using Developing Strategic Insights Using Big Data Analytics SS V is highly customizable and very easy to edit, covering many different styles from creative to business presentations. Slidegeeks has creative team members who have crafted amazing templates. So, go and get them without any delay. This slide showcases benefits and drawbacks of implementing descriptive analytics in business. It includes elements such as complex datasets, inaccurate data, data correlations, performance assessment, data driven decision making etc.
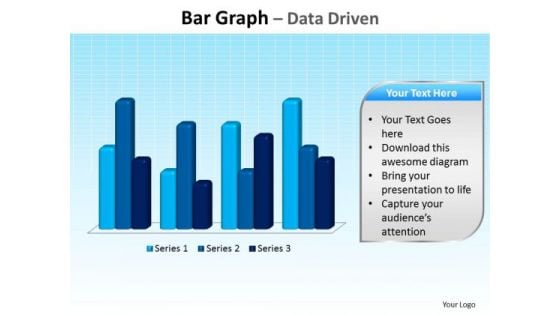
Business Education PowerPoint Templates Business Bar Graph Data Driven Ppt Slides
Business Education PowerPoint Templates Business bar graph data driven PPT Slides-This PowerPoint slide is a data driven Columns Chart. The number of columns depend on the data.-Business Editable PowerPoint Templates Business beveled column chart PPT Slides-This ppt can be used for concepts relating to-chart,, graph, growth, investment, , market, percentage, , presentation report, results, statistics, stock, success and business. Our Business Education PowerPoint Templates Business Bar Graph Data Driven Ppt Slides keep the faith alive. Belief in you will get stronger.
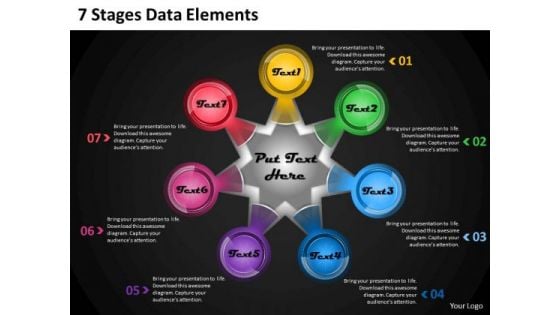
Business Process Strategy 7 Stages Data Elements Strategic Plan Format Ppt Slide
Draw the debate to a close. Arrive at conclusions with our Timeline Ppt Template 7 Stages Data Elements.
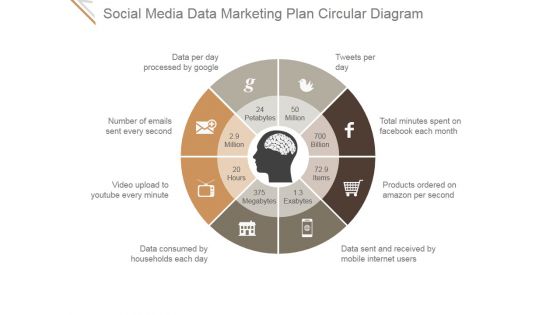
Social Media Data Marketing Plan Circular Diagram Ppt PowerPoint Presentation Pictures
This is a social media data marketing plan circular diagram ppt powerpoint presentation pictures. This is a eight stage process. The stages in this process are data per day processed by google, tweets per day, total minutes spent on facebook each month, products ordered on amazon per second, data sent and received by mobile internet users, number of emails sent every second, video upload to youtube every minute, data consumed by households each day.


 Continue with Email

 Home
Home


