Content Analysis
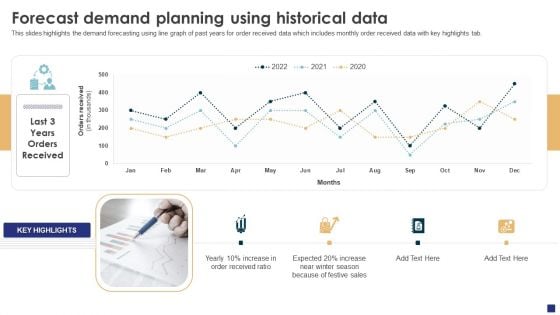
Comprehensive Guide To Ecommerce Forecast Demand Planning Using Historical Data Designs PDF
This slides highlights the demand forecasting using line graph of past years for order received data which includes monthly order received data with key highlights tab. Make sure to capture your audiences attention in your business displays with our gratis customizable Comprehensive Guide To Ecommerce Forecast Demand Planning Using Historical Data Designs PDF. These are great for business strategies, office conferences, capital raising or task suggestions. If you desire to acquire more customers for your tech business and ensure they stay satisfied, create your own sales presentation with these plain slides.
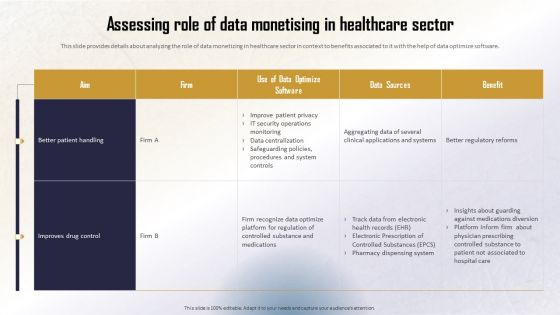
Identifying Direct And Indirect Assessing Role Of Data Monetising In Healthcare Sector Brochure PDF
This slide provides details about analyzing the role of data monetizing in healthcare sector in context to benefits associated to it with the help of data optimize software. Want to ace your presentation in front of a live audience Our Identifying Direct And Indirect Assessing Role Of Data Monetising In Healthcare Sector Brochure PDF can help you do that by engaging all the users towards you.. Slidegeeks experts have put their efforts and expertise into creating these impeccable powerpoint presentations so that you can communicate your ideas clearly. Moreover, all the templates are customizable, and easy-to-edit and downloadable. Use these for both personal and commercial use.
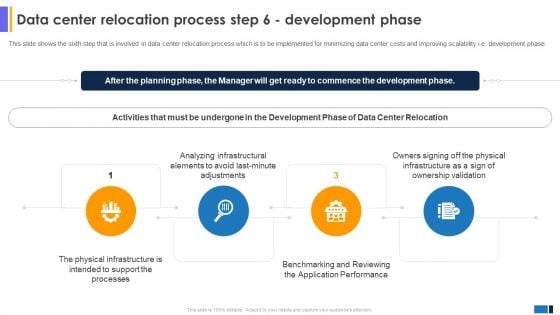
Data Center Migration For Informatidata Center Relocation Process Step 6 Development Phase Elements PDF
This slide shows the sixth step that is involved in data center relocation process which is to be implemented for minimizing data center costs and improving scalability i.e. development phase.Want to ace your presentation in front of a live audience Our Data Center Migration For Informatidata Center Relocation Process Step 6 Development Phase Elements PDF can help you do that by engaging all the users towards you. Slidegeeks experts have put their efforts and expertise into creating these impeccable powerpoint presentations so that you can communicate your ideas clearly. Moreover, all the templates are customizable, and easy-to-edit and downloadable. Use these for both personal and commercial use.
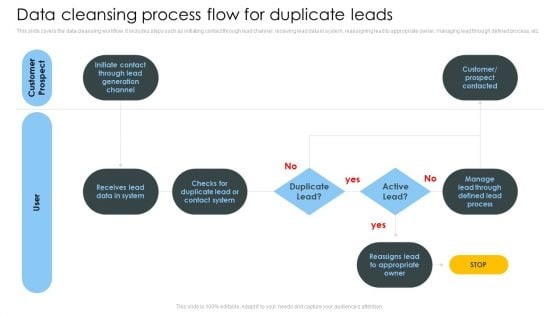
Consumer Lead Generation Process Data Cleansing Process Flow For Duplicate Leads Professional PDF
This slide covers the data cleansing workflow. It includes steps such as initiating contact through lead channel, receiving lead data in system, reassigning lead to appropriate owner, managing lead through defined process, etc. There are so many reasons you need a Consumer Lead Generation Process Data Cleansing Process Flow For Duplicate Leads Professional PDF. The first reason is you cant spend time making everything from scratch, Thus, Slidegeeks has made presentation templates for you too. You can easily download these templates from our website easily.
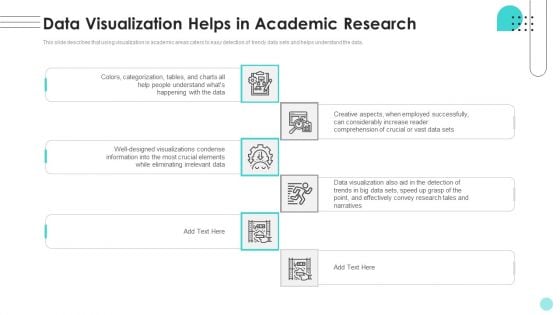
Branches For Visualization Research And Development Data Visualization Helps In Academic Download PDF
This slide describes that using visualization in academic areas caters to easy detection of trendy data sets and helps understand the data. From laying roadmaps to briefing everything in detail, our templates are perfect for you. You can set the stage with your presentation slides. All you have to do is download these easy-to-edit and customizable templates. Branches For Visualization Research And Development Data Visualization Helps In Academic Download PDF will help you deliver an outstanding performance that everyone would remember and praise you for. Do download this presentation today.
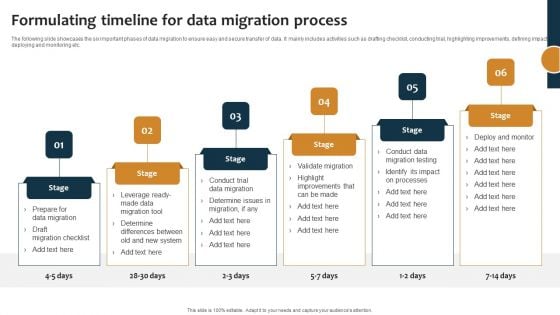
Improving Business Procedures Enterprise Resource Planning System Formulating Timeline For Data Migration Topics PDF
The following slide showcases the six important phases of data migration to ensure easy and secure transfer of data. It mainly includes activities such as drafting checklist, conducting trial, highlighting improvements, defining impact, deploying and monitoring etc. The best PPT templates are a great way to save time, energy, and resources. Slidegeeks have 100 percent editable powerpoint slides making them incredibly versatile. With these quality presentation templates, you can create a captivating and memorable presentation by combining visually appealing slides and effectively communicating your message. Download Improving Business Procedures Enterprise Resource Planning System Formulating Timeline For Data Migration Topics PDF from Slidegeeks and deliver a wonderful presentation.
Data Center Relocation Process Step 7 Validating The Plan Icons PDF
This slide shows the seventh step that is involved in data center relocation process which is to be implemented for minimizing data center costs and improving scalability i.e. validating the plan. Take your projects to the next level with our ultimate collection of Data Center Relocation Process Step 7 Validating The Plan Icons PDF. Slidegeeks has designed a range of layouts that are perfect for representing task or activity duration, keeping track of all your deadlines at a glance. Tailor these designs to your exact needs and give them a truly corporate look with your own brand colors they will make your projects stand out from the rest.
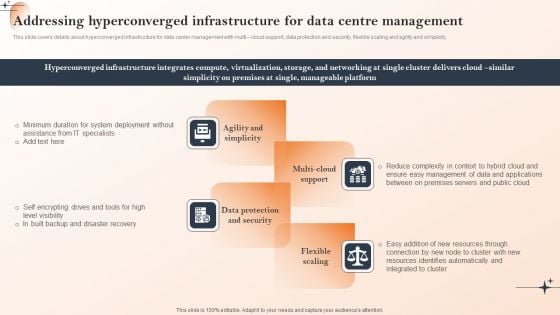
Action Of Cios To Achieve Cost Management Addressing Hyperconverged Infrastructure For Data Centre Management Themes PDF
This slide covers details about hyperconverged infrastructure for data center management with multi cloud support, data protection and security, flexible scaling and agility and simplicity. Slidegeeks is one of the best resources for PowerPoint templates. You can download easily and regulate Action Of Cios To Achieve Cost Management Addressing Hyperconverged Infrastructure For Data Centre Management Themes PDF for your personal presentations from our wonderful collection. A few clicks is all it takes to discover and get the most relevant and appropriate templates. Use our Templates to add a unique zing and appeal to your presentation and meetings. All the slides are easy to edit and you can use them even for advertisement purposes.
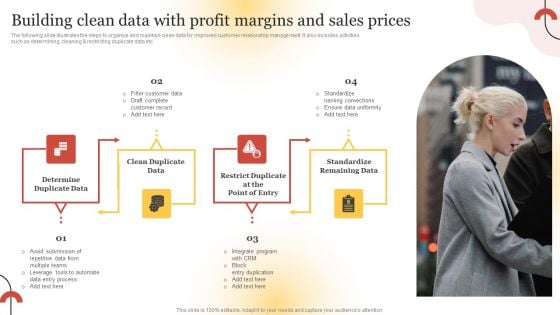
Executing Sales Risk Reduction Plan Building Clean Data With Profit Margins And Sales Prices Template PDF
The following slide illustrates the steps to organize and maintain clean data for improved customer relationship management. It also includes activities such as determining, cleaning and restricting duplicate data etc. Want to ace your presentation in front of a live audience Our Executing Sales Risk Reduction Plan Building Clean Data With Profit Margins And Sales Prices Template PDF can help you do that by engaging all the users towards you. Slidegeeks experts have put their efforts and expertise into creating these impeccable powerpoint presentations so that you can communicate your ideas clearly. Moreover, all the templates are customizable, and easy to edit and downloadable. Use these for both personal and commercial use.

Procurement Strategies For Reducing Stock Wastage Forecast Demand Using Historical Sales Data Designs PDF
This slide showcases graph that can help organization to forecast the inventory requirement on the basis of sales data of previous financial years. It showcases data of last 3 years. Take your projects to the next level with our ultimate collection of Procurement Strategies For Reducing Stock Wastage Forecast Demand Using Historical Sales Data Designs PDF. Slidegeeks has designed a range of layouts that are perfect for representing task or activity duration, keeping track of all your deadlines at a glance. Tailor these designs to your exact needs and give them a truly corporate look with your own brand colors they will make your projects stand out from the rest.
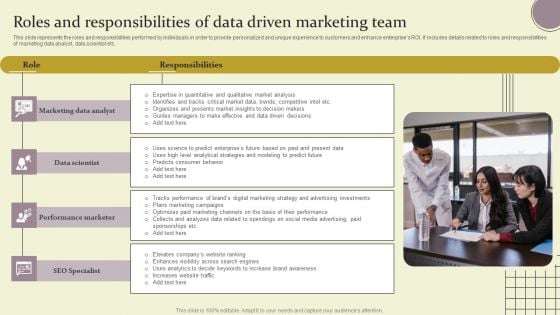
Roles And Responsibilities Of Data Driven Marketing Team Ppt Professional Gridlines PDF
This slide represents the roles and responsibilities performed by individuals in order to provide personalized and unique experience to customers and enhance enterprises ROI. It includes details related to roles and responsibilities of marketing data analyst, data scientist etc. From laying roadmaps to briefing everything in detail, our templates are perfect for you. You can set the stage with your presentation slides. All you have to do is download these easy to edit and customizable templates. Roles And Responsibilities Of Data Driven Marketing Team Ppt Professional Gridlines PDF will help you deliver an outstanding performance that everyone would remember and praise you for. Do download this presentation today.
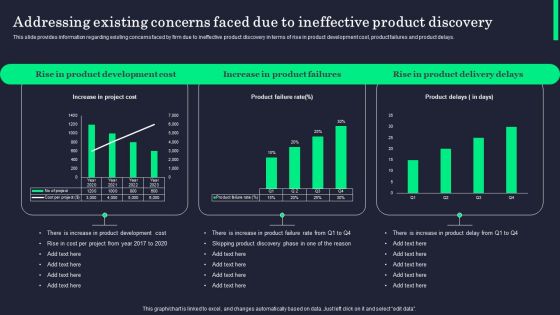
Addressing Existing Concerns Faced Due To Ineffective Product Discovery Diagrams PDF
This slide provides information regarding existing concerns faced by firm due to ineffective product discovery in terms of rise in product development cost, product failures and product delays. If you are looking for a format to display your unique thoughts, then the professionally designed Addressing Existing Concerns Faced Due To Ineffective Product Discovery Diagrams PDF is the one for you. You can use it as a Google Slides template or a PowerPoint template. Incorporate impressive visuals, symbols, images, and other charts. Modify or reorganize the text boxes as you desire. Experiment with shade schemes and font pairings. Alter, share or cooperate with other people on your work. Download Addressing Existing Concerns Faced Due To Ineffective Product Discovery Diagrams PDF and find out how to give a successful presentation. Present a perfect display to your team and make your presentation unforgettable.
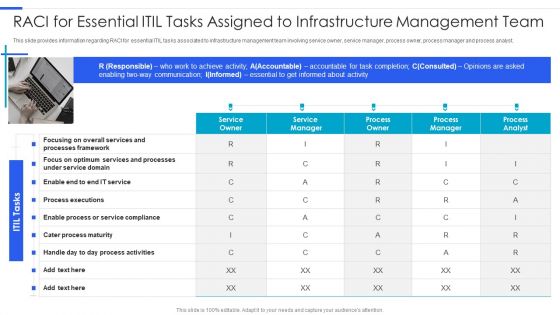
Playbook For Managing Information RACI For Essential ITIL Tasks Assigned To Infrastructure Management Rules PDF
This slide provides information regarding RACI for essential ITIL tasks associated to infrastructure management team involving service owner, service manager, process owner, process manager and process analyst. Presenting Playbook For Managing Information RACI For Essential ITIL Tasks Assigned To Infrastructure Management Rules PDF to provide visual cues and insights. Share and navigate important information on one stages that need your due attention. This template can be used to pitch topics like Processes Framework, Service Compliance, Process Activities. In addtion, this PPT design contains high resolution images, graphics, etc, that are easily editable and available for immediate download.
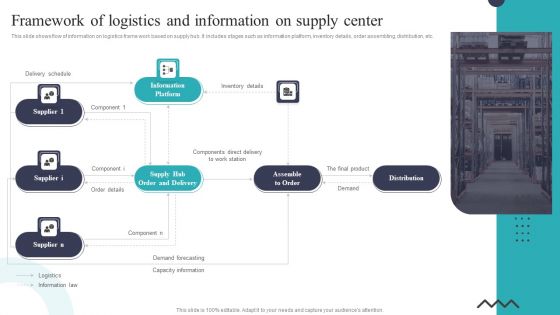
Framework Of Logistics And Information On Supply Center Ppt Summary Examples PDF
This slide shows flow of information on logistics frame work based on supply hub. It includes stages such as information platform, inventory details, order assembling, distribution, etc. Presenting Framework Of Logistics And Information On Supply Center Ppt Summary Examples PDF to dispense important information. This template comprises five stages. It also presents valuable insights into the topics including Delivery Schedule, Information Platform, Distribution, Demand Forecasting. This is a completely customizable PowerPoint theme that can be put to use immediately. So, download it and address the topic impactfully.
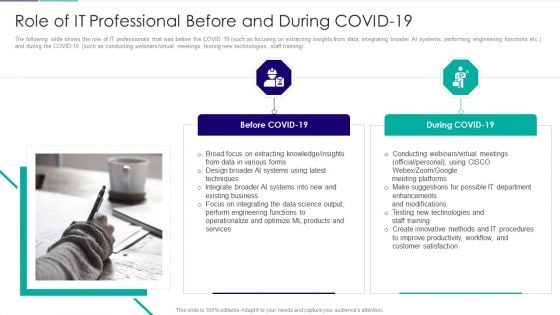
Role Of Technical Competence In Organizational Role Of It Professional During Covid19 Information PDF
The following slide shows the role of IT professionals that was before the COVID 19 such as focusing on extracting insights from data, integrating broader AI systems, performing engineering functions etc. and during the COVID 19 such as conducting webinars virtual meetings, testing new technologies, staff training Presenting Role Of Technical Competence In Organizational Role Of It Professional During Covid19 Information PDF to provide visual cues and insights. Share and navigate important information on two stages that need your due attention. This template can be used to pitch topics like Conducting Webinars, Make Suggestions For Possible, Testing New Technologies In addtion, this PPT design contains high resolution images, graphics, etc, that are easily editable and available for immediate download.
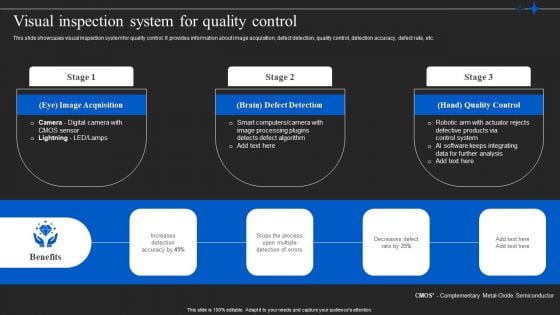
Automated Quality Control In Manufacturing Visual Inspection System Template PDF
This slide showcases visual inspection system for quality control. It provides information about image acquisition, defect detection, quality control, detection accuracy, defect rate, etc. Do you have to make sure that everyone on your team knows about any specific topic I yes, then you should give Automated Quality Control In Manufacturing Visual Inspection System Template PDF a try. Our experts have put a lot of knowledge and effort into creating this impeccable Automated Quality Control In Manufacturing Visual Inspection System Template PDF. You can use this template for your upcoming presentations, as the slides are perfect to represent even the tiniest detail. You can download these templates from the Slidegeeks website and these are easy to edit. So grab these today.
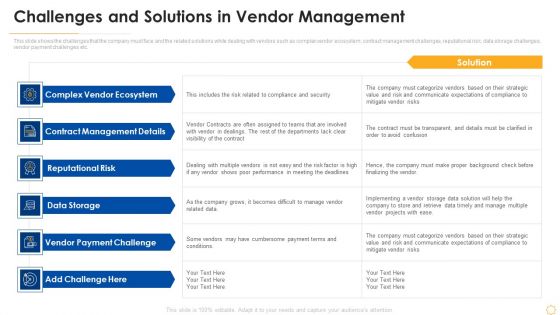
Successful Vendor Management Approaches To Boost Procurement Efficiency Challenges And Solutions Demonstration PDF
This slide shows the challenges that the company must face and the related solutions while dealing with vendors such as complex vendor ecosystem, contract management challenges, reputational risk, data storage challenges, vendor payment challenges etc. Deliver an awe inspiring pitch with this creative successful vendor management approaches to boost procurement efficiency challenges and solutions demonstration pdf bundle. Topics like complex vendor ecosystem, contract management details, reputational risk, data storage, vendor payment challenge can be discussed with this completely editable template. It is available for immediate download depending on the needs and requirements of the user.
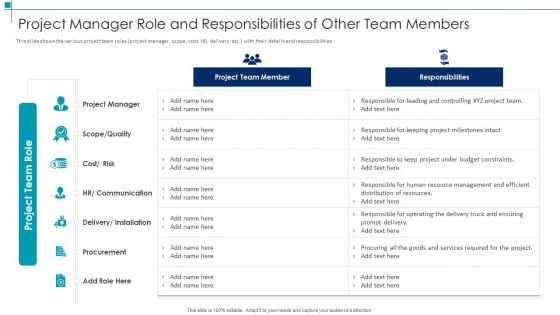
Project Manager Role And Responsibilities Project Scope Management Deliverables Information PDF
This slide shows the various project team roles project manager, scope, cost, HR, delivery, etc. with their details and responsibilities. Deliver and pitch your topic in the best possible manner with this project manager role and responsibilities project scope management deliverables information pdf. Use them to share invaluable insights on project manager, quality, risk, cost and impress your audience. This template can be altered and modified as per your expectations. So, grab it now.

Cloud Information Security Cloud Security Best Practices Ppt Infographic Template Example Topics PDF
This slide defines the best practices of cloud security, including understanding cloud utilization and risk, protection of cloud, and responding to cloud protection issues. Deliver and pitch your topic in the best possible manner with this Cloud Information Security Cloud Security Best Practices Ppt Infographic Template Example Topics PDF. Use them to share invaluable insights onSecure Cloud, Cloud Protection, Cloud Utilization and impress your audience. This template can be altered and modified as per your expectations. So, grab it now.
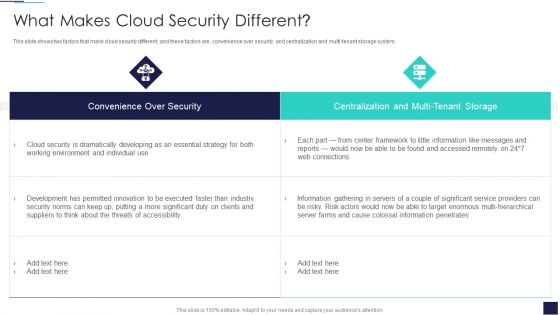
Cloud Information Security What Makes Cloud Security Different Ppt Inspiration Styles PDF
This slide shows two factors that make cloud security different, and these factors are, convenience over security, and centralization and multi-tenant storage system. Deliver an awe inspiring pitch with this creative Cloud Information Security What Makes Cloud Security Different Ppt Inspiration Styles PDF bundle. Topics like Cloud Security, Threats Accessibility, Risk Actors can be discussed with this completely editable template. It is available for immediate download depending on the needs and requirements of the user.
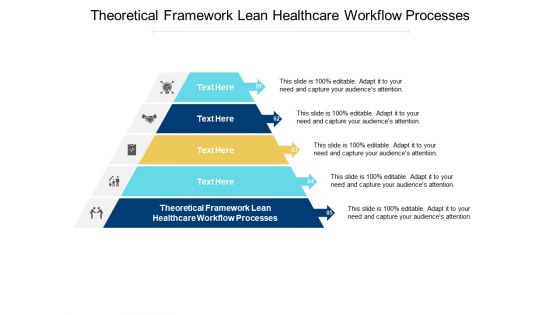
Theoretical Framework Lean Healthcare Workflow Processes Ppt PowerPoint Presentation Summary Information Cpb
Presenting this set of slides with name theoretical framework lean healthcare workflow processes ppt powerpoint presentation summary information cpb. This is an editable Powerpoint five stages graphic that deals with topics like theoretical framework lean healthcare workflow processes to help convey your message better graphically. This product is a premium product available for immediate download and is 100 percent editable in Powerpoint. Download this now and use it in your presentations to impress your audience.
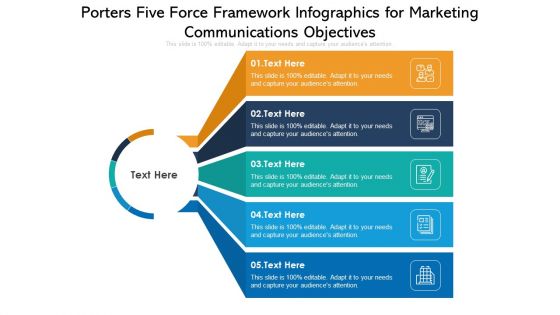
Porters Five Force Framework Infographics For Marketing Communications Objectives Ppt PowerPoint Presentation Information PDF
Persuade your audience using this porters five force framework infographics for marketing communications objectives ppt powerpoint presentation information pdf. This PPT design covers five stages, thus making it a great tool to use. It also caters to a variety of topics including porters five force framework infographics for marketing communications objectives . Download this PPT design now to present a convincing pitch that not only emphasizes the topic but also showcases your presentation skills.
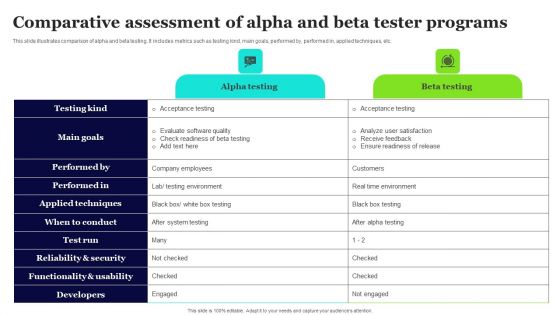
Comparative Assessment Of Alpha And Beta Tester Programs Information PDF
This slide illustrates comparison of alpha and beta testing. It includes metrics such as testing kind, main goals, performed by, performed in, applied techniques, etc. Pitch your topic with ease and precision using this Comparative Assessment Of Alpha And Beta Tester Programs Information PDF. This layout presents information on Testing Kind, Main Goals, Performed. It is also available for immediate download and adjustment. So, changes can be made in the color, design, graphics or any other component to create a unique layout.

Blockchain And DLT Framework Public Blockchain Technology Clipart PDF
This slide depicts the public blockchain technology framework and how data is stored in the public blockchain, bitcoin, voting are few examples of the public blockchain. Presenting Blockchain And DLT Framework Public Blockchain Technology Clipart PDF to provide visual cues and insights. Share and navigate important information on five stages that need your due attention. This template can be used to pitch topics like Public Blockchain, Security Protocols Sincerely, Litecoin Blockchains. In addtion, this PPT design contains high resolution images, graphics, etc, that are easily editable and available for immediate download.
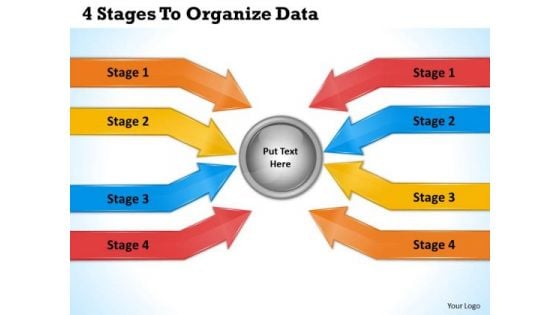
Business Planning Strategy 4 Stages To Organize Data Change Management Ppt Slide
Deliver The Right Dose With Our business planning strategy 4 stages to organize data change management ppt slide Powerpoint Templates. Your Ideas Will Get The Correct Illumination. Your Abilities Have Been Lying Dormant. Awaken Them With Our Arrows Powerpoint Templates.
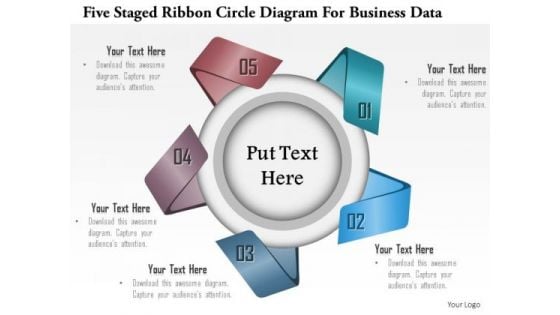
Business Diagram Five Staged Ribbon Circle Diagram For Business Data Presentation Template
This Power Point template slide has been crafted with graphic of five staged ribbon circle diagram. This PPT slide contains the concept of business data representation. Use this PPT slide and make an exclusive presentation for your viewers.

Business Diagram Five Staged Circular Ribbon Design For Data Representation Presentation Template
This business diagram displays five staged circular ribbon. This Power Point slide can be used for data representation. Use this PPT slide to show flow of activities in circular manner. Get professional with this exclusive business slide.
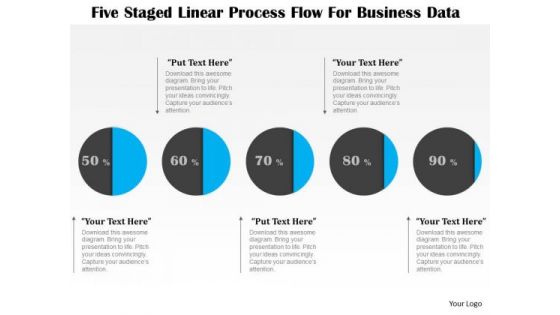
Business Diagram Five Staged Linear Process Flow For Business Data Presentation Template
This business diagram displays graphic of five staged process flow diagram. This PPT slide contains the concept of business data representation. Use this diagram to build professional presentation for your viewers.
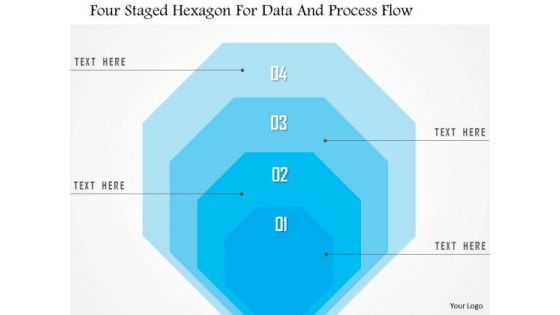
Business Diagram Four Staged Hexagon For Data And Process Flow Presentation Template
Four staged hexagon diagram has been used to design this power point template. This PPT contains the concept of data and process flow. Use this PPT and build professional presentation on business topics.
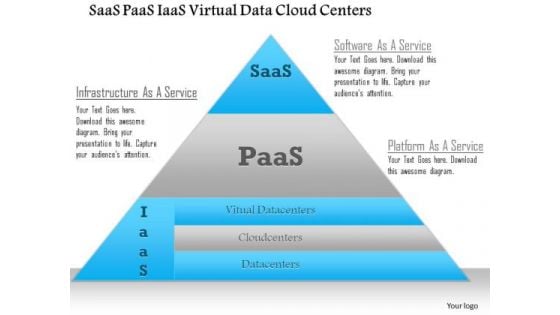
Business Diagram Saas Paas Iaas Virtual Data Cloud Centers Ppt Slide
This technical diagram has been designed with graphic of triangle. This slide contains the concept of SAAS, PAAS and IASS. This slide also helps to explain the virtual data on cloud centers. Download this diagram to make professional presentations.
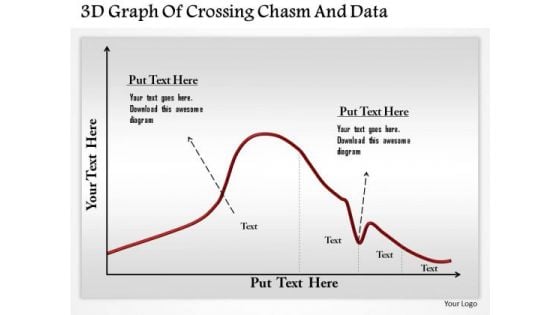
Business Diagram 3d Graph Of Crossing Chasm And Data Presentation Template
This business diagram has been designed with graphic of 3d graph. This slide contains the concept of chasm and data calculation. Use this slide to display chasm crossing condition. This business diagram adds value to your ideas.
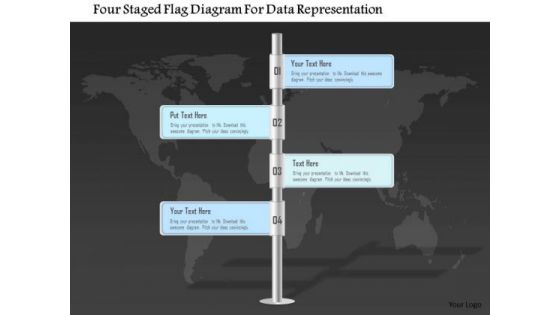
Business Diagram Four Staged Flag Diagram For Data Representation PowerPoint Template
Four staged flag diagram has been used to craft this power point template. This PPT diagram contains the concept of business agenda and data representation. Use this PPT for business and marketing related presentations.
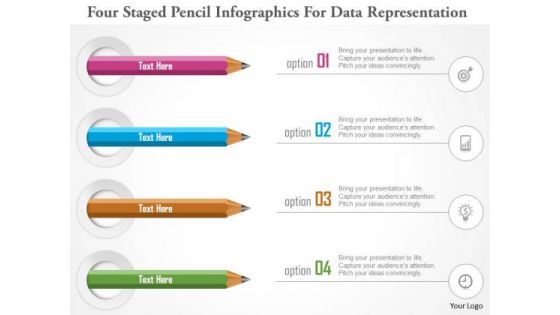
Business Diagram Four Staged Pencil Infographics For Data Representation PowerPoint Template
Four staged pencil info graphics has been used to design this power point template. This diagram template contains the concept of data representations. Use this PPT for your business and marketing presentations.
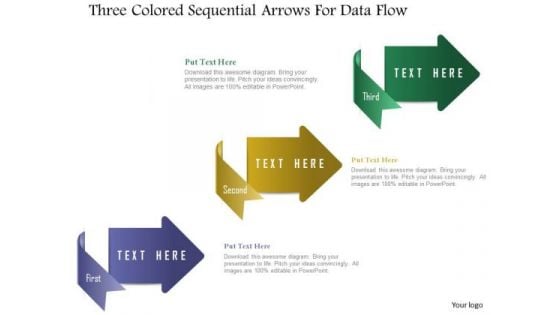
Business Diagram Three Colored Sequential Arrows For Data Flow Presentation Template
Three colored sequential arrows graphic has been used to design this power point template slide. This PPT slide contains the concept of data flow representation. Use this PPT slide for your business and management related presentations.
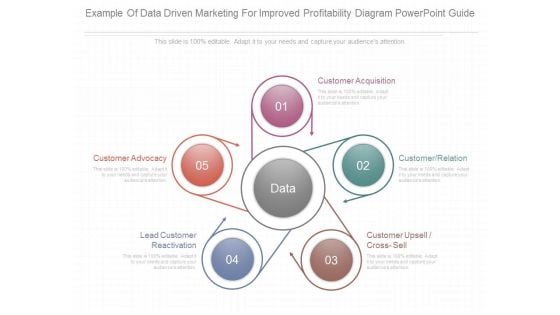
Example Of Data Driven Marketing For Improved Profitability Diagram Powerpoint Guide
This is a example of data driven marketing for improved profitability diagram powerpoint guide. This is a five stage process. The stages in this process are customer acquisition, customer relation, customer upsell cross sell, lead customer reactivation, customer advocacy.
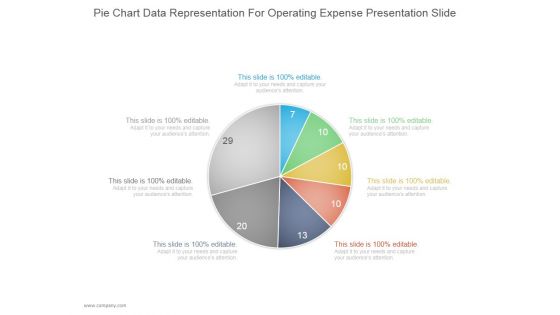
Pie Chart Data Representation For Operating Expense Ppt PowerPoint Presentation Deck
This is a pie chart data representation for operating expense ppt powerpoint presentation deck. This is a seven stage process. The stages in this process are business, strategy, marketing, pie chart, management.
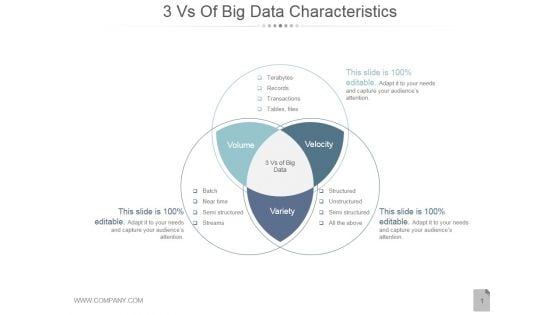
3 Vs Of Big Data Characteristics Ppt PowerPoint Presentation Example File
This is a 3 vs of big data characteristics ppt powerpoint presentation example file. This is a three stage process. The stages in this process are volume, velocity, variety.
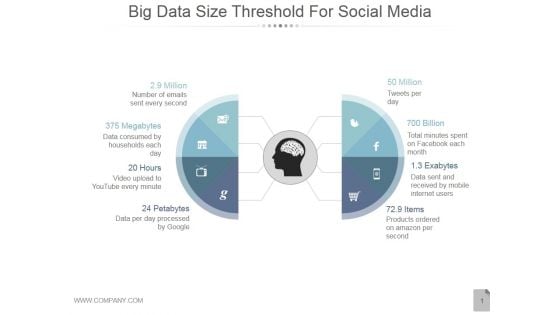
Big Data Size Threshold For Social Media Ppt PowerPoint Presentation Example
This is a big data size threshold for social media ppt powerpoint presentation example. This is a eight stage process. The stages in this process are million, megabytes, hours, petabytes, items.
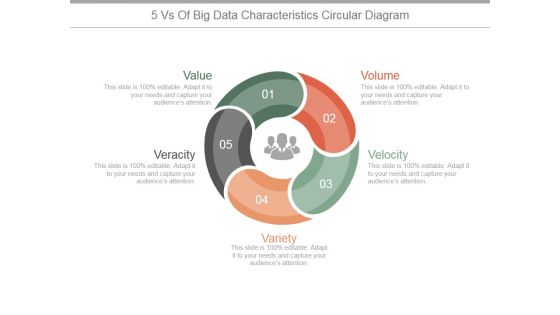
5 Vs Of Big Data Characteristics Circular Ppt PowerPoint Presentation Outline
This is a 5 vs of big data characteristics circular ppt powerpoint presentation outline. This is a five stage process. The stages in this process are value, volume, velocity, variety, veracity.
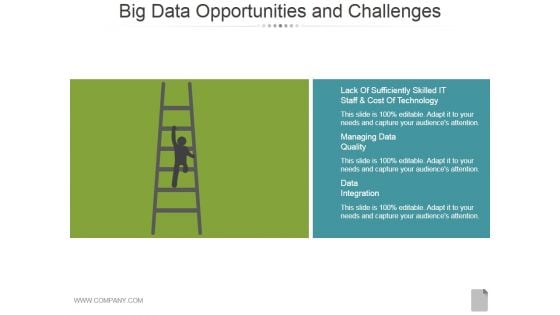
Big Data Opportunities And Challenges Template 1 Ppt PowerPoint Presentation Visual Aids
This is a big data opportunities and challenges template 1 ppt powerpoint presentation visual aids. This is a two stage process. The stages in this process are business, stairs, growth, opportunity, strategy, success.

Impact Of Big Data Template 1 Ppt PowerPoint Presentation Background Images
This is a impact of big data template 1 ppt powerpoint presentation background images. This is a four stage process. The stages in this process are healthcare, science, security, business.
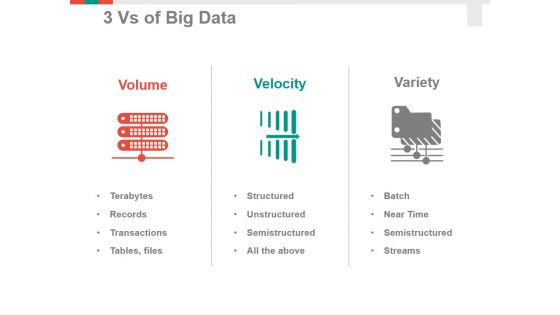
3 Vs Of Big Data Ppt PowerPoint Presentation Summary Example Introduction
This is a 3 vs of big data ppt powerpoint presentation summary example introduction. This is a three stage process. The stages in this process are volume, velocity, variety.
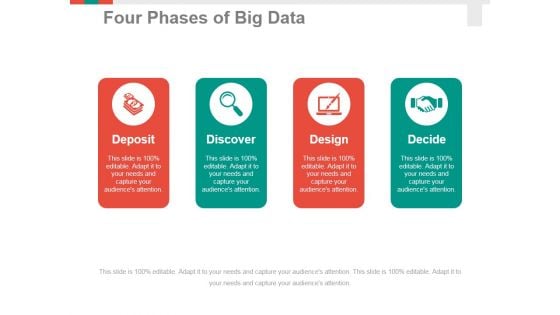
Four Phases Of Big Data Ppt PowerPoint Presentation Professional Format Ideas
This is a four phases of big data ppt powerpoint presentation professional format ideas. This is a four stage process. The stages in this process are deposit, discover, design, decide.
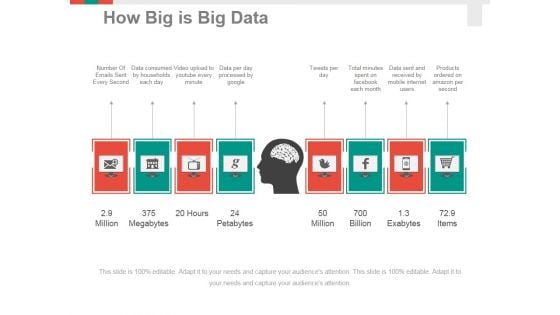
How Big Is Big Data Ppt PowerPoint Presentation Layouts Clipart Images
This is a how big is big data ppt powerpoint presentation layouts clipart images. This is a eight stage process. The stages in this process are million, megabytes, hours, petabytes.

Impact Of Big Data Template 2 Ppt PowerPoint Presentation Portfolio Model
This is a impact of big data template 2 ppt powerpoint presentation portfolio model. This is a four stage process. The stages in this process are healthcare, science, security, business.
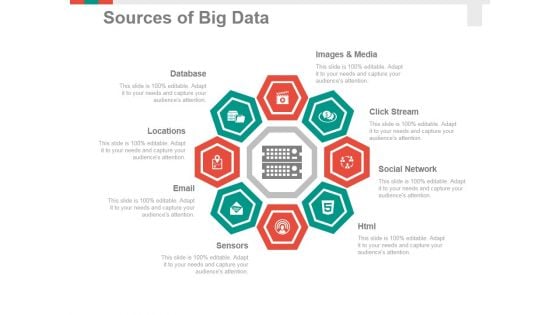
Sources Of Big Data Template 1 Ppt PowerPoint Presentation Styles Graphics
This is a sources of big data template 1 ppt powerpoint presentation styles graphics. This is a eight stage process. The stages in this process are images and media, click stream, social network, sensors, email, locations, database.
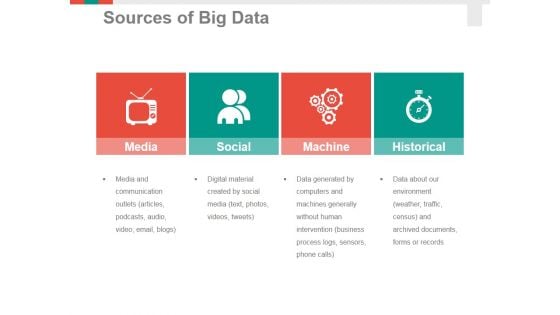
Sources Of Big Data Template 2 Ppt PowerPoint Presentation Portfolio Sample
This is a sources of big data template 2 ppt powerpoint presentation portfolio sample. This is a four stage process. The stages in this process are media, social, machine, historical.
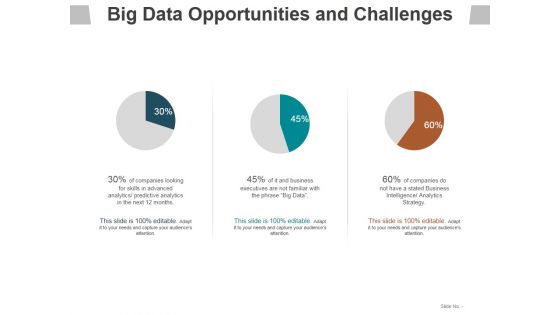
Big Data Opportunities And Challenges Template 2 Ppt PowerPoint Presentation Infographic Template Slides
This is a big data opportunities and challenges template 2 ppt powerpoint presentation infographic template slides. This is a three stage process. The stages in this process are business, management, marketing, process, success.
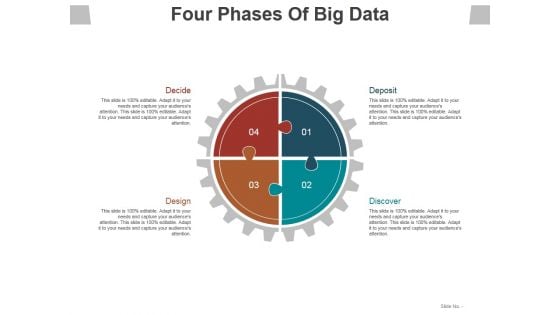
Four Phases Of Big Data Ppt PowerPoint Presentation Layouts Slide Download
This is a four phases of big data ppt powerpoint presentation layouts slide download. This is a four stage process. The stages in this process are decide, deposit, discover, design.
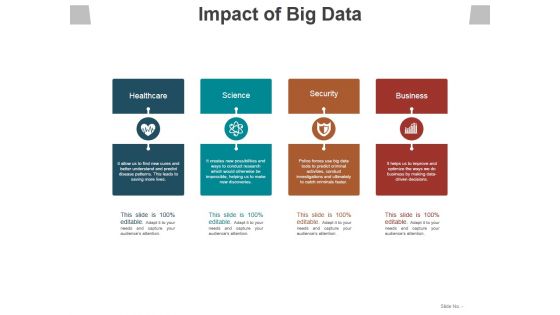
Impact Of Big Data Template 1 Ppt PowerPoint Presentation File Example File
This is a impact of big data template 1 ppt powerpoint presentation file example file. This is a four stage process. The stages in this process are healthcare, science, security, business.
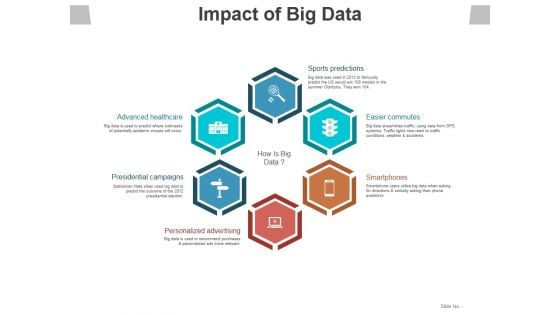
Impact Of Big Data Template 2 Ppt PowerPoint Presentation Styles Topics
This is a impact of big data template 2 ppt powerpoint presentation styles topics. This is a six stage process. The stages in this process are advanced healthcare, presidential campaigns, personalized advertising, smartphones, easier commutes.
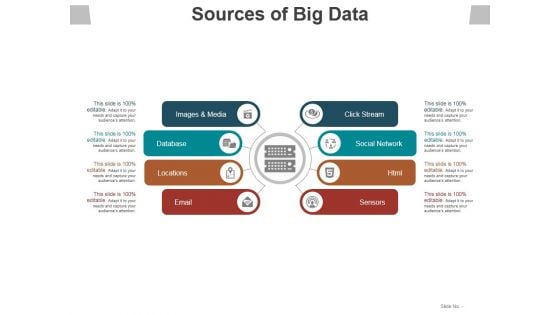
Sources Of Big Data Template 2 Ppt PowerPoint Presentation Layouts Picture
This is a sources of big data template 2 ppt powerpoint presentation layouts picture. This is a eight stage process. The stages in this process are images and media, database, locations, email, sensors.
View Data As A Shared Asset Ppt PowerPoint Presentation Icon Example Introduction
This is a view data as a shared asset ppt powerpoint presentation icon example introduction. This is a two stage process. The stages in this process are icons, strategy, business, management, marketing.
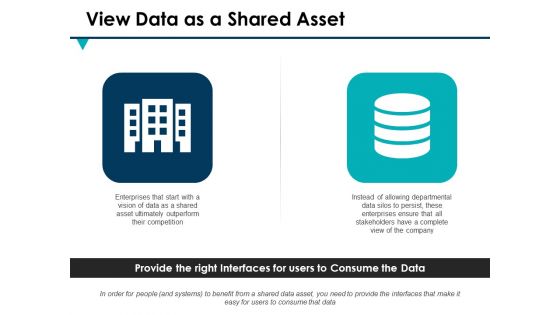
View Data As A Shared Asset Ppt PowerPoint Presentation Outline Design Ideas
This is a view data as a shared asset ppt powerpoint presentation outline design ideas. This is a two stage process. The stages in this process are marketing, business, management, planning, strategy.
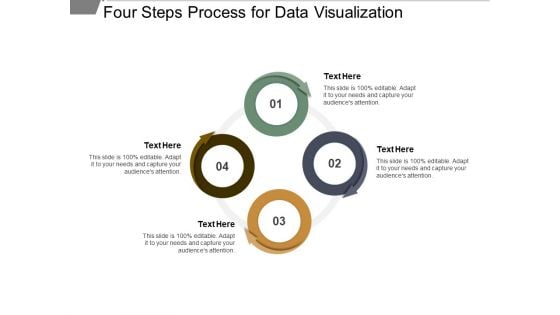
Four Steps Process For Data Visualization Ppt PowerPoint Presentation Infographic Template Inspiration
This is a four steps process for data visualization ppt powerpoint presentation infographic template inspiration. This is a four stage process. The stages in this process are circle process 4 arrows, circle cycle 4 arrows, circular process 4 arrows.
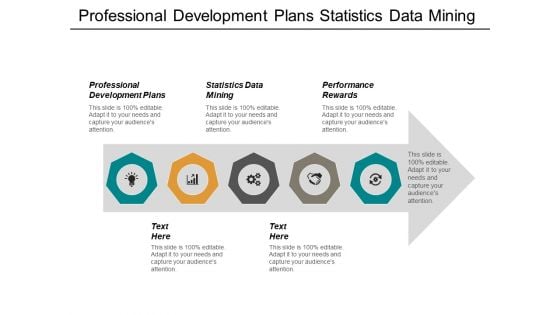
Professional Development Plans Statistics Data Mining Performance Rewards Ppt PowerPoint Presentation Styles Backgrounds
This is a professional development plans statistics data mining performance rewards ppt powerpoint presentation styles backgrounds. This is a five stage process. The stages in this process are professional development, debt management, online marketing, employee assessment.
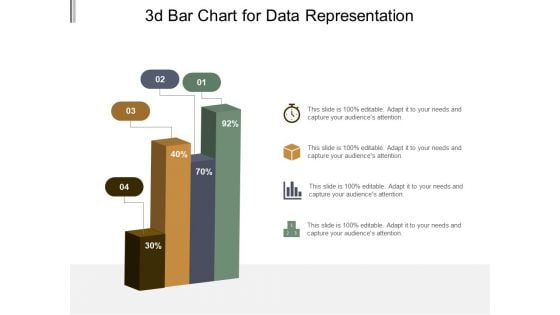
3D Bar Chart For Data Representation Ppt PowerPoint Presentation Model Graphic Tips
This is a 3d bar chart for data representation ppt powerpoint presentation model graphic tips. This is a four stage process. The stages in this process are art, colouring, paint brush.
3D Bar Chart To Display Data Ppt PowerPoint Presentation Icon Design Inspiration
This is a 3d bar chart to display data ppt powerpoint presentation icon design inspiration. This is a four stage process. The stages in this process are art, colouring, paint brush.
3D Chart For Graphical Display Of Data Ppt PowerPoint Presentation Styles Icon
This is a 3d chart for graphical display of data ppt powerpoint presentation styles icon. This is a four stage process. The stages in this process are art, colouring, paint brush.
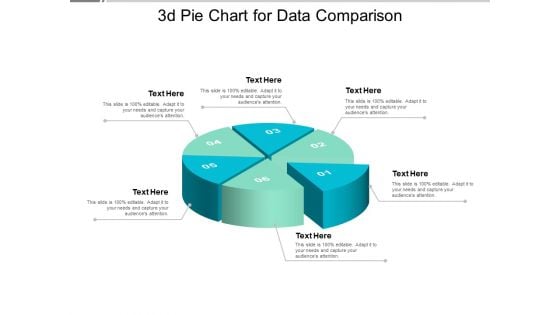
3D Pie Chart For Data Comparison Ppt PowerPoint Presentation Model Design Ideas
This is a 3d pie chart for data comparison ppt powerpoint presentation model design ideas. This is a six stage process. The stages in this process are art, colouring, paint brush.


 Continue with Email

 Home
Home


