Content Calendar

Statistics On Business And Customer Expectations From Robotic Process Automation Chatbot Themes PDF
This slide presents statistics on business and customer expectations from RPA chatbot, helpful in determining how their goals coincide and relate to each other. It includes customer expectations such as fast replies and business expectations such as generating leads. Pitch your topic with ease and precision using this Statistics On Business And Customer Expectations From Robotic Process Automation Chatbot Themes PDF. This layout presents information on Online Shopping Trends, E-Commerce, Competitive Advantage, Business Expectations. It is also available for immediate download and adjustment. So, changes can be made in the color, design, graphics or any other component to create a unique layout.
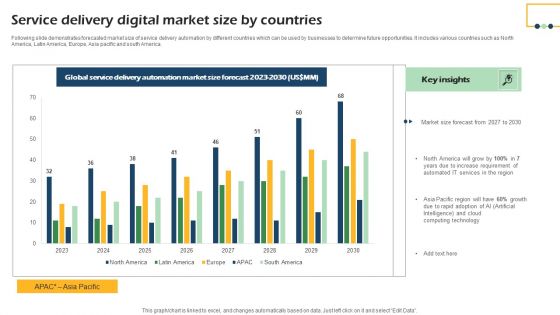
Service Delivery Digital Market Size By Countries Demonstration PDF
Following slide demonstrates forecasted market size of service delivery automation by different countries which can be used by businesses to determine future opportunities. It includes various countries such as North America, Latin America, Europe, Asia pacific and south America. Pitch your topic with ease and precision using this Service Delivery Digital Market Size By Countries Demonstration PDF. This layout presents information on Global Service, Delivery Automation, Market Size Forecast. It is also available for immediate download and adjustment. So, changes can be made in the color, design, graphics or any other component to create a unique layout.
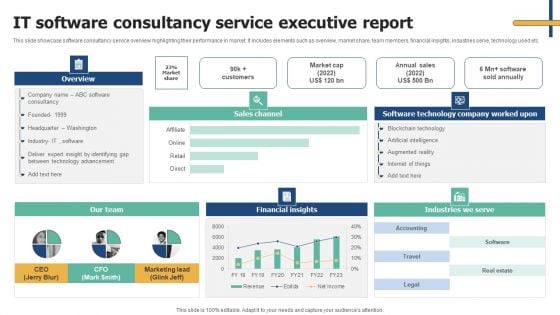
IT Software Consultancy Service Executive Report Structure PDF
This slide showcase software consultancy service overview highlighting their performance in market. It includes elements such as overview, market share, team members, financial insights, industries serve, technology used etc. Pitch your topic with ease and precision using this IT Software Consultancy Service Executive Report Structure PDF. This layout presents information on Financial Insights, Our Team, Industries We Serve. It is also available for immediate download and adjustment. So, changes can be made in the color, design, graphics or any other component to create a unique layout.
Soft Drink Company Executive Report Overview Icons PDF
This slide illustrate soft drink manufacturing company overview along with its vision and mission statement. It includes elements such as company background, key facts about company, sales, revenue and cost of goods comparison etc. Pitch your topic with ease and precision using this Soft Drink Company Executive Report Overview Icons PDF. This layout presents information on Vision, Products, Financial Comparison. It is also available for immediate download and adjustment. So, changes can be made in the color, design, graphics or any other component to create a unique layout.
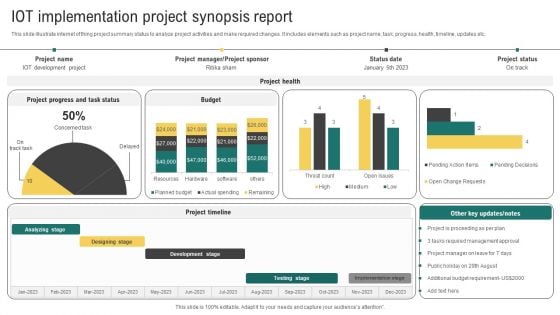
IOT Implementation Project Synopsis Report Summary PDF
This slide illustrate internet of thing project summary status to analyze project activities and make required changes. It includes elements such as project name, task, progress, health, timeline, updates etc. Pitch your topic with ease and precision using this IOT Implementation Project Synopsis Report Summary PDF. This layout presents information on Development Stage, Testing Stage, Implementation Stage. It is also available for immediate download and adjustment. So, changes can be made in the color, design, graphics or any other component to create a unique layout.
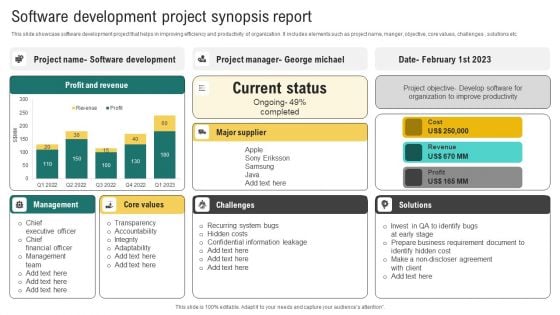
Software Development Project Synopsis Report Microsoft PDF
This slide showcase software development project that helps in improving efficiency and productivity of organization. It includes elements such as project name, manger, objective, core values, challenges , solutions etc. Pitch your topic with ease and precision using this Software Development Project Synopsis Report Microsoft PDF. This layout presents information on Profit Revenue, Current Status, Management. It is also available for immediate download and adjustment. So, changes can be made in the color, design, graphics or any other component to create a unique layout.
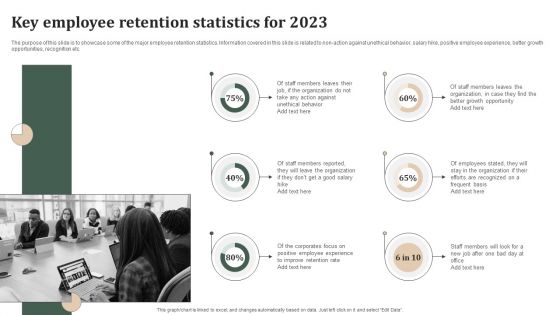
Successful Staff Retention Techniques Key Employee Retention Statistics For 2023 Graphics PDF
The purpose of this slide is to showcase some of the major employee retention statistics. Information covered in this slide is related to non action against unethical behavior, salary hike, positive employee experience, better growth opportunities, recognition etc. From laying roadmaps to briefing everything in detail, our templates are perfect for you. You can set the stage with your presentation slides. All you have to do is download these easy to edit and customizable templates. Successful Staff Retention Techniques Key Employee Retention Statistics For 2023 Graphics PDF will help you deliver an outstanding performance that everyone would remember and praise you for. Do download this presentation today.
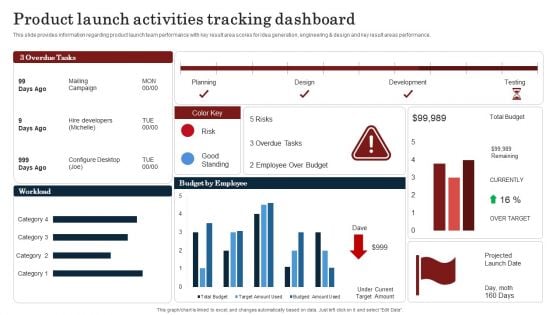
Commodity Launch Kickoff Administration Playbook Product Launch Activities Structure PDF
This slide provides information regarding product launch team performance with key result area scores for idea generation, engineering and design and key result areas performance. Take your projects to the next level with our ultimate collection of Commodity Launch Kickoff Administration Playbook Product Launch Activities Structure PDF. Slidegeeks has designed a range of layouts that are perfect for representing task or activity duration, keeping track of all your deadlines at a glance. Tailor these designs to your exact needs and give them a truly corporate look with your own brand colors they will make your projects stand out from the rest.
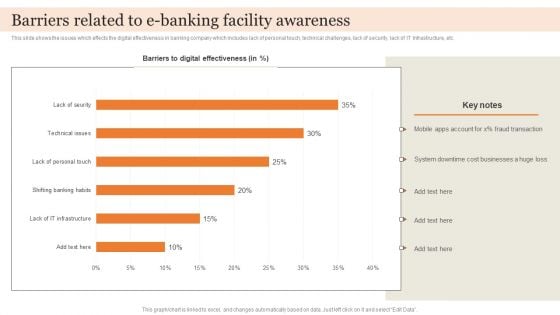
Barriers Related To E Banking Facility Awareness Guidelines PDF
This slide shows the issues which effects the digital effectiveness in banking company which includes lack of personal touch, technical challenges, lack of security, lack of IT Infrastructure, etc. Pitch your topic with ease and precision using this Barriers Related To E Banking Facility Awareness Guidelines PDF. This layout presents information on Cost Businesses, Fraud Transaction, Digital Effectiveness. It is also available for immediate download and adjustment. So, changes can be made in the color, design, graphics or any other component to create a unique layout.

Automated Supplier Relationship Management Risk Assessment Dashboard Showing Template PDF
This slide delineates risk assessment dashboard which can help vendor managers in assessing procurement contract status. It includes information about suppliers, renewals, actions, assessment status, concentration, etc. Slidegeeks is one of the best resources for PowerPoint templates. You can download easily and regulate Automated Supplier Relationship Management Risk Assessment Dashboard Showing Template PDF for your personal presentations from our wonderful collection. A few clicks is all it takes to discover and get the most relevant and appropriate templates. Use our Templates to add a unique zing and appeal to your presentation and meetings. All the slides are easy to edit and you can use them even for advertisement purposes.
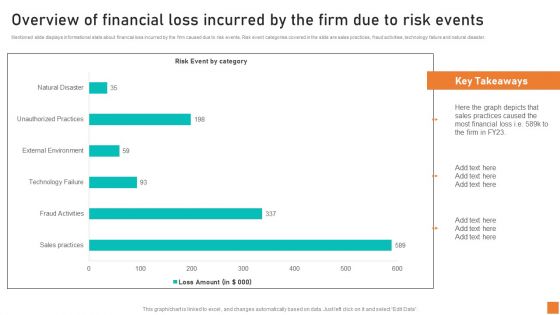
Overview Of Financial Loss Incurred By The Firm Due To Risk Events Ppt Examples PDF
Mentioned slide displays informational stats about financial loss incurred by the firm caused due to risk events. Risk event categories covered in the slide are sales practices, fraud activities, technology failure and natural disaster. Make sure to capture your audiences attention in your business displays with our gratis customizable Overview Of Financial Loss Incurred By The Firm Due To Risk Events Ppt Examples PDF. These are great for business strategies, office conferences, capital raising or task suggestions. If you desire to acquire more customers for your tech business and ensure they stay satisfied, create your own sales presentation with these plain slides.
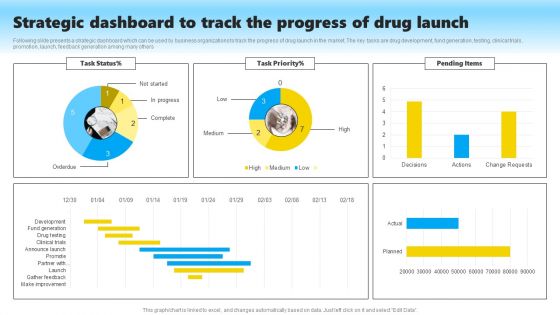
Strategic Dashboard To Track The Progress Of Drug Launch Structure PDF
Following slide presents a strategic dashboard which can be used by business organizations to track the progress of drug launch in the market. The key tasks are drug development, fund generation, testing, clinical trials, promotion, launch, feedback generation among many others. Pitch your topic with ease and precision using this Strategic Dashboard To Track The Progress Of Drug Launch Structure PDF. This layout presents information on Drug Development, Fund Generation, Testing, Clinical Trials, Promotion, Launch, Feedback Generation. It is also available for immediate download and adjustment. So, changes can be made in the color, design, graphics or any other component to create a unique layout.
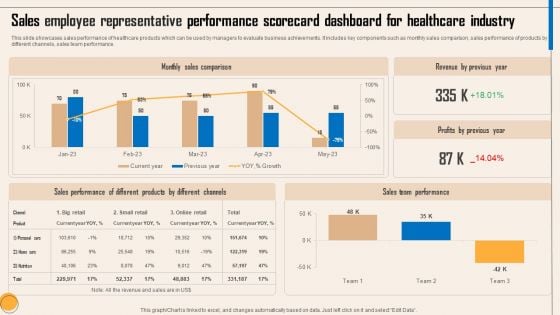
Sales Employee Representative Performance Scorecard Dashboard For Healthcare Industry Clipart PDF
This slide showcases sales performance of healthcare products which can be used by managers to evaluate business achievements. It includes key components such as monthly sales comparison, sales performance of products by different channels, sales team performance. Pitch your topic with ease and precision using this Sales Employee Representative Performance Scorecard Dashboard For Healthcare Industry Clipart PDF. This layout presents information on Monthly Sales Comparison, Revenue By Previous Year, Sales Performance, Different Products, Different Channels, Sales Team Performance . It is also available for immediate download and adjustment. So, changes can be made in the color, design, graphics or any other component to create a unique layout.
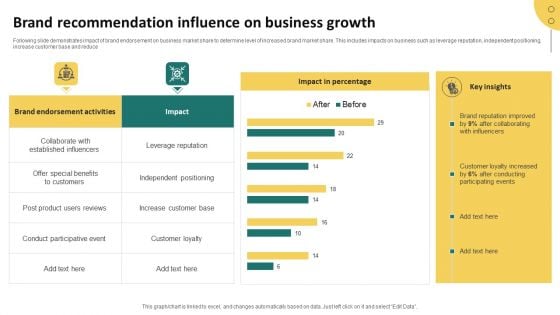
Brand Recommendation Influence On Business Growth Diagrams PDF
Following slide demonstrates impact of brand endorsement on business market share to determine level of increased brand market share. This includes impacts on business such as leverage reputation, independent positioning, increase customer base and reduce. Pitch your topic with ease and precision using this Brand Recommendation Influence On Business Growth Diagrams PDF. This layout presents information on Leverage Reputation, Independent Positioning, Increase Customer Base, Customer Loyalty. It is also available for immediate download and adjustment. So, changes can be made in the color, design, graphics or any other component to create a unique layout.
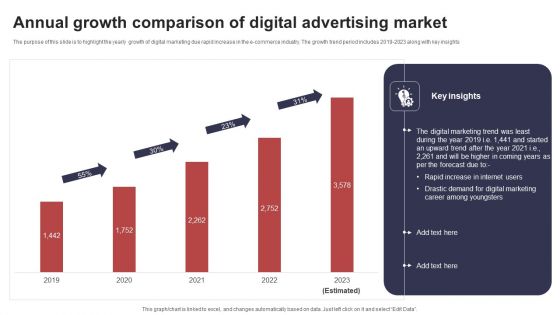
Annual Growth Comparison Of Digital Advertising Market Summary PDF
The purpose of this slide is to highlight the yearly growth of digital marketing due rapid increase in the e commerce industry. The growth trend period includes 2019 2023 along with key insights. Pitch your topic with ease and precision using this Annual Growth Comparison Of Digital Advertising Market Summary PDF. This layout presents information on Digital Marketing, Internet Users, Career Among Youngsters. It is also available for immediate download and adjustment. So, changes can be made in the color, design, graphics or any other component to create a unique layout.
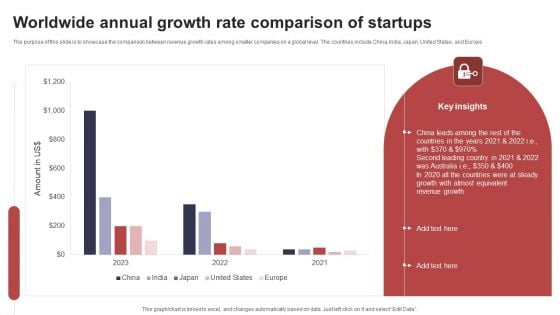
Worldwide Annual Growth Rate Comparison Of Startups Template PDF
The purpose of this slide is to showcase the comparison between revenue growth rates among smaller companies on a global level. The countries include China, India, Japan, United States, and Europe. Pitch your topic with ease and precision using this Worldwide Annual Growth Rate Comparison Of Startups Template PDF. This layout presents information on China Leads Among, Almost Equivalent, Revenue Growth. It is also available for immediate download and adjustment. So, changes can be made in the color, design, graphics or any other component to create a unique layout.
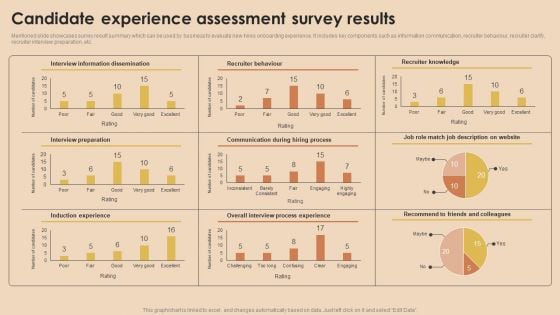
Detailed Guide For Talent Acquisition Candidate Experience Assessment Survey Results Clipart PDF
Mentioned slide showcases survey result summary which can be used by business to evaluate new hires onboarding experience. It includes key components such as information communication, recruiter behaviour, recruiter clarify, recruiter interview preparation, etc. Take your projects to the next level with our ultimate collection of Detailed Guide For Talent Acquisition Candidate Experience Assessment Survey Results Clipart PDF. Slidegeeks has designed a range of layouts that are perfect for representing task or activity duration, keeping track of all your deadlines at a glance. Tailor these designs to your exact needs and give them a truly corporate look with your own brand colors they will make your projects stand out from the rest.
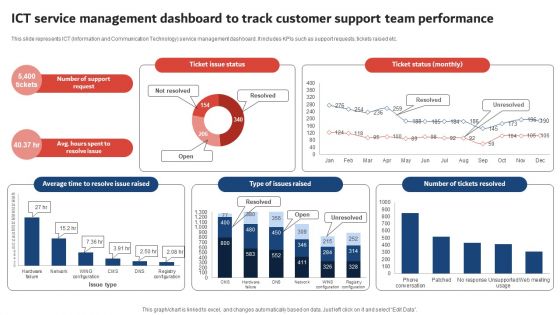
ICT Service Management Dashboard To Track Customer Support Team Performance Summary PDF
This slide represents ICT Information and Communication Technology service management dashboard. It includes KPIs such as support requests, tickets raised etc. Want to ace your presentation in front of a live audience Our ICT Service Management Dashboard To Track Customer Support Team Performance Summary PDF can help you do that by engaging all the users towards you. Slidegeeks experts have put their efforts and expertise into creating these impeccable powerpoint presentations so that you can communicate your ideas clearly. Moreover, all the templates are customizable, and easy to edit and downloadable. Use these for both personal and commercial use.
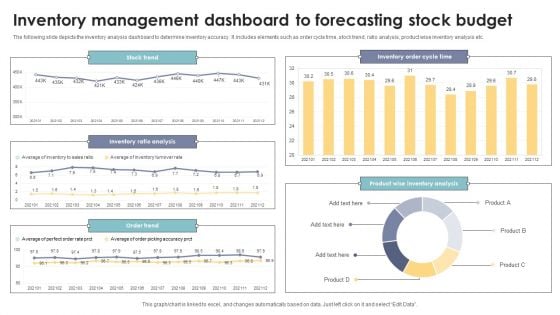
Inventory Management Dashboard To Forecasting Stock Budget Elements PDF
The following slide depicts the inventory analysis dashboard to determine inventory accuracy. It includes elements such as order cycle time, stock trend, ratio analysis, product wise inventory analysis etc. Pitch your topic with ease and precision using this Inventory Management Dashboard To Forecasting Stock Budget Elements PDF. This layout presents information on Inventory Ratio Analysis, Product Wise Inventory Analysis, Stock Trend. It is also available for immediate download and adjustment. So, changes can be made in the color, design, graphics or any other component to create a unique layout.
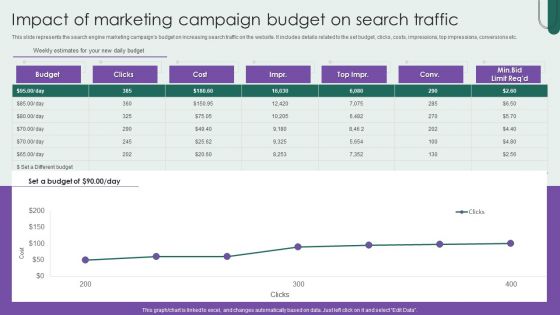
Impact Of Marketing Campaign Budget On Search Traffic Brochure PDF
This slide represents the search engine marketing campaigns budget on increasing search traffic on the website. It includes details related to the set budget, clicks, costs, impressions, top impressions, conversions etc. Pitch your topic with ease and precision using this Impact Of Marketing Campaign Budget On Search Traffic Brochure PDF. This layout presents information on Cost, Budget, Impact Of Marketing Campaign. It is also available for immediate download and adjustment. So, changes can be made in the color, design, graphics or any other component to create a unique layout.
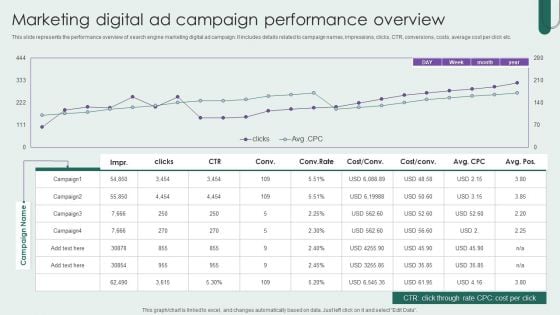
Marketing Digital Ad Campaign Performance Overview Designs PDF
This slide represents the performance overview of search engine marketing digital ad campaign. It includes details related to campaign names, impressions, clicks, CTR, conversions, costs, average cost per click etc. Pitch your topic with ease and precision using this Marketing Digital Ad Campaign Performance Overview Designs PDF. This layout presents information on Marketing Digital Ad Campaign, Performance Overview. It is also available for immediate download and adjustment. So, changes can be made in the color, design, graphics or any other component to create a unique layout.
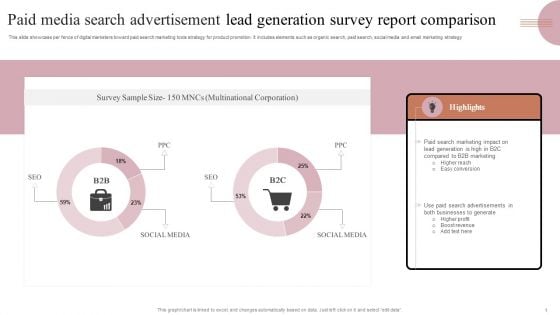
Paid Media Search Advertisement Lead Generation Survey Report Comparison Clipart PDF
This slide showcase per fence of digital marketers toward paid search marketing tools strategy for product promotion. It includes elements such as organic search, paid search, social media and email marketing strategy. Pitch your topic with ease and precision using this Paid Media Search Advertisement Lead Generation Survey Report Comparison Clipart PDF. This layout presents information on Search Marketing, B2B Marketing, Higher Profit. It is also available for immediate download and adjustment. So, changes can be made in the color, design, graphics or any other component to create a unique layout.
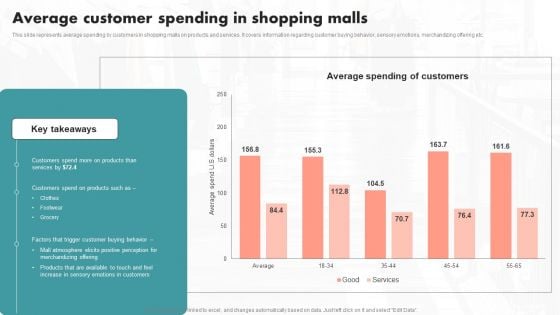
Average Customer Spending In Shopping Malls Ppt PowerPoint Presentation Diagram Images PDF
This slide represents average spending by customers in shopping malls on products and services. It covers information regarding customer buying behavior, sensory emotions, merchandizing offering etc. qIf your project calls for a presentation, then Slidegeeks is your go to partner because we have professionally designed, easy to edit templates that are perfect for any presentation. After downloading, you can easily edit Average Customer Spending In Shopping Malls Ppt PowerPoint Presentation Diagram Images PDF and make the changes accordingly. You can rearrange slides or fill them with different images. Check out all the handy templates
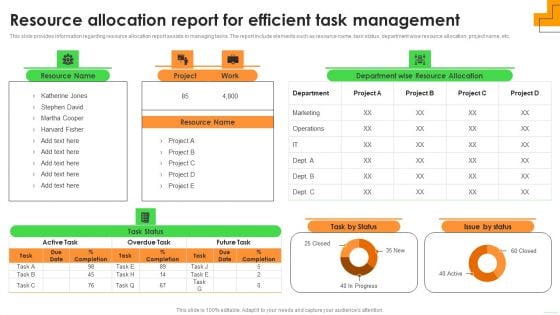
Resource Allocation Report For Efficient Task Management Guidelines PDF
This slide provides information regarding resource allocation report assists in managing tasks. The report include elements such as resource name, task status, department wise resource allocation, project name, etc. If your project calls for a presentation, then Slidegeeks is your go-to partner because we have professionally designed, easy-to-edit templates that are perfect for any presentation. After downloading, you can easily edit Resource Allocation Report For Efficient Task Management Guidelines PDF and make the changes accordingly. You can rearrange slides or fill them with different images. Check out all the handy templates
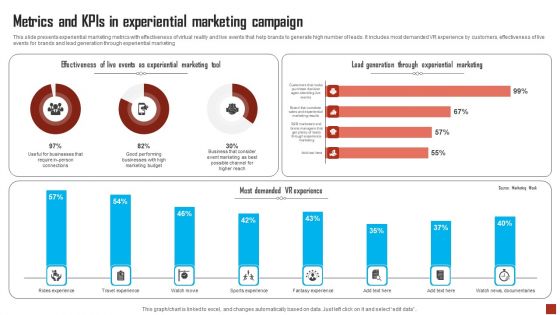
Metrics And Kpis In Experiential Marketing Campaign Structure PDF
This slide presents experiential marketing metrics with effectiveness of virtual reality and live events that help brands to generate high number of leads. It includes most demanded VR experience by customers, effectiveness of live events for brands and lead generation through experiential marketing. Pitch your topic with ease and precision using this Metrics And Kpis In Experiential Marketing Campaign Structure PDF. This layout presents information on Experiential Marketing, Business, Metrics. It is also available for immediate download and adjustment. So, changes can be made in the color, design, graphics or any other component to create a unique layout.
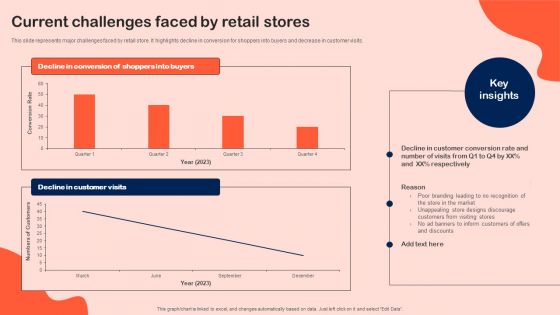
Current Challenges Faced By Retail Stores Microsoft PDF
This slide represents major challenges faced by retail store. It highlights decline in conversion for shoppers into buyers and decrease in customer visits. This Current Challenges Faced By Retail Stores Microsoft PDF from Slidegeeks makes it easy to present information on your topic with precision. It provides customization options, so you can make changes to the colors, design, graphics, or any other component to create a unique layout. It is also available for immediate download, so you can begin using it right away. Slidegeeks has done good research to ensure that you have everything you need to make your presentation stand out. Make a name out there for a brilliant performance.

Factors Influencing Consumer Decision Making And Affecting Shopping Behavior Pictures PDF
This This slide represents survey to find key drivers and barriers that influence shoppers buying decisions. It highlights drivers and barriers such as hassle free return, product information etc. Take your projects to the next level with our ultimate collection of Factors Influencing Consumer Decision Making And Affecting Shopping Behavior Pictures PDF. Slidegeeks has designed a range of layouts that are perfect for representing task or activity duration, keeping track of all your deadlines at a glance. Tailor these designs to your exact needs and give them a truly corporate look with your own brand colors they will make your projects stand out from the rest.
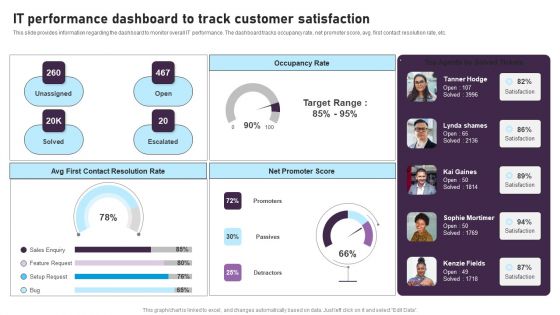
IT Performance Dashboard To Track Customer Satisfaction Designs PDF
This slide provides information regarding the dashboard to monitor overall IT performance. The dashboard tracks occupancy rate, net promoter score, avg. first contact resolution rate, etc. Crafting an eye-catching presentation has never been more straightforward. Let your presentation shine with this tasteful yet straightforward IT Performance Dashboard To Track Customer Satisfaction Designs PDF template. It offers a minimalistic and classy look that is great for making a statement. The colors have been employed intelligently to add a bit of playfulness while still remaining professional. Construct the ideal IT Performance Dashboard To Track Customer Satisfaction Designs PDF that effortlessly grabs the attention of your audience Begin now and be certain to wow your customers
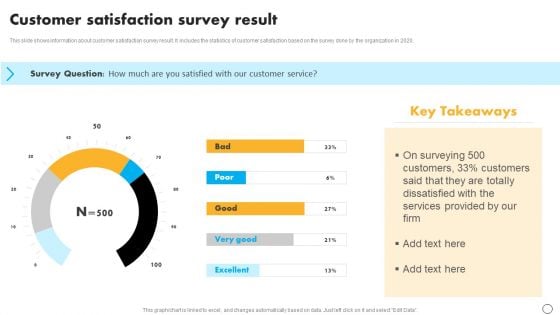
Retail Business Optimization Through Operational Excellence Strategy Customer Satisfaction Survey Result Ideas PDF
This slide shows information about customer satisfaction survey result. It includes the statistics of customer satisfaction based on the survey done by the organization in 2020. From laying roadmaps to briefing everything in detail, our templates are perfect for you. You can set the stage with your presentation slides. All you have to do is download these easy to edit and customizable templates. Retail Business Optimization Through Operational Excellence Strategy Customer Satisfaction Survey Result Ideas PDF will help you deliver an outstanding performance that everyone would remember and praise you for. Do download this presentation today.
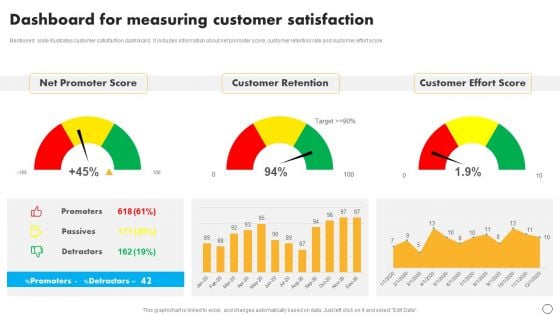
Retail Business Optimization Through Operational Excellence Strategy Dashboard Measuring Customer Template PDF
Mentioned slide illustrates customer satisfaction dashboard. It includes information about net promoter score, customer retention rate and customer effort score. Present like a pro with Retail Business Optimization Through Operational Excellence Strategy Dashboard Measuring Customer Template PDF Create beautiful presentations together with your team, using our easy to use presentation slides. Share your ideas in real time and make changes on the fly by downloading our templates. So whether you are in the office, on the go, or in a remote location, you can stay in sync with your team and present your ideas with confidence. With Slidegeeks presentation got a whole lot easier. Grab these presentations today.
Mobile Device Management For Improving IT Operations Tracking Mobile Device Activities Summary PDF
This slide covers information regarding the tracking mobile device activities at workplace with details about device security, ownership, last seen status. Take your projects to the next level with our ultimate collection of Mobile Device Management For Improving IT Operations Tracking Mobile Device Activities Summary PDF. Slidegeeks has designed a range of layouts that are perfect for representing task or activity duration, keeping track of all your deadlines at a glance. Tailor these designs to your exact needs and give them a truly corporate look with your own brand colors they will make your projects stand out from the rest.
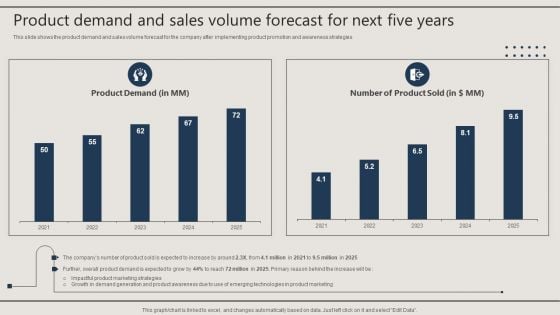
Product Demand And Sales Volume Forecast For Next Five Years Rules PDF
This slide shows the product demand and sales volume forecast for the company after implementing product promotion and awareness strategies. This Product Demand And Sales Volume Forecast For Next Five Years Rules PDF from Slidegeeks makes it easy to present information on your topic with precision. It provides customization options, so you can make changes to the colors, design, graphics, or any other component to create a unique layout. It is also available for immediate download, so you can begin using it right away. Slidegeeks has done good research to ensure that you have everything you need to make your presentation stand out. Make a name out there for a brilliant performance.
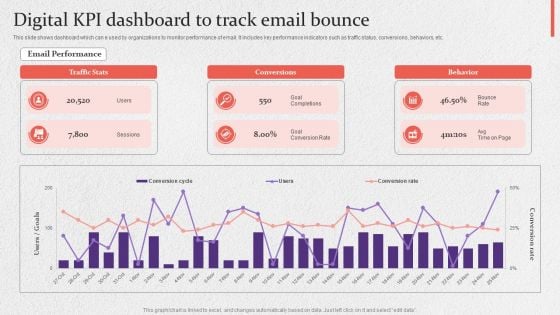
Digital KPI Dashboard To Track Email Bounce Slides PDF
This slide shows dashboard which can e used by organizations to monitor performance of email. It includes key performance indicators such as traffic status, conversions, behaviors, etc. Pitch your topic with ease and precision using this Digital KPI Dashboard To Track Email Bounce Slides PDF. This layout presents information on Digital Kpi Dashboard, Track Email Bounce. It is also available for immediate download and adjustment. So, changes can be made in the color, design, graphics or any other component to create a unique layout.
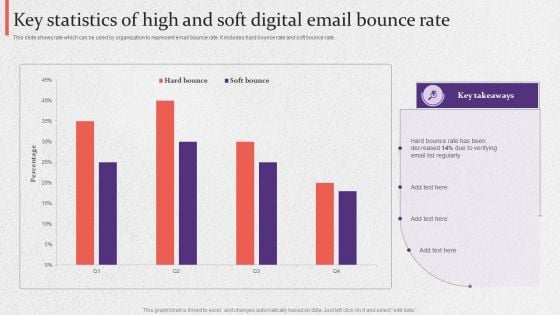
Key Statistics Of High And Soft Digital Email Bounce Rate Summary PDF
This slide shows rate which can be used by organization to represent email bounce rate. It includes hard bounce rate and soft bounce rate. Pitch your topic with ease and precision using this Key Statistics Of High And Soft Digital Email Bounce Rate Summary PDF. This layout presents information on Key Statistics, Soft Digital, Email Bounce Rate. It is also available for immediate download and adjustment. So, changes can be made in the color, design, graphics or any other component to create a unique layout.
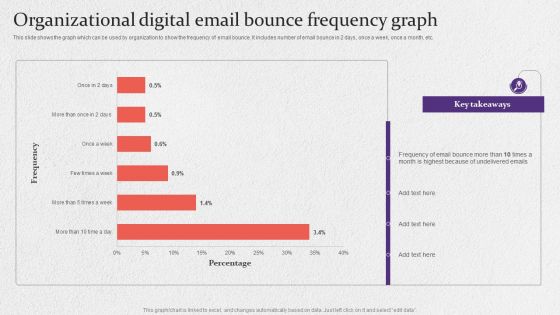
Organizational Digital Email Bounce Frequency Graph Formats PDF
This slide shows the graph which can be used by organization to show the frequency of email bounce. It includes number of email bounce in 2 days, once a week, once a month, etc. Pitch your topic with ease and precision using this Organizational Digital Email Bounce Frequency Graph Formats PDF. This layout presents information on Organizational Digital, Email Bounce Frequency Graph. It is also available for immediate download and adjustment. So, changes can be made in the color, design, graphics or any other component to create a unique layout.
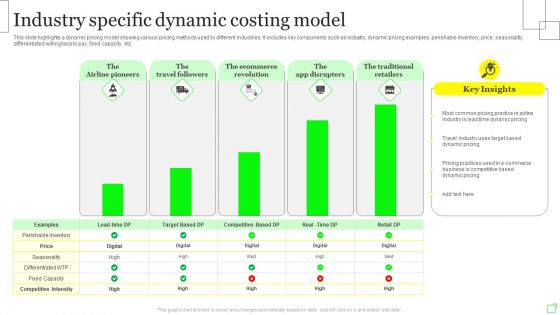
Industry Specific Dynamic Costing Model Demonstration PDF
This slide highlights a dynamic pricing model showing various pricing methods used by different industries. It includes key components such as industry, dynamic pricing examples, perishable inventory, price, seasonality, differentiated willingness to pay, fixed capacity, etc. Pitch your topic with ease and precision using this Industry Specific Dynamic Costing Model Demonstration PDF. This layout presents information on Dynamic Pricing, E Commerce, Target. It is also available for immediate download and adjustment. So, changes can be made in the color, design, graphics or any other component to create a unique layout.
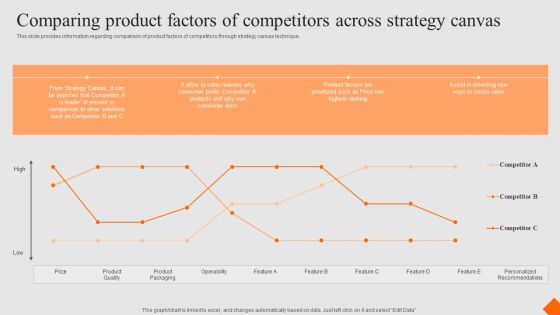
Success Strategy Development Playbook Comparing Product Factors Of Competitors Slides PDF
This slide provides information regarding comparison of product factors of competitors through strategy canvas technique. Slidegeeks is one of the best resources for PowerPoint templates. You can download easily and regulate Success Strategy Development Playbook Comparing Product Factors Of Competitors Slides PDF for your personal presentations from our wonderful collection. A few clicks is all it takes to discover and get the most relevant and appropriate templates. Use our Templates to add a unique zing and appeal to your presentation and meetings. All the slides are easy to edit and you can use them even for advertisement purposes.
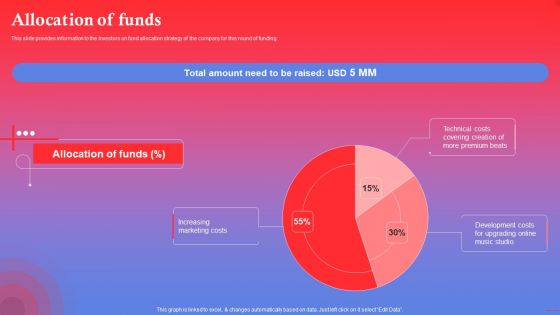
Rapping Platform Investor Funding Elevator Pitch Deck Allocation Of Funds Ideas PDF
This slide provides information to the investors on fund allocation strategy of the company for this round of funding. Slidegeeks is one of the best resources for PowerPoint templates. You can download easily and regulate Rapping Platform Investor Funding Elevator Pitch Deck Allocation Of Funds Ideas PDF for your personal presentations from our wonderful collection. A few clicks is all it takes to discover and get the most relevant and appropriate templates. Use our Templates to add a unique zing and appeal to your presentation and meetings. All the slides are easy to edit and you can use them even for advertisement purposes.
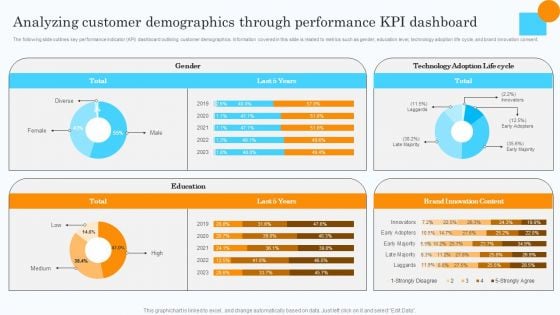
Market Research Assessment Of Target Market Requirements Analyzing Customer Demographics Clipart PDF
The following slide outlines key performance indicator KPI dashboard outlining customer demographics. Information covered in this slide is related to metrics such as gender, education level, technology adoption life cycle, and brand innovation consent. There are so many reasons you need a Market Research Assessment Of Target Market Requirements Analyzing Customer Demographics Clipart PDF. The first reason is you cannot spend time making everything from scratch, Thus, Slidegeeks has made presentation templates for you too. You can easily download these templates from our website easily.
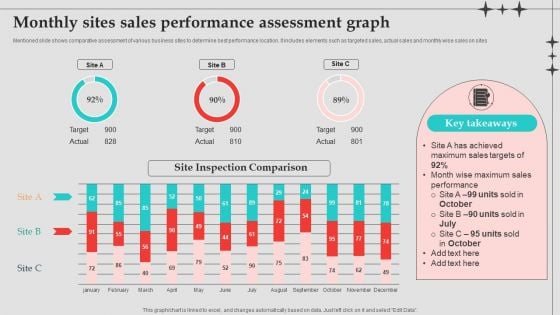
Monthly Sites Sales Performance Assessment Graph Designs PDF
Mentioned slide shows comparative assessment of various business sites to determine best performance location. It includes elements such as targeted sales, actual sales and monthly wise sales on sites. Pitch your topic with ease and precision using this Monthly Sites Sales Performance Assessment Graph Designs PDF. This layout presents information on Sales Performance, Sales Targets, Performance Assessment Graph . It is also available for immediate download and adjustment. So, changes can be made in the color, design, graphics or any other component to create a unique layout.
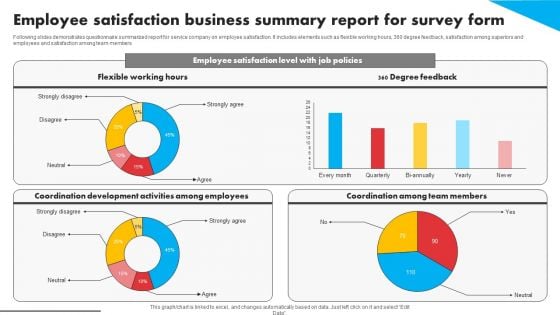
Employee Satisfaction Business Summary Report For Survey Form Survey SS
Following slides demonstrates questionnaire summarized report for service company on employee satisfaction. It includes elements such as flexible working hours, 360 degree feedback, satisfaction among superiors and employees and satisfaction among team members. Pitch your topic with ease and precision using this Employee Satisfaction Business Summary Report For Survey Form Survey SS. This layout presents information on Employee Satisfaction, Business Summary Report, Survey Form. It is also available for immediate download and adjustment. So, changes can be made in the color, design, graphics or any other component to create a unique layout.
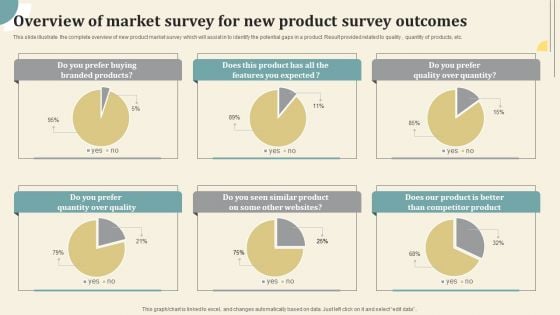
Overview Of Market Survey For New Product Survey Outcomes Survey SS
This slide illustrate the complete overview of new product market survey which will assist in to identify the potential gaps in a product. Result provided related to quality , quantity of products, etc. Pitch your topic with ease and precision using this Overview Of Market Survey For New Product Survey Outcomes Survey SS. This layout presents information on Overview Of Market Survey, Product Survey Outcomes . It is also available for immediate download and adjustment. So, changes can be made in the color, design, graphics or any other component to create a unique layout.
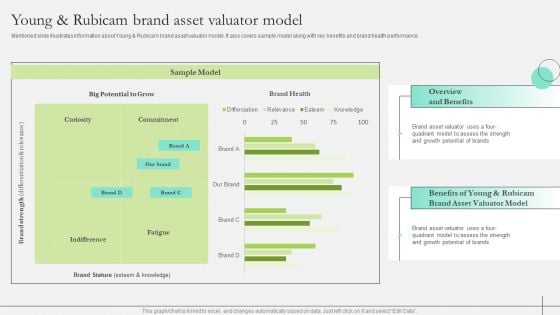
Comprehensive Guide To Strengthen Brand Equity Young And Rubicam Brand Asset Valuator Model Rules PDF
Mentioned slide illustrates information about Young and Rubicam brand asset valuator model. It also covers sample model along with key benefits and brand health performance. Want to ace your presentation in front of a live audience Our Comprehensive Guide To Strengthen Brand Equity Young And Rubicam Brand Asset Valuator Model Rules PDF can help you do that by engaging all the users towards you. Slidegeeks experts have put their efforts and expertise into creating these impeccable powerpoint presentations so that you can communicate your ideas clearly. Moreover, all the templates are customizable, and easy to edit and downloadable. Use these for both personal and commercial use.
Umbrella Branding Measures To Boost Brand Awareness Activity Tracking Dashboard Umbrella Brand Mockup PDF
This slide provides information regarding activities tracking dashboard for umbrella brand in terms of customer retention, market share, etc. Create an editable Umbrella Branding Measures To Boost Brand Awareness Activity Tracking Dashboard Umbrella Brand Mockup PDF that communicates your idea and engages your audience. Whether you are presenting a business or an educational presentation, pre designed presentation templates help save time. Umbrella Branding Measures To Boost Brand Awareness Activity Tracking Dashboard Umbrella Brand Mockup PDF is highly customizable and very easy to edit, covering many different styles from creative to business presentations. Slidegeeks has creative team members who have crafted amazing templates. So, go and get them without any delay.
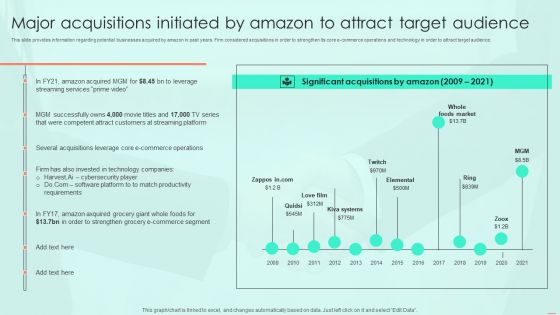
Major Acquisitions Initiated By Amazon To Attract Target Audience Infographics PDF
This slide provides information regarding potential businesses acquired by amazon in past years. Firm considered acquisitions in order to strengthen its core e commerce operations and technology in order to attract target audience. From laying roadmaps to briefing everything in detail, our templates are perfect for you. You can set the stage with your presentation slides. All you have to do is download these easy to edit and customizable templates. Major Acquisitions Initiated By Amazon To Attract Target Audience Infographics PDF will help you deliver an outstanding performance that everyone would remember and praise you for. Do download this presentation today.
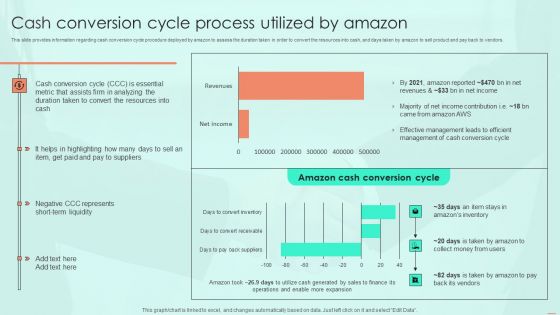
Cash Conversion Cycle Process Utilized By Amazon Ppt PowerPoint Presentation File Pictures PDF
This slide provides information regarding cash conversion cycle procedure deployed by amazon to assess the duration taken in order to convert the resources into cash, and days taken by amazon to sell product and pay back to vendors. Find a pre designed and impeccable Cash Conversion Cycle Process Utilized By Amazon Ppt PowerPoint Presentation File Pictures PDF. The templates can ace your presentation without additional effort. You can download these easy to edit presentation templates to make your presentation stand out from others. So, what are you waiting for Download the template from Slidegeeks today and give a unique touch to your presentation.
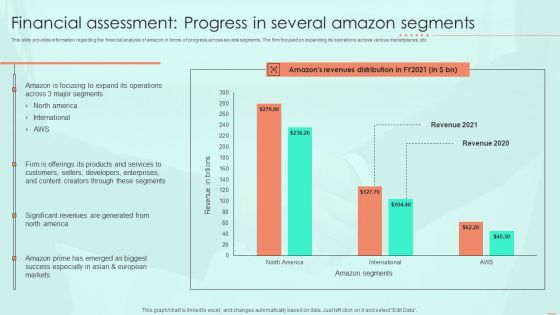
Financial Assessment Progress In Several Amazon Segments Ppt PowerPoint Presentation File Background Images PDF
This slide provides information regarding the financial analysis of amazon in terms of progress across several segments. The firm focused on expanding its operations across various marketplaces, etc. Want to ace your presentation in front of a live audience Our Financial Assessment Progress In Several Amazon Segments Ppt PowerPoint Presentation File Background Images PDF can help you do that by engaging all the users towards you.. Slidegeeks experts have put their efforts and expertise into creating these impeccable powerpoint presentations so that you can communicate your ideas clearly. Moreover, all the templates are customizable, and easy to edit and downloadable. Use these for both personal and commercial use.
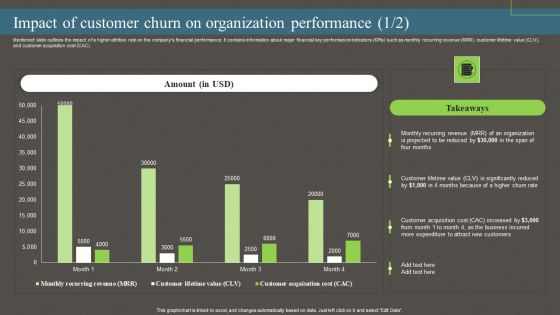
Impact Of Customer Churn On Organization Performance Ppt PowerPoint Presentation File Pictures PDF
Mentioned slide outlines the impact of a higher attrition rate on the companys financial performance. It contains information about major financial key performance indicators KPIs such as monthly recurring revenue MRR, customer lifetime value CLV, and customer acquisition cost CAC. The best PPT templates are a great way to save time, energy, and resources. Slidegeeks have 100 percent editable powerpoint slides making them incredibly versatile. With these quality presentation templates, you can create a captivating and memorable presentation by combining visually appealing slides and effectively communicating your message. Download Impact Of Customer Churn On Organization Performance Ppt PowerPoint Presentation File Pictures PDF from Slidegeeks and deliver a wonderful presentation.
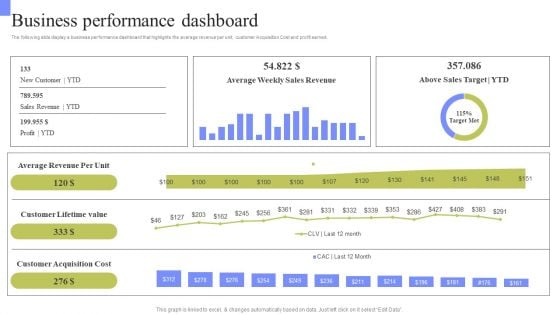
Periodic Revenue Model Business Performance Dashboard Rules PDF
The following slide display a business performance dashboard that highlights the average revenue per unit, customer Acquisition Cost and profit earned. This Periodic Revenue Model Business Performance Dashboard Rules PDF from Slidegeeks makes it easy to present information on your topic with precision. It provides customization options, so you can make changes to the colors, design, graphics, or any other component to create a unique layout. It is also available for immediate download, so you can begin using it right away. Slidegeeks has done good research to ensure that you have everything you need to make your presentation stand out. Make a name out there for a brilliant performance.
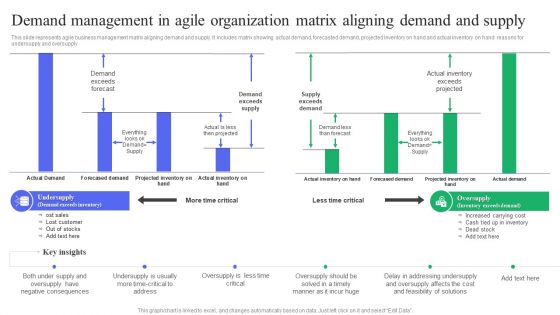
Demand Management In Agile Organization Matrix Aligning Demand And Supply Microsoft PDF
This slide represents agile business management matrix aligning demand and supply. It includes matrix showing actual demand, forecasted demand, projected inventory on hand and actual inventory on hand reasons for undersupply and oversupply Pitch your topic with ease and precision using this Demand Management In Agile Organization Matrix Aligning Demand And Supply Microsoft PDF. This layout presents information on Demand Exceeds Forecast, Demand Exceeds Supply, Supply Exceeds Demand. It is also available for immediate download and adjustment. So, changes can be made in the color, design, graphics or any other component to create a unique layout.
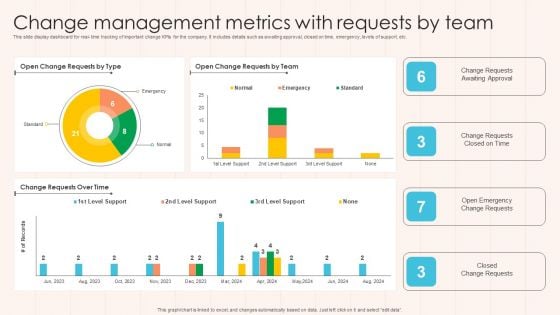
Change Management Metrics With Requests By Team Designs PDF
This slide display dashboard for real- time tracking of important change KPIs for the company. It includes details such as awaiting approval, closed on time, emergency, levels of support, etc. Pitch your topic with ease and precision using this Change Management Metrics With Requests By Team Designs PDF This layout presents information on Change Requests, Approval, Team. It is also available for immediate download and adjustment. So, changes can be made in the color, design, graphics or any other component to create a unique layout.
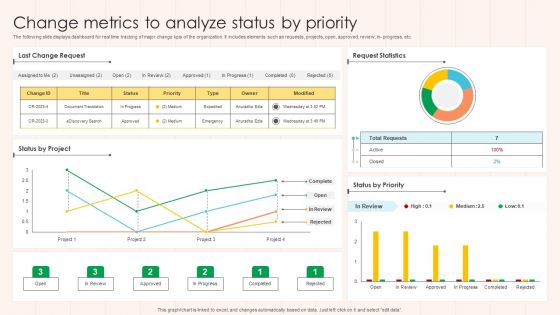
Change Metrics To Analyze Status By Priority Formats PDF
The following slide displays dashboard for real time tracking of major change kpis of the organization. It includes elements such as requests, projects, open, approved, review, in- progress, etc. Pitch your topic with ease and precision using this Change Metrics To Analyze Status By Priority Formats PDF This layout presents information on Project, Request Statistics, Priority. It is also available for immediate download and adjustment. So, changes can be made in the color, design, graphics or any other component to create a unique layout.
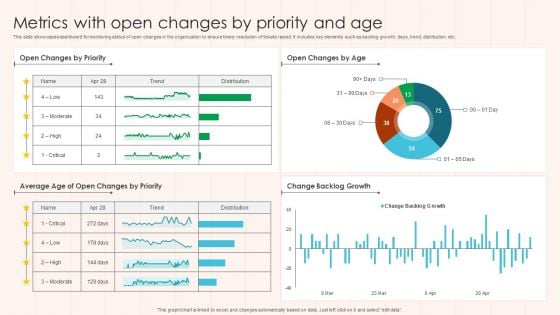
Metrics With Open Changes By Priority And Age Guidelines PDF
This slide showcases dashboard for monitoring status of open changes in the organization to ensure timely resolution of tickets raised. It includes key elements such as backlog growth, days, trend, distribution, etc. Pitch your topic with ease and precision using this Metrics With Open Changes By Priority And Age Guidelines PDF This layout presents information on Change Backlog Growth, Priority, Age. It is also available for immediate download and adjustment. So, changes can be made in the color, design, graphics or any other component to create a unique layout.
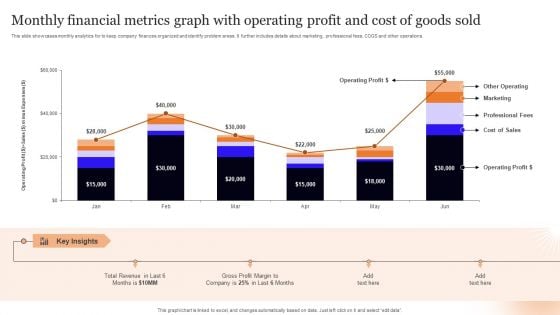
Monthly Financial Metrics Graph With Operating Profit And Cost Of Goods Sold Pictures PDF
This slide showcases monthly analytics for to keep company finances organized and identify problem areas. It further includes details about marketing, professional fees, COGS and other operations. Pitch your topic with ease and precision using this Monthly Financial Metrics Graph With Operating Profit And Cost Of Goods Sold Pictures PDF. This layout presents information on Key Insights, Operating Profit, Total Revenue. It is also available for immediate download and adjustment. So, changes can be made in the color, design, graphics or any other component to create a unique layout.
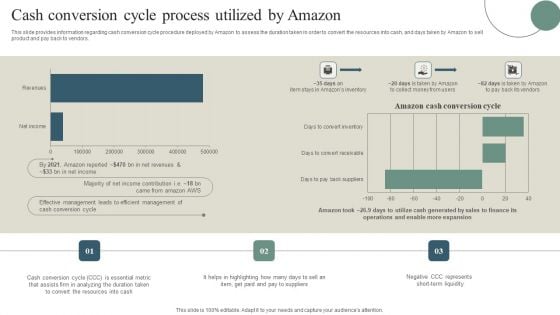
Cash Conversion Cycle Process Utilized By Amazon Pictures PDF
This slide provides information regarding cash conversion cycle procedure deployed by Amazon to assess the duration taken in order to convert the resources into cash, and days taken by Amazon to sell product and pay back to vendors. Want to ace your presentation in front of a live audience Our Cash Conversion Cycle Process Utilized By Amazon Pictures PDF can help you do that by engaging all the users towards you.. Slidegeeks experts have put their efforts and expertise into creating these impeccable powerpoint presentations so that you can communicate your ideas clearly. Moreover, all the templates are customizable, and easy-to-edit and downloadable. Use these for both personal and commercial use.
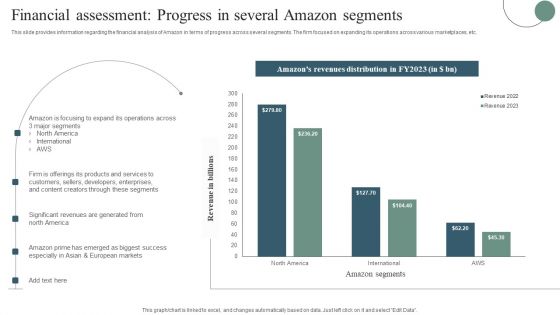
Financial Assessment Progress In Several Amazon Segments Mockup PDF
This slide provides information regarding the financial analysis of Amazon in terms of progress across several segments. The firm focused on expanding its operations across various marketplaces, etc. Get a simple yet stunning designed Financial Assessment Progress In Several Amazon Segments Mockup PDF. It is the best one to establish the tone in your meetings. It is an excellent way to make your presentations highly effective. So, download this PPT today from Slidegeeks and see the positive impacts. Our easy-to-edit Financial Assessment Progress In Several Amazon Segments Mockup PDF can be your go-to option for all upcoming conferences and meetings. So, what are you waiting for Grab this template today.
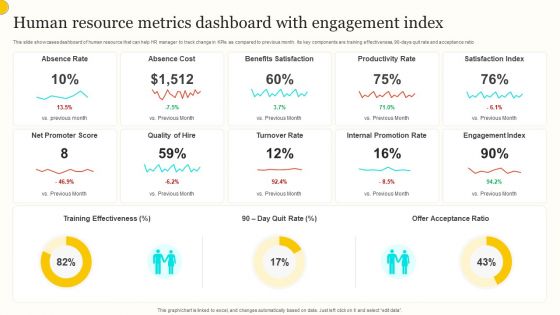
Human Resource Metrics Dashboard With Engagement Index Guidelines PDF
This slide showcases dashboard of human resource that can help HR manager to track change in KPIs as compared to previous month. Its key components are training effectiveness, 90 days quit rate and acceptance ratio. Pitch your topic with ease and precision using this Human Resource Metrics Dashboard With Engagement Index Guidelines PDF. This layout presents information on Absence Rate, Absence Cost, Benefits Satisfaction. It is also available for immediate download and adjustment. So, changes can be made in the color, design, graphics or any other component to create a unique layout.
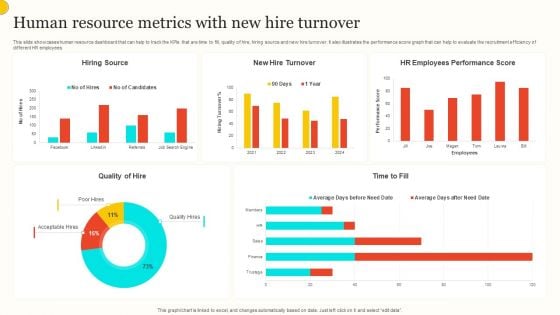
Human Resource Metrics With New Hire Turnover Professional PDF
This slide showcases human resource dashboard that can help to track the KPIs that are time to fill, quality of hire, hiring source and new hire turnover. It also illustrates the performance score graph that can help to evaluate the recruitment efficiency of different HR employees. Pitch your topic with ease and precision using this Human Resource Metrics With New Hire Turnover Professional PDF. This layout presents information on Hiring Source, New Hire Turnover, Hr Employees Performance Score. It is also available for immediate download and adjustment. So, changes can be made in the color, design, graphics or any other component to create a unique layout.

Hotel Administration Software Dashboard For Business Intelligence Infographics PDF
This slide covers HMS dashboard. The purpose of this dashboard is to get an overview of hotel key metrics and to check financial status against targets. It includes elements such as reservations, check in guests, reservation type and housekeeping. Pitch your topic with ease and precision using this Hotel Administration Software Dashboard For Business Intelligence Infographics PDF. This layout presents information on Guest, Housekeeping, Reservation Type. It is also available for immediate download and adjustment. So, changes can be made in the color, design, graphics or any other component to create a unique layout.
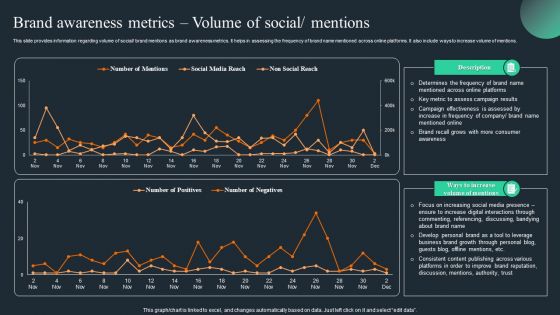
Brand Recognition Overview Brand Awareness Metrics Volume Of Social Mentions Demonstration PDF
This slide provides information regarding volume of social or brand mentions as brand awareness metrics. It helps in assessing the frequency of brand name mentioned across online platforms. It also include ways to increase volume of mentions. Want to ace your presentation in front of a live audience Our Brand Recognition Overview Brand Awareness Metrics Volume Of Social Mentions Demonstration PDF can help you do that by engaging all the users towards you.. Slidegeeks experts have put their efforts and expertise into creating these impeccable powerpoint presentations so that you can communicate your ideas clearly. Moreover, all the templates are customizable, and easy-to-edit and downloadable. Use these for both personal and commercial use.


 Continue with Email

 Home
Home


