Content Plan
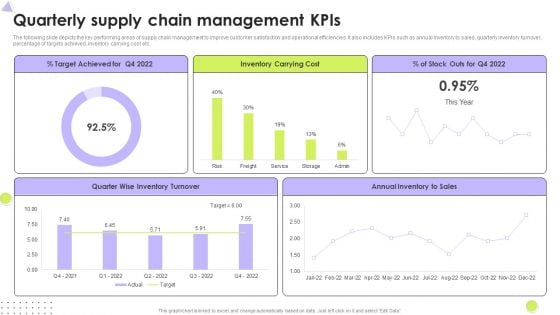
Quarterly Supply Chain Management Kpis Mockup PDF
The following slide depicts the key performing areas of supply chain management to improve customer satisfaction and operational efficiencies. It also includes KPIs such as annual inventory to sales, quarterly inventory turnover, percentage of targets achieved, inventory carrying cost etc. Pitch your topic with ease and precision using this Quarterly Supply Chain Management Kpis Mockup PDF. This layout presents information on Inventory Turnover, Inventory Carrying Cost, Target Achieved. It is also available for immediate download and adjustment. So, changes can be made in the color, design, graphics or any other component to create a unique layout.
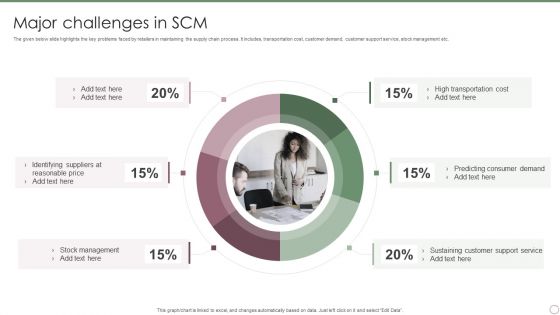
Major Challenges In SCM Ppt PowerPoint Presentation Gallery Pictures PDF
The given below slide highlights the key problems faced by retailers in maintaining the supply chain process. It includes, transportation cost, customer demand, customer support service, stock management etc. Pitch your topic with ease and precision using this Major Challenges In SCM Ppt PowerPoint Presentation Gallery Pictures PDF. This layout presents information on High Transportation Cost, Predicting Consumer Demand, Sustaining Customer, Support Service. It is also available for immediate download and adjustment. So, changes can be made in the color, design, graphics or any other component to create a unique layout.
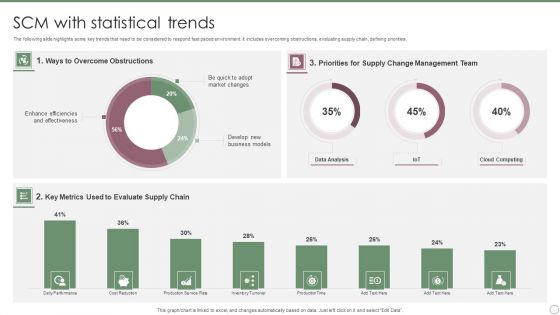
SCM With Statistical Trends Ppt PowerPoint Presentation Gallery Examples PDF
The following slide highlights some key trends that need to be considered to respond fast paced environment. It includes overcoming obstructions, evaluating supply chain, defining priorities. Pitch your topic with ease and precision using this SCM With Statistical Trends Ppt PowerPoint Presentation Gallery Examples PDF. This layout presents information on Ways To Overcome, Obstructions, Key Metrics, Evaluate Supply Chain. It is also available for immediate download and adjustment. So, changes can be made in the color, design, graphics or any other component to create a unique layout.

Critical Statistics Of Blockchain And Distributed Ledger Technology Market Structure PDF
Mentioned slide highlights various insights of blockchain technology market. This slide shows key statistics about blockchain market outlook, blockchain spenders worldwide and by country. Organization can decide if embracing the technology is the right move for company using these statistics. Pitch your topic with ease and precision using this Critical Statistics Of Blockchain And Distributed Ledger Technology Market Structure PDF. This layout presents information on USA Contribution, Projected Blockchain, Market Value. It is also available for immediate download and adjustment. So, changes can be made in the color, design, graphics or any other component to create a unique layout.
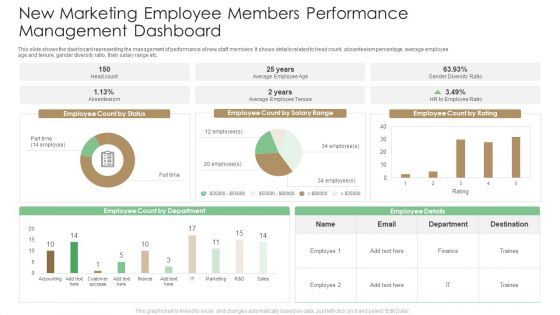
New Marketing Employee Members Performance Management Dashboard Summary PDF
This slide shows the dashboard representing the management of performance of new staff members. It shows details related to head count, absenteeism percentage, average employee age and tenure, gender diversity ratio, their salary range etc. Pitch your topic with ease and precision using this New Marketing Employee Members Performance Management Dashboard Summary PDF. This layout presents information on Employee Ratio, Average Employee Tenure. It is also available for immediate download and adjustment. So, changes can be made in the color, design, graphics or any other component to create a unique layout.
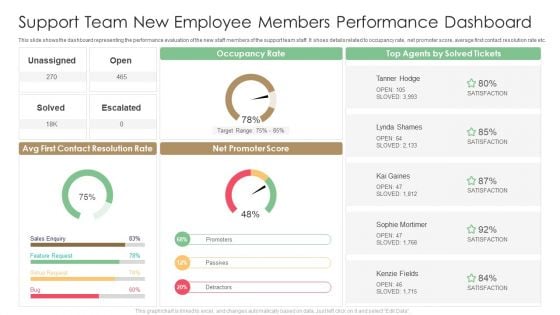
Support Team New Employee Members Performance Dashboard Designs PDF
This slide shows the dashboard representing the performance evaluation of the new staff members of the support team staff. It shoes details related to occupancy rate, net promoter score, average first contact resolution rate etc. Pitch your topic with ease and precision using this Support Team New Employee Members Performance Dashboard Designs PDF. This layout presents information on Target Range, Occupancy Rate, Contact Resolution Rate. It is also available for immediate download and adjustment. So, changes can be made in the color, design, graphics or any other component to create a unique layout.
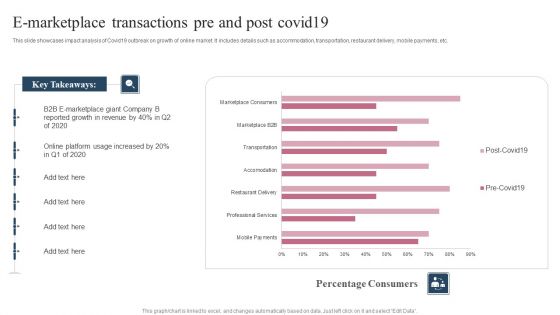
E Marketplace Transactions Pre And Post Covid19 Ppt Pictures Files PDF
This slide showcases impact analysis of Covid19 outbreak on growth of online market. It includes details such as accommodation, transportation, restaurant delivery, mobile payments, etc. Pitch your topic with ease and precision using this E Marketplace Transactions Pre And Post Covid19 Ppt Pictures Files PDF. This layout presents information on Key Takeaways, B2B E Marketplace, Online Platform. It is also available for immediate download and adjustment. So, changes can be made in the color, design, graphics or any other component to create a unique layout.
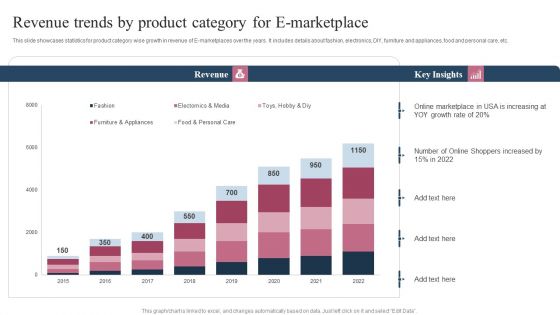
Revenue Trends By Product Category For E Marketplace Ppt Pictures Slide Portrait PDF
This slide showcases statistics for product category wise growth in revenue of E-marketplaces over the years. It includes details about fashion, electronics, DIY, furniture and appliances, food and personal care, etc. Pitch your topic with ease and precision using this Revenue Trends By Product Category For E Marketplace Ppt Pictures Slide Portrait PDF. This layout presents information on Revenue, Online Marketplace, Number Online, Shoppers Increased, 2015 To 2022. It is also available for immediate download and adjustment. So, changes can be made in the color, design, graphics or any other component to create a unique layout.
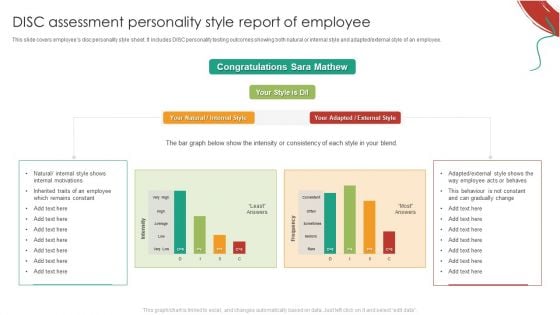
DISC Assessment Personality Style Report Of Employee Sample PDF
This slide covers employees disc personality style sheet. It includes DISC personality testing outcomes showing both natural or internal style and adapted or external style of an employee. Pitch your topic with ease and precision using this DISC Assessment Personality Style Report Of Employee Sample PDF. This layout presents information on Congratulations Sara Mathew, Internal Motivations, Remains Constant. It is also available for immediate download and adjustment. So, changes can be made in the color, design, graphics or any other component to create a unique layout.
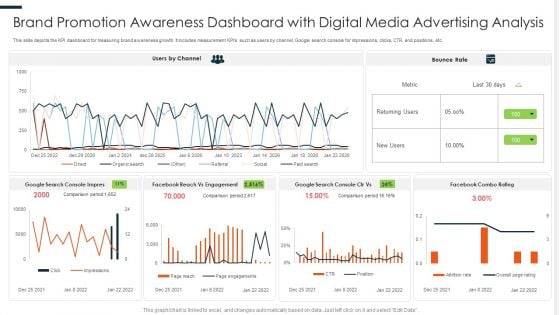
Brand Promotion Awareness Dashboard With Digital Media Advertising Analysis Ppt PowerPoint Presentation Design Ideas PDF
This slide depicts the KPI dashboard for measuring brand awareness growth. It includes measurement KPIs such as users by channel, Google search console for impressions, clicks, CTR, and positions, etc. Pitch your topic with ease and precision using this Brand Promotion Awareness Dashboard With Digital Media Advertising Analysis Ppt PowerPoint Presentation Design Ideas PDF. This layout presents information on Console Impress, Reach Engagement, Combo Rating. It is also available for immediate download and adjustment. So, changes can be made in the color, design, graphics or any other component to create a unique layout.
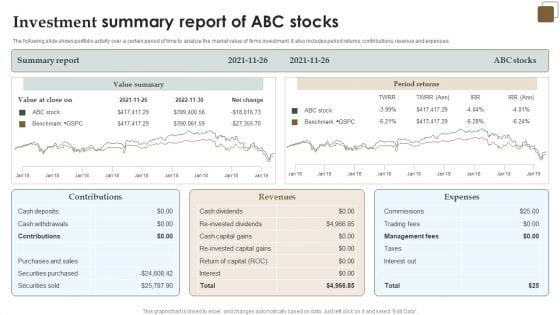
Investment Summary Report Of ABC Stocks Introduction PDF
The following slide shows portfolio activity over a certain period of time to analyze the market value of firms investment. It also includes period returns, contributions, revenue and expenses. Pitch your topic with ease and precision using this Investment Summary Report Of ABC Stocks Introduction PDF. This layout presents information on Summary Report, Value Summary, Revenues, Expenses. It is also available for immediate download and adjustment. So, changes can be made in the color, design, graphics or any other component to create a unique layout.
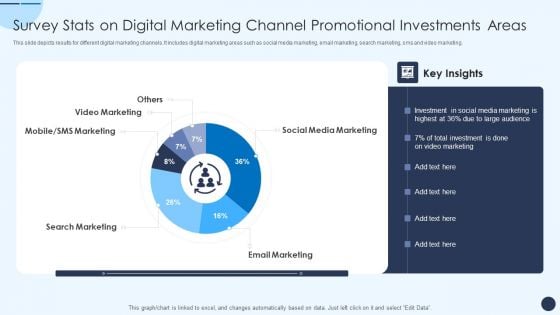
Survey Stats On Digital Marketing Channel Promotional Investments Areas Brochure PDF
This slide depicts results for different digital marketing channels. It includes digital marketing areas such as social media marketing, email marketing, search marketing, sms and video marketing.Pitch your topic with ease and precision using this Survey Stats On Digital Marketing Channel Promotional Investments Areas Brochure PDF. This layout presents information on Video Marketing, Media Marketing, Search Marketing. It is also available for immediate download and adjustment. So, changes can be made in the color, design, graphics or any other component to create a unique layout.
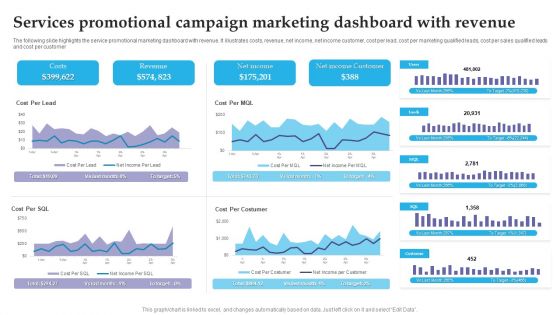
Services Promotional Campaign Marketing Dashboard With Revenue Brochure PDF
The following slide highlights the service promotional marketing dashboard with revenue. It illustrates costs, revenue, net income, net income customer, cost per lead, cost per marketing qualified leads, cost per sales qualified leads and cost per customer. Pitch your topic with ease and precision using this Services Promotional Campaign Marketing Dashboard With Revenue Brochure PDF. This layout presents information on Costs, Revenue, Net Income. It is also available for immediate download and adjustment. So, changes can be made in the color, design, graphics or any other component to create a unique layout.
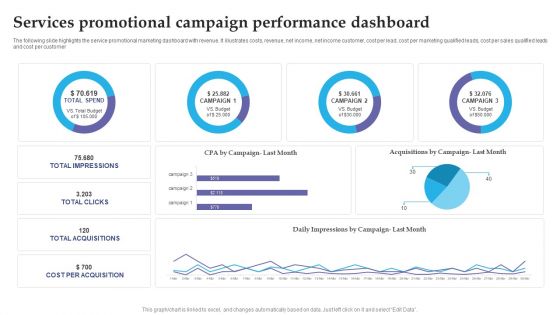
Services Promotional Campaign Performance Dashboard Slides PDF
The following slide highlights the service promotional marketing dashboard with revenue. It illustrates costs, revenue, net income, net income customer, cost per lead, cost per marketing qualified leads, cost per sales qualified leads and cost per customer. Pitch your topic with ease and precision using this Services Promotional Campaign Performance Dashboard Slides PDF. This layout presents information on Services Promotional, Campaign Performance Dashboard. It is also available for immediate download and adjustment. So, changes can be made in the color, design, graphics or any other component to create a unique layout.
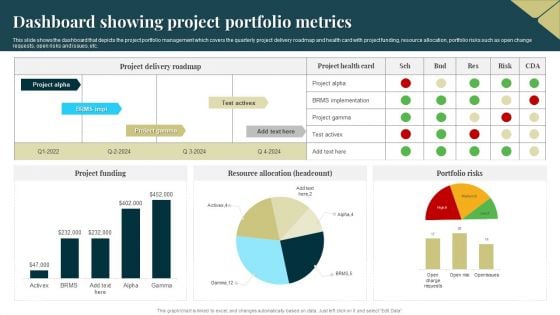
Dashboard Showing Project Portfolio Metrics Microsoft PDF
This slide shows the dashboard that depicts the project portfolio management which covers the quarterly project delivery roadmap and health card with project funding, resource allocation, portfolio risks such as open change requests, open risks and issues, etc. Pitch your topic with ease and precision using this Dashboard Showing Project Portfolio Metrics Microsoft PDF. This layout presents information on Resource Allocation, Portfolio Risks, Project Funding. It is also available for immediate download and adjustment. So, changes can be made in the color, design, graphics or any other component to create a unique layout.
Project Metrics Dashboard Depicting Tracking System Inspiration PDF
This slide focuses on project management dashboard which covers the four spirit teams, iteration defects by priority with quarterly roadmap with legends such as high attention, low, none, normal and resolved immediately with time in iteration, etc. Pitch your topic with ease and precision using this Project Metrics Dashboard Depicting Tracking System Inspiration PDF. This layout presents information on Project Metrics, Dashboard Depicting, Tracking System. It is also available for immediate download and adjustment. So, changes can be made in the color, design, graphics or any other component to create a unique layout.
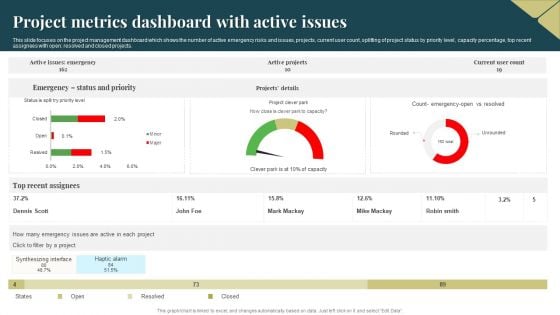
Project Metrics Dashboard With Active Issues Topics PDF
This slide focuses on the project management dashboard which shows the number of active emergency risks and issues, projects, current user count, splitting of project status by priority level, capacity percentage, top recent assignees with open, resolved and closed projects. Pitch your topic with ease and precision using this Project Metrics Dashboard With Active Issues Topics PDF. This layout presents information on Project Metrics, Dashboard With Active Issues. It is also available for immediate download and adjustment. So, changes can be made in the color, design, graphics or any other component to create a unique layout.
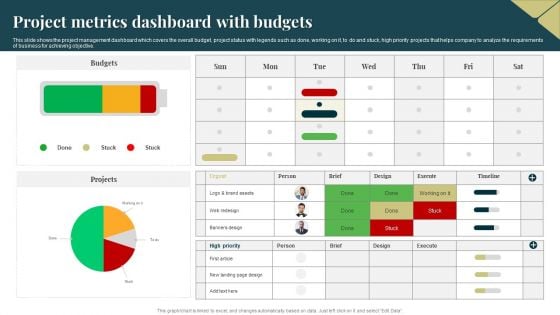
Project Metrics Dashboard With Budgets Topics PDF
This slide shows the project management dashboard which covers the overall budget, project status with legends such as done, working on it, to do and stuck, high priority projects that helps company to analyze the requirements of business for achieving objective. Pitch your topic with ease and precision using this Project Metrics Dashboard With Budgets Topics PDF. This layout presents information on Budgets, Projects, Banners Design. It is also available for immediate download and adjustment. So, changes can be made in the color, design, graphics or any other component to create a unique layout.
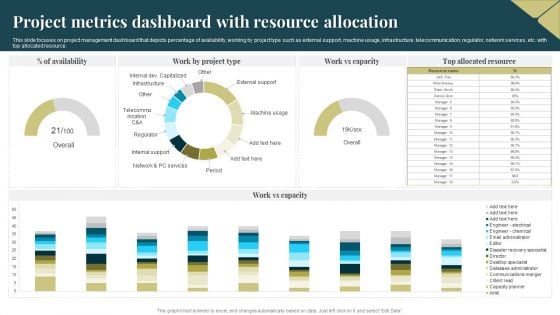
Project Metrics Dashboard With Resource Allocation Portrait PDF
This slide focuses on project management dashboard that depicts percentage of availability, working by project type such as external support, machine usage, infrastructure, telecommunication, regulator, network services, etc. with top allocated resource. Pitch your topic with ease and precision using this Project Metrics Dashboard With Resource Allocation Portrait PDF. This layout presents information on Project Metrics Dashboard, Resource Allocation. It is also available for immediate download and adjustment. So, changes can be made in the color, design, graphics or any other component to create a unique layout.
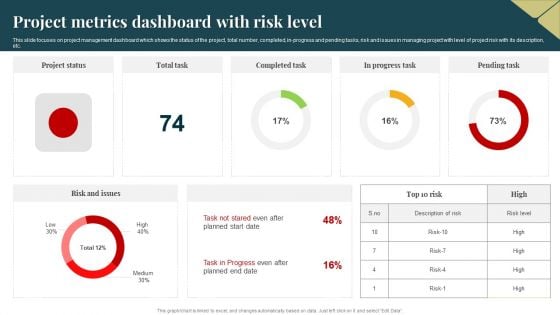
Project Metrics Dashboard With Risk Level Guidelines PDF
This slide focuses on project management dashboard which shows the status of the project, total number, completed, in progress and pending tasks, risk and issues in managing project with level of project risk with its description, etc. Pitch your topic with ease and precision using this Project Metrics Dashboard With Risk Level Guidelines PDF. This layout presents information on Project Metrics Dashboard, Risk Level. It is also available for immediate download and adjustment. So, changes can be made in the color, design, graphics or any other component to create a unique layout.

Project Metrics Dashboard With Task Status Rules PDF
This slide shows the project management dashboard which shows the number of team members of managing project activities, estimated and actual time to complete the project task, hours taken by employees with achieved and open milestones and progress status. Pitch your topic with ease and precision using this Project Metrics Dashboard With Task Status Rules PDF. This layout presents information on Team Members, Employee. It is also available for immediate download and adjustment. So, changes can be made in the color, design, graphics or any other component to create a unique layout.
Dashboard Tracking Essential Kpis For Ecommerce Performance Slides PDF
This slide provides information regarding essential KPIs for ecommerce performance dashboard tracking average bounce rate, new vs. old customers, channel revenue vs. channel acquisitions costs, channel revenue vs. sales, average conversion rate, etc. Deliver an awe inspiring pitch with this creative Dashboard Tracking Essential Kpis For Ecommerce Performance Slides PDF bundle. Topics like Average Bounce Rate, Channel Acquisition Costs, Channel Revenue can be discussed with this completely editable template. It is available for immediate download depending on the needs and requirements of the user.
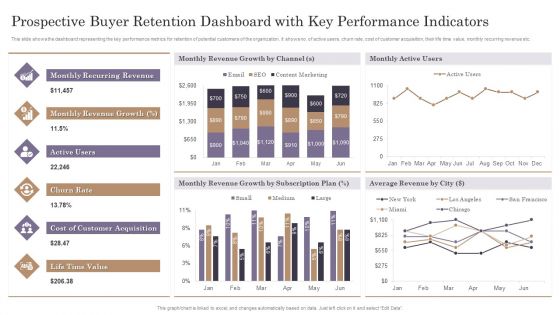
Prospective Buyer Retention Dashboard With Key Performance Indicators Themes PDF
This slide shows the dashboard representing the key performance metrics for retention of potential customers of the organization. It shows no. of active users, churn rate, cost of customer acquisition, their life time value, monthly recurring revenue etc.Pitch your topic with ease and precision using this Prospective Buyer Retention Dashboard With Key Performance Indicators Themes PDF. This layout presents information on Recurring Revenue, Revenue Growth, Customer Acquisition. It is also available for immediate download and adjustment. So, changes can be made in the color, design, graphics or any other component to create a unique layout.
Weekly Customer Grievance Tracking Dashboard Designs PDF
This slide showcases dashboard that can help organization to identify the open and overdue status of customer grievance . It can guide managers to resolve the complaints and issues within stipulated time for customer satisfaction. Pitch your topic with ease and precision using this Weekly Customer Grievance Tracking Dashboard Designs PDF. This layout presents information on Average, Traffic Analysis, Customer Satisfaction Ratings. It is also available for immediate download and adjustment. So, changes can be made in the color, design, graphics or any other component to create a unique layout.
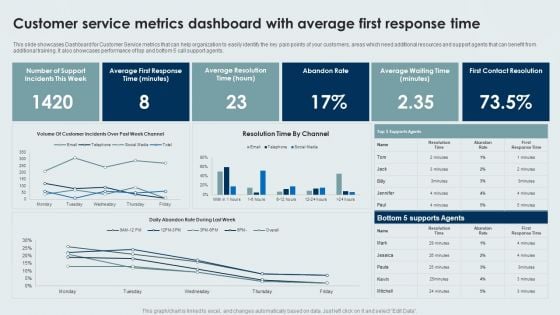
Customer Service Metrics Dashboard With Average First Response Time Background PDF
This slide showcases Dashboard for Customer Service metrics that can help organization to easily identify the key pain points of your customers, areas which need additional resources and support agents that can benefit from additional training. It also showcases performance of top and bottom 5 call support agents. Pitch your topic with ease and precision using this Customer Service Metrics Dashboard With Average First Response Time Background PDF. This layout presents information on Average, Abandon Rate, Contact Resolution. It is also available for immediate download and adjustment. So, changes can be made in the color, design, graphics or any other component to create a unique layout.
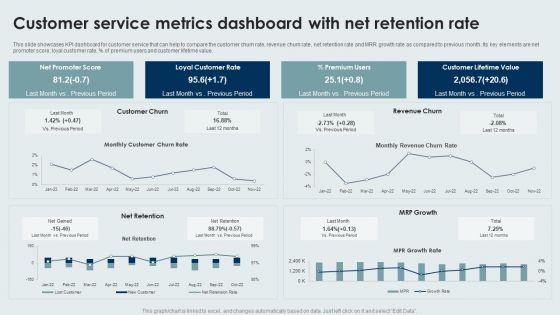
Customer Service Metrics Dashboard With Net Retention Rate Sample PDF
This slide showcases KPI dashboard for customer service that can help to compare the customer churn rate, revenue churn rate, net retention rate and MRR growth rate as compared to previous month. Its key elements are net promoter score, loyal customer rate, percentage of premium users and customer lifetime value. Pitch your topic with ease and precision using this Customer Service Metrics Dashboard With Net Retention Rate Sample PDF. This layout presents information on Loyal Customer Rate, Premium Users, Customer Lifetime Value. It is also available for immediate download and adjustment. So, changes can be made in the color, design, graphics or any other component to create a unique layout.
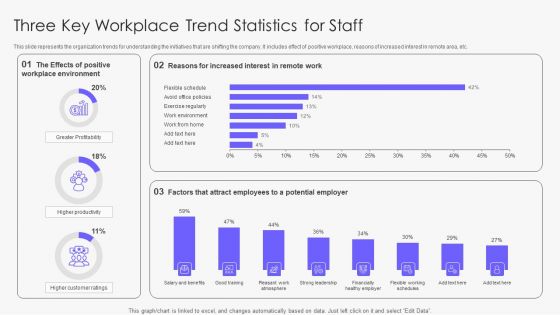
Three Key Workplace Trend Statistics For Staff Slides PDF
This slide represents the organization trends for understanding the initiatives that are shifting the company. It includes effect of positive workplace, reasons of increased interest in remote area, etc. Pitch your topic with ease and precision using this Three Key Workplace Trend Statistics For Staff Slides PDF. This layout presents information on Workplace Environment, Greater Profitability, Customer. It is also available for immediate download and adjustment. So, changes can be made in the color, design, graphics or any other component to create a unique layout.
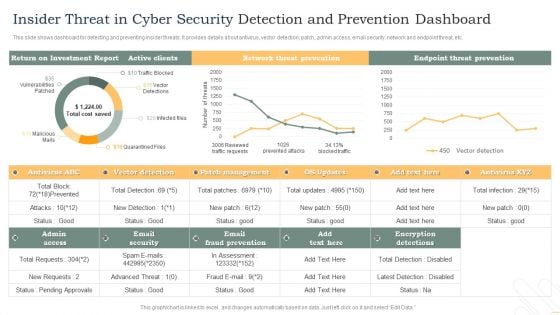
Insider Threat In Cyber Security Detection And Prevention Dashboard Diagrams PDF
This slide shows dashboard for detecting and preventing insider threats. It provides details about antivirus, vector detection, patch, admin access, email security, network and endpoint threat, etc. Pitch your topic with ease and precision using this Insider Threat In Cyber Security Detection And Prevention Dashboard Diagrams PDF. This layout presents information on Active Clients, Network Threat Prevention, Endpoint Threat Prevention. It is also available for immediate download and adjustment. So, changes can be made in the color, design, graphics or any other component to create a unique layout.
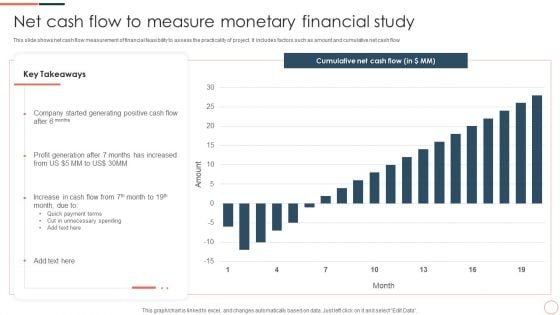
Net Cash Flow To Measure Monetary Financial Study Ppt Layouts Clipart Images PDF
This slide shows net cash flow measurement of financial feasibility to assess the practicality of project. It includes factors such as amount and cumulative net cash flow. Pitch your topic with ease and precision using this Net Cash Flow To Measure Monetary Financial Study Ppt Layouts Clipart Images PDF. This layout presents information on Cash Flow, Profit Generation, Quick Payment Terms. It is also available for immediate download and adjustment. So, changes can be made in the color, design, graphics or any other component to create a unique layout.
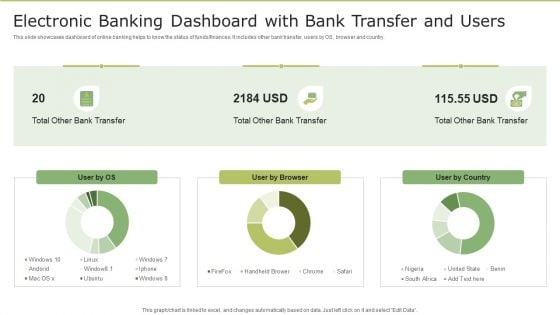
Electronic Banking Dashboard With Bank Transfer And Users Background PDF
This slide showcases dashboard of online banking helps to know the status of funds or finances. It includes other bank transfer, users by OS, browser and country. Pitch your topic with ease and precision using this Electronic Banking Dashboard With Bank Transfer And Users Background PDF. This layout presents information on Electronic Banking Dashboard, Bank Transfer And Users. It is also available for immediate download and adjustment. So, changes can be made in the color, design, graphics or any other component to create a unique layout.
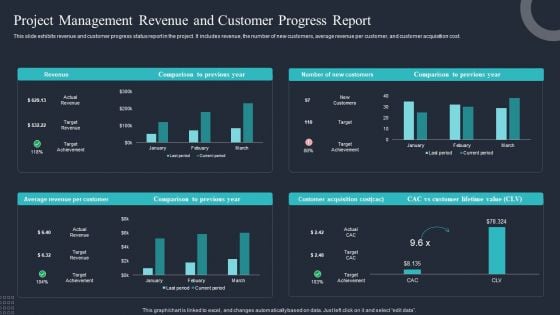
Project Management Revenue And Customer Progress Report Clipart PDF
This slide exhibits revenue and customer progress status report in the project. It includes revenue, the number of new customers, average revenue per customer, and customer acquisition cost. Pitch your topic with ease and precision using this Project Management Revenue And Customer Progress Report Clipart PDF. This layout presents information on Customer Acquisition Cost, Average Revenue, Per Customer. It is also available for immediate download and adjustment. So, changes can be made in the color, design, graphics or any other component to create a unique layout.
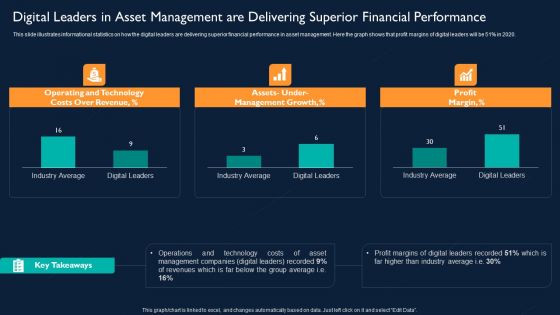
Digital Leaders In Asset Management Are Delivering Superior Financial Performance Designs PDF
This slide illustrates informational statistics on how the digital leaders are delivering superior financial performance in asset management. Here the graph shows that profit margins of digital leaders will be 51 percentage in 2020. Deliver and pitch your topic in the best possible manner with this Digital Leaders In Asset Management Are Delivering Superior Financial Performance Designs PDF. Use them to share invaluable insights on Operating And Technology Costs, Management Growth, Profit Margin and impress your audience. This template can be altered and modified as per your expectations. So, grab it now.
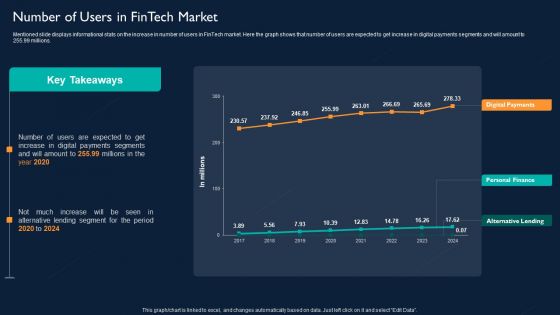
Technology Investment To Enhance Business Growth Number Of Users In Fintech Market Diagrams PDF
Mentioned slide displays informational stats on the increase in number of users in FinTech market. Here the graph shows that number of users are expected to get increase in digital payments segments and will amount to 255.99 millions. Deliver and pitch your topic in the best possible manner with this Technology Investment To Enhance Business Growth Number Of Users In Fintech Market Diagrams PDF. Use them to share invaluable insights on Alternative Lending, Personal Finance, Digital Payments and impress your audience. This template can be altered and modified as per your expectations. So, grab it now.
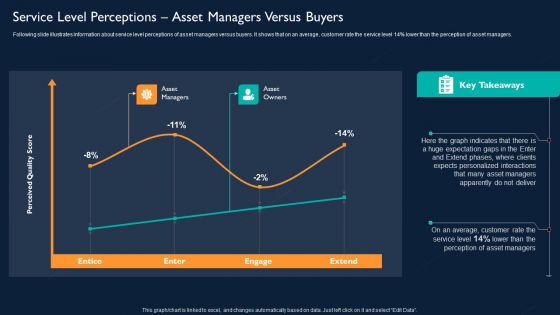
Technology Investment To Enhance Business Growth Service Level Perceptions Asset Managers Versus Buyers Topics PDF
Following slide illustrates information about service level perceptions of asset managers versus buyers. It shows that on an average, customer rate the service level 14 percentage lower than the perception of asset managers. Deliver and pitch your topic in the best possible manner with this Technology Investment To Enhance Business Growth Service Level Perceptions Asset Managers Versus Buyers Topics PDF. Use them to share invaluable insights on Service Level Perceptions, Asset Managers Versus Buyers and impress your audience. This template can be altered and modified as per your expectations. So, grab it now.
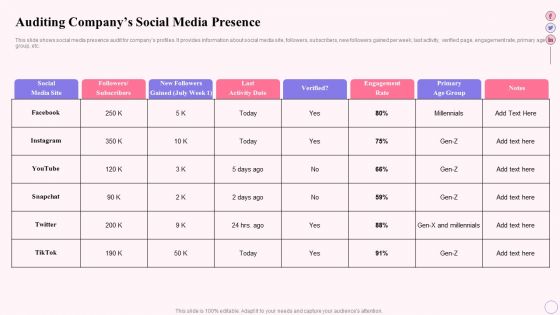
Integrating Social Media Tactics Auditing Companys Social Media Presence Clipart PDF
This slide shows social media presence audit for companys profiles. It provides information about social media site, followers, subscribers, new followers gained per week, last activity, verified page, engagement rate, primary age group, etc. Deliver and pitch your topic in the best possible manner with this Integrating Social Media Tactics Auditing Companys Social Media Presence Clipart PDF. Use them to share invaluable insights on Social Media Site, Facebook, Instagram and impress your audience. This template can be altered and modified as per your expectations. So, grab it now.
Tracking Channel Campaign Metrics To Measure Web Traffic Sample PDF
This slide covers measuring campaign key performance indicators through tracking channel web traffic which includes total visit, cost per click, engagement rate and total impressions. Pitch your topic with ease and precision using this Tracking Channel Campaign Metrics To Measure Web Traffic Sample PDF. This layout presents information on Revenue By Channel, Website Demographics, Product Sales Trend. It is also available for immediate download and adjustment. So, changes can be made in the color, design, graphics or any other component to create a unique layout.
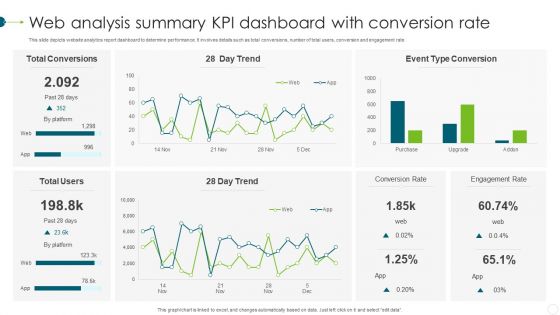
Web Analysis Summary KPI Dashboard With Conversion Rate Themes PDF
This slide depicts website analytics report dashboard to determine performance. It involves details such as total conversions, number of total users, conversion and engagement rate. Pitch your topic with ease and precision using this Web Analysis Summary KPI Dashboard With Conversion Rate Themes PDF. This layout presents information on Web Analysis Summary, KPI Dashboard, Conversion Rate. It is also available for immediate download and adjustment. So, changes can be made in the color, design, graphics or any other component to create a unique layout.
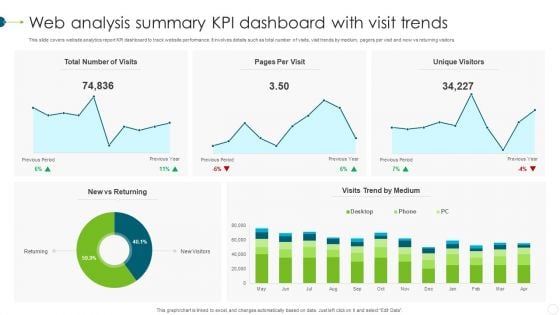
Web Analysis Summary KPI Dashboard With Visit Trends Professional PDF
This slide covers website analytics report KPI dashboard to track website performance. It involves details such as total number of visits, visit trends by medium, pagers per visit and new vs returning visitors. Pitch your topic with ease and precision using this Web Analysis Summary KPI Dashboard With Visit Trends Professional PDF. This layout presents information on Web Analysis Summary, KPI Dashboard, Visit Trends. It is also available for immediate download and adjustment. So, changes can be made in the color, design, graphics or any other component to create a unique layout.

Consulting Project Status Report Dashboard With Workspaces Diagrams PDF
The following slide showcases dashboard to provide an insight of active projects, their status and areas that require attention and improvement. Status included are on track, at risk and late Pitch your topic with ease and precision using this Consulting Project Status Report Dashboard With Workspaces Diagrams PDF. This layout presents information on Consulting Project Status Report, Dashboard With Workspaces. It is also available for immediate download and adjustment. So, changes can be made in the color, design, graphics or any other component to create a unique layout.
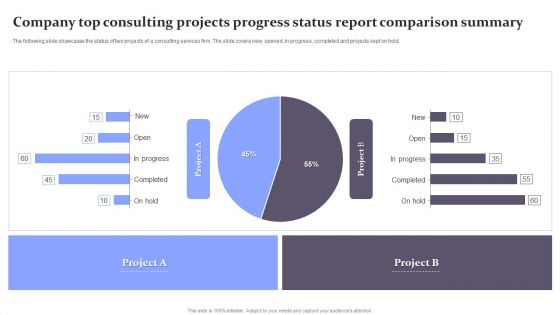
Company Top Consulting Projects Progress Status Report Comparison Summary Diagrams PDF
The following slide showcases the status of two projects of a consulting services firm. The slide covers new, opened, in progress, completed and projects kept on hold. Pitch your topic with ease and precision using this Company Top Consulting Projects Progress Status Report Comparison Summary Diagrams PDF. This layout presents information on Company Top Consulting Projects Progress, Status Report Comparison Summary. It is also available for immediate download and adjustment. So, changes can be made in the color, design, graphics or any other component to create a unique layout.
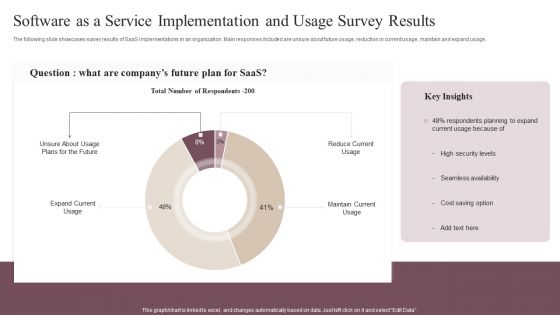
Software As A Service Implementation And Usage Survey Results Clipart PDF
The following slide showcases survey results of SaaS implementations in an organization. Main responses included are unsure about future usage, reduction in current usage, maintain and expand usage. Pitch your topic with ease and precision using this Software As A Service Implementation And Usage Survey Results Clipart PDF. This layout presents information on Reduce Current Usage, Maintain Current Usage, Expand Current Usage . It is also available for immediate download and adjustment. So, changes can be made in the color, design, graphics or any other component to create a unique layout.
Corporate Fraud Overview Types Facts And Statistics Fraud Threat Administration Guide Icons PDF
This slide provides an overview about corporate frauds along with the factual information of global fraud events. It also includes the statistics on fraud volume as well as fraud value.Deliver and pitch your topic in the best possible manner with this Corporate Fraud Overview Types Facts And Statistics Fraud Threat Administration Guide Icons PDF. Use them to share invaluable insights on Experienced Fraud, Event Past, Experienced Organizations and impress your audience. This template can be altered and modified as per your expectations. So, grab it now.
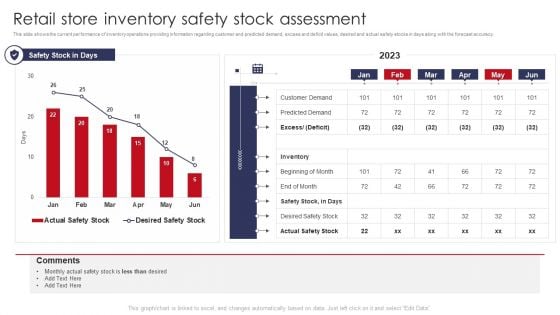
Retail Store Inventory Safety Stock Assessment Retail Outlet Operations Performance Evaluation Graphics PDF
This slide shows the current performance of inventory operations providing information regarding customer and predicted demand, excess and deficit values, desired and actual safety stocks in days along with the forecast accuracy.Deliver and pitch your topic in the best possible manner with this Retail Store Inventory Safety Stock Assessment Retail Outlet Operations Performance Evaluation Graphics PDF. Use them to share invaluable insights on Predicted Demand, Customer Demand, Beginning and impress your audience. This template can be altered and modified as per your expectations. So, grab it now.
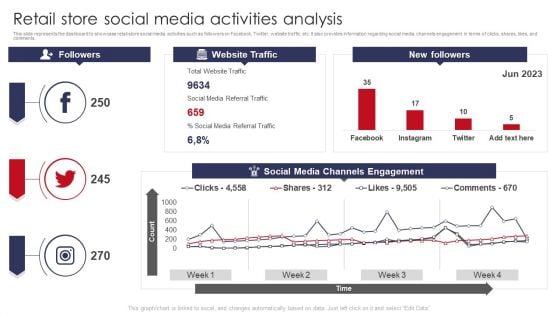
Retail Store Social Media Activities Analysis Retail Outlet Operations Performance Evaluation Slides PDF
This slide represents the dashboard to showcase retail store social media activities such as followers on Facebook, Twitter, website traffic, etc. It also provides information regarding social media channels engagement in terms of clicks, shares, likes, and comments.Deliver and pitch your topic in the best possible manner with this Retail Store Social Media Activities Analysis Retail Outlet Operations Performance Evaluation Slides PDF. Use them to share invaluable insights on Social Media, Referral Traffic, Channels Engagement and impress your audience. This template can be altered and modified as per your expectations. So, grab it now.
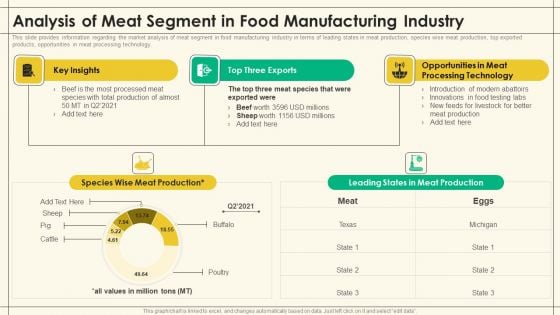
Precooked Food Industry Analysis Analysis Of Meat Segment In Food Manufacturing Industry Inspiration PDF
This slide showcase the market analysis of diary segment in food manufacturing industry providing information regarding yearly growth in milk production, top three milk producing states, species wise milk production, most exported products and top export locations.Deliver and pitch your topic in the best possible manner with this Precooked Food Industry Analysis Analysis Of Meat Segment In Food Manufacturing Industry Inspiration PDF. Use them to share invaluable insights on Production Establishments, Highest Employment, Food Manufacturing and impress your audience. This template can be altered and modified as per your expectations. So, grab it now.
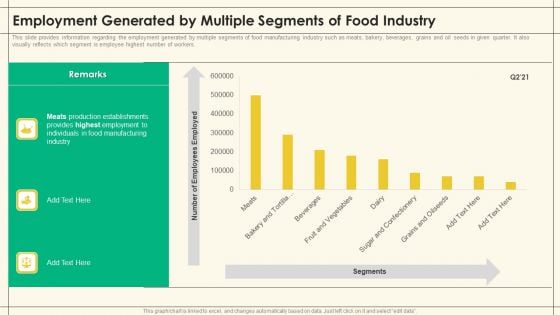
Precooked Food Industry Analysis Employment Generated By Multiple Segments Of Food Industry Professional PDF
This slide provides information regarding the employment generated by multiple segments of food manufacturing industry such as meats, bakery, beverages, grains and oil seeds in given quarter. It also visually reflects which segment is employee highest number of workers.Deliver an awe inspiring pitch with this creative Precooked Food Industry Analysis Employment Generated By Multiple Segments Of Food Industry Professional PDF bundle. Topics like Processed Food, Towards Total, Processed Food can be discussed with this completely editable template. It is available for immediate download depending on the needs and requirements of the user.
Precooked Food Industry Analysis KPI Dashboard For Tracking Supply Chain Costs Diagrams PDF
This slide represents the KPI dashboard to track the multiple cost associated with supply chain in food manufacturing industry. It includes information regarding cash to cash cycle in days, carry cost of inventory along with details of net sales.Deliver an awe inspiring pitch with this creative Precooked Food Industry Analysis KPI Dashboard For Tracking Supply Chain Costs Diagrams PDF bundle. Topics like Processing Industry, Food Processing, Manufacturing Industry can be discussed with this completely editable template. It is available for immediate download depending on the needs and requirements of the user.
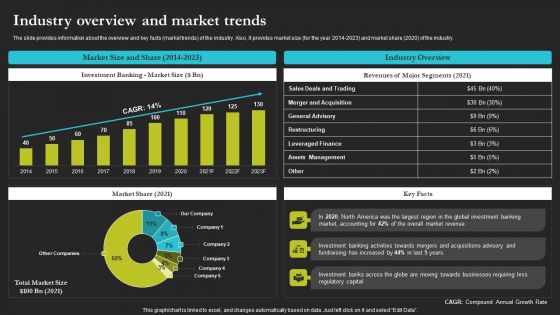
Sell Side Merger And Acquisition Industry Overview And Market Trends Introduction PDF
The slide provides information about the overview and key facts market trends of the industry. Also, it provides market size for the year 2014 to 2023 and market share 2020 of the industry. Deliver an awe inspiring pitch with this creative Sell Side Merger And Acquisition Industry Overview And Market Trends Introduction PDF bundle. Topics like Industry Overview, Market Size, 2014 To 2023 can be discussed with this completely editable template. It is available for immediate download depending on the needs and requirements of the user.
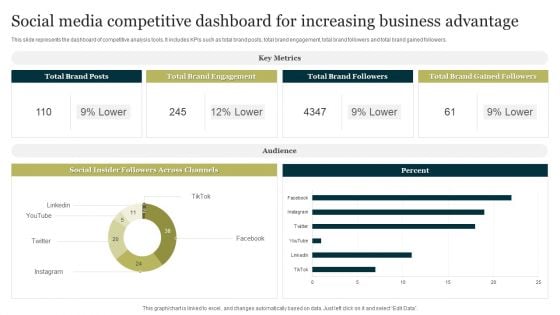
Social Media Competitive Dashboard For Increasing Business Advantage Portrait PDF
This slide represents the dashboard of competitive analysis tools. It includes KPIs such as total brand posts, total brand engagement, total brand followers and total brand gained followers. Pitch your topic with ease and precision using this Social Media Competitive Dashboard For Increasing Business Advantage Portrait PDF. This layout presents information on Social Media Competitive Dashboard, Increasing Business Advantage. It is also available for immediate download and adjustment. So, changes can be made in the color, design, graphics or any other component to create a unique layout.
Phishing Incident Management Dashboard For Attacks Awareness Training Icons PDF
This slide covers phishing incident management dashboard for effective awareness training. It involves details such as average resolution time, new incidents, incident status, resolved vs unresolved incidents and created vs closed incidents. Pitch your topic with ease and precision using this Phishing Incident Management Dashboard For Attacks Awareness Training Icons PDF. This layout presents information on Phishing Incident Management Dashboard, Attacks Awareness Training. It is also available for immediate download and adjustment. So, changes can be made in the color, design, graphics or any other component to create a unique layout.
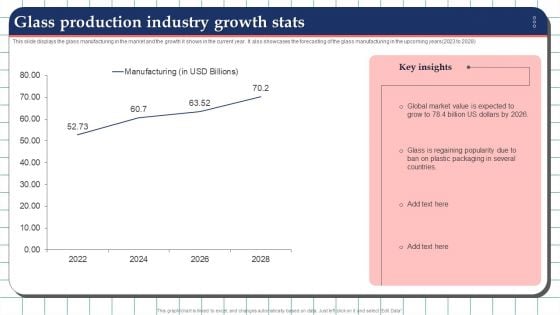
Glass Production Industry Growth Stats Graphics PDF
This slide displays the glass manufacturing in the market and the growth it shows in the current year. It also showcases the forecasting of the glass manufacturing in the upcoming years 2023 to 2028. Pitch your topic with ease and precision using this Glass Production Industry Growth Stats Graphics PDF. This layout presents information on Global Market Value, Glass Production Industry Growth. It is also available for immediate download and adjustment. So, changes can be made in the color, design, graphics or any other component to create a unique layout.
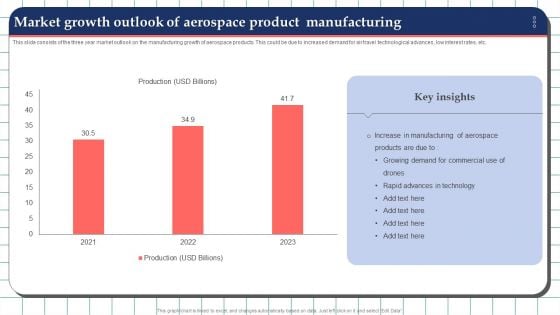
Market Growth Outlook Of Aerospace Product Manufacturing Sample PDF
This slide consists of the three year market outlook on the manufacturing growth of aerospace products. This could be due to increased demand for air travel technological advances, low interest rates, etc. Pitch your topic with ease and precision using this Market Growth Outlook Of Aerospace Product Manufacturing Sample PDF. This layout presents information on Manufacturing, Products, Demand, Commercial. It is also available for immediate download and adjustment. So, changes can be made in the color, design, graphics or any other component to create a unique layout.
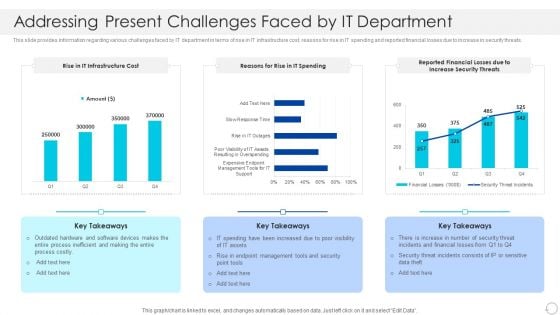
Addressing Present Challenges Faced By IT Department Download PDF
This slide provides information regarding various challenges faced by IT department in terms of rise in IT infrastructure cost, reasons for rise in IT spending and reported financial losses due to increase in security threats. Deliver and pitch your topic in the best possible manner with this Addressing Present Challenges Faced By IT Department Download PDF. Use them to share invaluable insights on Management Tools, Financial, Security and impress your audience. This template can be altered and modified as per your expectations. So, grab it now.
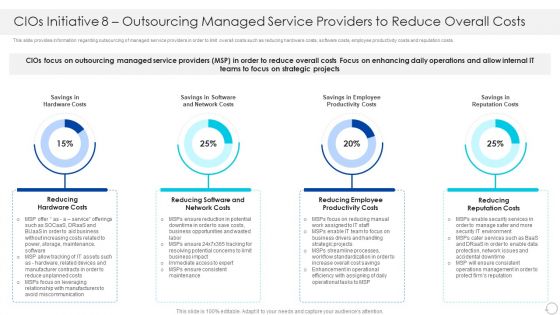
Cios Initiative 8 Outsourcing Managed Service Providers To Reduce Overall Costs Download PDF
This slide provides information regarding outsourcing of managed service providers in order to limit overall costs such as reducing hardware costs, software costs, employee productivity costs and reputation costs. Deliver and pitch your topic in the best possible manner with this Cios Initiative 8 Outsourcing Managed Service Providers To Reduce Overall Costs Download PDF. Use them to share invaluable insights on Network Costs, Reducing Employee Productivity Costs, Reducing Reputation Costs and impress your audience. This template can be altered and modified as per your expectations. So, grab it now.
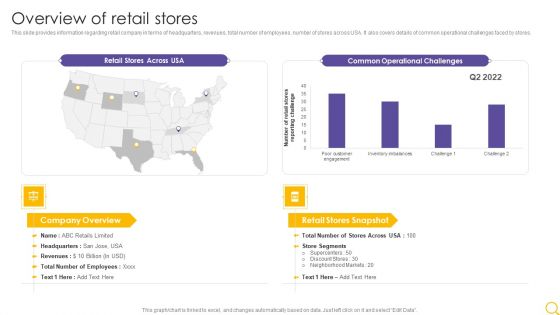
Retail Outlet Operational Efficiency Analytics Overview Of Retail Stores Rules PDF
This slide provides information regarding retail company in terms of headquarters, revenues, total number of employees, number of stores across USA. It also covers details of common operational challenges faced by stores. Deliver an awe inspiring pitch with this creative Retail Outlet Operational Efficiency Analytics Overview Of Retail Stores Rules PDF bundle. Topics like Retail Stores, Across USA, Common Operational Challenges can be discussed with this completely editable template. It is available for immediate download depending on the needs and requirements of the user.
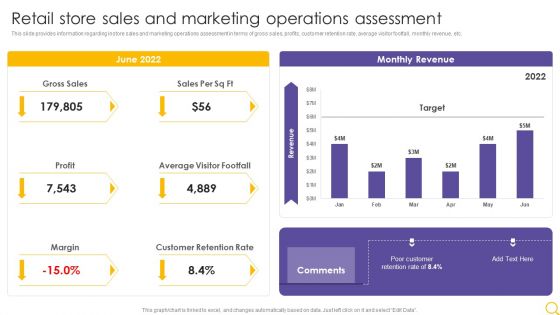
Retail Outlet Operational Efficiency Analytics Retail Store Sales And Marketing Operations Assessment Designs PDF
This slide provides information regarding instore sales and marketing operations assessment in terms of gross sales, profits, customer retention rate, average visitor footfall, monthly revenue, etc. Deliver and pitch your topic in the best possible manner with this Retail Outlet Operational Efficiency Analytics Retail Store Sales And Marketing Operations Assessment Designs PDF. Use them to share invaluable insights on Gross Sales, Profit, Average Visitor Footfall and impress your audience. This template can be altered and modified as per your expectations. So, grab it now.
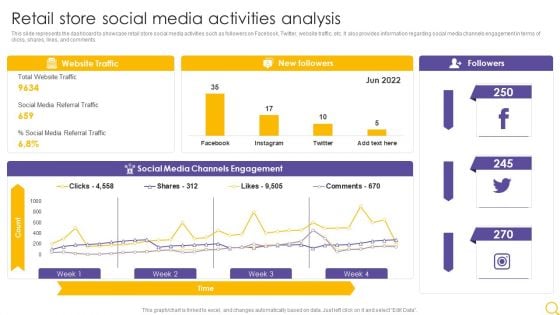
Retail Outlet Operational Efficiency Analytics Retail Store Social Media Activities Analysis Portrait PDF
This slide represents the dashboard to showcase retail store social media activities such as followers on Facebook, Twitter, website traffic, etc. It also provides information regarding social media channels engagement in terms of clicks, shares, likes, and comments. Deliver an awe inspiring pitch with this creative Retail Outlet Operational Efficiency Analytics Retail Store Social Media Activities Analysis Portrait PDF bundle. Topics like Website Traffic, New Followers, Social Media Channels can be discussed with this completely editable template. It is available for immediate download depending on the needs and requirements of the user.
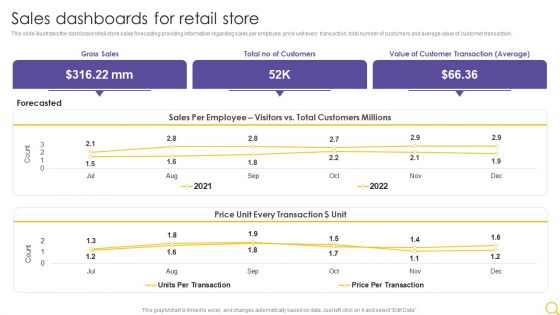
Retail Outlet Operational Efficiency Analytics Sales Dashboards For Retail Store Inspiration PDF
This slide illustrates the dashboard retail store sales forecasting providing information regarding sales per employee, price unit every transaction, total number of customers and average value of customer transaction. Deliver and pitch your topic in the best possible manner with this Retail Outlet Operational Efficiency Analytics Sales Dashboards For Retail Store Inspiration PDF. Use them to share invaluable insights on Gross Sales, Total No Customers, Value Customer and impress your audience. This template can be altered and modified as per your expectations. So, grab it now.
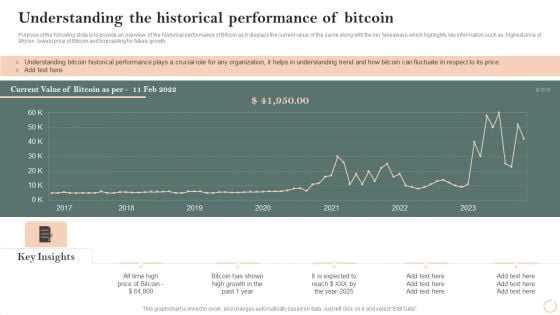
Virtual Assets Investment Guide Understanding The Historical Performance Of Bitcoin Pictures PDF
Purpose of the following slide is to provide an overview of the historical performance of Bitcoin as it displays the current value of the same along with the key takeaways which highlights key information such as highest price of Bitcoin, lowest price of Bitcoin and forecasting for future growth. Deliver and pitch your topic in the best possible manner with this Virtual Assets Investment Guide Understanding The Historical Performance Of Bitcoin Pictures PDF. Use them to share invaluable insights on Current Value, 2017 To 2023, High Price and impress your audience. This template can be altered and modified as per your expectations. So, grab it now.

Virtual Currency Investment Guide For Companies Understanding The Historical Performance Of Bitcoin Formats PDF
Purpose of the following slide is to provide an overview of the historical performance of Bitcoin as it displays the current value of the same along with the key takeaways which highlights key information such as highest price of Bitcoin, lowest price of Bitcoin and forecasting for future growth. Deliver an awe inspiring pitch with this creative Virtual Currency Investment Guide For Companies Understanding The Historical Performance Of Bitcoin Formats PDF bundle. Topics like Current Value, Bitcoin As Per, 2016 To 2022 can be discussed with this completely editable template. It is available for immediate download depending on the needs and requirements of the user.


 Continue with Email

 Home
Home


