Continuous Improvement Icon
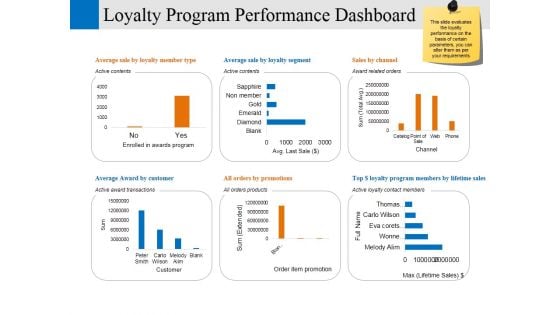
Loyalty Program Performance Dashboard Ppt PowerPoint Presentation Professional Model
This is a loyalty program performance dashboard ppt powerpoint presentation professional model. This is a six stage process. The stages in this process are enrolled in awards program, customer, order item promotion, channel, business.
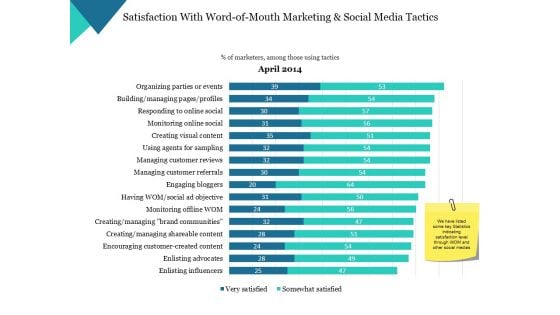
Satisfaction With Word Of Mouth Marketing And Social Media Tactics Ppt PowerPoint Presentation Styles Examples
This is a satisfaction with word of mouth marketing and social media tactics ppt powerpoint presentation styles examples. This is a one stage process. The stages in this process are business, marketing, finance, strategy, graph.

Budgeting Planned Actual Comparison Ppt PowerPoint Presentation Portfolio Information
This is a budgeting planned actual comparison ppt powerpoint presentation portfolio information. This is a three stage process. The stages in this process are planned cost, actual cost, deviation.
Budgeting Template 3 Ppt PowerPoint Presentation Visual Aids Model
This is a budgeting template 3 ppt powerpoint presentation visual aids model. This is a five stage process. The stages in this process are bar graph, business, marketing, finance, planning.
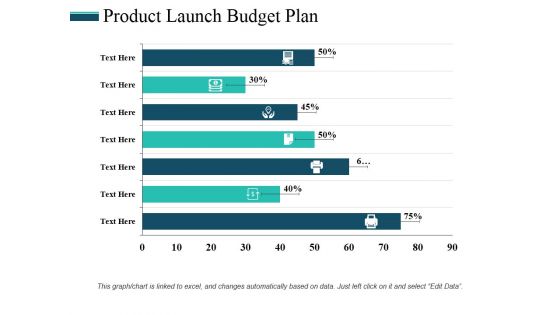
Product Launch Budget Plan Ppt PowerPoint Presentation Professional Rules
This is a product launch budget plan ppt powerpoint presentation professional rules. This is a seven stage process. The stages in this process are bar graph, finance, business, marketing, planning.

Project Management Dashboard Ppt PowerPoint Presentation Portfolio Portrait
This is a project management dashboard ppt powerpoint presentation portfolio portrait. This is a five stage process. The stages in this process are overall task status, assigned to, budget, pending items, business.
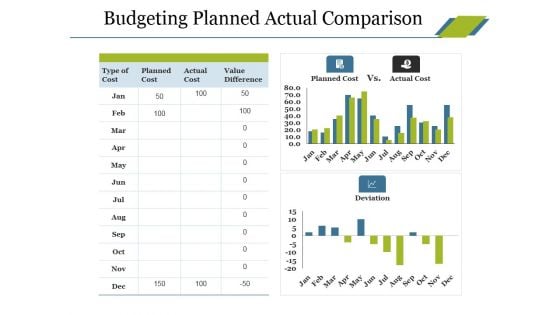
Budgeting Planned Actual Comparison Ppt PowerPoint Presentation Portfolio Display
This is a budgeting planned actual comparison ppt powerpoint presentation portfolio display. This is a three stage process. The stages in this process are type of cost, planned cost, actual cost, deviation, value difference.
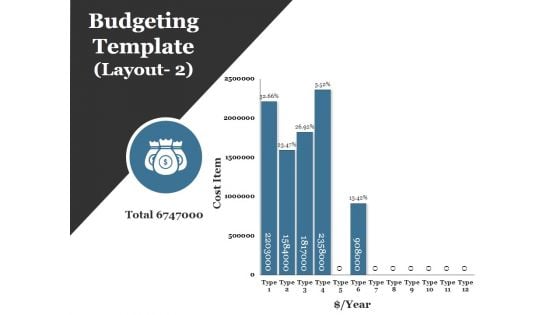
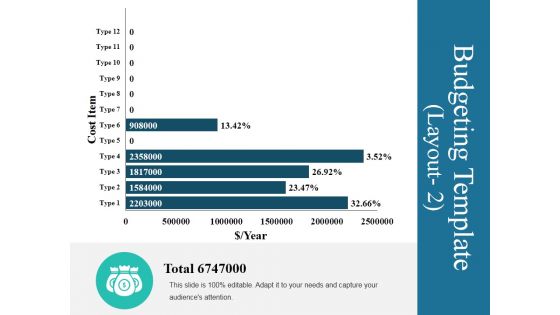
Budgeting Template 3 Ppt PowerPoint Presentation Ideas Graphics Tutorials
This is a budgeting template 3 ppt powerpoint presentation ideas graphics tutorials. This is a five stage process. The stages in this process are cost item, year, total, type, budgeting template.
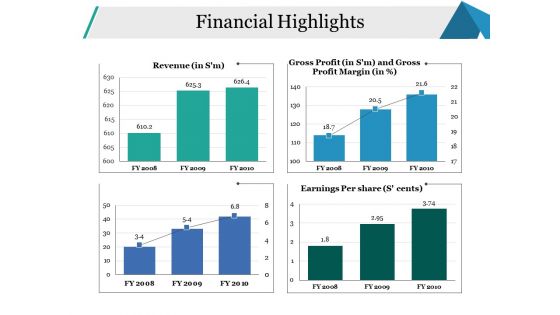
Financial Highlights Ppt PowerPoint Presentation File Background Designs
This is a financial highlights ppt powerpoint presentation file background designs. This is a four stage process. The stages in this process are revenue, earnings per share, financial, business, marketing.
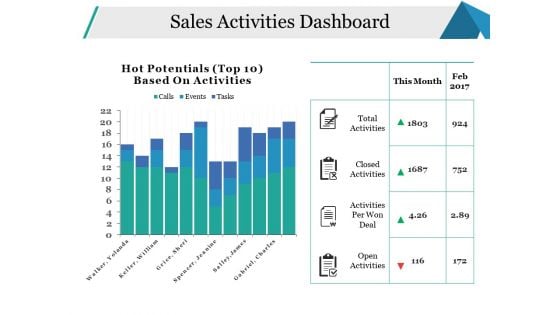
Sales Activities Dashboard Ppt PowerPoint Presentation Pictures Model
This is a sales activities dashboard ppt powerpoint presentation pictures model. This is a two stage process. The stages in this process are open activities, activities per won deal, closed activities, total activities, business.
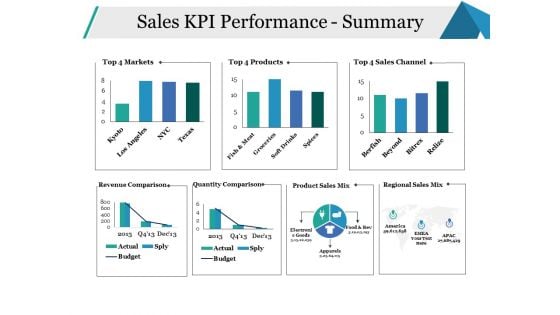
Sales KPI Performance Summary Ppt PowerPoint Presentation Infographics Model
This is a sales kpi performance summary ppt powerpoint presentation infographics model. This is a seven stage process. The stages in this process are sales channel, revenue comparison, quantity comparison, business, marketing.
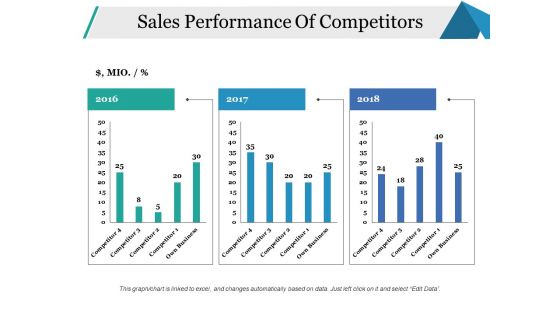
Sales Performance Of Competitors Ppt PowerPoint Presentation Portfolio Sample
This is a sales performance of competitors ppt powerpoint presentation portfolio sample. This is a three stage process. The stages in this process are business, marketing, finance, graph, years.
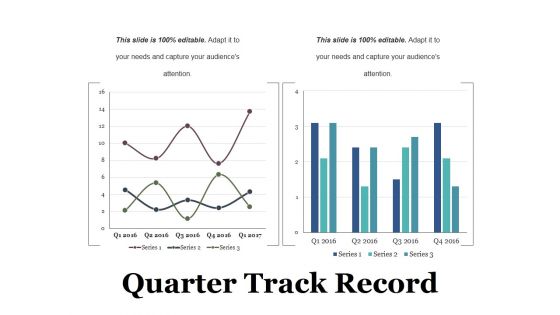
Quarter Track Record Ppt PowerPoint Presentation Styles Master Slide
This is a quarter track record ppt powerpoint presentation styles master slide. This is a two stage process. The stages in this process are business, graph, marketing, finance, planning.
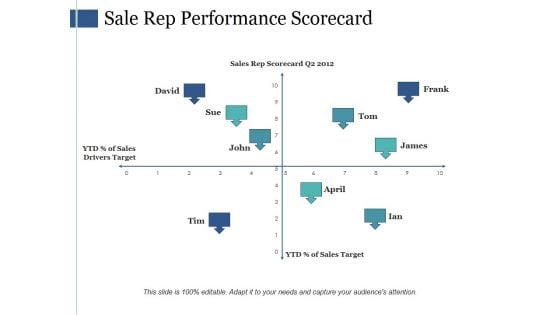
Sale Rep Performance Scorecard Ppt PowerPoint Presentation Pictures Background
This is a sale rep performance scorecard ppt powerpoint presentation pictures background. This is a four stage process. The stages in this process are david, sue, john, tim, frank.

Sales Kpi Performance Summary Ppt PowerPoint Presentation Infographic Template Infographics
This is a sales kpi performance summary ppt powerpoint presentation infographic template infographics. This is a seven stage process. The stages in this process are revenue comparison, quantity comparison, product sales mix, regional sales mix.
Sales Kpi Tracker Ppt PowerPoint Presentation Visual Aids Files
This is a sales kpi tracker ppt powerpoint presentation visual aids files. This is a six stage process. The stages in this process are leads created, sales ratio, opportunities won, top products in revenue, open deals vs last yr.
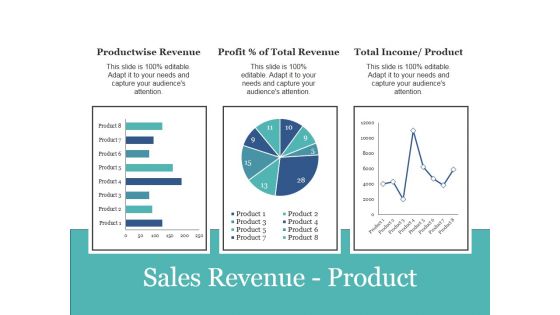
Sales Revenue Product Ppt PowerPoint Presentation Infographic Template Backgrounds
This is a sales revenue product ppt powerpoint presentation infographic template backgrounds. This is a three stage process. The stages in this process are product wise revenue, profit percent of total revenue, total income product.

Sales Budget Vs Actual Ppt PowerPoint Presentation Show Master Slide
This is a sales budget vs actual ppt powerpoint presentation show master slide. This is a two stage process. The stages in this process are business, finance, management, analysis, budget, actual.

Sales Kpi Performance Summary Ppt PowerPoint Presentation Ideas Graphics Template
This is a sales kpi performance summary ppt powerpoint presentation ideas graphics template. This is a seven stage process. The stages in this process are revenue comparison, quantity comparison, product sales mix, regional sales mix.
Sales Kpi Tracker Ppt PowerPoint Presentation Pictures Designs
This is a sales kpi tracker ppt powerpoint presentation pictures designs. This is a two stage process. The stages in this process are leads created, sales ratio, opportunities won, top products in revenue, win ratio vs last yr.
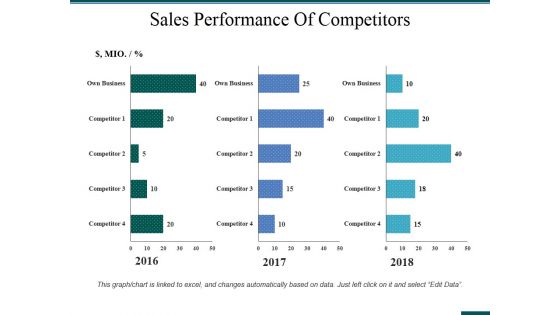
Sales Performance Of Competitors Ppt PowerPoint Presentation Portfolio Summary
This is a sales performance of competitors ppt powerpoint presentation portfolio summary. This is a three stage process. The stages in this process are business, management, sales, finance, analysis.
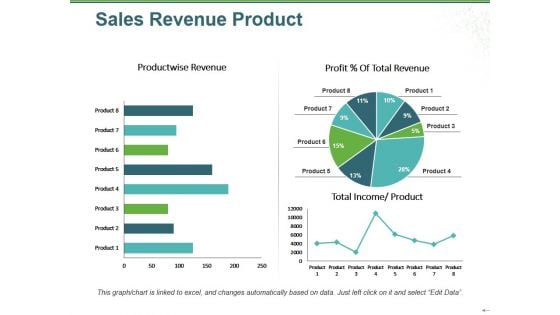
Sales Revenue Product Ppt PowerPoint Presentation Infographic Template Infographic Template
This is a sales revenue product ppt powerpoint presentation infographic template infographic template. This is a three stage process. The stages in this process are product wise revenue, total income, product, profit total revenue, pie.
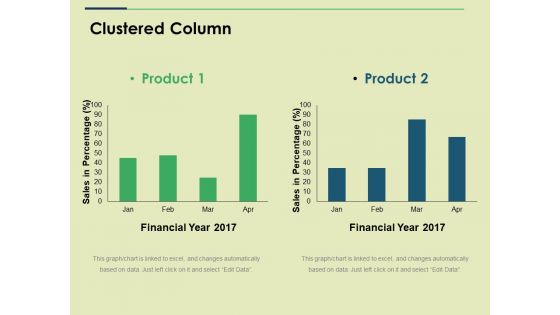
Clustered Column Ppt PowerPoint Presentation Show Graphics
This is a clustered column ppt powerpoint presentation show graphics. This is a two stage process. The stages in this process are financial year, sales in percentage, business, marketing, graph.
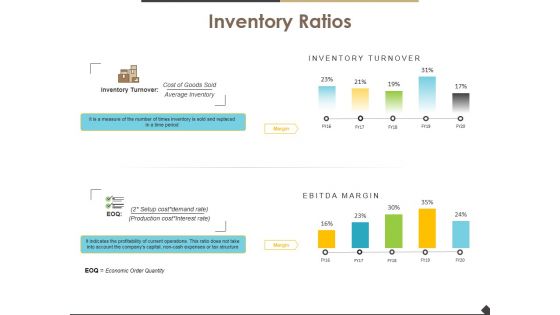
Inventory Ratios Template 1 Ppt PowerPoint Presentation Gallery Master Slide
This is a inventory ratios template 1 ppt powerpoint presentation gallery master slide. This is a two stage process. The stages in this process are finance, marketing, analysis, business, investment, inventory ratios.
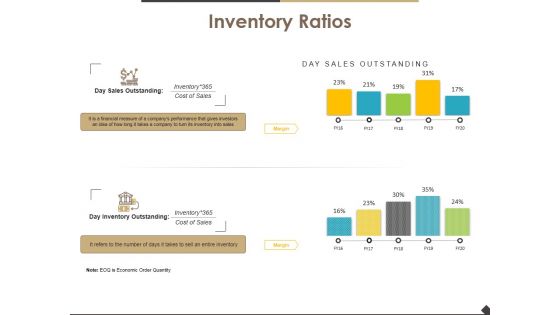
Inventory Ratios Template 2 Ppt PowerPoint Presentation Slide
This is a inventory ratios template 2 ppt powerpoint presentation slide. This is a two stage process. The stages in this process are finance, marketing, analysis, business, investment, inventory ratios.
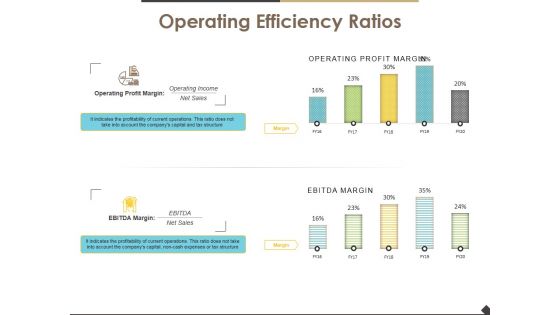
Operating Efficiency Ratios Template 1 Ppt PowerPoint Presentation Layouts Introduction
This is a operating efficiency ratios template 1 ppt powerpoint presentation layouts introduction. This is a two stage process. The stages in this process are operating efficiency ratios, finance, marketing, strategy, business.
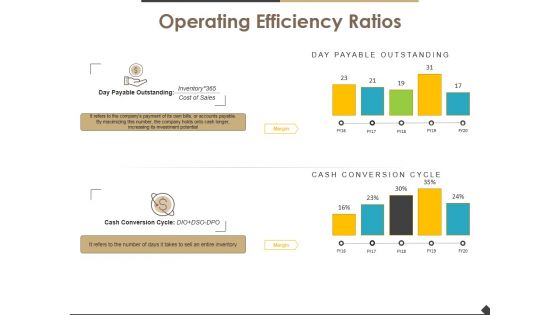
Operating Efficiency Ratios Template 2 Ppt PowerPoint Presentation Infographic Template Guide
This is a operating efficiency ratios template 2 ppt powerpoint presentation infographic template guide. This is a two stage process. The stages in this process are operating efficiency ratios, finance, marketing, strategy, business.
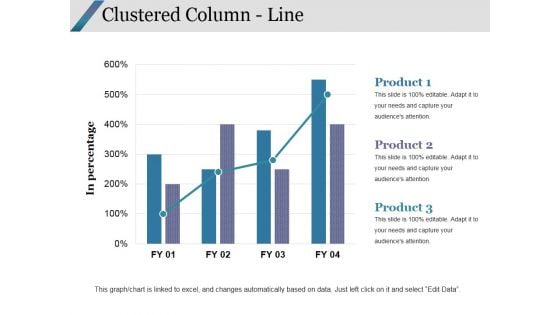
Clustered Column Line Ppt PowerPoint Presentation Portfolio Good
This is a clustered column line ppt powerpoint presentation portfolio good. This is a three stage process. The stages in this process are clustered column line, finance, marketing, strategy, analysis, business.
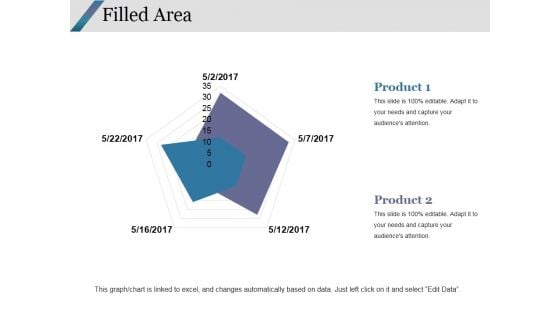
Filled Area Ppt PowerPoint Presentation Infographics Graphics Design
This is a filled area ppt powerpoint presentation infographics graphics design. This is a two stage process. The stages in this process are filled area, finance, marketing, strategy, analysis.
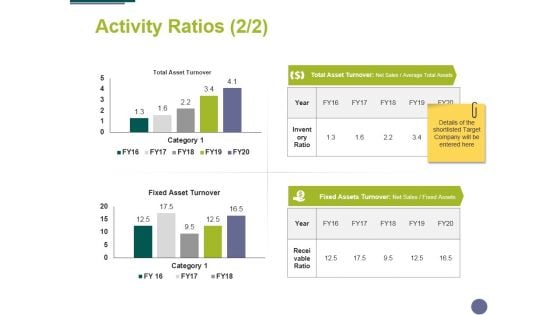
Activity Ratios Template 2 Ppt PowerPoint Presentation Show Slides
This is a activity ratios template 2 ppt powerpoint presentation show slides. This is a two stage process. The stages in this process are business, management, analysis, finance, marketing.
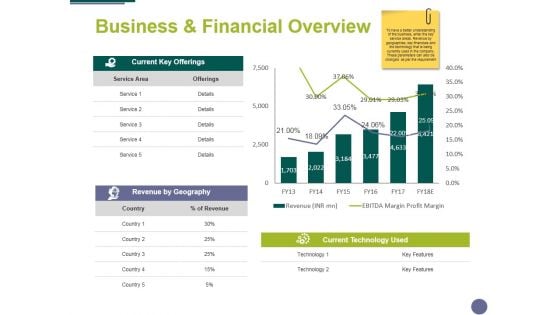
Business And Financial Overview Ppt PowerPoint Presentation Summary Format
This is a business and financial overview ppt powerpoint presentation summary format. This is a two stage process. The stages in this process are finance, analysis, marketing, business, compere.
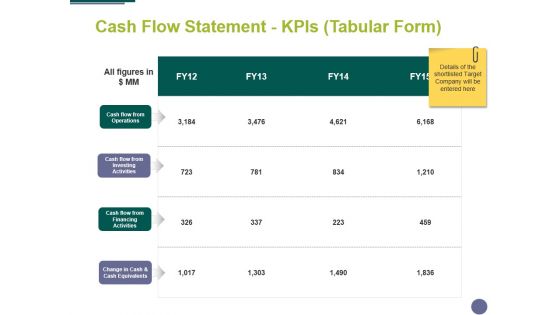
Cash Flow Statement Kpis Tabular Form Ppt PowerPoint Presentation Styles Design Inspiration
This is a cash flow statement kpis tabular form ppt powerpoint presentation styles design inspiration. This is a four stage process. The stages in this process are finance, analysis, management, business, marketing.
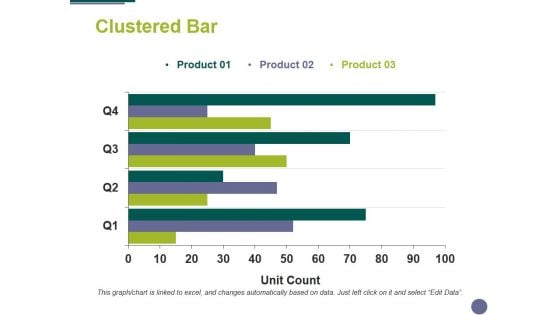
Clustered Bar Ppt PowerPoint Presentation Show Background Designs
This is a clustered bar ppt powerpoint presentation show background designs. This is a three stage process. The stages in this process are clustered bar, finance, analysis, business, marketing.
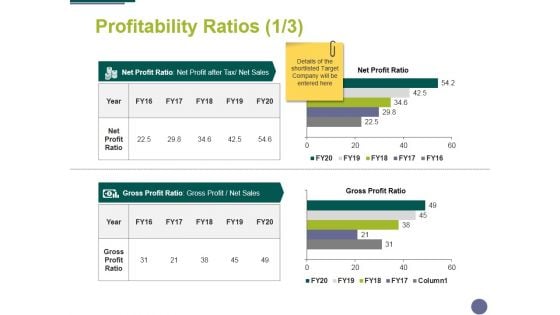
Profitability Ratios Template 1 Ppt PowerPoint Presentation Professional Skills
This is a profitability ratios template 1 ppt powerpoint presentation professional skills. This is a two stage process. The stages in this process are compere, finance, marketing, analysis, business.
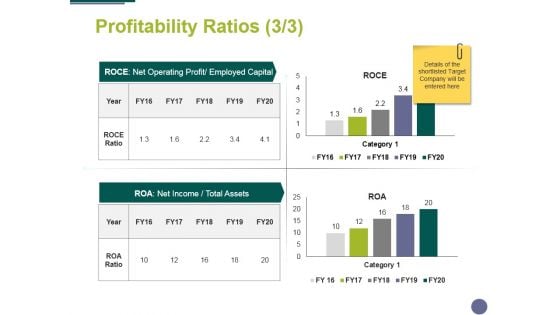
Profitability Ratios Template 3 Ppt PowerPoint Presentation Ideas Skills
This is a profitability ratios template 3 ppt powerpoint presentation ideas skills. This is a two stage process. The stages in this process are compere, finance, marketing, analysis, business.
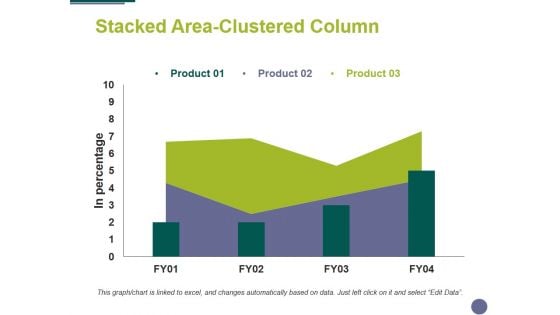
Stacked Area Clustered Column Ppt PowerPoint Presentation Ideas Objects
This is a stacked area clustered column ppt powerpoint presentation ideas objects. This is a three stage process. The stages in this process are finance, marketing, analysis, business, strategy.
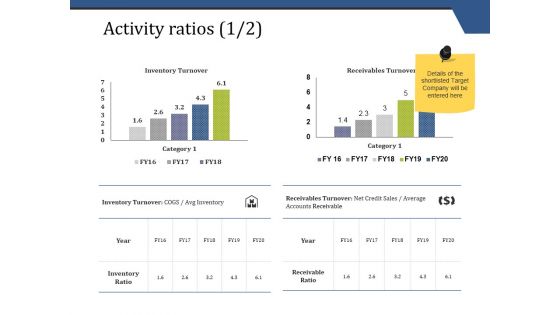
Activity Ratios Template 1 Ppt PowerPoint Presentation Show Graphics
This is a activity ratios template 1 ppt powerpoint presentation show graphics. This is a two stage process. The stages in this process are inventory turnover, receivables turnover, inventory ratio, receivable ratio.
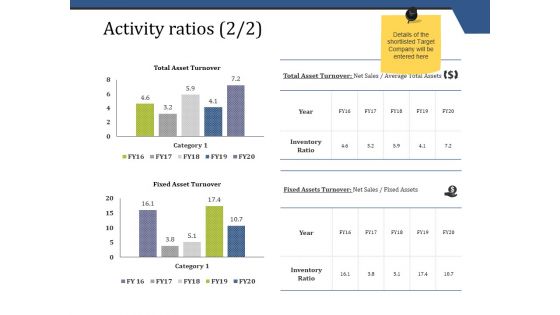
Activity Ratios Template 2 Ppt PowerPoint Presentation Pictures Template
This is a activity ratios template 2 ppt powerpoint presentation pictures template. This is a two stage process. The stages in this process are total asset turnover, fixed asset turnover.
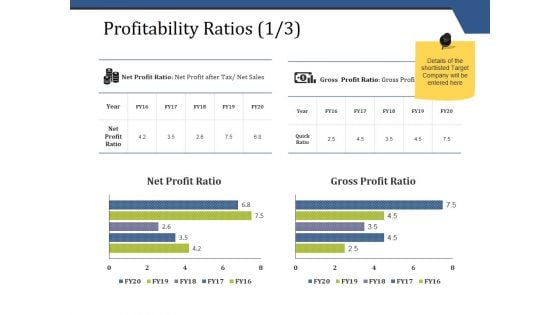
Profitability Ratios Template 1 Ppt PowerPoint Presentation Infographics Mockup
This is a profitability ratios template 1 ppt powerpoint presentation infographics mockup. This is a two stage process. The stages in this process are business, finance, marketing, strategy, analysis.
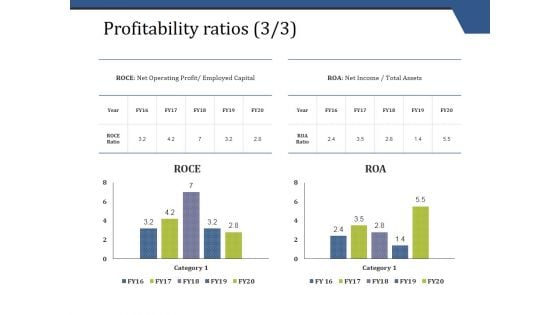
Profitability Ratios Template 3 Ppt PowerPoint Presentation Infographic Template Visual Aids
This is a profitability ratios template 3 ppt powerpoint presentation infographic template visual aids. This is a two stage process. The stages in this process are business, finance, marketing, analysis, investment.
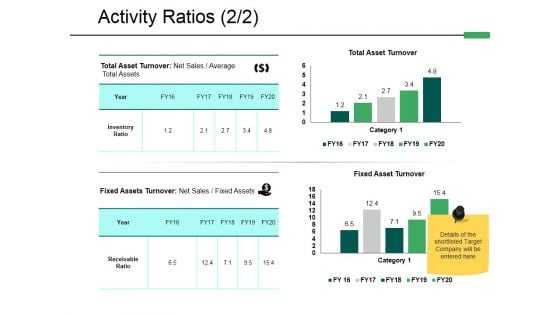
Activity Ratios Template 2 Ppt PowerPoint Presentation Model Design Inspiration
This is a activity ratios template 2 ppt powerpoint presentation model design inspiration. This is a two stage process. The stages in this process are finance, analysis, compere, business, marketing.
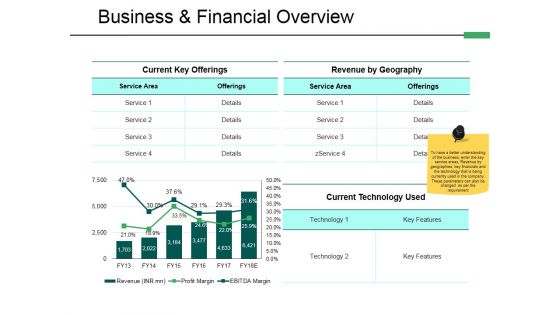
Business And Financial Overview Ppt PowerPoint Presentation Pictures Visuals
This is a business and financial overview ppt powerpoint presentation pictures visuals. This is a two stage process. The stages in this process are current key offerings, revenue by geography, current technology used, business financial overview.
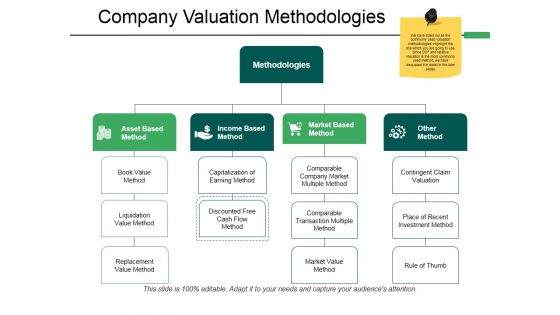
Company Valuation Methodologies Ppt PowerPoint Presentation File Format
This is a company valuation methodologies ppt powerpoint presentation file format. This is a four stage process. The stages in this process are book value method, market value method, rule of thumb, replacement value method, contingent claim valuation.
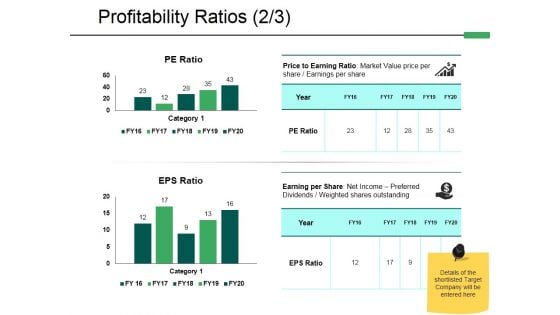
Profitability Ratios Template 2 Ppt PowerPoint Presentation File Graphics
This is a profitability ratios template 2 ppt powerpoint presentation file graphics. This is a two stage process. The stages in this process are finance, analysis, compere, strategy, business.
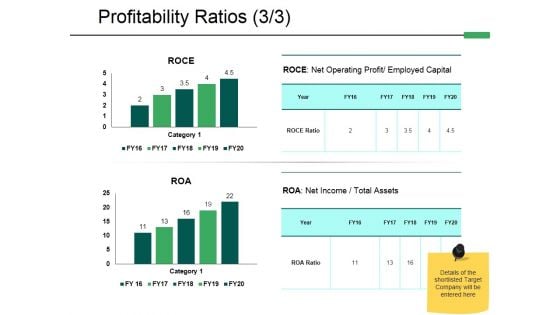
Profitability Ratios Template 3 Ppt PowerPoint Presentation Styles Introduction
This is a profitability ratios template 3 ppt powerpoint presentation styles introduction. This is a two stage process. The stages in this process are finance, analysis, compere, strategy, business.
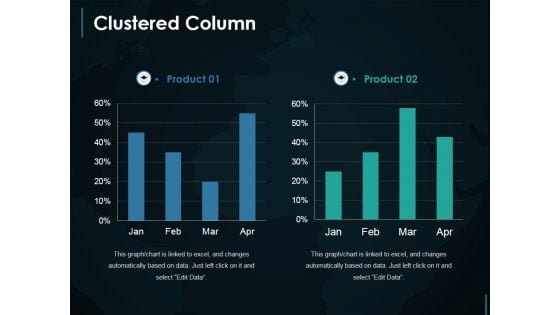
Clustered Column Ppt PowerPoint Presentation Layouts Deck
This is a clustered column ppt powerpoint presentation layouts deck. This is a two stage process. The stages in this process are clustered column, finance, marketing, strategy, investment, business.
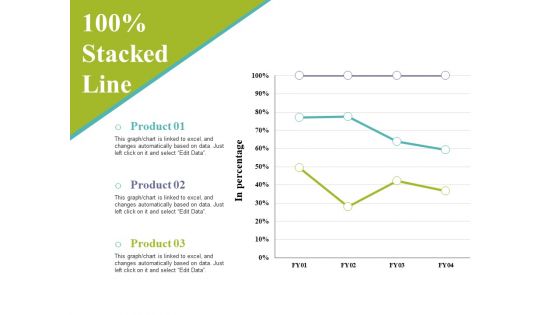
Stacked Line Ppt PowerPoint Presentation Layouts Sample
This is a stacked line ppt powerpoint presentation layouts sample. This is a three stage process. The stages in this process are in percentage, business, marketing, finance, graph, strategy.
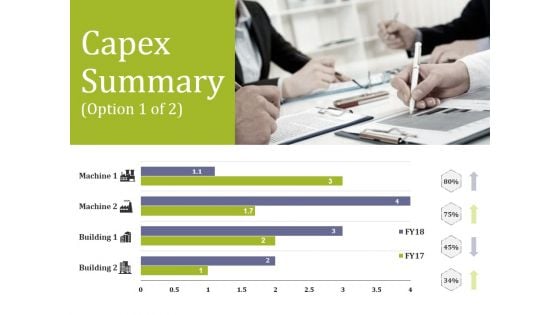
Capex Summary Template 1 Ppt PowerPoint Presentation Professional Mockup
This is a capex summary template 1 ppt powerpoint presentation professional mockup. This is a four stage process. The stages in this process are finance, analysis, business, marketing, strategy.
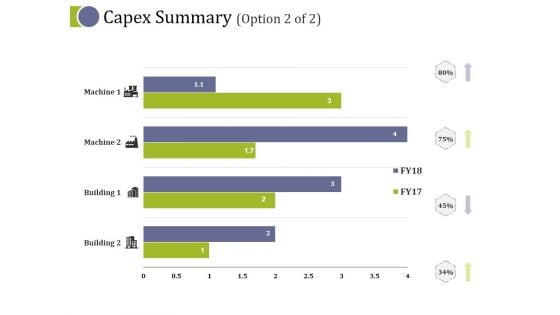
Capex Summary Template 2 Ppt PowerPoint Presentation Layouts Layout Ideas
This is a capex summary template 2 ppt powerpoint presentation layouts layout ideas. This is a four stage process. The stages in this process are finance, analysis, business, marketing, strategy.
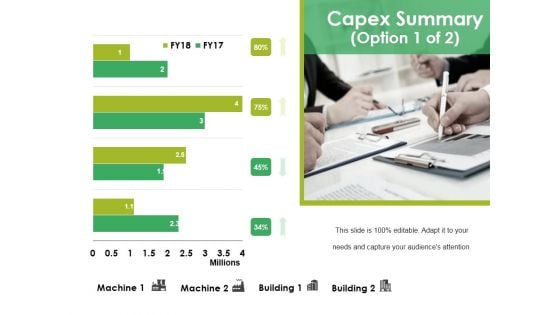
Capex Summary Template 1 Ppt PowerPoint Presentation Infographics Mockup
This is a capex summary template 1 ppt powerpoint presentation infographics mockup. This is a four stage process. The stages in this process are finance, marketing, business, analysis, strategy.
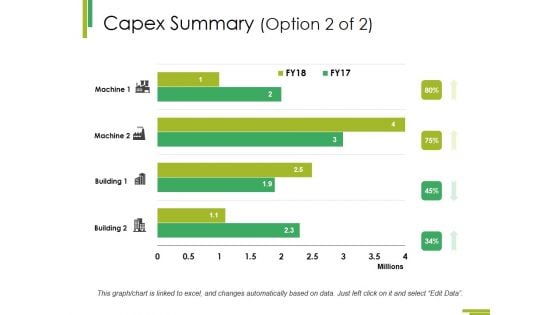
Capex Summary Template 2 Ppt PowerPoint Presentation Inspiration Samples
This is a capex summary template 2 ppt powerpoint presentation inspiration samples. This is a four stage process. The stages in this process are finance, marketing, business, analysis, strategy.
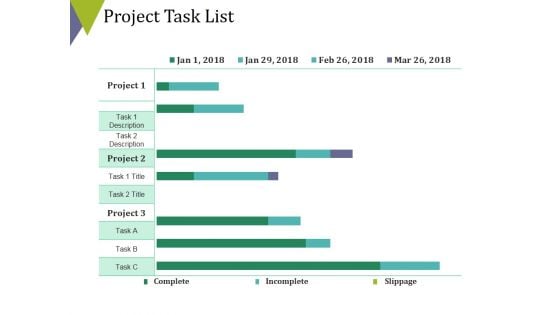
Project Task List Template 2 Ppt PowerPoint Presentation Infographics Brochure
This is a project task list template 2 ppt powerpoint presentation infographics brochure. This is a three stage process. The stages in this process are finance, business, marketing, analysis, strategy.
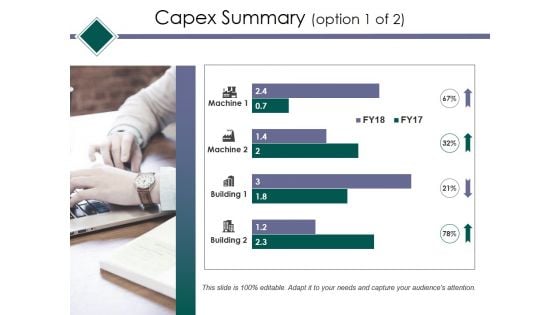
Capex Summary Template 1 Ppt PowerPoint Presentation Layouts Examples
This is a capex summary template 1 ppt powerpoint presentation layouts examples. This is a four stage process. The stages in this process are business, finance, marketing, analysis, investment.
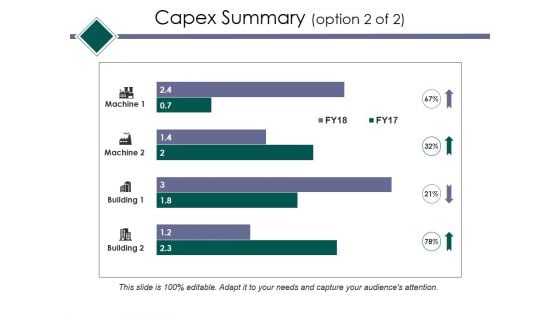
Capex Summary Template 2 Ppt PowerPoint Presentation Slides Template
This is a capex summary template 2 ppt powerpoint presentation slides template. This is a four stage process. The stages in this process are business, finance, marketing, analysis, investment.
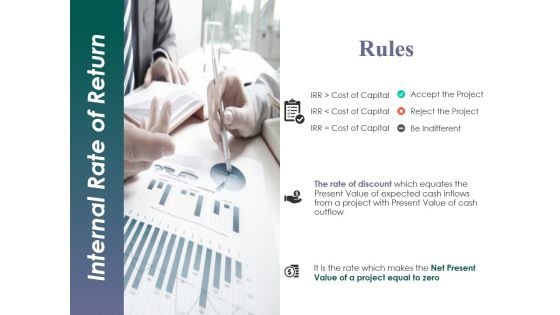
Internal Rate Of Return Template 1 Ppt PowerPoint Presentation Inspiration Skills
This is a internal rate of return template 1 ppt powerpoint presentation inspiration skills. This is a one stage process. The stages in this process are business, finance, marketing, strategy, analysis.
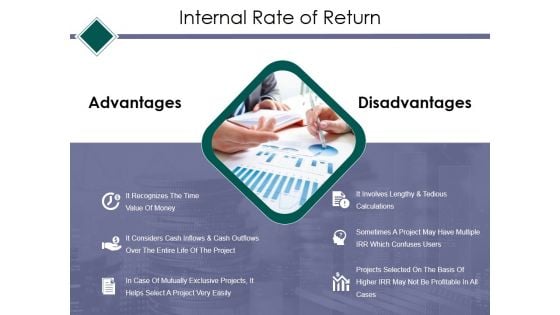
Internal Rate Of Return Template 2 Ppt PowerPoint Presentation Portfolio Grid
This is a internal rate of return template 2 ppt powerpoint presentation portfolio grid. This is a two stage process. The stages in this process are advantages, disadvantages, finance, analysis, business.
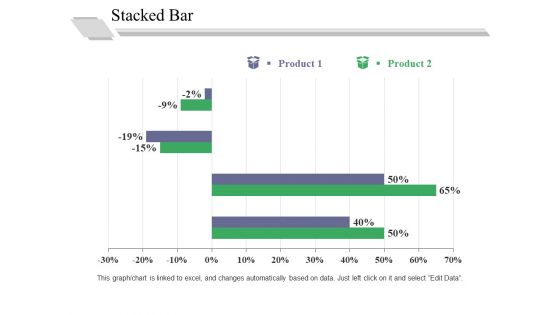
Stacked Bar Template 2 Ppt PowerPoint Presentation Professional Graphics Pictures
This is a stacked bar template 2 ppt powerpoint presentation professional graphics pictures. This is a two stage process. The stages in this process are in percentage, business, marketing, graph, strategy.
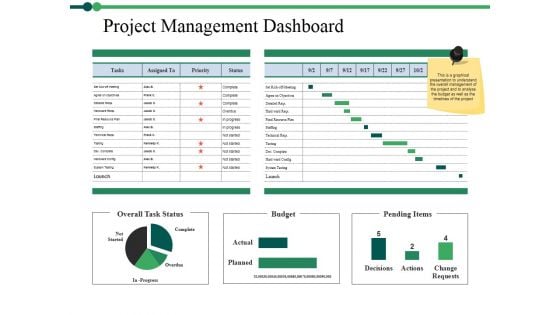
Project Management Dashboard Ppt PowerPoint Presentation Portfolio Objects
This is a project management dashboard ppt powerpoint presentation portfolio objects. This is a three stage process. The stages in this process are complete, overdue, overall task status, budget, pending items.
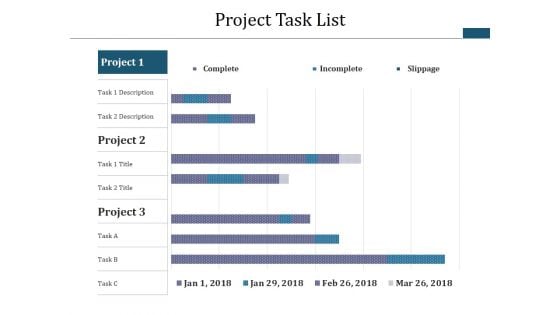
Project Task List Template 2 Ppt PowerPoint Presentation Infographics Example Topics
This is a project task list template 2 ppt powerpoint presentation infographics example topics. This is a three stage process. The stages in this process are business, analysis, strategy, finance, marketing.
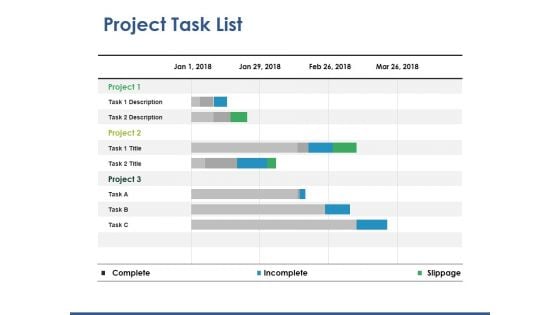
Project Task List Template 2 Ppt PowerPoint Presentation Slides Tips
This is a project task list template 2 ppt powerpoint presentation slides tips. This is a three stage process. The stages in this process are business, finance, marketing, analysis, strategy.
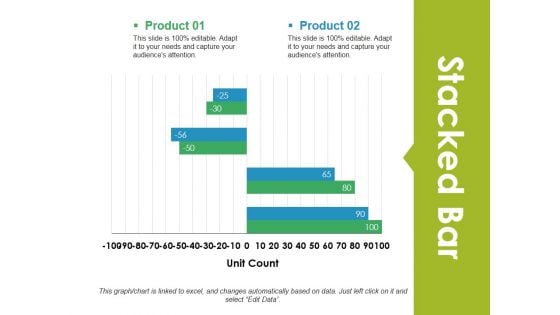
Stacked Bar Ppt PowerPoint Presentation Visual Aids Gallery
This is a stacked bar ppt powerpoint presentation visual aids gallery. This is a two stage process. The stages in this process are stacked bar, analysis, finance, marketing, strategy.
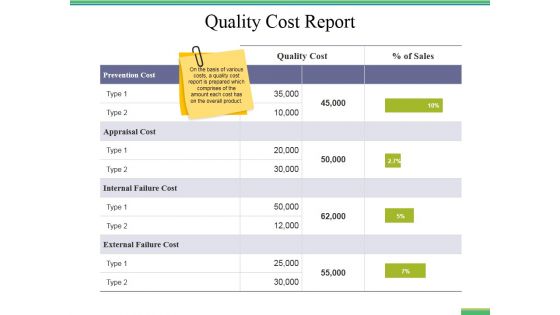
Quality Cost Report Ppt PowerPoint Presentation Styles Infographic Template
This is a quality cost report ppt powerpoint presentation styles infographic template. This is a five stage process. The stages in this process are business, finance, marketing, strategy, bar graph, analysis.
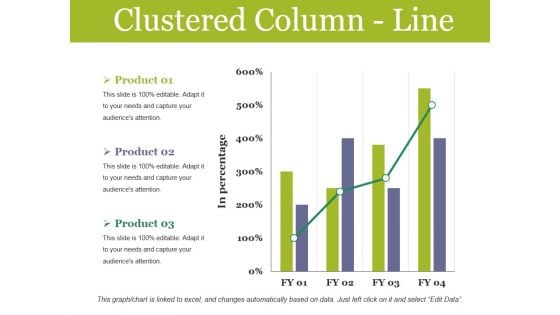
Clustered Column Line Ppt PowerPoint Presentation Infographics Graphics Design
This is a clustered column line ppt powerpoint presentation infographics graphics design. This is a three stage process. The stages in this process are finance, marketing, business, analysis, management.
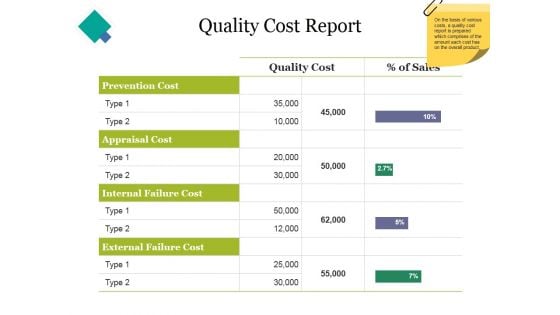
Quality Cost Report Ppt PowerPoint Presentation Styles Graphics Example
This is a quality cost report ppt powerpoint presentation styles graphics example. This is a five stage process. The stages in this process are finance, business, analysis, marketing, strategy.
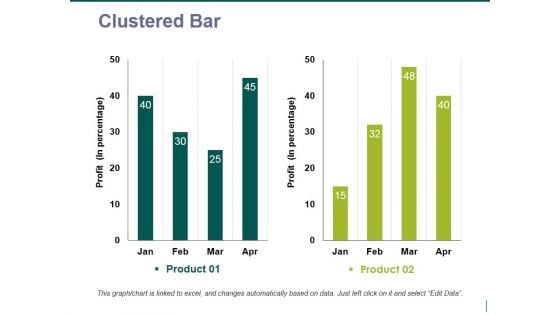
clustered bar ppt powerpoint presentation model display
This is a clustered bar ppt powerpoint presentation model display. This is a two stage process. The stages in this process are clustered bar, finance, marketing, strategy, analysis, business.
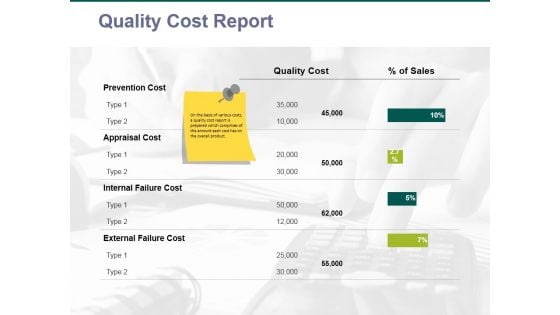
quality cost report ppt powerpoint presentation inspiration images
This is a quality cost report ppt powerpoint presentation inspiration images. This is a five stage process. The stages in this process are business, finance, marketing, analysis, quality cost.
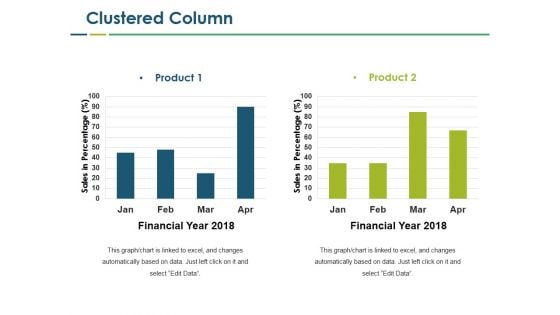
Clustered Column Ppt PowerPoint Presentation Slides Microsoft
This is a clustered column ppt powerpoint presentation slides microsoft. This is a two stage process. The stages in this process are clustered column, finance, marketing, strategy, analysis, business.
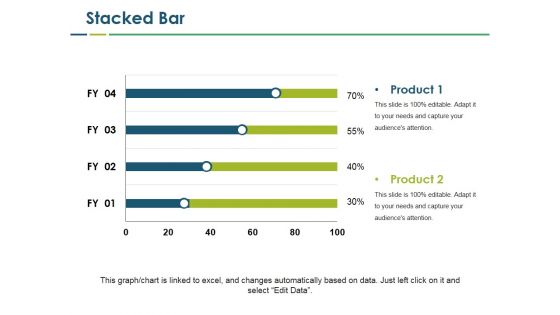
Stacked Bar Ppt PowerPoint Presentation Professional Clipart Images
This is a stacked bar ppt powerpoint presentation professional clipart images. This is a two stage process. The stages in this process are stacked bar, finance, marketing, strategy, business.
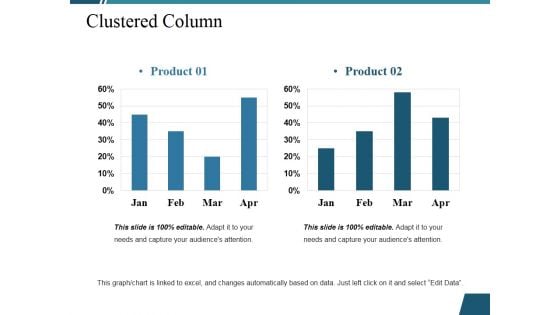
Clustered Column Ppt PowerPoint Presentation Infographic Template Slide Portrait
This is a clustered column ppt powerpoint presentation infographic template slide portrait. This is a two stage process. The stages in this process are clustered column, finance, marketing, strategy, analysis, business.
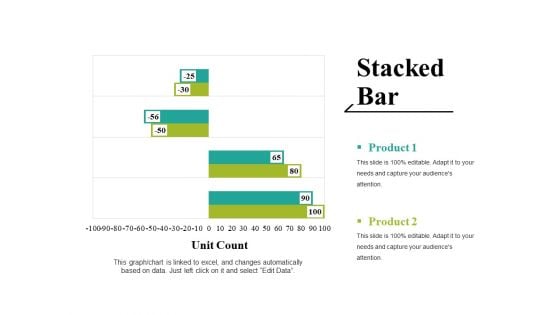
Stacked Bar Ppt PowerPoint Presentation Ideas Graphics Tutorials
This is a stacked bar ppt powerpoint presentation ideas graphics tutorials. This is a two stage process. The stages in this process are unit count, graph, business, marketing, strategy.
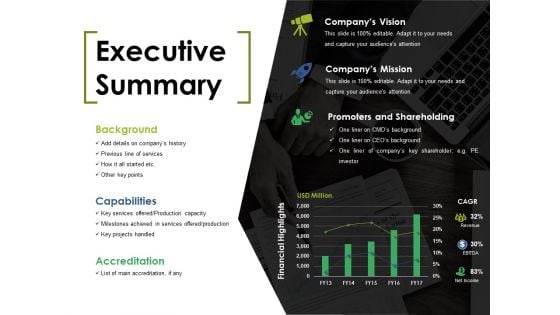
Executive Summary Ppt PowerPoint Presentation Summary Grid
This is a executive summary ppt powerpoint presentation summary grid. This is a three stage process. The stages in this process are background, capabilities, accreditation, company s mission, promoters and shareholding.
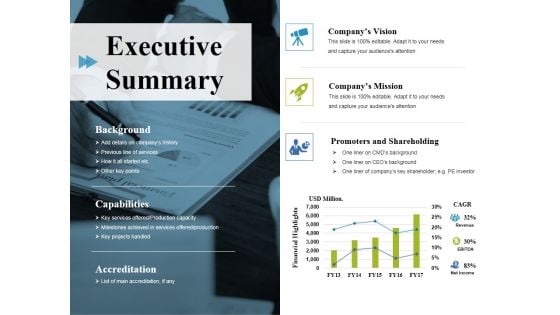
Executive Summary Ppt PowerPoint Presentation Ideas Master Slide
This is a executive summary ppt powerpoint presentation ideas master slide. This is a three stage process. The stages in this process are companys vision, companys mission, promoters and shareholding.
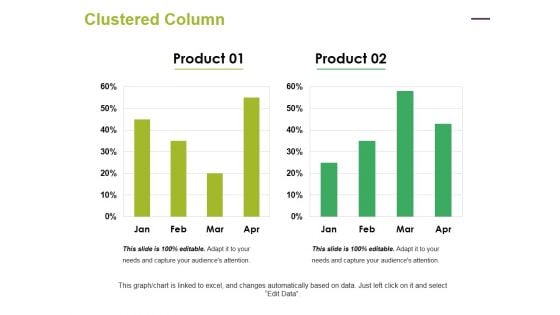
Clustered Column Ppt PowerPoint Presentation Summary Clipart
This is a clustered column ppt powerpoint presentation summary clipart. This is a two stage process. The stages in this process are clustered column, finance, marketing, strategy, analysis, business.
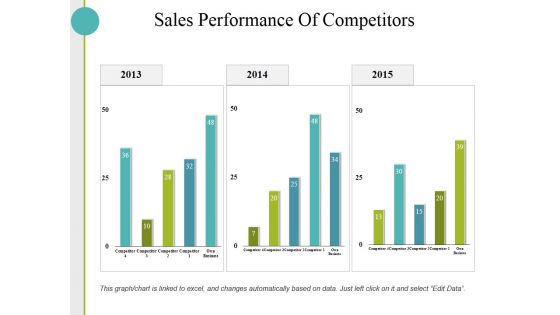
Sales Performance Of Competitors Ppt PowerPoint Presentation Show Graphics Download
This is a sales performance of competitors ppt powerpoint presentation show graphics download. This is a three stage process. The stages in this process are business, finance, marketing, strategy, sales.
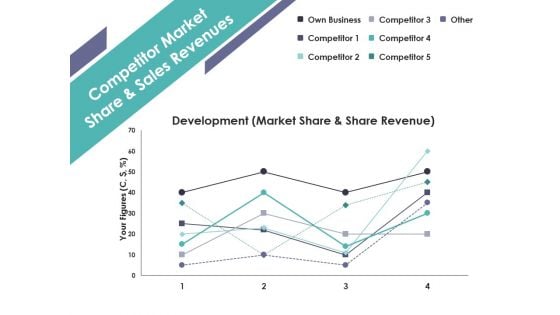
Competitor Market Share And Sales Revenues Ppt PowerPoint Presentation Model Graphics Example
This is a competitor market share and sales revenues ppt powerpoint presentation model graphics example. This is a four stage process. The stages in this process are business, marketing, strategy, finance, planning.
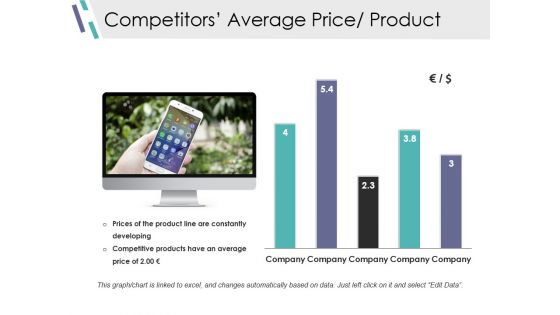
Competitors Average Price Product Ppt PowerPoint Presentation File Show
This is a competitors average price product ppt powerpoint presentation file show. This is a two stage process. The stages in this process are bar graph, marketing, strategy, finance, planning.
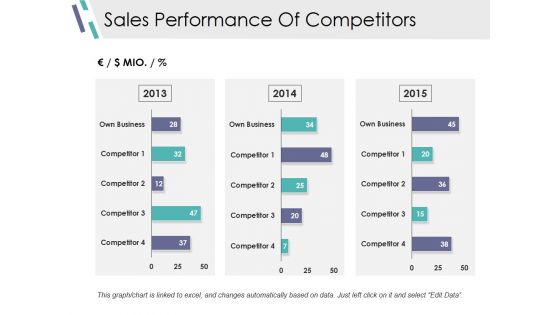
Sales Performance Of Competitors Ppt PowerPoint Presentation Ideas Graphics Example
This is a sales performance of competitors ppt powerpoint presentation ideas graphics example. This is a three stage process. The stages in this process are business, marketing, strategy, finance, planning.
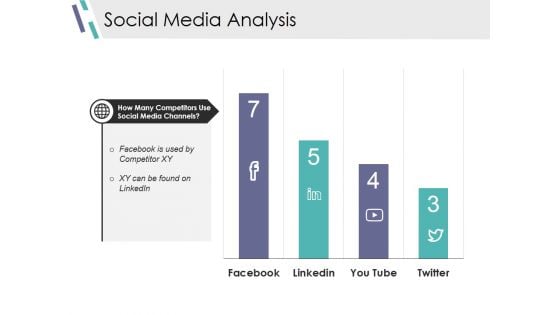
Social Media Analysis Ppt PowerPoint Presentation Model Portfolio
This is a social media analysis ppt powerpoint presentation model portfolio. This is a four stage process. The stages in this process are bar graph, marketing, strategy, finance, planning.
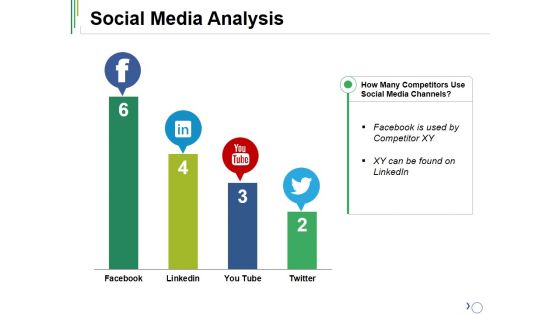
Social Media Analysis Ppt PowerPoint Presentation Visual Aids Layouts
This is a social media analysis ppt powerpoint presentation visual aids layouts. This is a four stage process. The stages in this process are facebook, linked in, you tube, twitter.
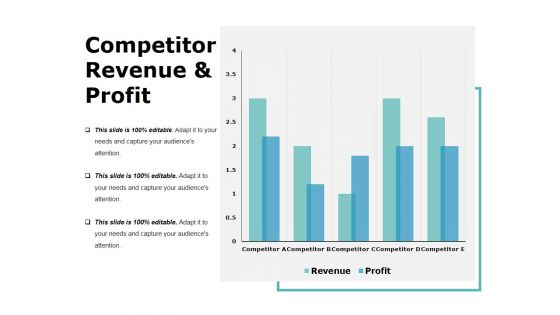
Competitor Revenue And Profit Template 1 Ppt PowerPoint Presentation Layouts Display
This is a competitor revenue and profit template 1 ppt powerpoint presentation layouts display. This is a five stage process. The stages in this process are business, bar graph, finance, marketing, analysis.
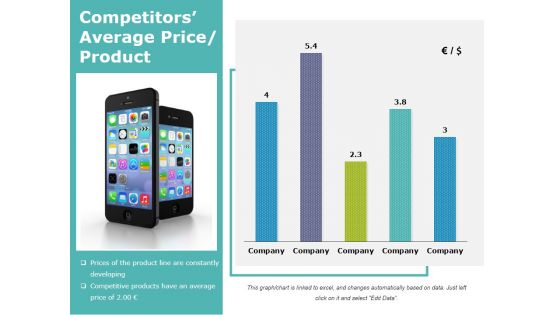
Competitors Average Price Product Ppt PowerPoint Presentation Ideas Layouts
This is a competitors average price product ppt powerpoint presentation ideas layouts. This is a five stage process. The stages in this process are business, bar graph, finance, marketing, analysis.
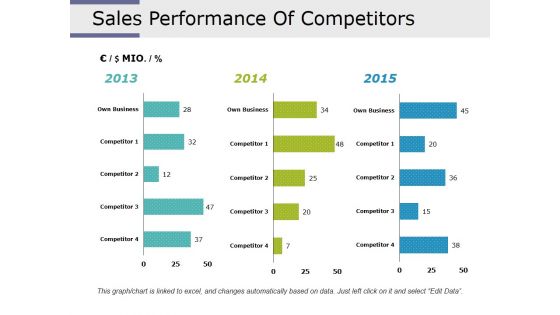
Sales Performance Of Competitors Ppt PowerPoint Presentation Styles Picture
This is a sales performance of competitors ppt powerpoint presentation styles picture. This is a three stage process. The stages in this process are business, finance, analysis, marketing, strategy.
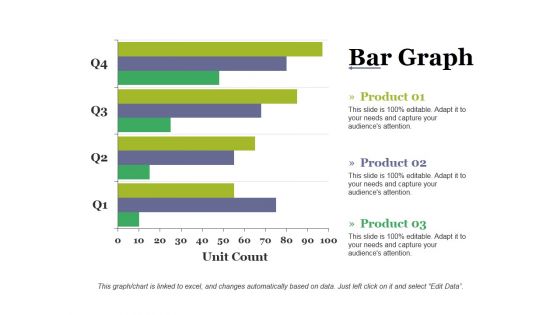
Bar Graph Template 2 Ppt PowerPoint Presentation Inspiration Backgrounds
This is a bar graph template 2 ppt powerpoint presentation inspiration backgrounds. This is a four stage process. The stages in this process are bar graph, finance, analysis, marketing, strategy.
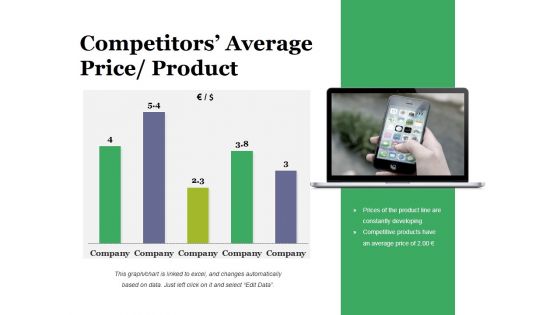
Competitors Average Price Product Ppt PowerPoint Presentation Styles Ideas
This is a competitors average price product ppt powerpoint presentation styles ideas. This is a five stage process. The stages in this process are business, bar graph, finance, marketing, strategy, analysis.
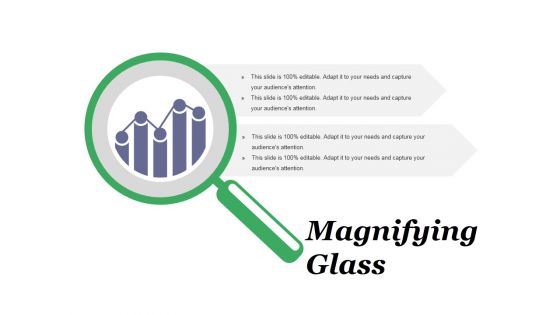
Magnifying Glass Ppt PowerPoint Presentation Infographic Template Example File
This is a magnifying glass ppt powerpoint presentation infographic template example file. This is a two stage process. The stages in this process are magnifying glass, gears, technology, marketing, strategy, business.
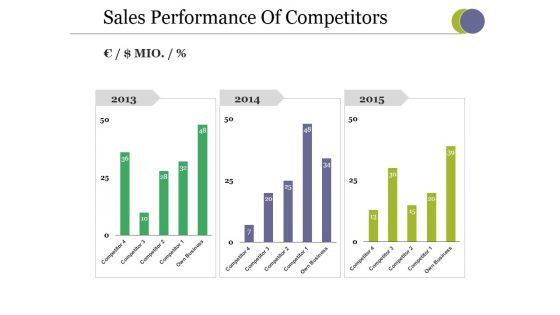
Sales Performance Of Competitors Ppt PowerPoint Presentation Pictures Gallery
This is a sales performance of competitors ppt powerpoint presentation pictures gallery. This is a three stage process. The stages in this process are business, finance, analysis, marketing, strategy.
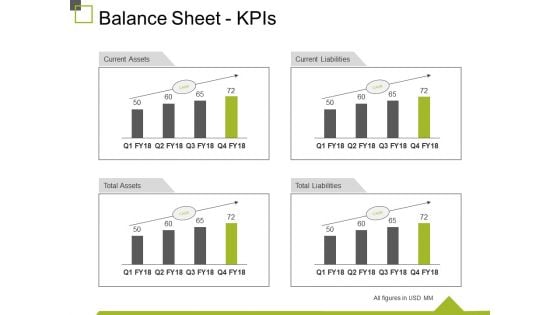
Balance Sheet Kpis Ppt PowerPoint Presentation Visual Aids Inspiration
This is a balance sheet kpis ppt powerpoint presentation visual aids inspiration. This is a four stage process. The stages in this process are current assets, current liabilities, total liabilities, total assets, business.
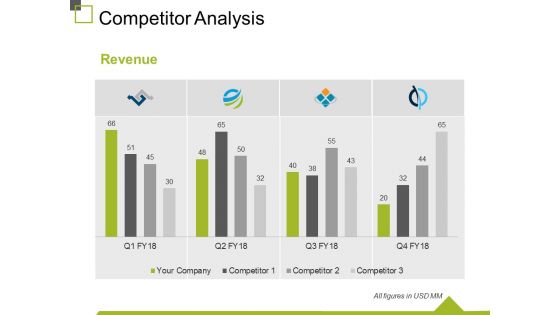
Competitor Analysis Template 1 Ppt PowerPoint Presentation File Grid
This is a competitor analysis template 1 ppt powerpoint presentation file grid. This is a four stage process. The stages in this process are finance, marketing, business, graph, analysis, revenue.
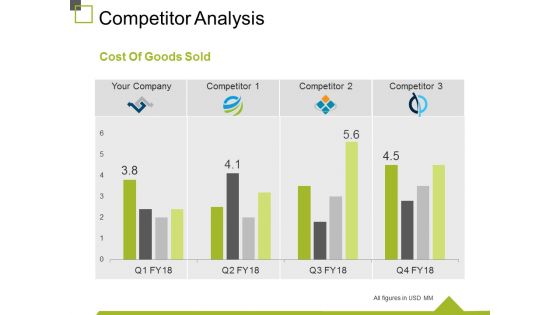
Competitor Analysis Template 3 Ppt PowerPoint Presentation Inspiration Visuals
This is a competitor analysis template 3 ppt powerpoint presentation inspiration visuals. This is a four stage process. The stages in this process are business, marketing, cost of goods sold, analysis, graph.
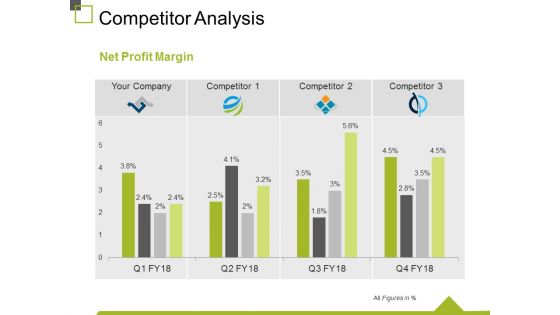
Competitor Analysis Template 4 Ppt PowerPoint Presentation Gallery Design Templates
This is a competitor analysis template 4 ppt powerpoint presentation gallery design templates. This is a four stage process. The stages in this process are business, marketing, analysis, graph, net profit margin.
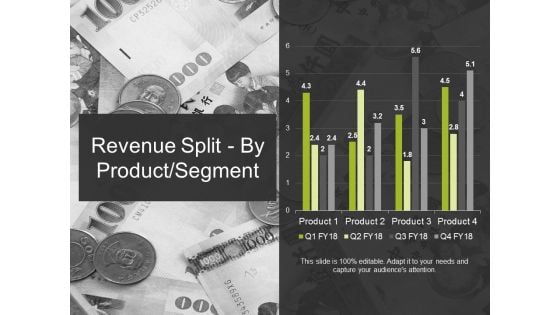
Revenue Split By Product Segment Template 2 Ppt PowerPoint Presentation Ideas Graphic Images
This is a revenue split by product segment template 2 ppt powerpoint presentation ideas graphic images. This is a four stage process. The stages in this process are business, marketing, finance, graph, strategy.

Budgeting Planned Actual Comparison Ppt PowerPoint Presentation Show Background Image
This is a budgeting planned actual comparison ppt powerpoint presentation show background image. This is a three stage process. The stages in this process are planned cost, actual cost, value difference, deviation.
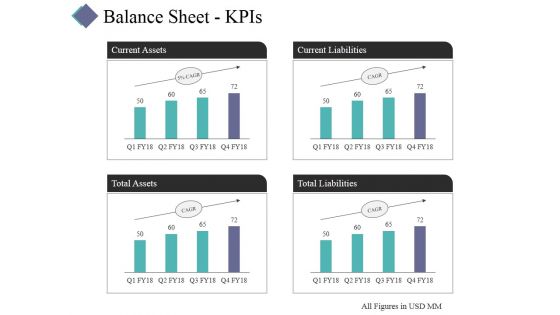
Balance Sheet Kpis Template 2 Ppt PowerPoint Presentation Ideas Show
This is a balance sheet kpis template 2 ppt powerpoint presentation ideas show. This is a four stage process. The stages in this process are current assets, total assets, total liabilities, current liabilities.
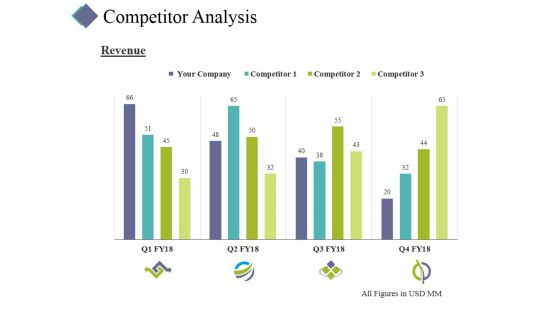
Competitor Analysis Template 1 Ppt PowerPoint Presentation Portfolio Inspiration
This is a competitor analysis template 1 ppt powerpoint presentation portfolio inspiration. This is a four stage process. The stages in this process are competitor, finance, marketing, strategy, analysis, business.
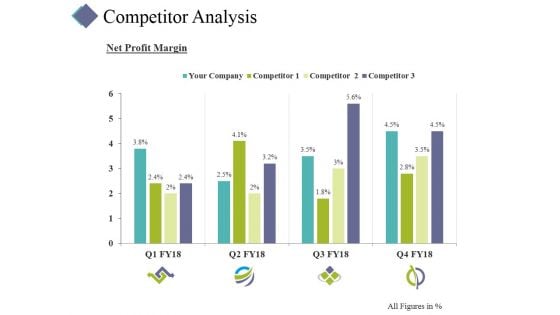
Competitor Analysis Template 4 Ppt PowerPoint Presentation Graphics
This is a competitor analysis template 4 ppt powerpoint presentation graphics. This is a four stage process. The stages in this process are competitor, finance, marketing, strategy, analysis, business.
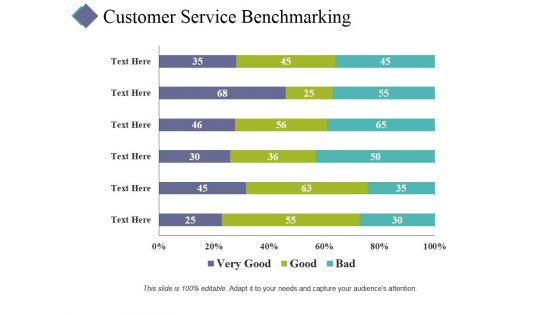
Customer Service Benchmarking Template 1 Ppt PowerPoint Presentation Infographic Template Shapes
This is a customer service benchmarking template 1 ppt powerpoint presentation infographic template shapes. This is a three stage process. The stages in this process are business, finance, marketing, strategy, analysis.
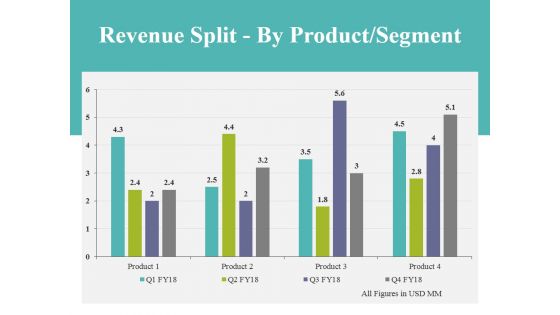
Revenue Split By Product Segment Template 2 Ppt PowerPoint Presentation Styles Guidelines
This is a revenue split by product segment template 2 ppt powerpoint presentation styles guidelines. This is a four stage process. The stages in this process are business, finance, analysis, marketing, strategy.
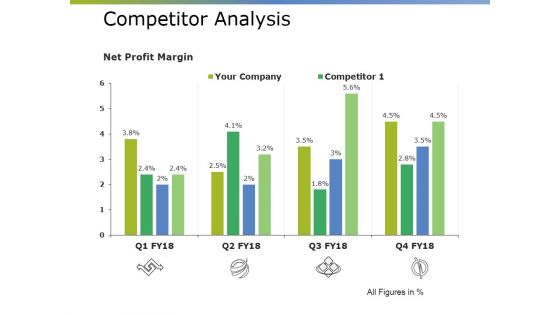
Competitor Analysis Template 2 Ppt PowerPoint Presentation File Graphics Template
This is a competitor analysis template 2 ppt powerpoint presentation file graphics template. This is a four stage process. The stages in this process are business, marketing, finance, planning, strategy.
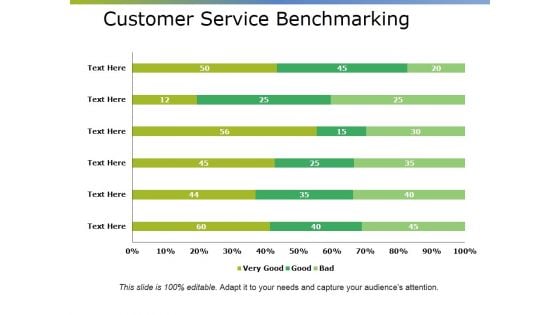
Customer Service Benchmarking Ppt PowerPoint Presentation Inspiration Graphics Example
This is a customer service benchmarking ppt powerpoint presentation inspiration graphics example. This is a one stage process. The stages in this process are business, marketing, finance, planning, strategy.
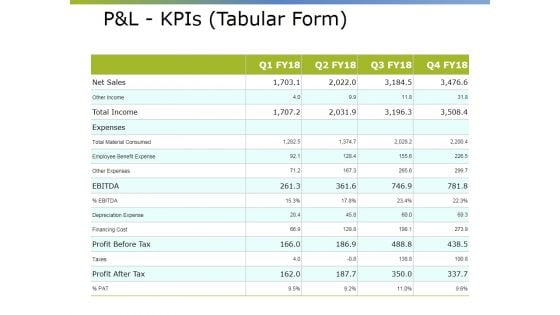
Pandl Kpis Tabular Form Ppt PowerPoint Presentation Pictures Visual Aids
This is a pandl kpis tabular form ppt powerpoint presentation pictures visual aids. This is a four stage process. The stages in this process are revenue, operating profit, cogs, net profit.
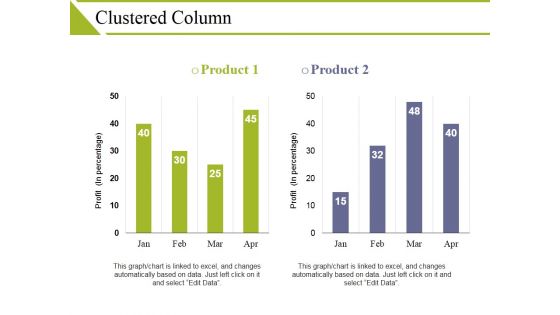
Clustered Column Ppt PowerPoint Presentation Visual Aids Show
This is a clustered column ppt powerpoint presentation visual aids show. This is a two stage process. The stages in this process are product, profit, business, bar graph, finance.
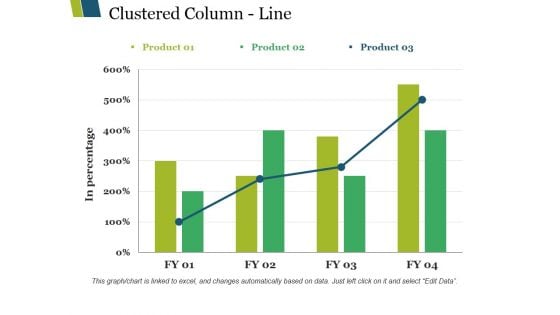
Clustered Column Line Ppt PowerPoint Presentation Infographics Background Images
This is a clustered column line ppt powerpoint presentation infographics background images. This is a three stage process. The stages in this process are clustered column line, finance, analysis, marketing, business.
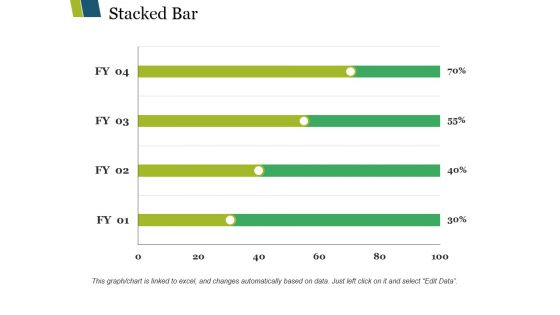
Stacked Bar Ppt PowerPoint Presentation Layouts Show
This is a stacked bar ppt powerpoint presentation layouts show. This is a four stage process. The stages in this process are stacked bar, finance, analysis, marketing, strategy, business.
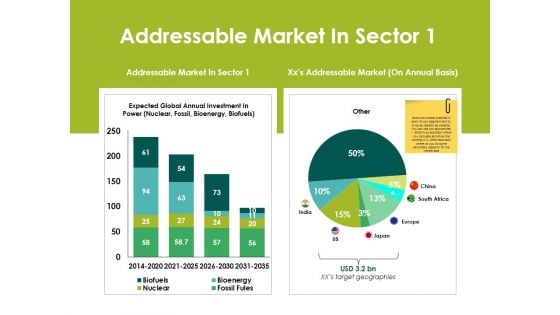
Addressable Market In Sector Ppt PowerPoint Presentation Layouts Designs
This is a addressable market in sector ppt powerpoint presentation layouts designs. This is a two stage process. The stages in this process are business, finance, marketing, strategy, investment.
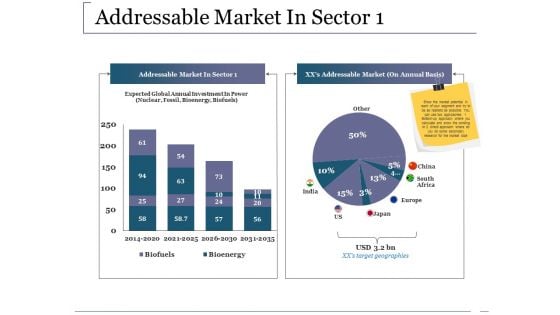
Addressable Market In Sector Ppt PowerPoint Presentation Ideas
This is a addressable market in sector ppt powerpoint presentation ideas. This is a two stage process. The stages in this process are business, addressable market in sector addressable market, south africa, europe.
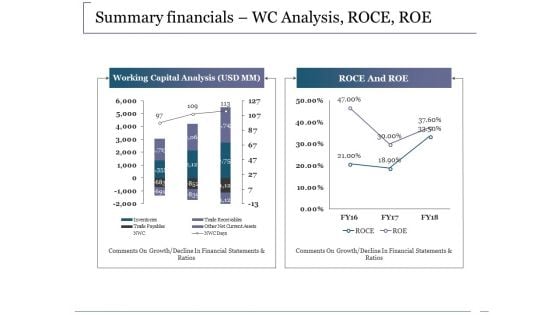
Summary Financials Wc Analysis Roce Roe Ppt PowerPoint Presentation Summary Picture
This is a summary financials wc analysis roce roe ppt powerpoint presentation summary picture. This is a two stage process. The stages in this process are business, marketing, working capital analysis, roce and roe, strategy.
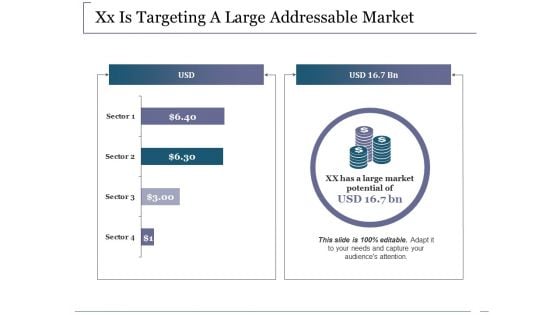
Xx Is Targeting A Large Addressable Market Ppt PowerPoint Presentation Portfolio File Formats
This is a xx is targeting a large addressable market ppt powerpoint presentation portfolio file formats. This is a two stage process. The stages in this process are usd, business, marketing, finance, graph, strategy.
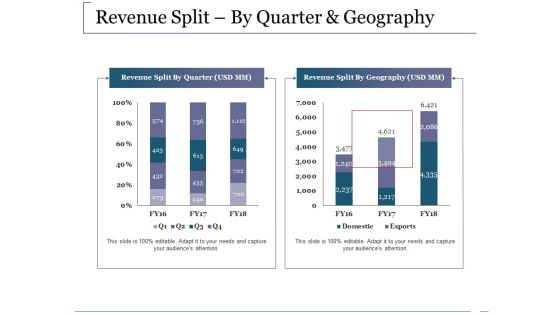
Revenue Split By Quarter And Geography Ppt PowerPoint Presentation Gallery Deck
This is a revenue split by quarter and geography ppt powerpoint presentation gallery deck. This is a two stage process. The stages in this process are business, marketing, graph, revenue split by quarter, revenue split by geography.
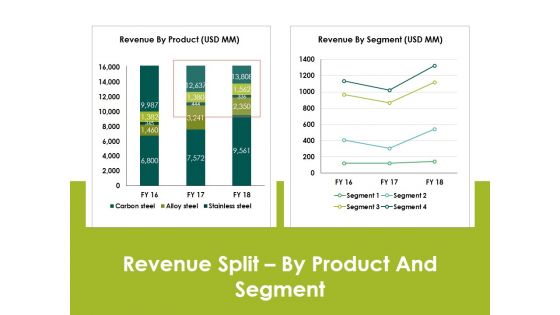
Revenue Splitby Product And Segment Ppt PowerPoint Presentation Styles Example File
This is a revenue splitby product and segment ppt powerpoint presentation styles example file. This is a two stage process. The stages in this process are revenue by product, revenue by segment, finance, strategy, business.
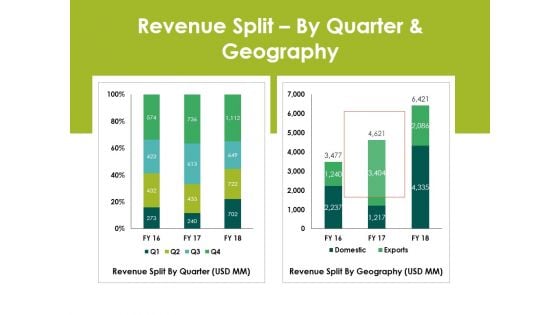
Revenue Splitby Quarter And Geography Ppt PowerPoint Presentation Layout
This is a revenue splitby quarter and geography ppt powerpoint presentation layout. This is a two stage process. The stages in this process are revenue split by quarter, revenue split by geography.
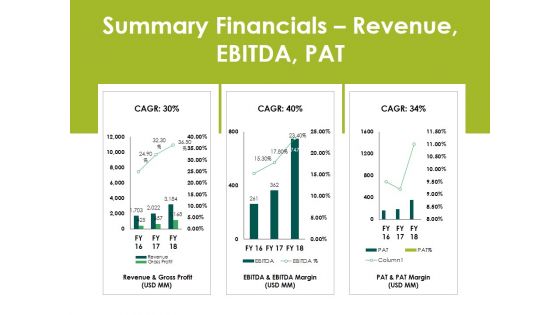
Summary Financials Revenue Ebitda Pat Ppt PowerPoint Presentation Infographics Ideas
This is a summary financials revenue ebitda pat ppt powerpoint presentation infographics ideas. This is a three stage process. The stages in this process are business, finance, analysis, marketing, strategy.
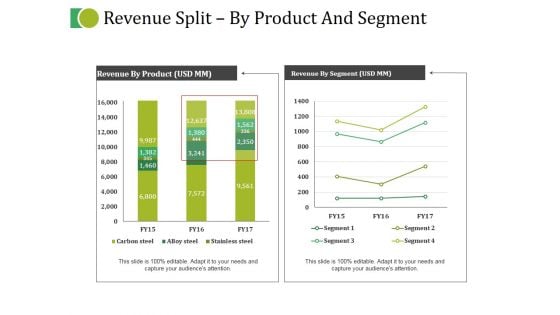
Revenue Split By Product And Segment Ppt PowerPoint Presentation Summary Portfolio
This is a revenue split by product and segment ppt powerpoint presentation summary portfolio. This is a two stage process. The stages in this process are business, marketing, strategy, planning, finance.
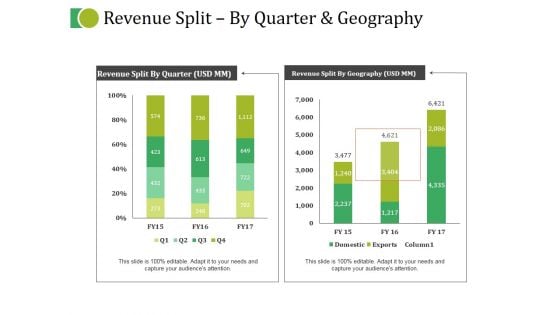
Revenue Split By Quarter And Geography Ppt PowerPoint Presentation Layouts Templates
This is a revenue split by quarter and geography ppt powerpoint presentation layouts templates. This is a two stage process. The stages in this process are business, marketing, strategy, planning, finance.
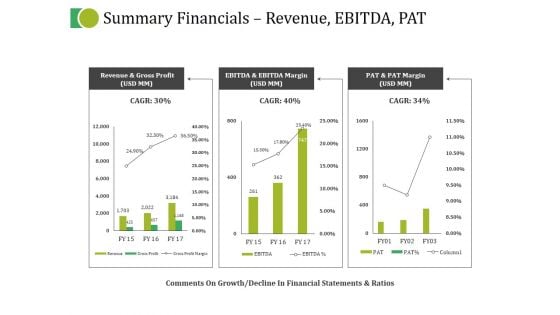
Summary Financials Revenue Ebitda Pat Ppt PowerPoint Presentation Infographics Inspiration
This is a summary financials revenue ebitda pat ppt powerpoint presentation infographics inspiration. This is a three stage process. The stages in this process are business, marketing, strategy, planning, finance.
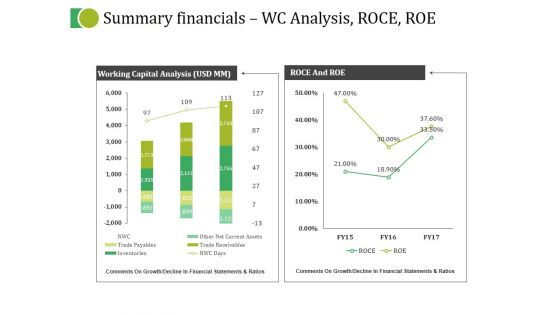
Summary Financials Wc Analysis Roce Roe Ppt PowerPoint Presentation Summary Example File
This is a summary financials wc analysis roce roe ppt powerpoint presentation summary example file. This is a two stage process. The stages in this process are business, marketing, strategy, planning, finance.
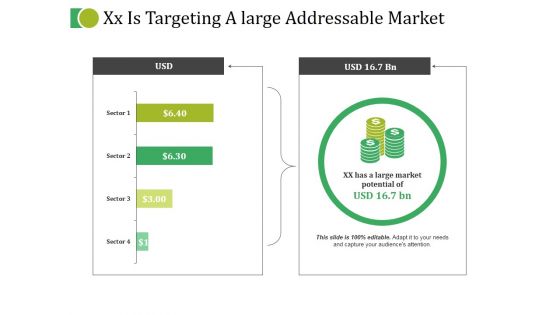
Xx Is Targeting A Large Addressable Market Ppt PowerPoint Presentation Ideas Aids
This is a xx is targeting a large addressable market ppt powerpoint presentation ideas aids. This is a two stage process. The stages in this process are business, marketing, strategy, planning, finance.
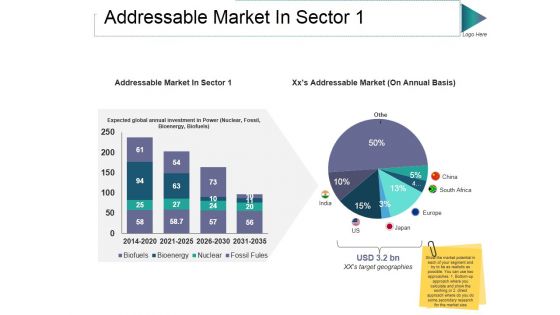
Addressable Market In Sector 1 Ppt PowerPoint Presentation Styles Aids
This is a addressable market in sector 1 ppt powerpoint presentation styles aids. This is a two stage process. The stages in this process are biofuels, bioenergy, nuclear, fossil fuels, addressable market in sector.
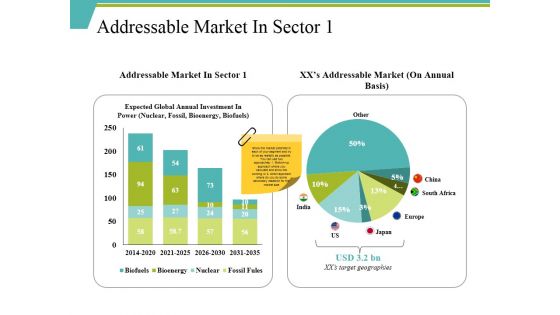
Addressable Market In Sector 1 Ppt PowerPoint Presentation Infographics Show
This is a addressable market in sector 1 ppt powerpoint presentation infographics show. This is a two stage process. The stages in this process are india, japan, europe, south africa, us.

Competitor Market Share And Sales Revenues Ppt PowerPoint Presentation Gallery Gridlines
This is a competitor market share and sales revenues ppt powerpoint presentation gallery gridlines. This is a three stage process. The stages in this process are line, marketing, strategy, planning, finance.
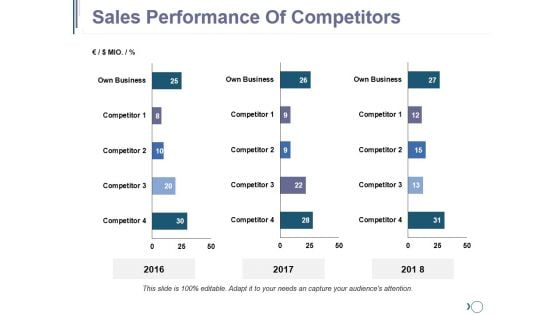
Sales Performance Of Competitors Ppt PowerPoint Presentation Summary Grid
This is a sales performance of competitors ppt powerpoint presentation summary grid. This is a three stage process. The stages in this process are finance, planning, business, marketing, strategy.
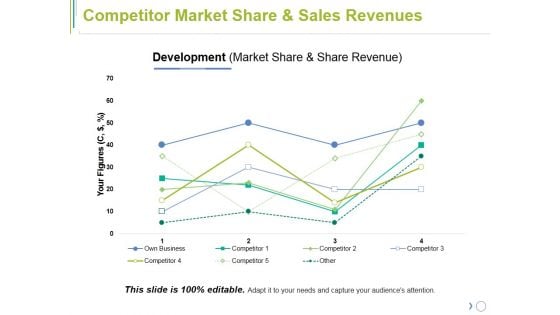
Competitor Market Share And Sales Revenues Ppt PowerPoint Presentation Portfolio Summary
This is a competitor market share and sales revenues ppt powerpoint presentation portfolio summary. This is a four stage process. The stages in this process are business, marketing, strategy, planning, finance.
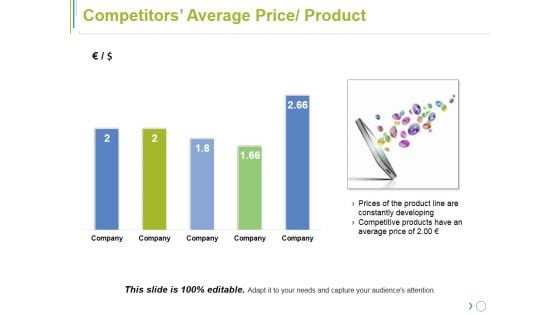
Competitors Average Price Product Ppt PowerPoint Presentation Visual Aids Summary
This is a competitors average price product ppt powerpoint presentation visual aids summary. This is a five stage process. The stages in this process are business, marketing, strategy, planning, finance.
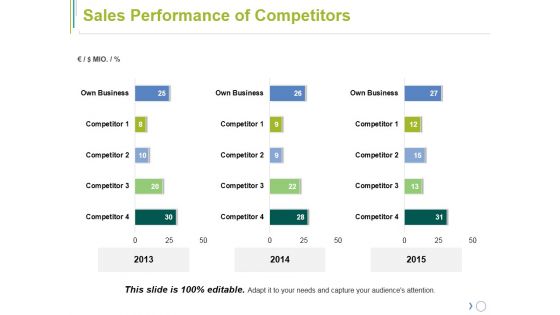
Sales Performance Of Competitors Ppt PowerPoint Presentation Pictures Mockup
This is a sales performance of competitors ppt powerpoint presentation pictures mockup. This is a three stage process. The stages in this process are finance, marketing, strategy, planning, gears.
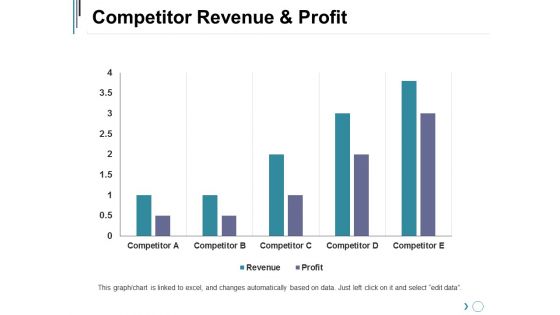
Competitor Revenue And Profit Ppt PowerPoint Presentation Professional Graphics Pictures
This is a competitor revenue and profit ppt powerpoint presentation professional graphics pictures. This is a five stage process. The stages in this process are business, marketing, strategy, graph, finance.
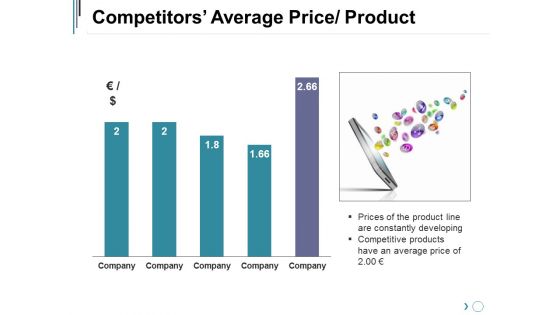
Competitors Average Price Product Ppt PowerPoint Presentation Summary Deck
This is a competitors average price product ppt powerpoint presentation summary deck. This is a five stage process. The stages in this process are business, marketing, strategy, graph, finance.
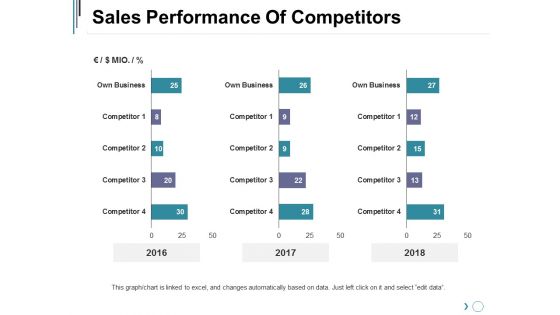
Sales Performance Of Competitors Ppt PowerPoint Presentation Inspiration Slideshow
This is a sales performance of competitors ppt powerpoint presentation inspiration slideshow. This is a three stage process. The stages in this process are business, marketing, graph, finance, years.
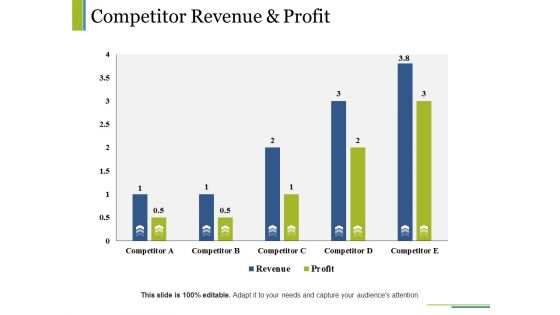
Competitor Revenue And Profit Ppt PowerPoint Presentation Slides Objects
This is a competitor revenue and profit ppt powerpoint presentation slides objects. This is a five stage process. The stages in this process are business, marketing, graph, finance, revenue.
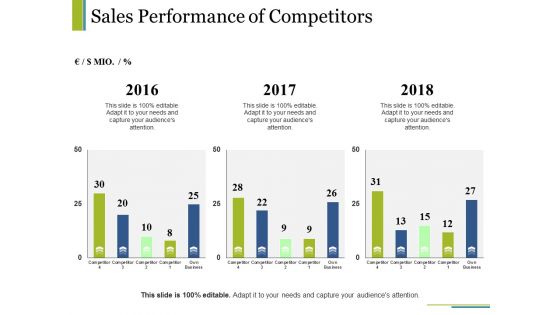
Sales Performance Of Competitors Ppt PowerPoint Presentation Portfolio Templates
This is a sales performance of competitors ppt powerpoint presentation portfolio templates. This is a three stage process. The stages in this process are business, marketing, percentage, graph, finance.
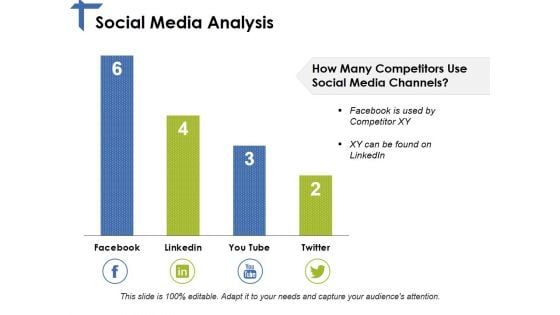
Social Media Analysis Ppt PowerPoint Presentation Model File Formats
This is a social media analysis ppt powerpoint presentation model file formats. This is a four stage process. The stages in this process are facebook, you tube, twitter, linkedin.
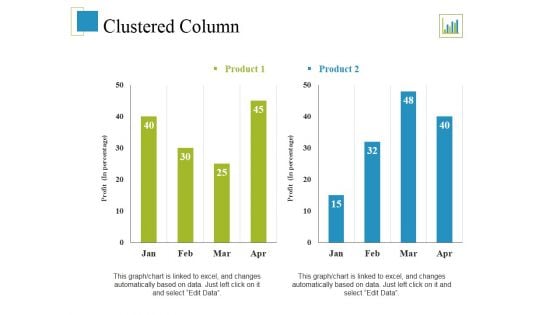
Clustered Column Ppt PowerPoint Presentation Summary Template
This is a clustered column ppt powerpoint presentation summary template. This is a two stage process. The stages in this process are clustered column, finance, marketing, analysis, strategy, business.
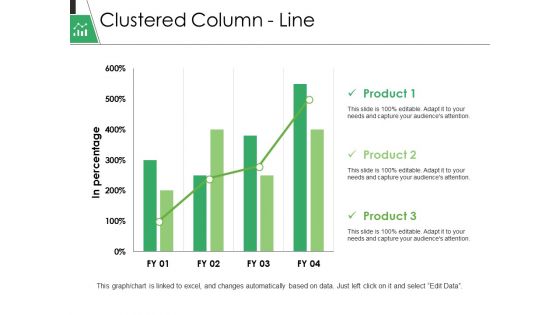
Clustered Column Line Ppt PowerPoint Presentation Pictures Objects
This is a clustered column line ppt powerpoint presentation pictures objects. This is a three stage process. The stages in this process are in percentage, business, marketing, graph, finance.
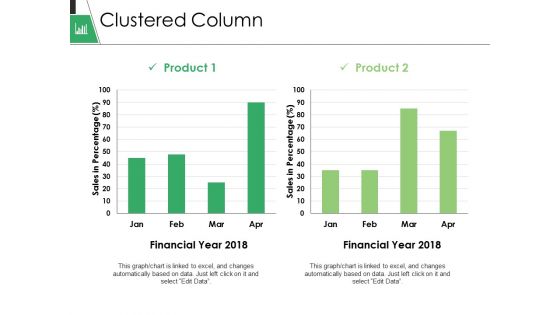
Clustered Column Ppt PowerPoint Presentation Gallery Format
This is a clustered column ppt powerpoint presentation gallery format. This is a two stage process. The stages in this process are business, marketing, graph, financial year, sales in percentage.
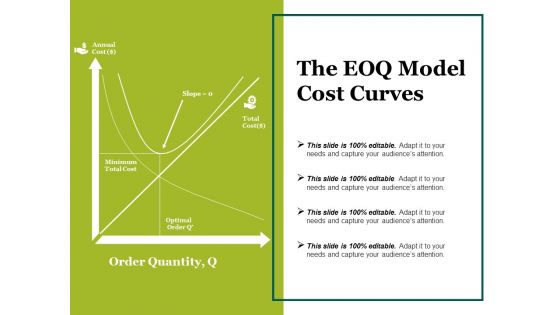
The Eoq Model Cost Curves Ppt PowerPoint Presentation Pictures Template
This is a the eoq model cost curves ppt powerpoint presentation pictures template. This is a four stage process. The stages in this process are minimum, total cost, slope, total cost, optimal order.
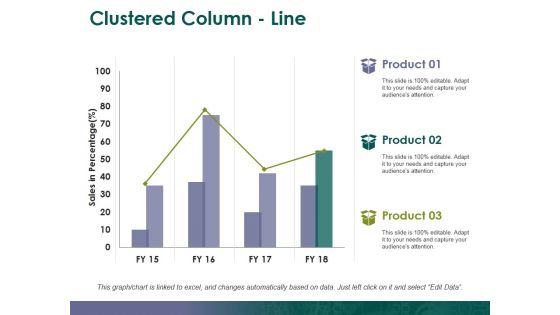
Clustered Column Line Ppt PowerPoint Presentation Summary Slide
This is a clustered column line ppt powerpoint presentation summary slide. This is a three stage process. The stages in this process are clustered column, finance, analysis, strategy, business.
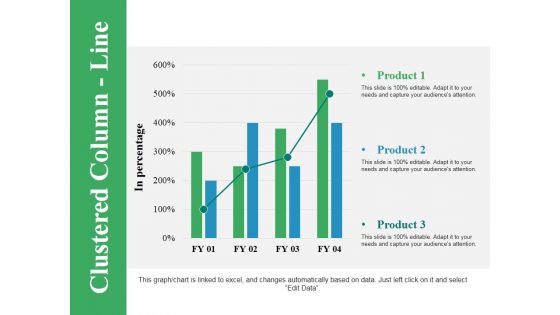
Clustered Column Line Ppt PowerPoint Presentation Pictures Model
This is a clustered column line ppt powerpoint presentation pictures model. This is a three stage process. The stages in this process are bar graph, finance, marketing, strategy, business.
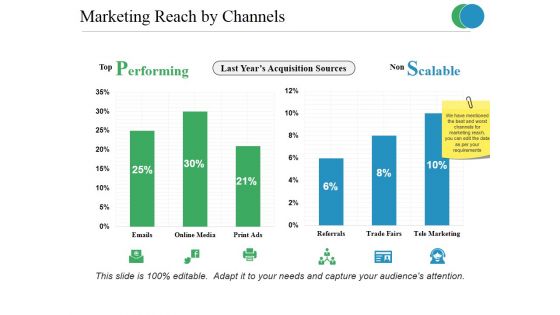
Marketing Reach By Channels Ppt PowerPoint Presentation Infographic Template Background
This is a marketing reach by channels ppt powerpoint presentation infographic template background. This is a two stage process. The stages in this process are performing, scalable, finance, marketing, strategy, business.
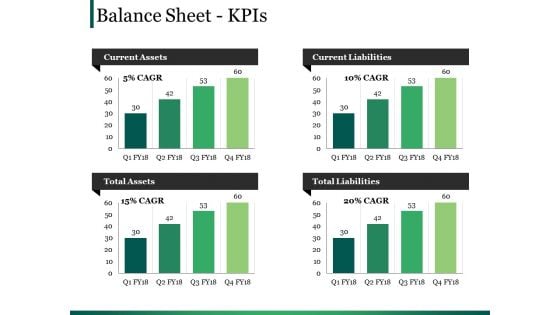
Balance Sheet Kpis Ppt PowerPoint Presentation Layouts Design Ideas
This is a balance sheet kpis ppt powerpoint presentation layouts design ideas. This is a four stage process. The stages in this process are current assets, current liabilities, total assets, total liabilities.
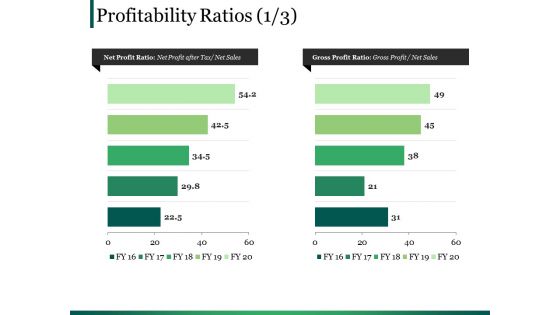
Profitability Ratios Template 1 Ppt PowerPoint Presentation Portfolio Display
This is a profitability ratios template 1 ppt powerpoint presentation portfolio display. This is a two stage process. The stages in this process are business, marketing, bar, finance, planning.
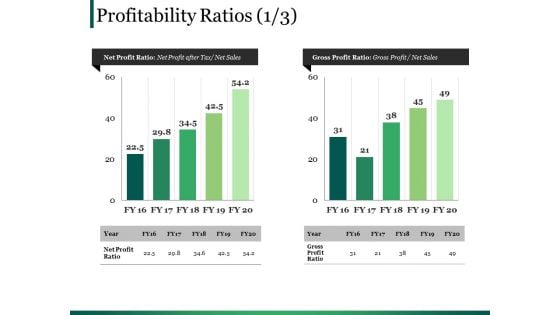
Profitability Ratios Template 2 Ppt PowerPoint Presentation Summary Graphics
This is a profitability ratios template 2 ppt powerpoint presentation summary graphics. This is a two stage process. The stages in this process are business, marketing, bar, finance, planning.
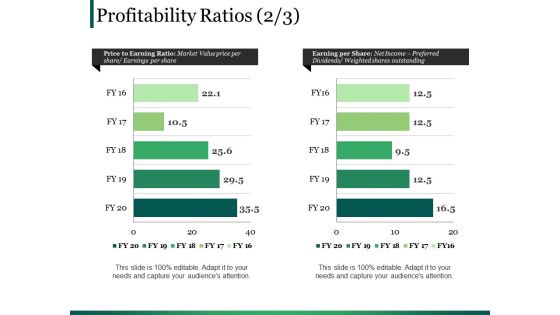
Profitability Ratios Template 3 Ppt PowerPoint Presentation Slides Good
This is a profitability ratios template 3 ppt powerpoint presentation slides good. This is a two stage process. The stages in this process are business, marketing, bar, finance, planning.
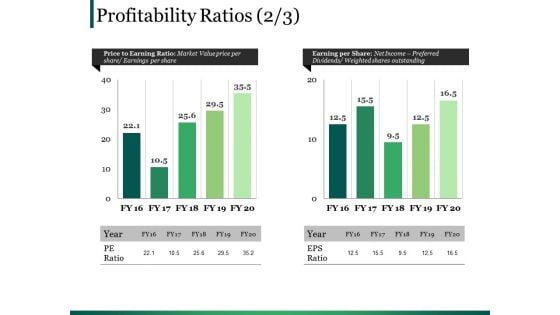
Profitability Ratios Template 4 Ppt PowerPoint Presentation Infographic Template Clipart Images
This is a profitability ratios template 4 ppt powerpoint presentation infographic template clipart images. This is a two stage process. The stages in this process are business, marketing, bar, finance, planning.
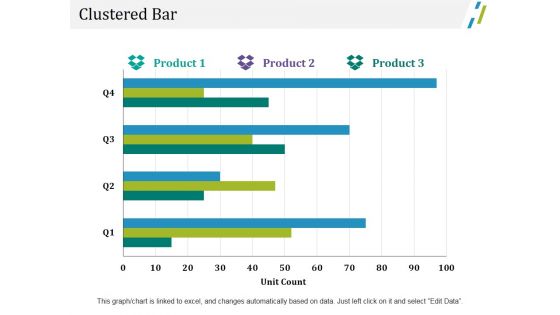
Clustered Bar Ppt PowerPoint Presentation Portfolio Graphic Images
This is a clustered bar ppt powerpoint presentation portfolio graphic images. This is a three stage process. The stages in this process are business, unit count, finance, marketing, graph.
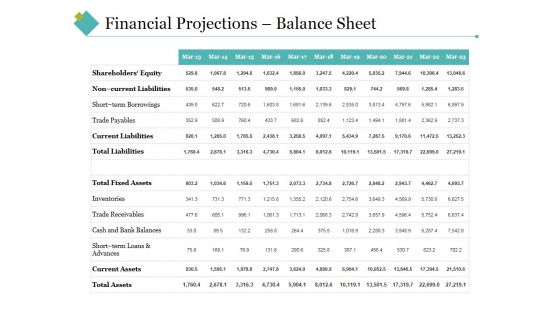
Financial Projections Balance Sheet Ppt PowerPoint Presentation Infographics Clipart Images
This is a financial projections balance sheet ppt powerpoint presentation infographics clipart images. This is a two stage process. The stages in this process are total liabilities, total fixed assets, trade receivables, total assets, inventories.
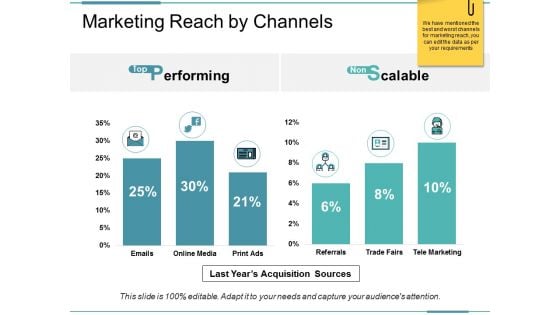
Marketing Reach By Channels Ppt PowerPoint Presentation Pictures Template
This is a marketing reach by channels ppt powerpoint presentation pictures template. This is a two stage process. The stages in this process are performing, scalable, last years acquisition sources.
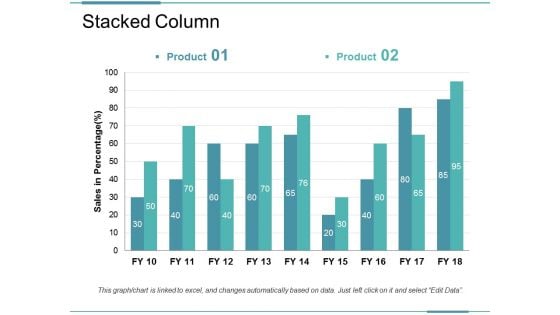
Stacked Column Ppt PowerPoint Presentation Infographic Template Example Introduction
This is a stacked column ppt powerpoint presentation infographic template example introduction. This is a two stage process. The stages in this process are business, marketing, strategy, planning, finance.
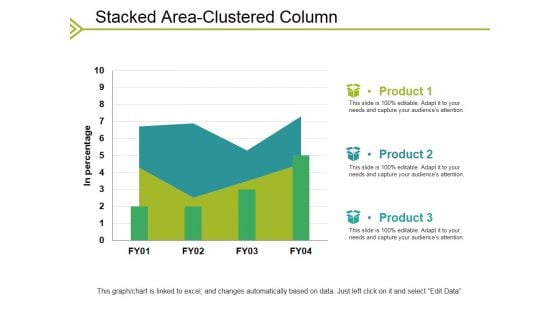
Stacked Area Clustered Column Ppt PowerPoint Presentation Gallery Images
This is a stacked area clustered column ppt powerpoint presentation gallery images. This is a three stage process. The stages in this process are business, in percentage, marketing, strategy, graph.
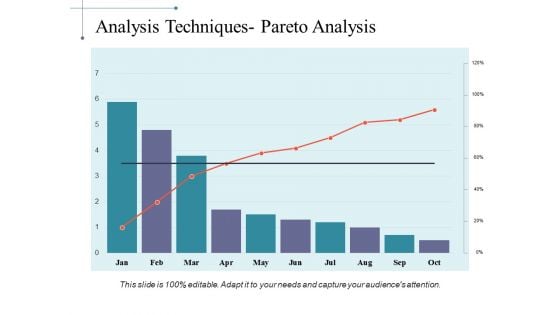
Analysis Techniques Pareto Analysis Ppt PowerPoint Presentation Layouts Ideas
This is a analysis techniques pareto analysis ppt powerpoint presentation layouts ideas. This is a ten stage process. The stages in this process are business, marketing, strategy, finance, analysis.
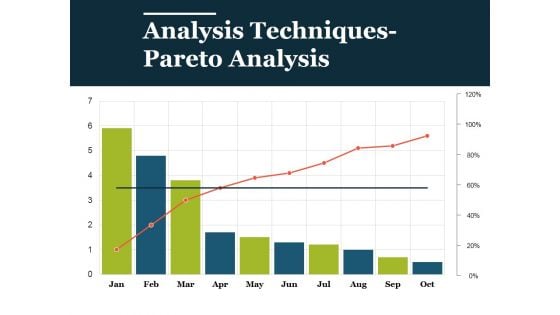
Analysis Techniques Pareto Analysis Ppt PowerPoint Presentation Summary Design Templates
This is a analysis techniques pareto analysis ppt powerpoint presentation summary design templates. This is a ten stage process. The stages in this process are analysis, business, marketing, finance, strategy.
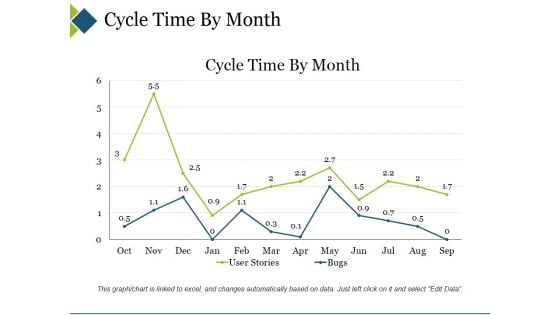
Cycle Time By Month Ppt PowerPoint Presentation Slides Ideas
This is a cycle time by month ppt powerpoint presentation slides ideas. This is a two stage process. The stages in this process are business, marketing, cycle time by month, finance, graph.
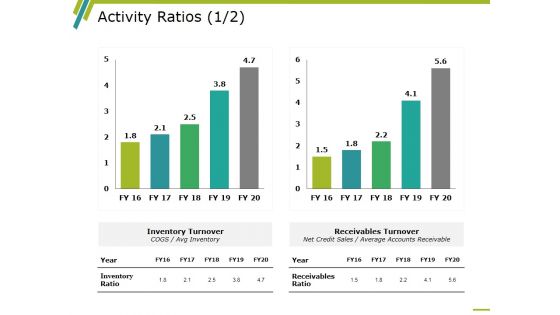
Activity Ratios Template 1 Ppt PowerPoint Presentation Slides Example Topics
This is a activity ratios template 1 ppt powerpoint presentation slides example topics. This is a two stage process. The stages in this process are business, finance, strategy, marketing, analysis.
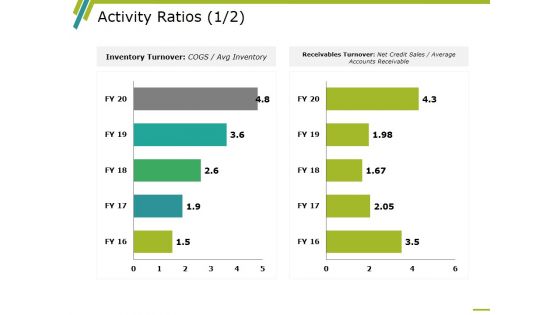
Activity Ratios Template 2 Ppt PowerPoint Presentation Summary Background Images
This is a activity ratios template 2 ppt powerpoint presentation summary background images. This is a two stage process. The stages in this process are business, finance, strategy, marketing, analysis.
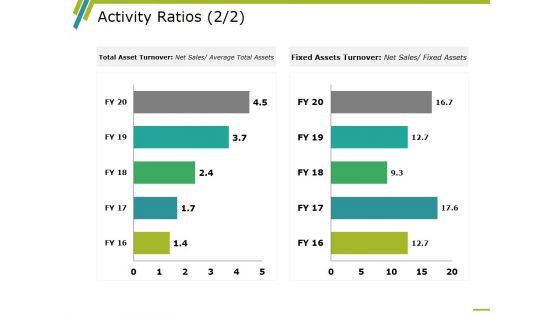
Activity Ratios Template 3 Ppt PowerPoint Presentation Professional Graphic Tips
This is a activity ratios template 3 ppt powerpoint presentation professional graphic tips. This is a two stage process. The stages in this process are business, finance, marketing, strategy, analysis.
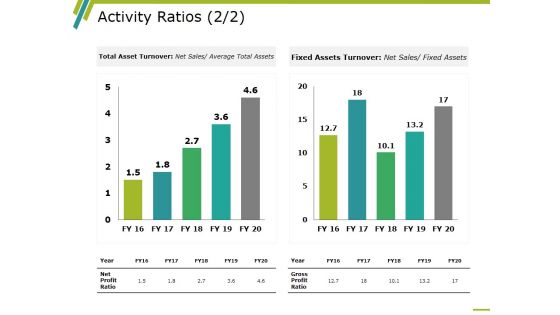
Activity Ratios Template 4 Ppt PowerPoint Presentation Gallery Slides
This is a activity ratios template 4 ppt powerpoint presentation gallery slides. This is a two stage process. The stages in this process are business, finance, marketing, strategy, analysis.
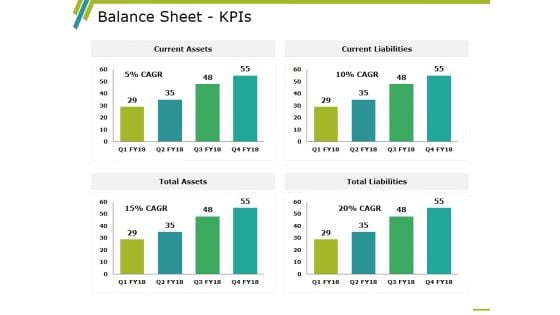
Balance Sheet Kpis Template 3 Ppt PowerPoint Presentation Infographic Template Demonstration
This is a balance sheet kpis template 3 ppt powerpoint presentation infographic template demonstration. This is a four stage process. The stages in this process are balance sheet, finance, marketing, strategy, analysis.
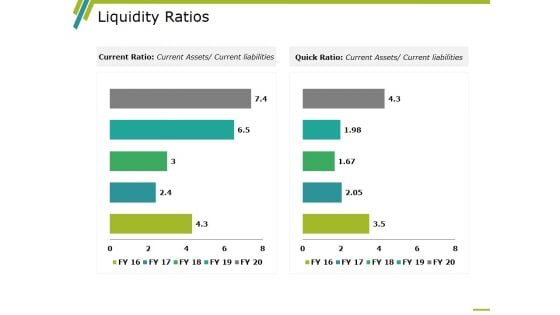
Liquidity Ratios Template 2 Ppt PowerPoint Presentation Ideas Microsoft
This is a liquidity ratios template 2 ppt powerpoint presentation ideas microsoft. This is a two stage process. The stages in this process are business, marketing, graph, year, current ratio, quick ratio.
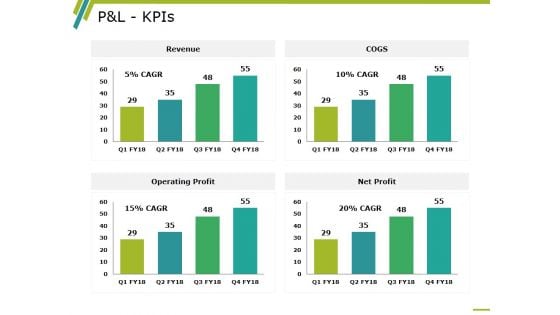
P And L Kpis Template 2 Ppt PowerPoint Presentation Professional Information
This is a p and l kpis template 2 ppt powerpoint presentation professional information. This is a four stage process. The stages in this process are revenue, operating profit, cogs, net profit, business.
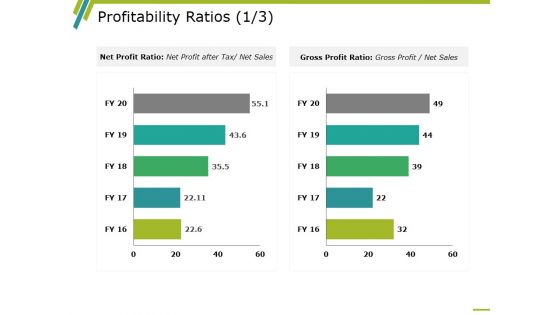
Profitability Ratios Template 1 Ppt PowerPoint Presentation Ideas Master Slide
This is a profitability ratios template 1 ppt powerpoint presentation ideas master slide. This is a two stage process. The stages in this process are business, net profit ratio, gross profit ratio, marketing, graph.
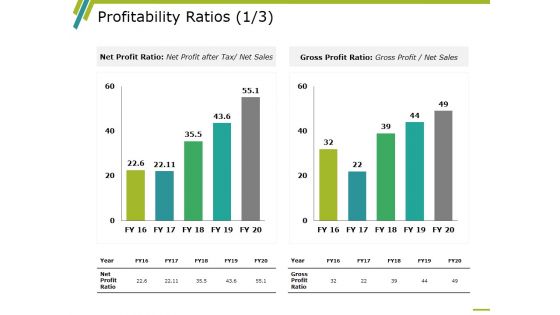
Profitability Ratios Template 2 Ppt PowerPoint Presentation Show Portfolio
This is a profitability ratios template 2 ppt powerpoint presentation show portfolio. This is a two stage process. The stages in this process are business, marketing, graph, net profit ratio, gross profit ratio, year.
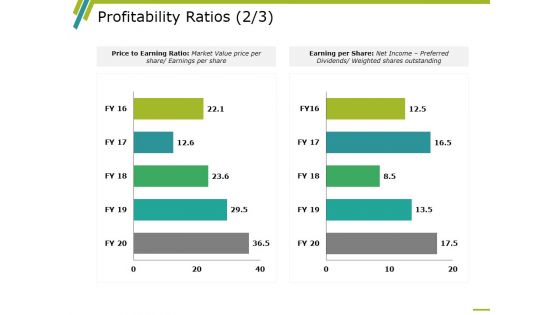
Profitability Ratios Template 3 Ppt PowerPoint Presentation Inspiration Backgrounds
This is a profitability ratios template 3 ppt powerpoint presentation inspiration backgrounds. This is a two stage process. The stages in this process are business, marketing, graph, price to earning ratio, earning per share.
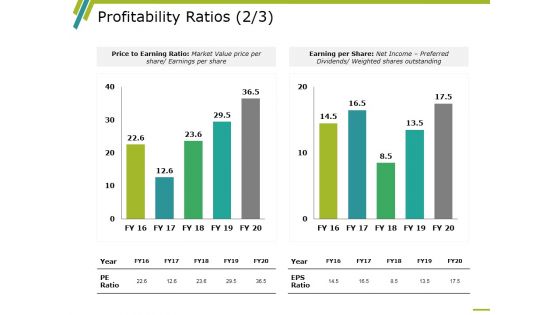
Profitability Ratios Template 4 Ppt PowerPoint Presentation Infographics Rules
This is a profitability ratios template 4 ppt powerpoint presentation infographics rules. This is a two stage process. The stages in this process are business, marketing, graph, price to earning ratio, earning per share.
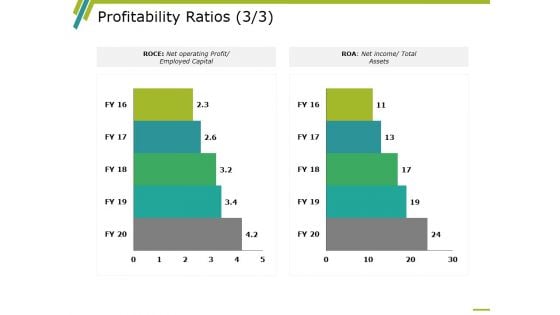
Profitability Ratios Template 5 Ppt PowerPoint Presentation Infographic Template Clipart Images
This is a profitability ratios template 5 ppt powerpoint presentation infographic template clipart images. This is a two stage process. The stages in this process are business, marketing, graph, roce, roa.
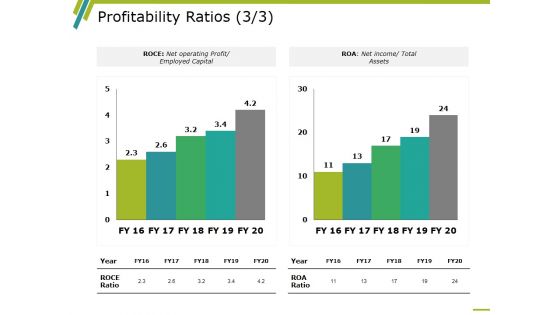
Profitability Ratios Template 6 Ppt PowerPoint Presentation Design Ideas
This is a profitability ratios template 6 ppt powerpoint presentation design ideas. This is a two stage process. The stages in this process are business, marketing, graph, roce, roa.
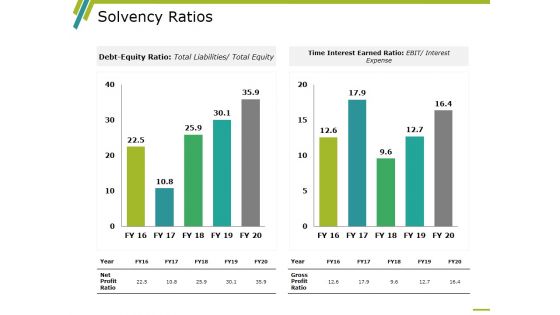
Solvency Ratios Template 1 Ppt PowerPoint Presentation Layouts Graphics Design
This is a solvency ratios template 1 ppt powerpoint presentation layouts graphics design. This is a two stage process. The stages in this process are time interest earned ratio, debt equity ratio, gross profit ratio, net profit ratio, year.
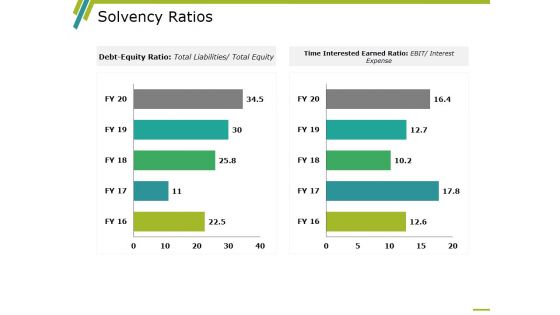
Solvency Ratios Template 2 Ppt PowerPoint Presentation Layouts Layouts
This is a solvency ratios template 2 ppt powerpoint presentation layouts layouts. This is a two stage process. The stages in this process are time interest earned ratio, debt equity ratio, gross profit ratio, net profit ratio, year.
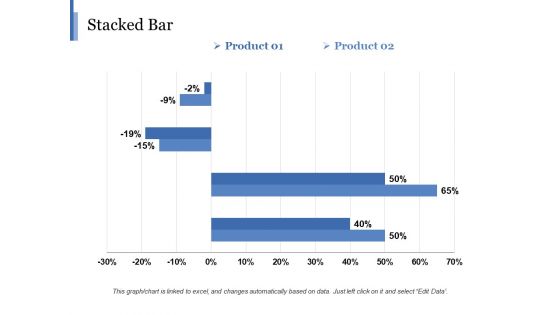
Stacked Bar Template 2 Ppt PowerPoint Presentation Gallery Background
This is a stacked bar template 2 ppt powerpoint presentation gallery background. This is a two stage process. The stages in this process are business, marketing, finance, graph, strategy, percentage.
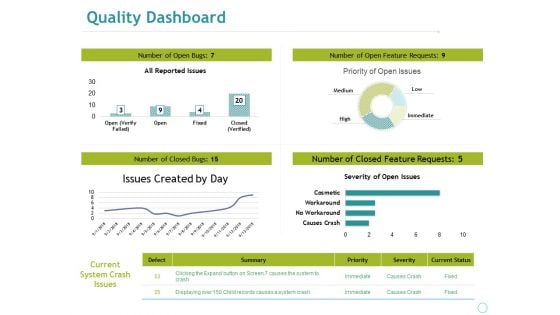
Quality Dashboard Ppt PowerPoint Presentation File Guide
This is a quality dashboard ppt powerpoint presentation file guide. This is a four stage process. The stages in this process are business, marketing, all reported issues, issues created by day, severity of open issues.
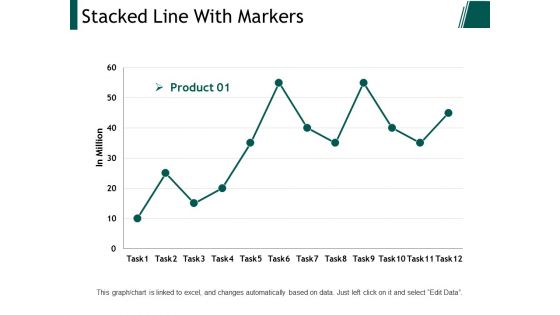
Stacked Line With Markers Ppt PowerPoint Presentation Inspiration Example Topics
This is a stacked line with markers ppt powerpoint presentation inspiration example topics. This is a twelve stage process. The stages in this process are business, marketing, strategy, planning, finance.
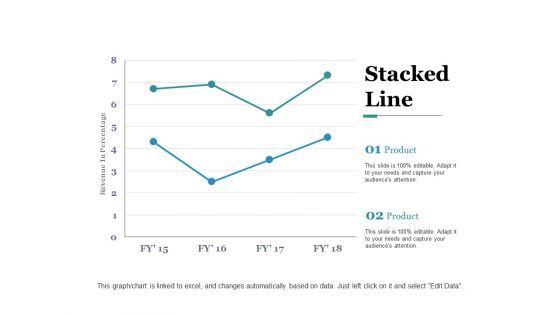
Stacked Line Ppt PowerPoint Presentation Professional Graphics Pictures
This is a stacked line ppt powerpoint presentation professional graphics pictures. This is a two stage process. The stages in this process are revenue in percentage, business, marketing, graph, finance.
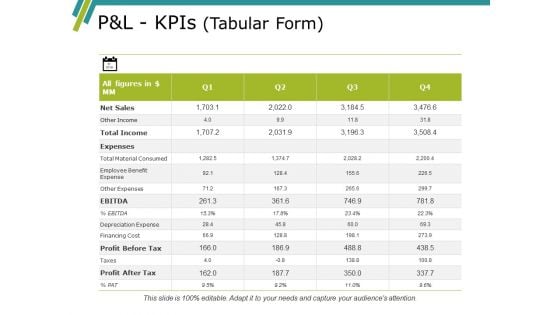
Pandl Kpis Template Ppt PowerPoint Presentation Gallery Summary
This is a pandl kpis template ppt powerpoint presentation gallery summary. This is a four stage process. The stages in this process are revenue, cogs, operating profit, net profit.
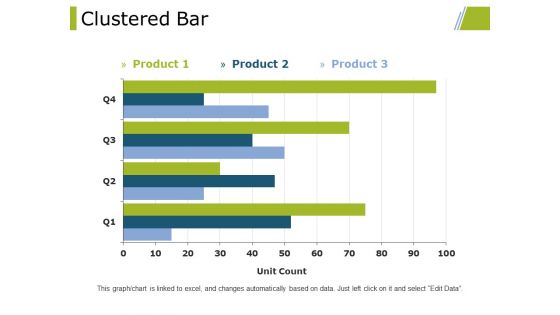
Clustered Bar Ppt PowerPoint Presentation Professional Designs Download
This is a clustered bar ppt powerpoint presentation professional designs download. This is a three stage process. The stages in this process are clustered bar, finance, marketing, strategy, business.
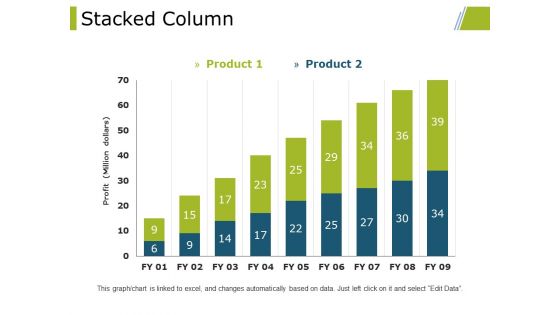
Stacked Column Ppt PowerPoint Presentation Styles Graphic Images
This is a stacked column ppt powerpoint presentation styles graphic images. This is a two stage process. The stages in this process are stacked column, finance, marketing, strategy, business.
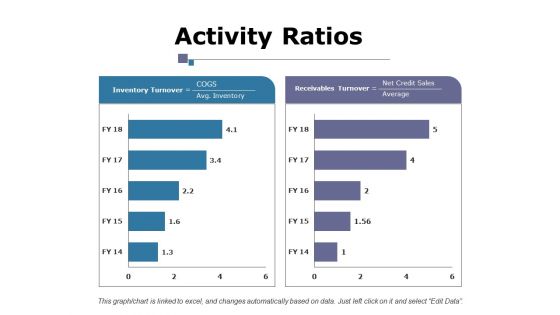
Activity Ratios Ppt PowerPoint Presentation Gallery Slide Portrait
This is a activity ratios ppt powerpoint presentation gallery slide portrait. This is a two stage process. The stages in this process are business, inventory turnover, receivables turnover, marketing, finance.
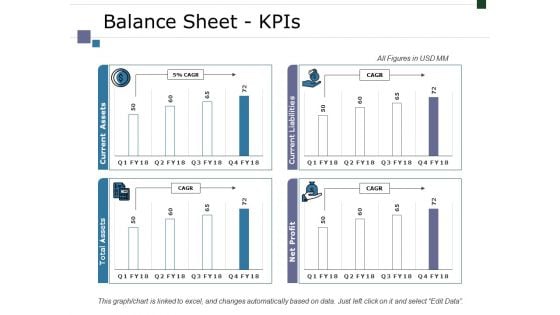
Balance Sheet Kpis Ppt PowerPoint Presentation Infographic Template Designs
This is a balance sheet kpis ppt powerpoint presentation infographic template designs. This is a four stage process. The stages in this process are business, marketing, finance, graph, strategy.
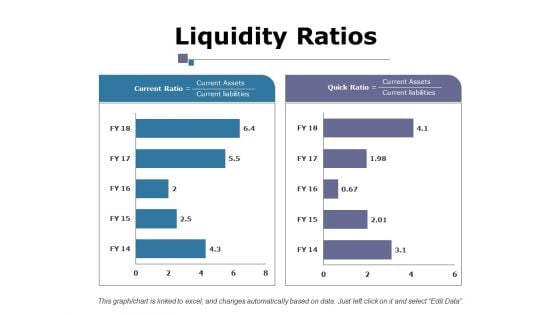
Liquidity Ratios Ppt PowerPoint Presentation Layouts Example File
This is a liquidity ratios ppt powerpoint presentation layouts example file. This is a two stage process. The stages in this process are business, current ratio, quick ratio, marketing, finance, graph.
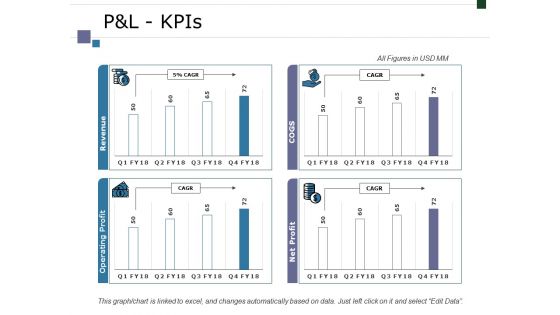
Pandl Kpis Ppt PowerPoint Presentation Infographic Template Graphics Tutorials
This is a pandl kpis ppt powerpoint presentation infographic template graphics tutorials. This is a four stage process. The stages in this process are business, marketing, finance, graph, strategy.
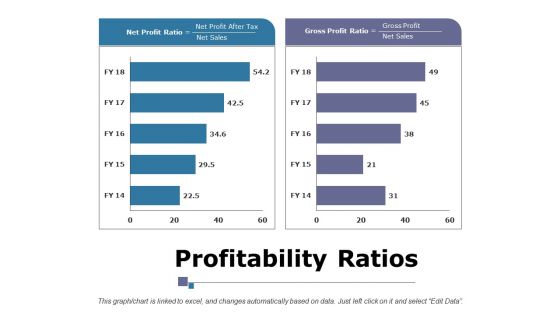
Profitability Ratios Ppt PowerPoint Presentation Infographic Template Portrait
This is a profitability ratios ppt powerpoint presentation infographic template portrait. This is a two stage process. The stages in this process are business, marketing, finance, net profit ratio, gross profit ratio.
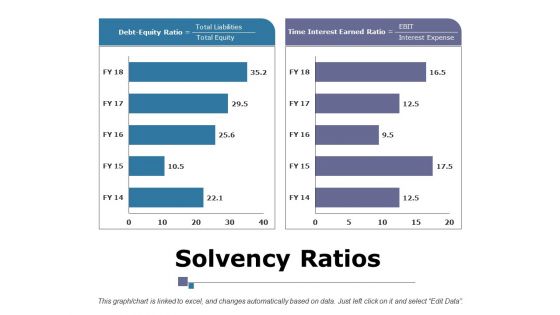
Solvency Ratios Ppt PowerPoint Presentation Summary Layouts
This is a solvency ratios ppt powerpoint presentation summary layouts. This is a two stage process. The stages in this process are business, marketing, strategy, debt equity ratio, time interest earned ratio, finance.
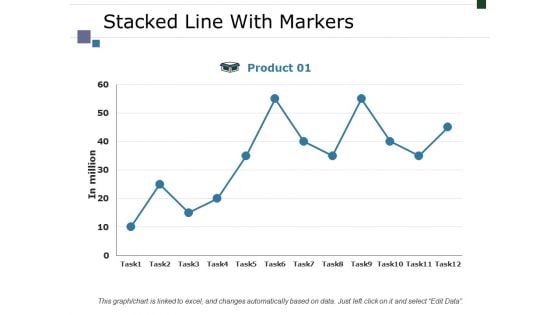
Stacked Line With Markers Ppt PowerPoint Presentation Layouts Display
This is a stacked line with markers ppt powerpoint presentation layouts display. This is a one stage process. The stages in this process are business, marketing, strategy, in million, finance.
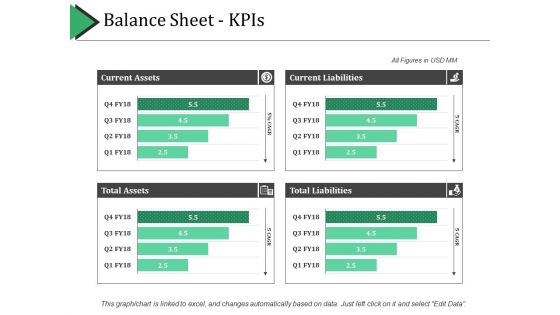
Balance Sheet Kpis Template 1 Ppt PowerPoint Presentation Pictures Grid
This is a balance sheet kpis template 1 ppt powerpoint presentation pictures grid. This is a four stage process. The stages in this process are current assets, current liabilities, total assets, total liabilities.
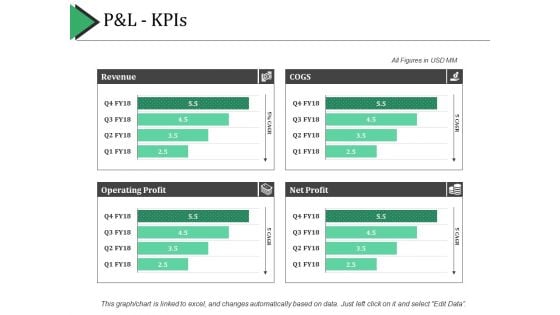
P And L Kpis Ppt PowerPoint Presentation Show Example Introduction
This is a p and l kpis ppt powerpoint presentation show example introduction. This is a four stage process. The stages in this process are revenue, cogs, net profit, operating profit.

 Home
Home