Control Chart
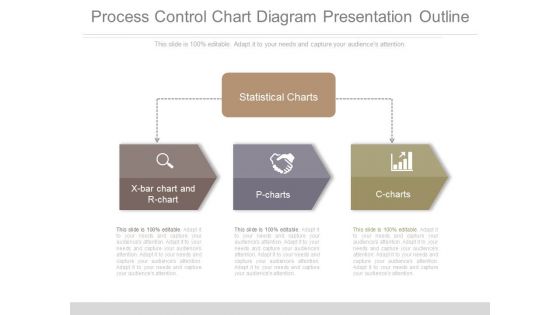
Process Control Chart Diagram Presentation Outline
This is a process control chart diagram presentation outline. This is a three stage process. The stages in this process are statistical charts, x bar chart and r chart, p charts, c charts.
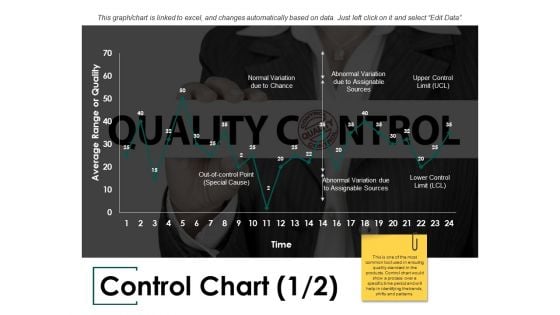
Control Chart Ppt PowerPoint Presentation Infographics Slide
This is a control chart ppt powerpoint presentation infographics slide. This is a two stage process. The stages in this process are normal variation due to chance, abnormal variation due to assignable sources, average range or quality.
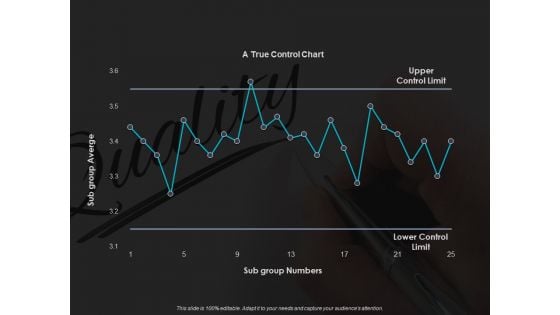
Control Charts A True Control Chart Ppt PowerPoint Presentation Inspiration Examples
This is a control charts a true control chart ppt powerpoint presentation inspiration examples. This is a five stage process. The stages in this process are product, percentage, marketing, business, management.
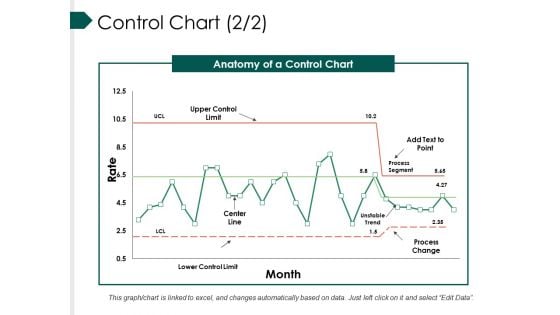
Control Chart Template Ppt PowerPoint Presentation Slides Smartart
This is a control chart template ppt powerpoint presentation slides smartart. This is a two stage process. The stages in this process are anatomy of a control chart, upper control limit, add text to point, process change, lower control limit.
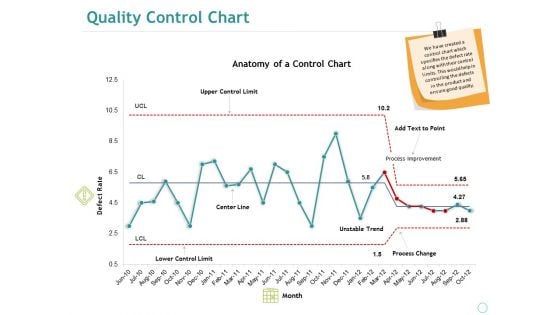
Quality Control Chart Ppt PowerPoint Presentation Summary Sample
This is a quality control chart ppt powerpoint presentation summary sample. This is a one stage process. The stages in this process are anatomy of a control chart, defect rate, upper control limit, center line, lower control limit.
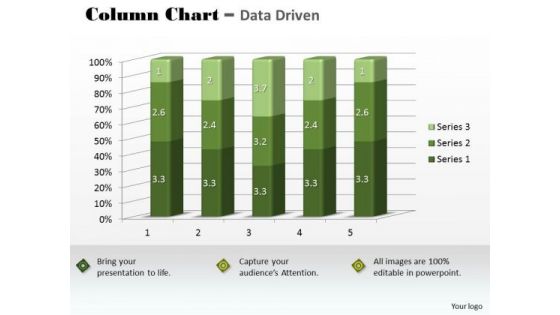
Marketing Data Analysis 3d Statistical Quality Control Chart PowerPoint Templates
Our marketing data analysis 3d statistical quality control chart Powerpoint Templates Abhor Doodling. They Never Let The Interest Flag.
Control Chart Template 2 Ppt PowerPoint Presentation Icon Mockup
This is a control chart template 2 ppt powerpoint presentation icon mockup. This is a one stage process. The stages in this process are control chart, growth, finance, marketing, strategy, business.
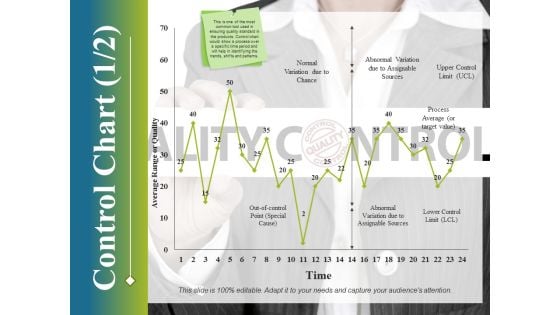
Control Chart Template 1 Ppt PowerPoint Presentation Infographic Template Deck
This is a control chart template 1 ppt powerpoint presentation infographic template deck. This is a one stage process. The stages in this process are control chart, growth, finance, marketing, strategy, business.
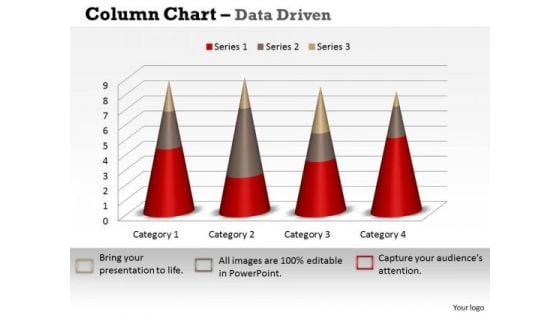
Marketing Data Analysis 3d Statistical Process Control Chart PowerPoint Templates
Open Up Doors That Lead To Success. Our marketing data analysis 3d statistical process control chart Powerpoint Templates Provide The Handles.
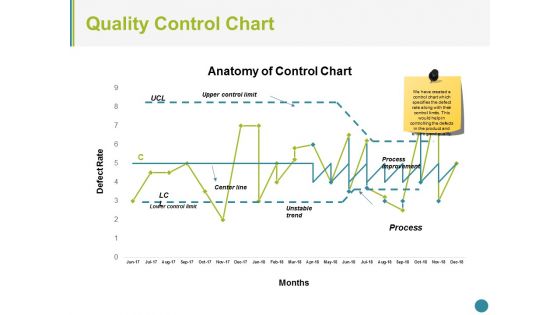
Quality Control Chart Ppt PowerPoint Presentation Infographic Template Slide Portrait
This is a quality control chart ppt powerpoint presentation infographic template slide portrait. This is a three stage process. The stages in this process are upper control limit, center line, unstable trend, process change, process improvement, lower control limit.
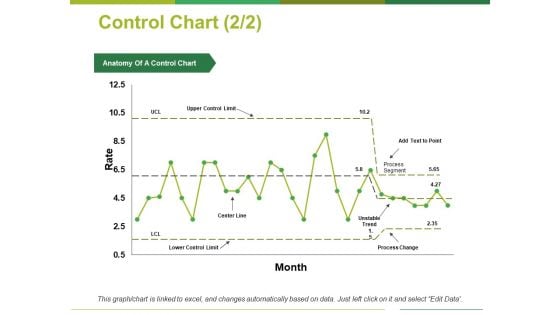
Control Chart Template 2 Ppt PowerPoint Presentation Portfolio Summary
This is a control chart template 2 ppt powerpoint presentation portfolio summary. This is a one stage process. The stages in this process are upper control limit, process segment, process change, unstable trend, lower control limit.
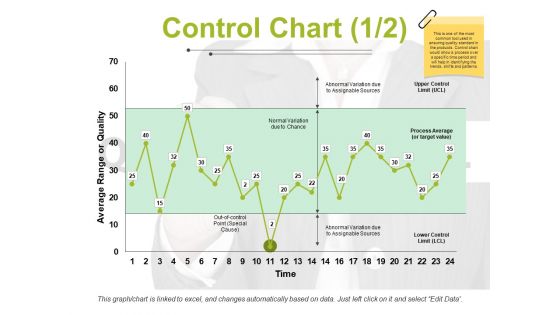
Control Chart Template 1 Ppt PowerPoint Presentation Ideas Images
This is a control chart template 1 ppt powerpoint presentation ideas images. This is a two stage process. The stages in this process are average range or quality, upper control limit, lower control limit, time, process average.
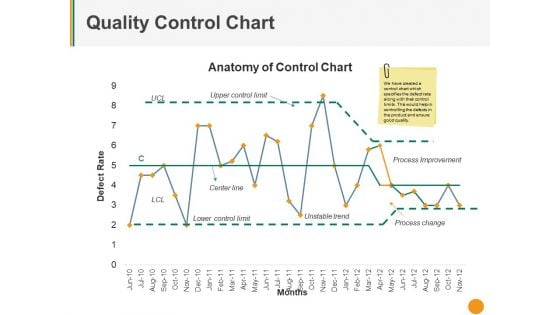
Quality Control Chart Ppt PowerPoint Presentation Pictures Deck
This is a quality control chart ppt powerpoint presentation pictures deck. This is a one stage process. The stages in this process are upper control limit, center line, unstable trend, process improvement, process change.
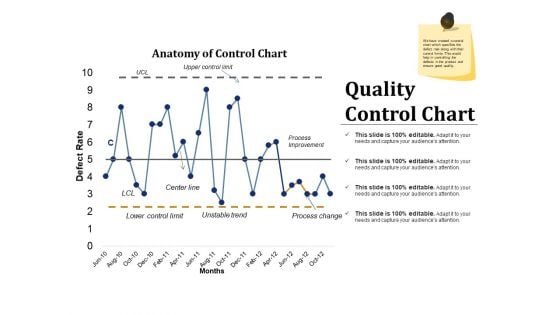
Quality Control Chart Ppt PowerPoint Presentation Inspiration Example Introduction
This is a quality control chart ppt powerpoint presentation inspiration example introduction. This is a two stage process. The stages in this process are process improvement, process change, unstable trend, lower control limit, center line.
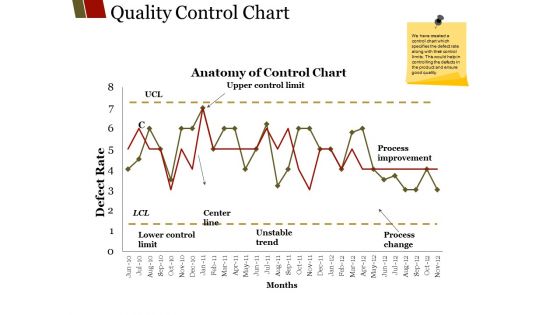
Quality Control Chart Ppt PowerPoint Presentation File Graphics Design
This is a quality control chart ppt powerpoint presentation file graphics design. This is a two stage process. The stages in this process are unstable trend, months center line, lower control limit, process improvement.
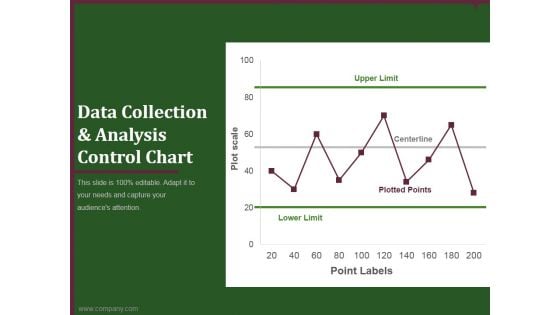
data collection and analysis control chart ppt powerpoint presentation styles
This is a data collection and analysis control chart ppt powerpoint presentation styles. This is a one stage process. The stages in this process are upper limit, centerline, plotted points, lower limit, point labels.
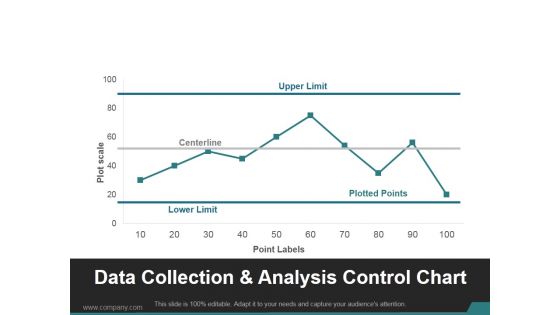
Data Collection And Analysis Control Chart Ppt PowerPoint Presentation Visuals
This is a data collection and analysis control chart ppt powerpoint presentation visuals. This is a ten stage process. The stages in this process are upper limit, centerline, lower limit, plotted points.
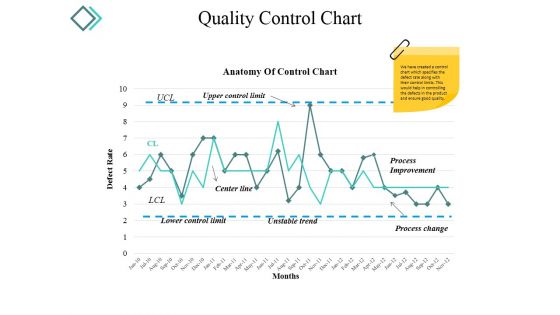
Quality Control Chart Ppt PowerPoint Presentation Model Background Images
This is a quality control chart ppt powerpoint presentation model background images. This is a two stage process. The stages in this process are center line, process improvement, process change, unstable trend.
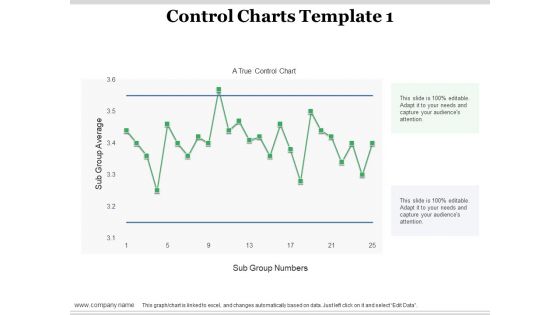
Control Charts Average Ppt PowerPoint Presentation Ideas Demonstration
This is a control charts average ppt powerpoint presentation ideas demonstration. This is a one stage process. The stages in this process are control charts, sub group average, sub group numbers, finance, business.
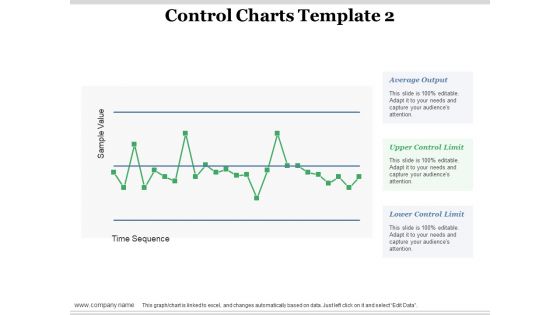
Control Charts Time Sequence Ppt PowerPoint Presentation Layouts Microsoft
This is a control charts time sequence ppt powerpoint presentation layouts microsoft. This is a one stage process. The stages in this process are average output, upper control limit, lower control limit, finance, business.
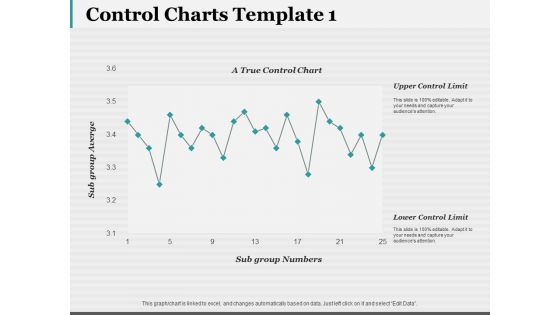
Control Charts Template 1 Ppt PowerPoint Presentation Show Graphics Design
This is a control charts template 1 ppt powerpoint presentation show graphics design. This is a one stage process. The stages in this process are business, finance, marketing, strategy, analysis.
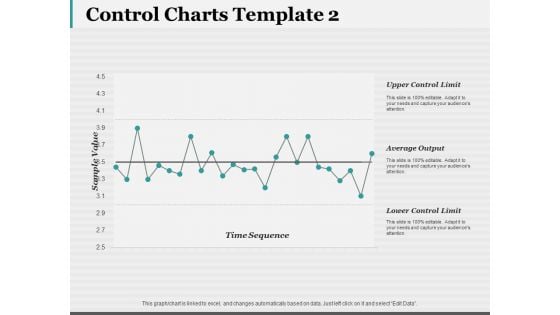
Control Charts Template 2 Ppt PowerPoint Presentation Slides Designs
This is a control charts template 2 ppt powerpoint presentation slides designs. This is a one stage process. The stages in this process are business, finance, marketing, strategy, analysis.
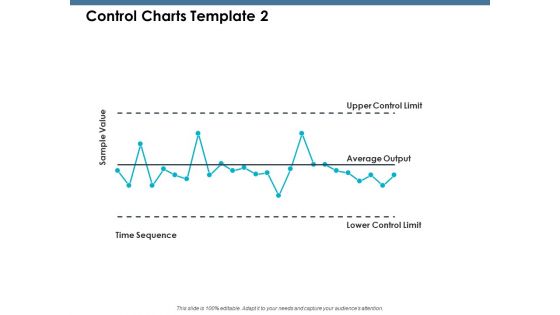
Control Charts Sample Value Ppt PowerPoint Presentation Infographics Demonstration
This is a control charts sample value ppt powerpoint presentation infographics demonstration. This is a five stage process. The stages in this process are product, percentage, marketing, business, management.
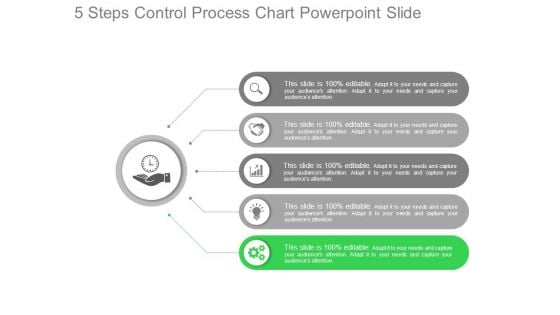
5 Steps Control Process Chart Powerpoint Slide
This is a 5 steps control process chart powerpoint slide. This is a five stage process. The stages in this process are business, marketing, icons, strategy.
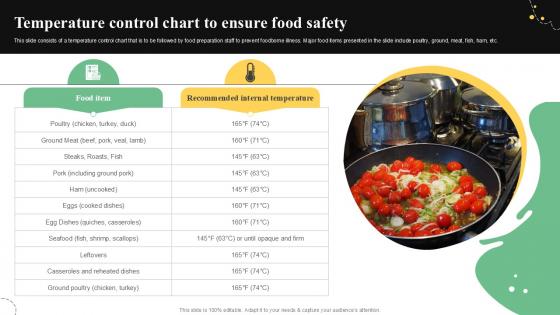
Temperature Control Chart To Quality Control Guide For Food PPT Example
This slide consists of a temperature control chart that is to be followed by food preparation staff to prevent foodborne illness. Major food items presented in the slide include poultry, ground, meat, fish, ham, etc. If your project calls for a presentation, then Slidegeeks is your go-to partner because we have professionally designed, easy-to-edit templates that are perfect for any presentation. After downloading, you can easily edit Temperature Control Chart To Quality Control Guide For Food PPT Example and make the changes accordingly. You can rearrange slides or fill them with different images. Check out all the handy templates This slide consists of a temperature control chart that is to be followed by food preparation staff to prevent foodborne illness. Major food items presented in the slide include poultry, ground, meat, fish, ham, etc.
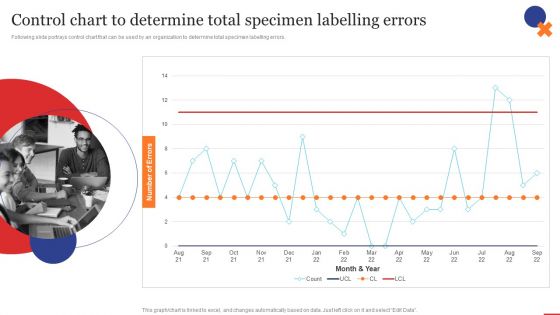
Control Chart To Determine Total Specimen Labelling Quality Control Planning Templates Set 1 Topics PDF
Following slide portrays control chart that can be used by an organization to determine total specimen labelling errors.Whether you have daily or monthly meetings, a brilliant presentation is necessary. Control Chart To Determine Total Specimen Labelling Quality Control Planning Templates Set 1 Topics PDF can be your best option for delivering a presentation. Represent everything in detail using Control Chart To Determine Total Specimen Labelling Quality Control Planning Templates Set 1 Topics PDF and make yourself stand out in meetings. The template is versatile and follows a structure that will cater to your requirements. All the templates prepared by Slidegeeks are easy to download and edit. Our research experts have taken care of the corporate themes as well. So, give it a try and see the results.
Project Quality Planning And Controlling Process Tracking With Control Chart Ppt Infographic Template Clipart Images PDF
Presenting this set of slides with name project quality planning and controlling process tracking with control chart ppt infographic template clipart images pdf. The topics discussed in these slide is process tracking with control chart. This is a completely editable PowerPoint presentation and is available for immediate download. Download now and impress your audience.
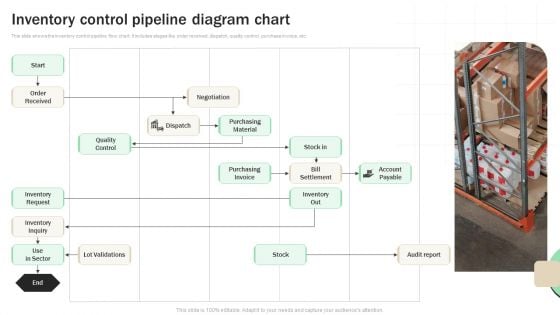
Inventory Control Pipeline Diagram Chart Structure PDF
This slide shows the inventory control pipeline flow chart. It includes stages like order received, dispatch, quality control, purchase invoice, etc. Pitch your topic with ease and precision using this Inventory Control Pipeline Diagram Chart Structure PDF. This layout presents information on Inventory Request, Inventory Inquiry, Quality Control . It is also available for immediate download and adjustment. So, changes can be made in the color, design, graphics or any other component to create a unique layout.
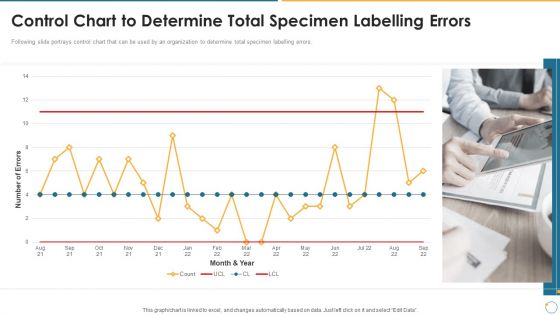
Collection Of Quality Assurance PPT Control Chart To Determine Total Specimen Labelling Graphics PDF
Following slide portrays control chart that can be used by an organization to determine total specimen labelling errors. Deliver an awe inspiring pitch with this creative collection of quality assurance ppt control chart to determine total specimen labelling graphics pdf bundle. Topics like control chart to determine total specimen labelling errors can be discussed with this completely editable template. It is available for immediate download depending on the needs and requirements of the user.
Quality Management Plan QMP Process Tracking With Control Chart Ppt File Icons PDF
Presenting this set of slides with name quality management plan qmp process tracking with control chart ppt file icons pdf. The topics discussed in these slide is process tracking with control chart. This is a completely editable PowerPoint presentation and is available for immediate download. Download now and impress your audience.
Project Quality Management Plan Process Tracking With Control Chart Ppt Ideas Background Image PDF
Presenting this set of slides with name project quality management plan process tracking with control chart ppt ideas background image pdf. The topics discussed in these slide is process tracking with control chart. This is a completely editable PowerPoint presentation and is available for immediate download. Download now and impress your audience.
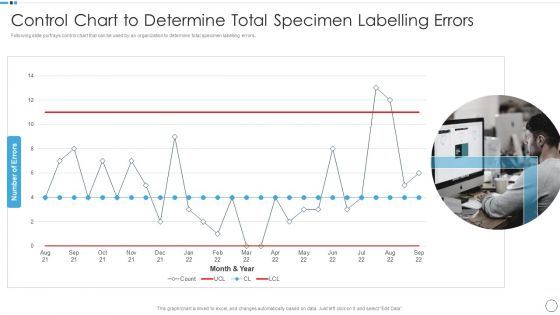
QA Plan Set 1 Control Chart To Determine Total Specimen Labelling Errors Sample PDF
Deliver an awe inspiring pitch with this creative QA Plan Set 1 Control Chart To Determine Total Specimen Labelling Errors Sample PDF bundle. Topics like Control Chart To Determine, Specimen Labelling Errors can be discussed with this completely editable template. It is available for immediate download depending on the needs and requirements of the user.
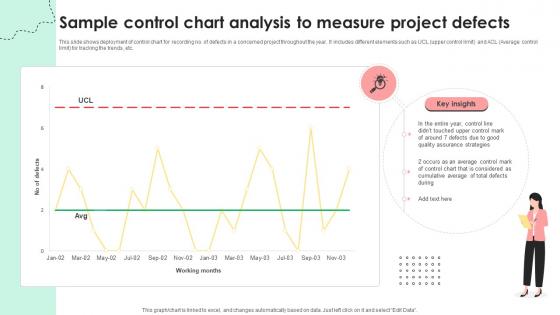
Administering Quality Assurance Sample Control Chart Analysis To Measure Project Defects PM SS V
This slide shows deployment of control chart for recording no. of defects in a concerned project throughout the year. It includes different elements such as UCL upper control limit and ACL Average control limit for tracking the trends, etc. From laying roadmaps to briefing everything in detail, our templates are perfect for you. You can set the stage with your presentation slides. All you have to do is download these easy-to-edit and customizable templates. Administering Quality Assurance Sample Control Chart Analysis To Measure Project Defects PM SS V will help you deliver an outstanding performance that everyone would remember and praise you for. Do download this presentation today. This slide shows deployment of control chart for recording no. of defects in a concerned project throughout the year. It includes different elements such as UCL upper control limit and ACL Average control limit for tracking the trends, etc.
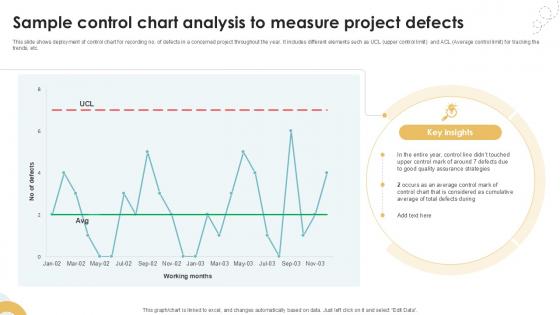
Sample Control Chart Analysis To Measure Project Executing Quality Ppt Sample PM SS V
This slide shows deployment of control chart for recording no. of defects in a concerned project throughout the year. It includes different elements such as UCL upper control limit and ACL Average control limit for tracking the trends, etc. Do you have an important presentation coming up Are you looking for something that will make your presentation stand out from the rest Look no further than Sample Control Chart Analysis To Measure Project Executing Quality Ppt Sample PM SS V. With our professional designs, you can trust that your presentation will pop and make delivering it a smooth process. And with Slidegeeks, you can trust that your presentation will be unique and memorable. So why wait Grab Sample Control Chart Analysis To Measure Project Executing Quality Ppt Sample PM SS V today and make your presentation stand out from the rest This slide shows deployment of control chart for recording no. of defects in a concerned project throughout the year. It includes different elements such as UCL upper control limit and ACL Average control limit for tracking the trends, etc.
Food Process Tracking With Control Chart Uplift Food Production Company Quality Standards Introduction PDF
The quality team will use control chart as food quality management tool. It will help in determining the food processes are stable and capable under provided conditions. Deliver an awe inspiring pitch with this creative food process tracking with control chart uplift food production company quality standards introduction pdf bundle. Topics like action plan, resources, chart analysis can be discussed with this completely editable template. It is available for immediate download depending on the needs and requirements of the user.
Food Process Tracking With Control Chart Assuring Food Quality And Hygiene Introduction PDF
The quality team will use control chart as food quality management tool. It will help in determining the food processes are stable and capable under provided conditions. Deliver an awe inspiring pitch with this creative food process tracking with control chart assuring food quality and hygiene introduction pdf bundle. Topics like action plan, resources, chart analysis can be discussed with this completely editable template. It is available for immediate download depending on the needs and requirements of the user.
Food Process Tracking With Control Chart Application Of Quality Management For Food Processing Companies Background PDF
The quality team will use control chart as food quality management tool. It will help in determining the food processes are stable and capable under provided conditions. Deliver an awe inspiring pitch with this creative food process tracking with control chart application of quality management for food processing companies background pdf bundle. Topics like action plan, resources, chart analysis can be discussed with this completely editable template. It is available for immediate download depending on the needs and requirements of the user.
Food Process Tracking With Control Chart Food Security Excellence Ppt Inspiration Graphics Example PDF
The quality team will use control chart as food quality management tool. It will help in determining the food processes are stable and capable under provided conditions. Deliver an awe inspiring pitch with this creative food process tracking with control chart food security excellence ppt inspiration graphics example pdf bundle. Topics like action plan, resources, chart analysis can be discussed with this completely editable template. It is available for immediate download depending on the needs and requirements of the user.
Food Process Tracking With Control Chart Increased Superiority For Food Products Sample PDF
The quality team will use control chart as food quality management tool. It will help in determining the food processes are stable and capable under provided conditions. Deliver an awe inspiring pitch with this creative food process tracking with control chart increased superiority for food products sample pdf bundle. Topics like action plan, resources, chart analysis can be discussed with this completely editable template. It is available for immediate download depending on the needs and requirements of the user.
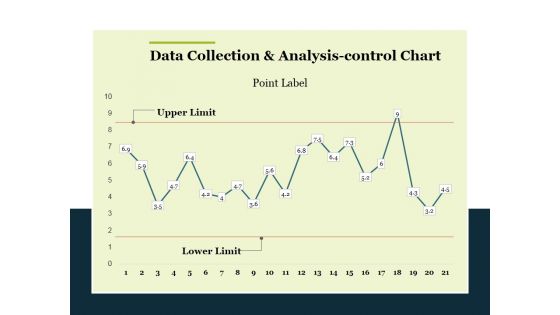
Data Collection And Analysis Control Chart Ppt PowerPoint Presentation Summary Templates
This is a data collection and analysis control chart ppt powerpoint presentation summary templates. This is a one stage process. The stages in this process are business, marketing, point label, upper limit, lower limit.
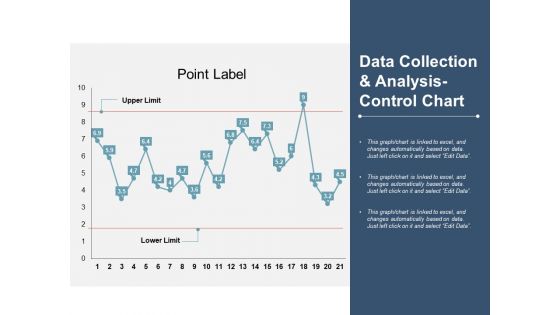
Data Collection And Analysis Control Chart Ppt PowerPoint Presentation Slide Download
This is a data collection and analysis control chart ppt powerpoint presentation slide download. This is a three stage process. The stages in this process are line chart, finance, marketing, management, investment.
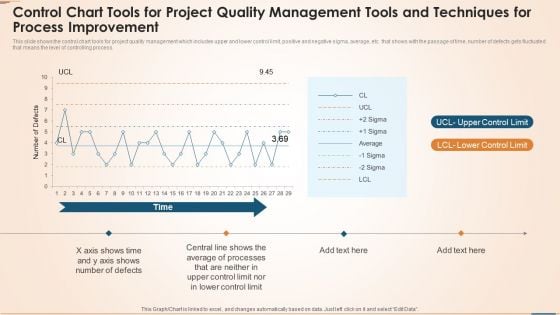
Control Chart Tools For Project Quality Management Tools And Techniques For Process Improvement Topics PDF
This slide shows the control chart tools for project quality management which includes upper and lower control limit, positive and negative sigma, average, etc. that shows with the passage of time, number of defects gets fluctuated that means the level of controlling process. Pitch your topic with ease and precision using this control chart tools for project quality management tools and techniques for process improvement topics pdf. This layout presents information on time, upper control limit, lower control limit. It is also available for immediate download and adjustment. So, changes can be made in the color, design, graphics or any other component to create a unique layout.
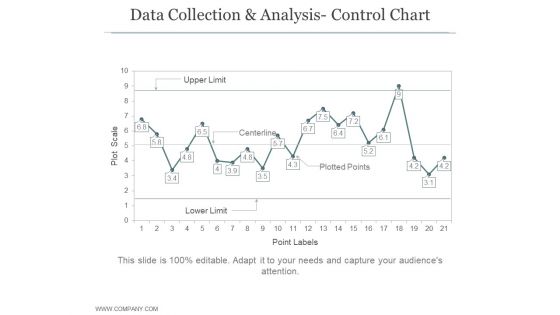
Data Collection And Analysis Control Chart Ppt PowerPoint Presentation Example File
This is a data collection and analysis control chart ppt powerpoint presentation example file. This is a four stage process. The stages in this process are business, strategy, marketing, bar graph, growth strategy.
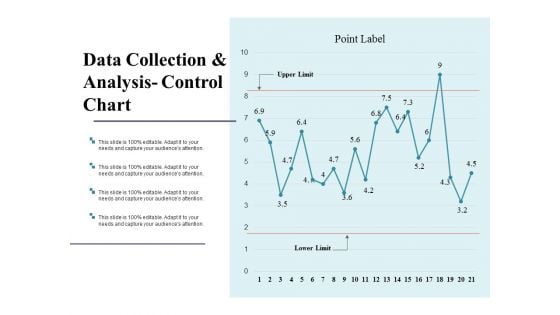
Data Collection And Analysis Control Chart Ppt PowerPoint Presentation Model Backgrounds
This is a data collection and analysis control chart ppt powerpoint presentation model backgrounds. This is a two stage process. The stages in this process are business, marketing, strategy, finance, analysis.
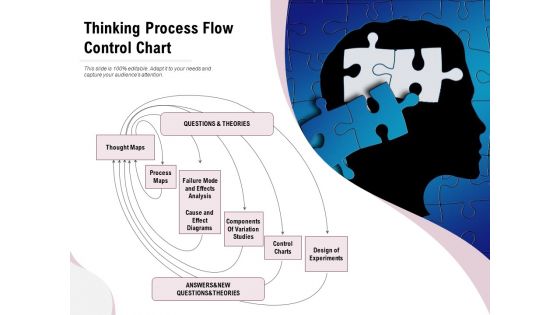
Thinking Process Flow Control Chart Ppt PowerPoint Presentation Pictures Topics PDF
Persuade your audience using this thinking process flow control chart ppt powerpoint presentation pictures topics pdf. This PPT design covers one stages, thus making it a great tool to use. It also caters to a variety of topics including questions and theories, thought maps, process maps, failure mode and effects analysis, cause and effect diagrams, components of variation studies, control charts, design of experiments, answers and new, questions and theories. Download this PPT design now to present a convincing pitch that not only emphasizes the topic but also showcases your presentation skills.
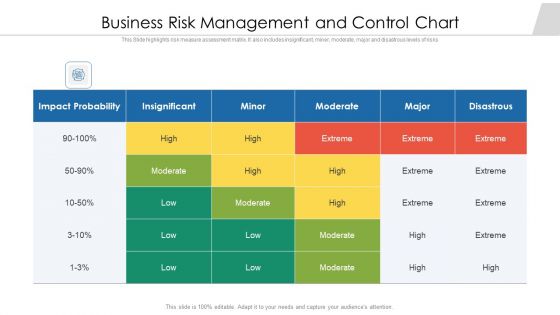
Business Risk Management And Control Chart Ppt PowerPoint Presentation Ideas Graphics Pictures PDF
This Slide highlights risk measure assessment matrix. It also includes insignificant, miner, moderate, major and disastrous levels of risks. Showcasing this set of slides titled business risk management and control chart ppt powerpoint presentation ideas graphics pictures pdf. The topics addressed in these templates are impact probability, moderate, major. All the content presented in this PPT design is completely editable. Download it and make adjustments in color, background, font etc. as per your unique business setting.
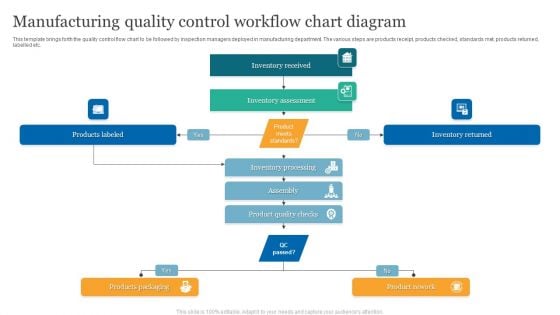
Manufacturing Quality Control Workflow Chart Diagram Ideas PDF
This template brings forth the quality control flow chart to be followed by inspection managers deployed in manufacturing department. The various steps are products receipt, products checked, standards met, products returned, labelled etc. Persuade your audience using this Manufacturing Quality Control Workflow Chart Diagram Ideas PDF. This PPT design covers One stage, thus making it a great tool to use. It also caters to a variety of topics including Inventory Received, Inventory Assessment, Inventory Returned. Download this PPT design now to present a convincing pitch that not only emphasizes the topic but also showcases your presentation skills.
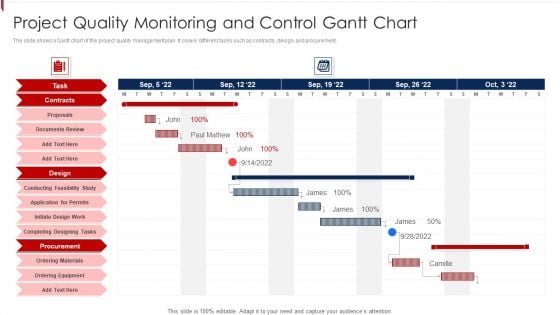
Project Quality Monitoring And Control Gantt Chart Clipart PDF
The slide shows a Gantt chart of the project quality management plan. It covers different tasks such as contracts, design, and procurement. Introducing our Project Quality Monitoring And Control Gantt Chart Clipart PDF that is designed to showcase some of the vital components that will help you create timelines, roadmaps, and project plans. In addition, also communicate your project durations, milestones, tasks, subtasks, dependencies, and other attributes using this well structured Project Quality Monitoring And Control Gantt Chart Clipart PDF template. You can also exhibit preeminence against time by deploying this easily adaptable slide to your business presentation. Our experts have designed this template in such a way that it is sure to impress your audience. Thus, download it and steer your project meetings, meetups, and conferences.
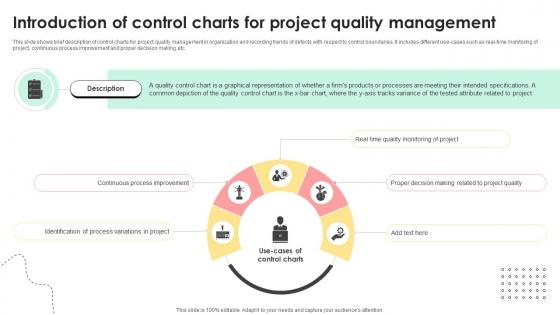
Administering Quality Assurance Introduction Of Control Charts For Project Quality Management PM SS V
This slide shows brief description of control charts for project quality management in organization and recording trends of defects with respect to control boundaries. It includes different use-cases such as real-time monitoring of project, continuous process improvement and proper decision making, etc. Coming up with a presentation necessitates that the majority of the effort goes into the content and the message you intend to convey. The visuals of a PowerPoint presentation can only be effective if it supplements and supports the story that is being told. Keeping this in mind our experts created Administering Quality Assurance Introduction Of Control Charts For Project Quality Management PM SS V to reduce the time that goes into designing the presentation. This way, you can concentrate on the message while our designers take care of providing you with the right template for the situation. This slide shows brief description of control charts for project quality management in organization and recording trends of defects with respect to control boundaries. It includes different use-cases such as real-time monitoring of project, continuous process improvement and proper decision making, etc.
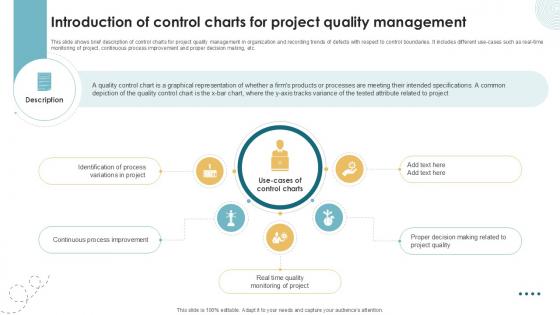
Introduction Of Control Charts For Project Quality Executing Quality Ppt Slides PM SS V
This slide shows brief description of control charts for project quality management in organization and recording trends of defects with respect to control boundaries. It includes different use cases such as real time monitoring of project, continuous process improvement and proper decision making, etc. Welcome to our selection of the Introduction Of Control Charts For Project Quality Executing Quality Ppt Slides PM SS V. These are designed to help you showcase your creativity and bring your sphere to life. Planning and Innovation are essential for any business that is just starting out. This collection contains the designs that you need for your everyday presentations. All of our PowerPoints are 100Percent editable, so you can customize them to suit your needs. This multi-purpose template can be used in various situations. Grab these presentation templates today. This slide shows brief description of control charts for project quality management in organization and recording trends of defects with respect to control boundaries. It includes different use cases such as real time monitoring of project, continuous process improvement and proper decision making, etc.
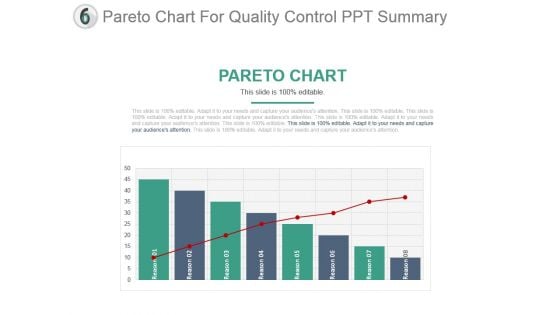
Pareto Chart For Quality Control Ppt Summary
This is a pareto chart for quality control ppt summary. This is a eight stage process. The stages in this process are business, success, marketing, strategy, growth, graphic design.
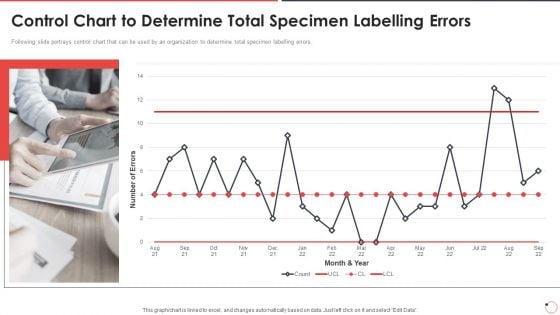
Quality Assurance Templates Set 1 Control Chart To Determine Total Specimen Labelling Errors Ppt Pictures Portrait PDF
Following slide portrays control chart that can be used by an organization to determine total specimen labelling errors. Deliver an awe inspiring pitch with this creative quality assurance templates set 1 control chart to determine total specimen labelling errors ppt pictures portrait pdf bundle. Topics like control chart to determine total specimen labelling errors can be discussed with this completely editable template. It is available for immediate download depending on the needs and requirements of the user.
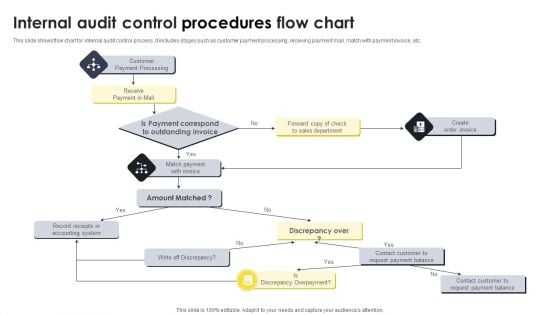
Internal Audit Control Procedures Flow Chart Microsoft PDF
This slide shows flow chart for internal audit control process. It includes stages such as customer payment processing, receiving payment mail, match with payment invoice, etc. Presenting Internal Audit Control Procedures Flow Chart Microsoft PDF to dispense important information. This template comprises three stages. It also presents valuable insights into the topics including Customer Payment Processing, Sales Department, Accounting System. This is a completely customizable PowerPoint theme that can be put to use immediately. So, download it and address the topic impactfully.
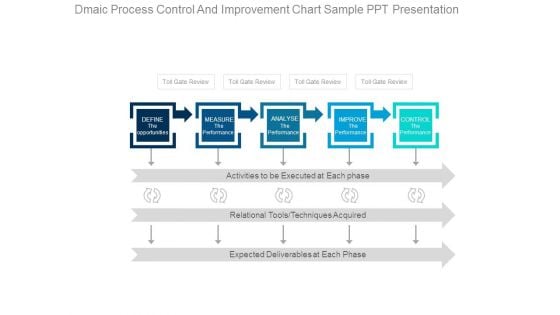
Dmaic Process Control And Improvement Chart Sample Ppt Presentation
This is a dmaic process control and improvement chart sample ppt presentation. This is a five stage process. The stages in this process are toll gate review, define, the opportunities, measure, the performance, analyse, the performance, improve, the performance, control, the performance, activities to be executed at each phase, relational tools techniques acquired, expected deliverables at each phase.
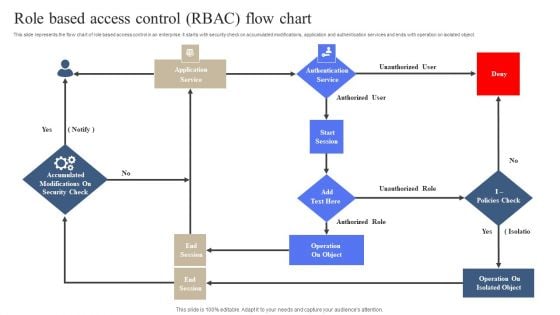
Role Based Access Control RBAC Flow Chart Slides PDF
This slide represents the flow chart of role based access control in an enterprise. It starts with security check on accumulated modifications, application and authentication services and ends with operation on isolated object. Persuade your audience using this Role Based Access Control RBAC Flow Chart Slides PDF. This PPT design covers One stage, thus making it a great tool to use. It also caters to a variety of topics including Operation On Object, Operation On Isolated Object. Download this PPT design now to present a convincing pitch that not only emphasizes the topic but also showcases your presentation skills.
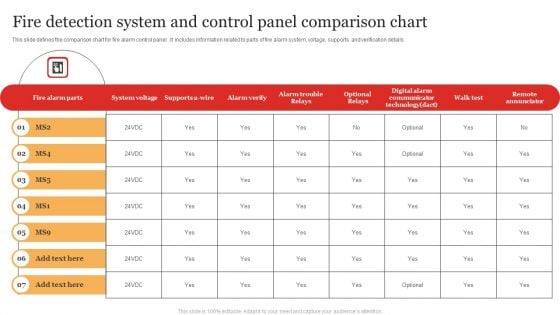
Fire Detection System And Control Panel Comparison Chart Information PDF
Pitch your topic with ease and precision using this Fire Detection System And Control Panel Comparison Chart Information PDF. This layout presents information on Digital Communicator, System Voltage, Remote Annunciator. It is also available for immediate download and adjustment. So, changes can be made in the color, design, graphics or any other component to create a unique layout.
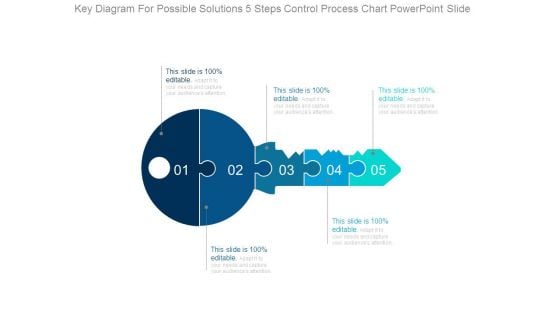
Key Diagram For Possible Solutions 5 Steps Control Process Chart Powerpoint Slide
This is a key diagram for possible solutions 5 steps control process chart powerpoint slide. This is a five stage process. The stages in this process are puzzles, business, problem, solution, game pieces, key.
Experimental Control Pie Chart With Dollar Symbol Ppt Powerpoint Presentation Infographics Background Images
This is a experimental control pie chart with dollar symbol ppt powerpoint presentation infographics background images. This is a four stage process. The stages in this process are exploratory, experimental, investigational.
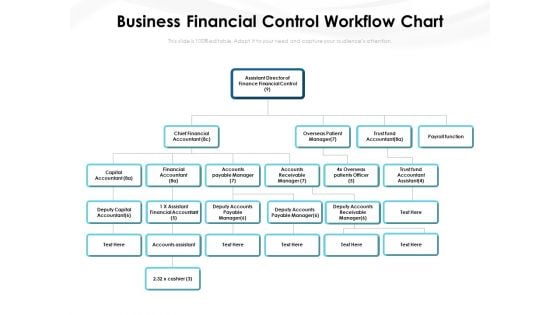
Business Financial Control Workflow Chart Ppt PowerPoint Presentation Show Gallery PDF
Presenting this set of slides with name business financial control workflow chart ppt powerpoint presentation show gallery pdf. This is a seven stage process. The stages in this process are assistant director, chief financial accountant, capital accountant, accounts assistant. This is a completely editable PowerPoint presentation and is available for immediate download. Download now and impress your audience.
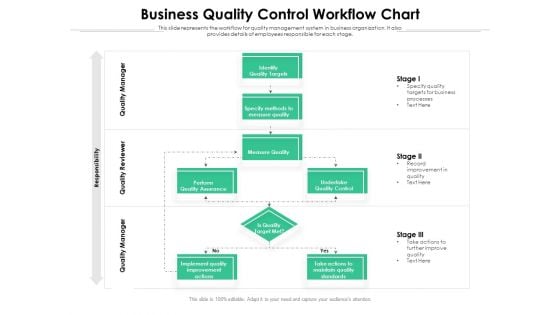
Business Quality Control Workflow Chart Ppt PowerPoint Presentation Gallery Example PDF
This slide represents the workflow for quality management system in business organization. It also provides details of employees responsible for each stage. Presenting business quality control workflow chart ppt powerpoint presentation gallery example pdf to dispense important information. This template comprises three stages. It also presents valuable insights into the topics including quality manager, quality reviewer, quality manager. This is a completely customizable PowerPoint theme that can be put to use immediately. So, download it and address the topic impactfully.


 Continue with Email

 Home
Home


