Control Icon
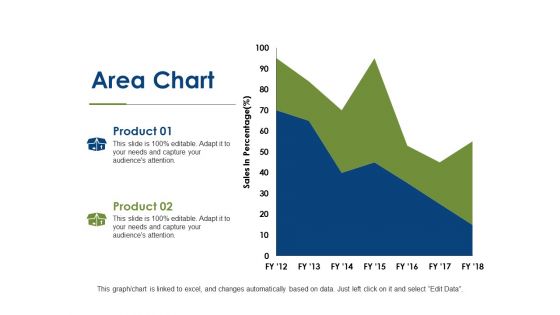
Area Chart Finance Ppt PowerPoint Presentation Show Visual Aids
This is a area chart finance ppt powerpoint presentation show visual aids. This is a two stage process. The stages in this process are area chart, business, finance, investment, strategy.
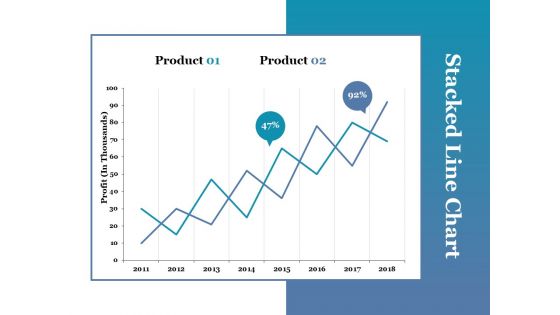
Stacked Line Chart Ppt PowerPoint Presentation Portfolio Picture
This is a stacked line chart ppt powerpoint presentation portfolio picture. This is a two stage process. The stages in this process are stacked line chart, product, profit, growth.
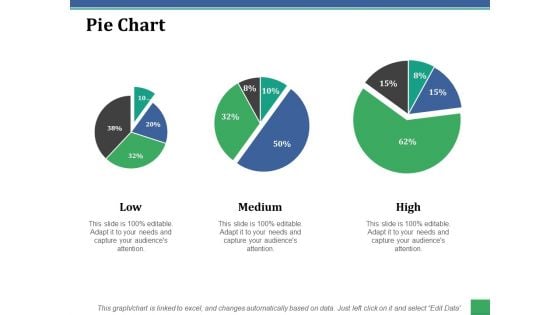
Pie Chart Ppt PowerPoint Presentation File Graphics Download
This is a pie chart ppt powerpoint presentation file graphics download. This is a three stage process. The stages in this process are low, medium, high, pie chart, finance.
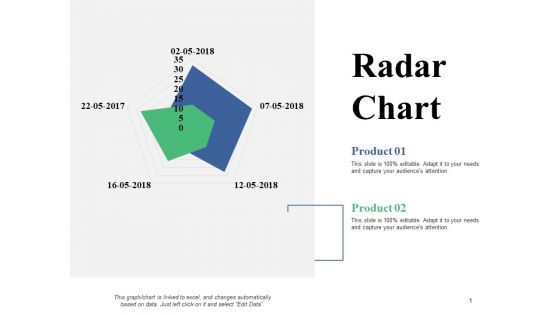
Radar Chart Ppt PowerPoint Presentation Slides Graphics Tutorials
This is a radar chart ppt powerpoint presentation slides graphics tutorials. This is a two stage process. The stages in this process are radar chart, finance, marketing, planning, business.
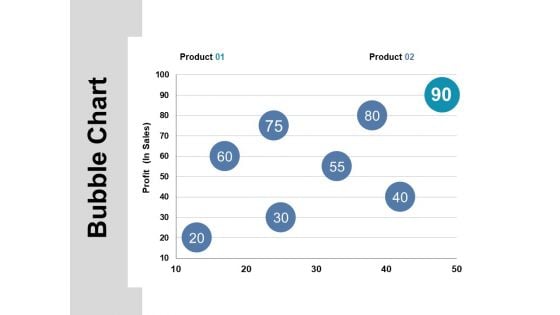
Bubble Chart Ppt PowerPoint Presentation Inspiration Master Slide
This is a bubble chart ppt powerpoint presentation inspiration master slide. This is a two stage process. The stages in this process are bubble chart, finance, planning, marketing, strategy.
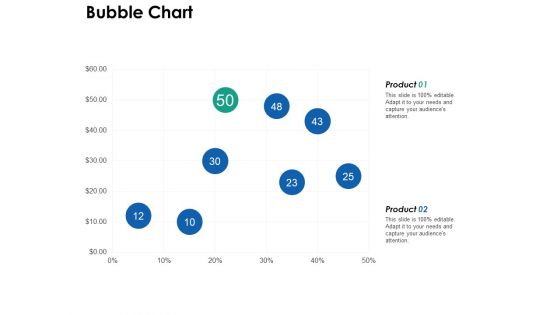
Bubble Chart Finance Ppt PowerPoint Presentation File Maker
This is a bubble chart finance ppt powerpoint presentation file maker. This is a two stage process. The stages in this process are bubble chart, finance, business, planning, marketing.
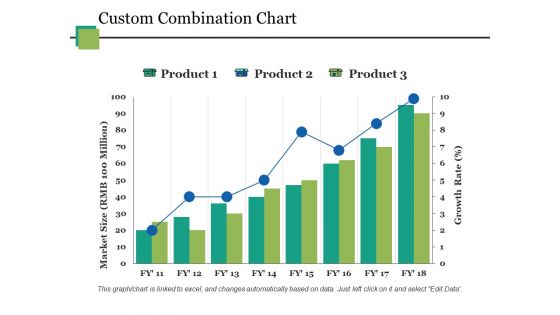
Custom Combination Chart Ppt PowerPoint Presentation Styles Good
This is a custom combination chart ppt powerpoint presentation styles good. This is a three stage process. The stages in this process are custom combination chart, finance, business, planning, marketing.
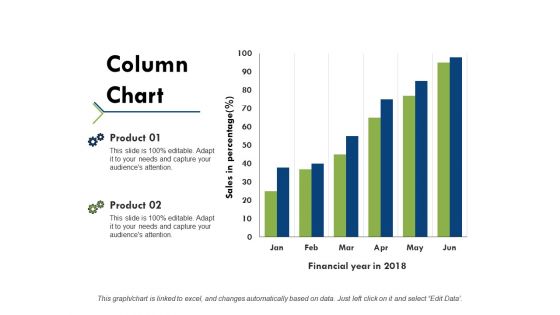
Column Chart Ppt PowerPoint Presentation Portfolio Example Topics
This is a column chart ppt powerpoint presentation portfolio example topics. This is a two stage process. The stages in this process are product, financial year, sales in percentage, column chart.
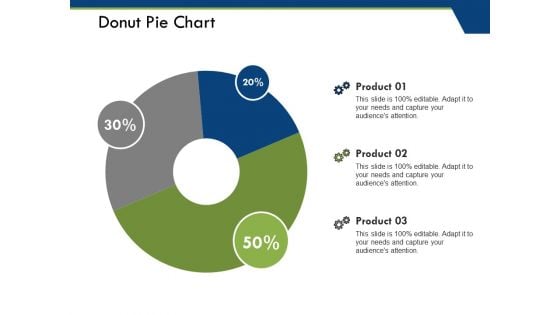
Donut Pie Chart Ppt PowerPoint Presentation Pictures File Formats
This is a donut pie chart ppt powerpoint presentation pictures file formats. This is a three stage process. The stages in this process are product, donut pie chart, percentage, business, marketing.
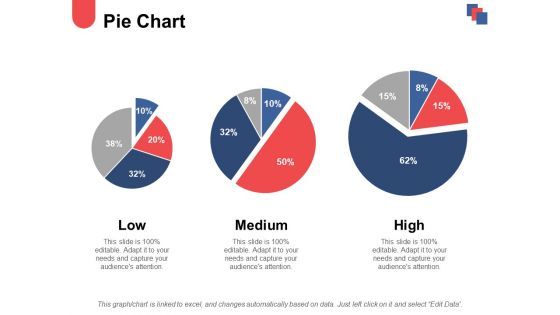
Pie Chart And Finance Ppt PowerPoint Presentation Ideas Demonstration
This is a pie chart and finance ppt powerpoint presentation ideas demonstration. This is a three stage process. The stages in this process are low, medium, high, pie chart, finance.
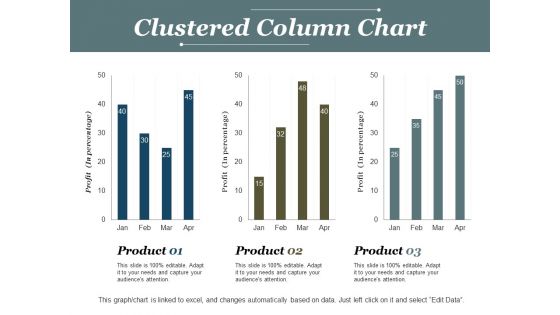
Clustered Column Chart Ppt PowerPoint Presentation Model Deck
This is a clustered column chart ppt powerpoint presentation model deck. This is a three stage process. The stages in this process are clustered column chart, product, finance, profit, business.
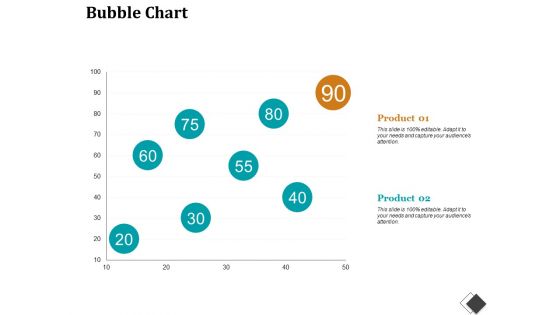
Bubble Chart Enterprise Model Canvas Ppt PowerPoint Presentation File Structure
This is a bubble chart enterprise model canvas ppt powerpoint presentation file structure. This is a two stage process. The stages in this process are bubble chart, finance, marketing, strategy, analysis, investment.
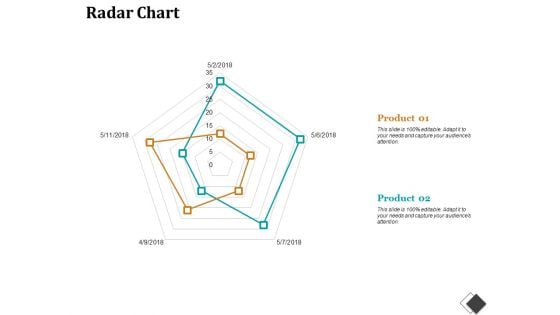
Radar Chart Enterprise Model Canvas Ppt PowerPoint Presentation File Slides
This is a radar chart enterprise model canvas ppt powerpoint presentation file slides. This is a two stage process. The stages in this process are radar chart, finance, marketing, strategy, business.
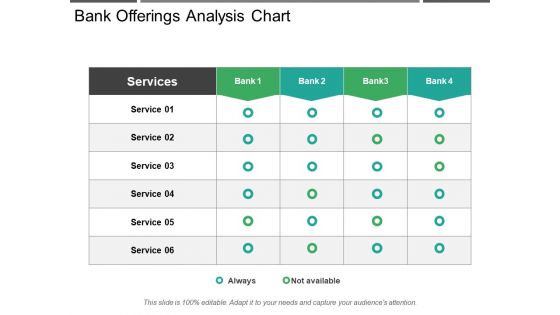
Bank Offerings Analysis Chart Ppt PowerPoint Presentation Slides Show
This is a bank offerings analysis chart ppt powerpoint presentation slides show. This is a five stage process. The stages in this process are comparison chart, comparison table, comparison matrix.
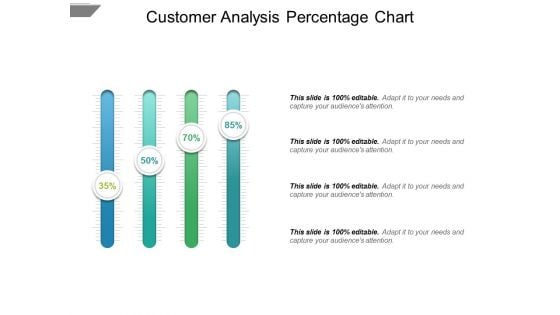
Customer Analysis Percentage Chart Ppt PowerPoint Presentation Infographics Master Slide
This is a customer analysis percentage chart ppt powerpoint presentation infographics master slide. This is a four stage process. The stages in this process are comparison chart, comparison table, comparison matrix.
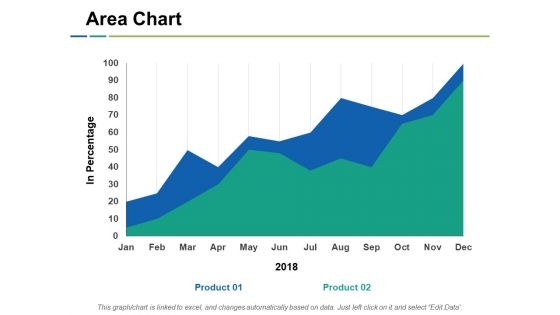
Area Chart Ppt PowerPoint Presentation Model Slide Portrait
This is a area chart ppt powerpoint presentation model slide portrait. This is a two stage process. The stages in this process are area chart, financial, business, marketing, planning, strategy.
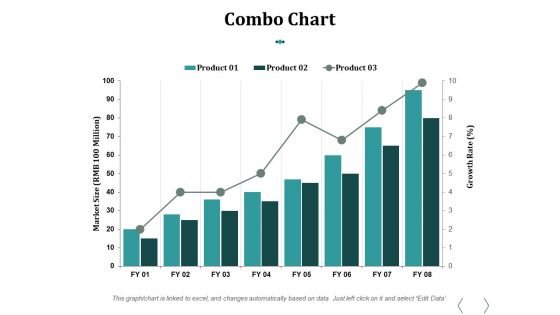
Combo Chart Ppt PowerPoint Presentation Summary Graphic Images
This is a combo chart ppt powerpoint presentation summary graphic images. This is a three stage process. The stages in this process are combo chart, product, growth, marketing, business.
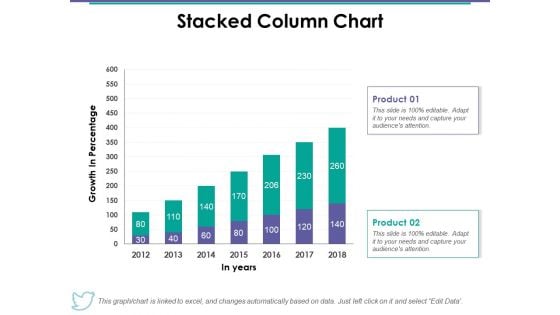
Stacked Column Chart Ppt PowerPoint Presentation Summary Gallery
This is a stacked column chart ppt powerpoint presentation summary gallery. This is a two stage process. The stages in this process are stacked column chart, product, in years, growth, percentage.
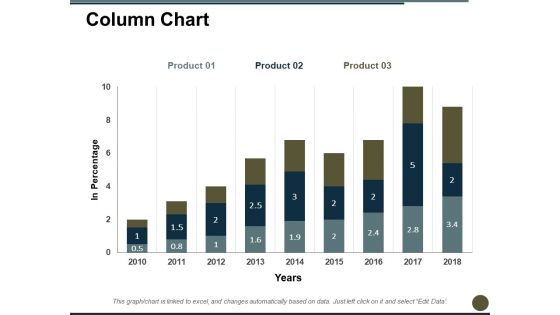
Column Chart Ppt PowerPoint Presentation Layouts File Formats
This is a column chart ppt powerpoint presentation layouts file formats. This is a three stage process. The stages in this process are column chart, product, in percentage, year, finance.
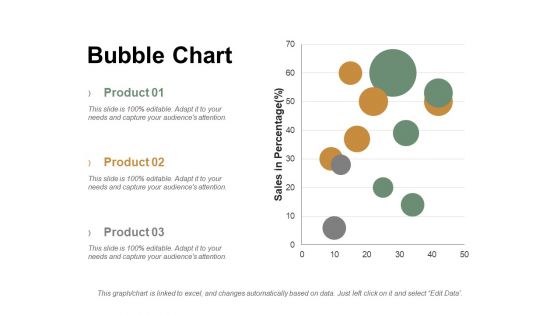
Bubble Chart Ppt PowerPoint Presentation Summary Graphics Tutorials
This is a bubble chart ppt powerpoint presentation summary graphics tutorials. This is a three stage process. The stages in this process are product, sales in percentage, bubble chart.
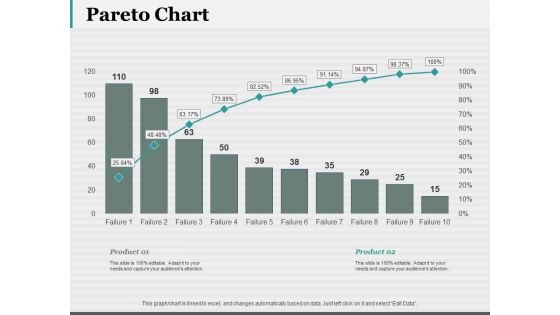
Pareto Chart Ppt PowerPoint Presentation Visual Aids Pictures
This is a pareto chart ppt powerpoint presentation visual aids pictures. This is a two stage process. The stages in this process are pareto chart, finance, marketing, strategy, business.

Bubble Chart Analysis Ppt PowerPoint Presentation Gallery Introduction
This is a bubble chart analysis ppt powerpoint presentation gallery introduction. This is a two stage process. The stages in this process are bubble chart, finance, marketing, strategy, business.
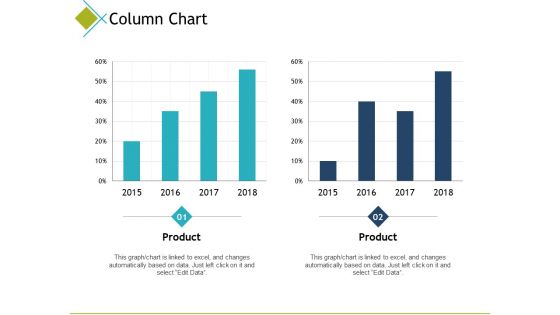
Column Chart Finance Ppt PowerPoint Presentation Model Examples
This is a column chart finance ppt powerpoint presentation model examples. This is a two stage process. The stages in this process are column chart, finance, marketing, analysis, investment.
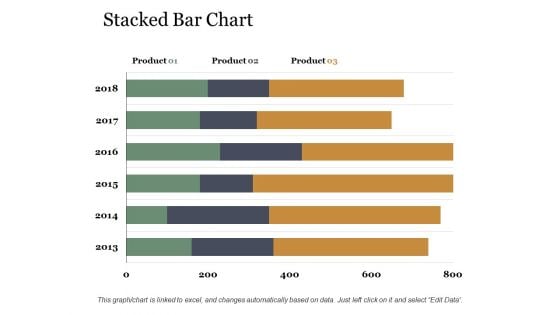
Stacked Bar Chart Ppt PowerPoint Presentation Portfolio Templates
This is a stacked bar chart ppt powerpoint presentation portfolio templates. This is a three stage process. The stages in this process are stacked bar chart, product, year, business, finance.
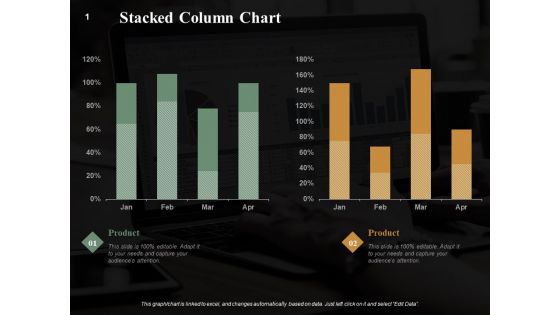
Stacked Column Chart Finance Ppt PowerPoint Presentation Summary Graphics Example
This is a stacked column chart finance ppt powerpoint presentation summary graphics example. This is a two stage process. The stages in this process are stacked column chart, marketing, analysis, business, investment.
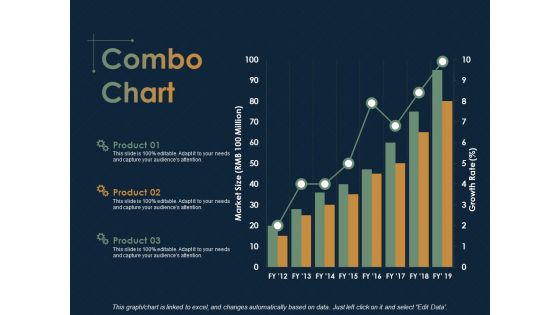
Combo Chart Finance Ppt PowerPoint Presentation Ideas Microsoft
This is a combo chart finance ppt powerpoint presentation ideas microsoft. This is a three stage process. The stages in this process are combo chart, Finance, Analysis, Business, Investment.

Area Chart Investment Ppt PowerPoint Presentation Styles Topics
This is a area chart investment ppt powerpoint presentation styles topics. This is a three stage process. The stages in this process are area chart, finance, marketing, analysis, investment.

Clustered Bar Financial Chart Ppt PowerPoint Presentation File Design Ideas
This is a clustered bar financial chart ppt powerpoint presentation file design ideas. This is a three stage process. The stages in this process are column chart, financial, business, marketing, planning, strategy.
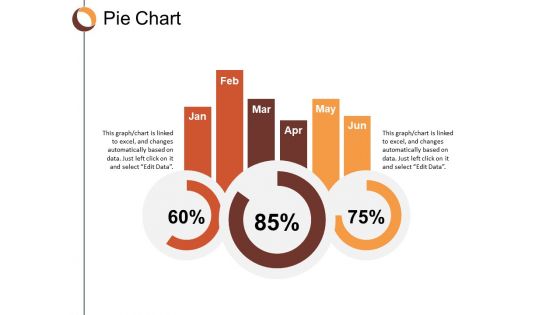
Pie Chart Finance Ppt Powerpoint Presentation Infographic Template Clipart
This is a pie chart finance ppt powerpoint presentation infographic template clipart. This is a three stage process. The stages in this process are pie chart, finance, marketing, business, analysis.
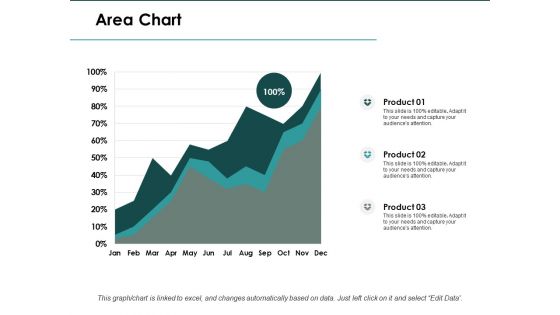
Area Chart Finance Ppt PowerPoint Presentation Infographics Slide
This is a area chart finance ppt powerpoint presentation infographics slide. This is a three stage process. The stages in this process are area chart, finance, marketing, analysis, investment.
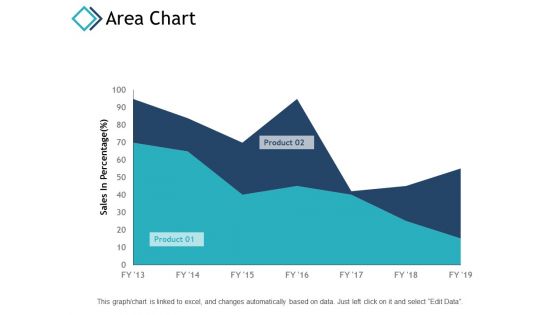
Area Chart Marketing Planning Ppt PowerPoint Presentation Ideas Maker
This is a area chart marketing planning ppt powerpoint presentation ideas maker. This is a two stage process. The stages in this process are area chart, finance, marketing, analysis, investment.
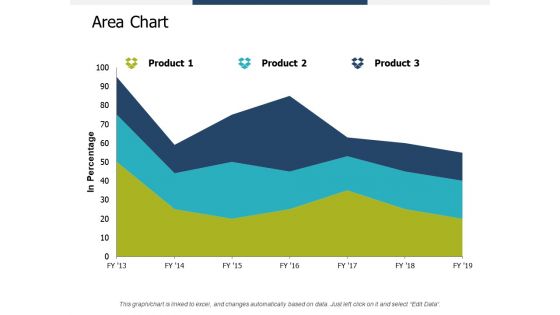
Area Chart Finance Marketing Ppt PowerPoint Presentation Gallery Styles
This is a area chart finance marketing ppt powerpoint presentation gallery styles. This is a three stage process. The stages in this process are area chart, finance, marketing, analysis, investment.
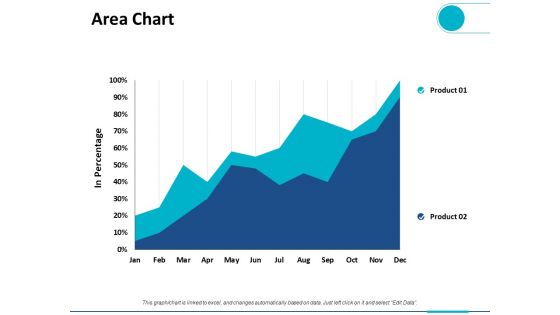
Area Chart Finance Ppt PowerPoint Presentation Pictures Clipart
This is a area chart finance ppt powerpoint presentation pictures clipart. This is a two stage process. The stages in this process are area chart, finance, marketing, analysis, investment.
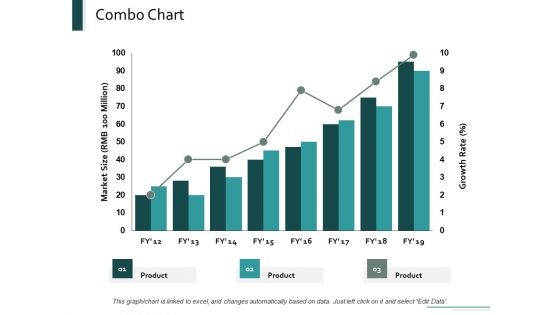
Combo Chart Marketing Ppt Powerpoint Presentation Layouts Designs Download
This is a combo chart marketing ppt powerpoint presentation layouts designs download. This is a three stage process. The stages in this process are combo chart, marketing, growth, product, finance.

CASB 2 0 IT Cloud Access Security Broker Pillar Overview
This slide represents the four major pillars of cloud access security broker. The purpose of this slide is to showcase the main pillars of implementing a cloud access security broker. The pillars include compliance, visibility, threat protection, and data security. Are you searching for a CASB 2 0 IT Cloud Access Security Broker Pillar Overview that is uncluttered, straightforward, and original Its easy to edit, and you can change the colors to suit your personal or business branding. For a presentation that expresses how much effort you have put in, this template is ideal With all of its features, including tables, diagrams, statistics, and lists, its perfect for a business plan presentation. Make your ideas more appealing with these professional slides. Download CASB 2 0 IT Cloud Access Security Broker Pillar Overview from Slidegeeks today. This slide represents the four major pillars of cloud access security broker. The purpose of this slide is to showcase the main pillars of implementing a cloud access security broker. The pillars include compliance, visibility, threat protection, and data security.
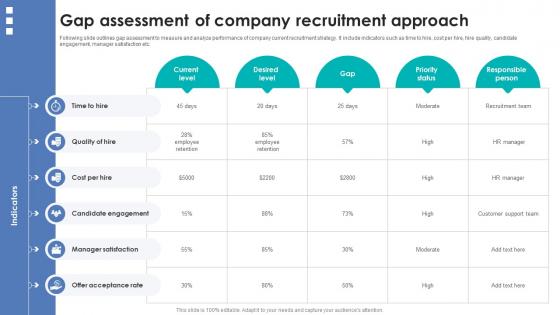
Integrating Automation For Effective Business Gap Assessment Of Company Recruitment Approach
Following slide outlines gap assessment to measure and analyze performance of company current recruitment strategy. It include indicators such as time to hire, cost per hire, hire quality, candidate engagement, manager satisfaction etc. Whether you have daily or monthly meetings, a brilliant presentation is necessary. Integrating Automation For Effective Business Gap Assessment Of Company Recruitment Approach can be your best option for delivering a presentation. Represent everything in detail using Integrating Automation For Effective Business Gap Assessment Of Company Recruitment Approach and make yourself stand out in meetings. The template is versatile and follows a structure that will cater to your requirements. All the templates prepared by Slidegeeks are easy to download and edit. Our research experts have taken care of the corporate themes as well. So, give it a try and see the results. Following slide outlines gap assessment to measure and analyze performance of company current recruitment strategy. It include indicators such as time to hire, cost per hire, hire quality, candidate engagement, manager satisfaction etc.
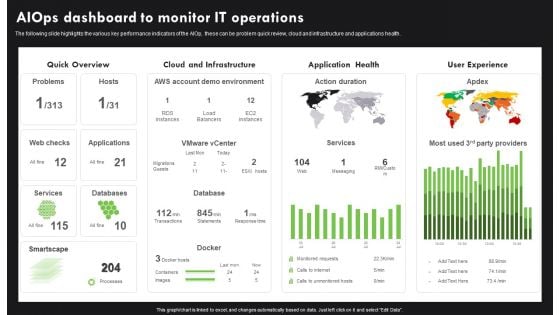
AI Deployment In IT Process Aiops Dashboard To Monitor IT Operations Infographics PDF
The following slide highlights the various key performance indicators of the AIOp, these can be problem quick review, cloud and infrastructure and applications health. If you are looking for a format to display your unique thoughts, then the professionally designed AI Deployment In IT Process Aiops Dashboard To Monitor IT Operations Infographics PDF is the one for you. You can use it as a Google Slides template or a PowerPoint template. Incorporate impressive visuals, symbols, images, and other charts. Modify or reorganize the text boxes as you desire. Experiment with shade schemes and font pairings. Alter, share or cooperate with other people on your work. Download AI Deployment In IT Process Aiops Dashboard To Monitor IT Operations Infographics PDF and find out how to give a successful presentation. Present a perfect display to your team and make your presentation unforgettable.
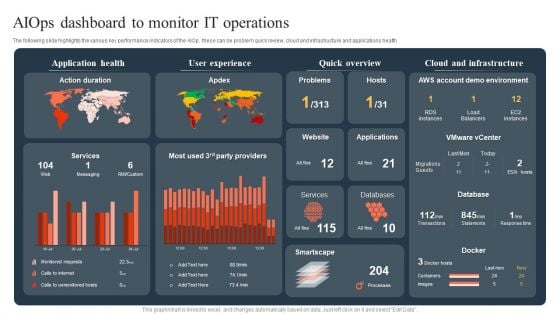
Ml And Big Data In Information Technology Processes Aiops Dashboard To Monitor IT Operations Sample PDF
The following slide highlights the various key performance indicators of the AIOp, these can be problem quick review, cloud and infrastructure and applications health If you are looking for a format to display your unique thoughts, then the professionally designed Ml And Big Data In Information Technology Processes Aiops Dashboard To Monitor IT Operations Sample PDF is the one for you. You can use it as a Google Slides template or a PowerPoint template. Incorporate impressive visuals, symbols, images, and other charts. Modify or reorganize the text boxes as you desire. Experiment with shade schemes and font pairings. Alter, share or cooperate with other people on your work. Download Ml And Big Data In Information Technology Processes Aiops Dashboard To Monitor IT Operations Sample PDF and find out how to give a successful presentation. Present a perfect display to your team and make your presentation unforgettable.
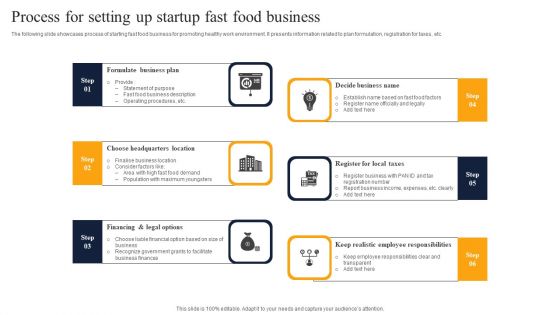
Process For Setting Up Startup Fast Food Business Ideas PDF
The following slide showcases process of starting fast food business for promoting healthy work environment. It presents information related to plan formulation, registration for taxes, etc. Presenting Process For Setting Up Startup Fast Food Business Ideas PDF to dispense important information. This template comprises six stages. It also presents valuable insights into the topics including Decide Business Name, Register For Local Taxes, Formulate Business Plan. This is a completely customizable PowerPoint theme that can be put to use immediately. So, download it and address the topic impactfully.
Bulb Or Idea Technology Ppt PowerPoint Presentation Slides Diagrams
Presenting this set of slides with name bulb or idea technology ppt powerpoint presentation slides diagrams. This is a four stage process. The stages in this process are bulb, idea, technology, marketing, planning. This is a completely editable PowerPoint presentation and is available for immediate download. Download now and impress your audience.
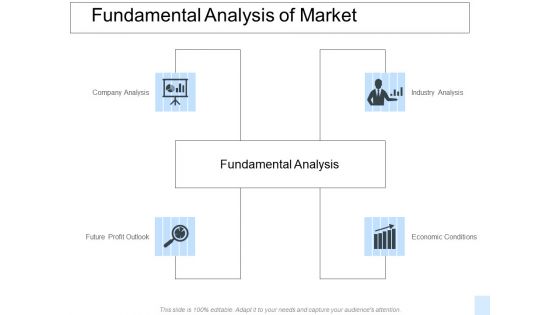
Fundamental Analysis Of Market Ppt PowerPoint Presentation Diagrams
Presenting this set of slides with name fundamental analysis of market ppt powerpoint presentation diagrams. This is a four stage process. The stages in this process are industry analysis, economic conditions, company analysis, technology, planning. This is a completely editable PowerPoint presentation and is available for immediate download. Download now and impress your audience.
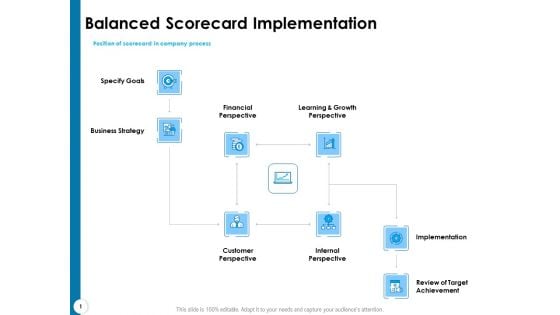
Strategy Execution Balanced Scorecard Balanced Scorecard Implementation Diagrams PDF
Presenting this set of slides with name strategy execution balanced scorecard balanced scorecard implementation diagrams pdf. This is a eight stage process. The stages in this process are specify goals, business strategy, financial perspective, customer perspective, internal perspective, implementation, learning and growth perspective. This is a completely editable PowerPoint presentation and is available for immediate download. Download now and impress your audience.
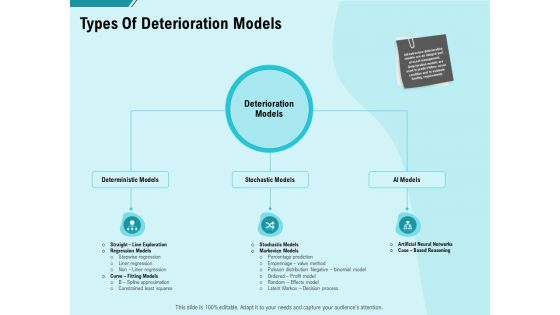
facility operations contol types of deterioration models ppt diagrams pdf
Presenting this set of slides with name facility operations contol types of deterioration models ppt diagrams pdf. This is a three stage process. The stages in this process are deterministic models, stochastic models, al models. This is a completely editable PowerPoint presentation and is available for immediate download. Download now and impress your audience.
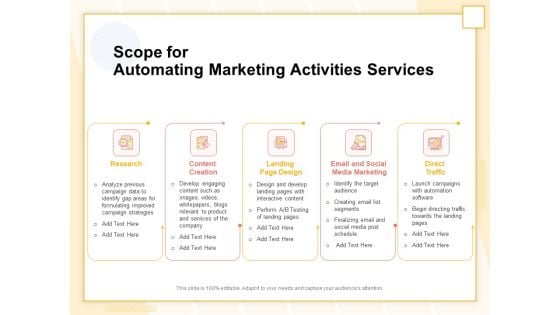
Marketing Automation Scope For Automating Marketing Activities Services Diagrams PDF
Presenting this set of slides with name marketing automation scope for automating marketing activities services diagrams pdf. This is a five stage process. The stages in this process are research, content creation, landing page design, email and social media marketing, direct traffic. This is a completely editable PowerPoint presentation and is available for immediate download. Download now and impress your audience.
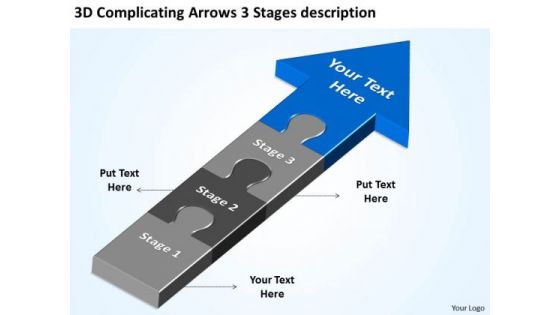
3d Complicating Arrows Stages Description Consulting Business Plan PowerPoint Templates
We present our 3d complicating arrows stages description consulting business plan PowerPoint templates.Download our Symbol PowerPoint Templates because you know the path so show the way. Present our Flow charts PowerPoint Templates because you know that the core of any organisation is the people who work for it. Use our Arrows PowerPoint Templates because all elements of the venture are equally critical. Present our Puzzles or Jigsaws PowerPoint Templates because Our PowerPoint Templates and Slides will help you be quick off the draw. Just enter your specific text and see your points hit home. Present our Business PowerPoint Templates because everybody knows The world over it is a priority for many. Along with it there are so many oppurtunities waiting to be utilised.Use these PowerPoint slides for presentations relating to 3d, Puzzle, Process, Arrow, Arrows, Block, Business, Chart, Design, Development, Diagram, Direction, Element, Flow, Flowchart, Graph, Linear, Management, Organization, Process, Program, Section, Sign, Solution, Symbol. The prominent colors used in the PowerPoint template are Blue, Gray, Black. Professionals tell us our 3d complicating arrows stages description consulting business plan PowerPoint templates effectively help you save your valuable time. We assure you our Arrows PowerPoint templates and PPT Slides are Romantic. People tell us our 3d complicating arrows stages description consulting business plan PowerPoint templates are Quaint. Customers tell us our Chart PowerPoint templates and PPT Slides are Beautiful. Use our 3d complicating arrows stages description consulting business plan PowerPoint templates have awesome images to get your point across. We assure you our Process PowerPoint templates and PPT Slides are Youthful. Your audience will feast upon our 3d Complicating Arrows Stages Description Consulting Business Plan PowerPoint Templates. They provide ample eye candy.
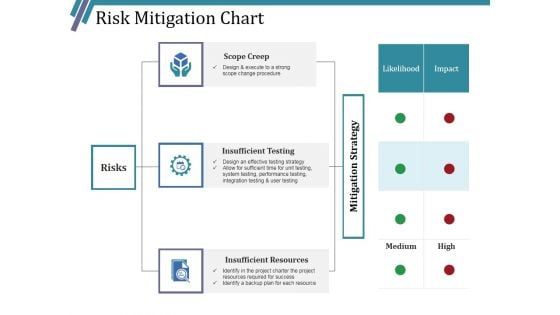
Risk Mitigation Chart Ppt PowerPoint Presentation Infographic Template Layouts
This is a risk mitigation chart ppt powerpoint presentation infographic template layouts. This is a three stage process. The stages in this process are scope creep, insufficient testing, insufficient resources, risks.
Incident Request Tracking Flowchart Ppt PowerPoint Presentation Diagram Templates PDF
The following slide illustrates incident request tracking flowchart. It provides information about service level agreement SLA escalation, notification, reallocation, service outage, threshold, incident escalation, etc. If your project calls for a presentation, then Slidegeeks is your go to partner because we have professionally designed, easy to edit templates that are perfect for any presentation. After downloading, you can easily edit Incident Request Tracking Flowchart Ppt PowerPoint Presentation Diagram Templates PDF and make the changes accordingly. You can rearrange slides or fill them with different images. Check out all the handy templates.
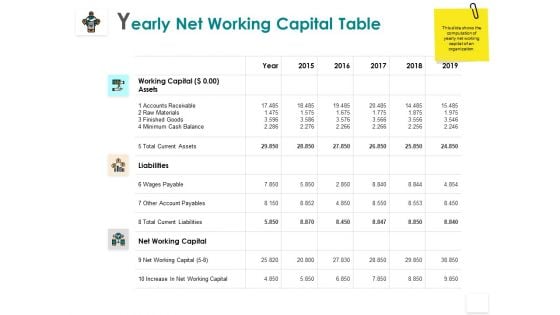
Yearly Net Working Capital Table Liabilities Minimum Ppt PowerPoint Presentation Infographic Template Diagrams
Presenting this set of slides with name yearly net working capital table liabilities minimum ppt powerpoint presentation infographic template diagrams. The topics discussed in these slides are liabilities, increase, business, planning, strategy. This is a completely editable PowerPoint presentation and is available for immediate download. Download now and impress your audience.
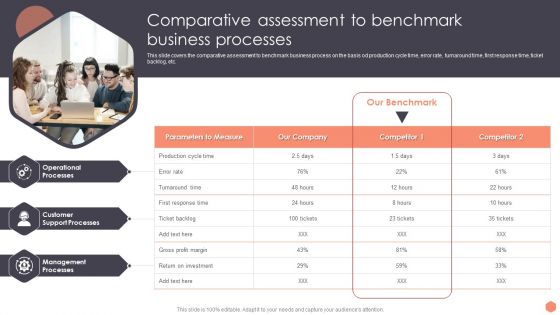
Business Optimization Techniques Comparative Assessment To Benchmark Business Processes Diagrams PDF
This slide covers the comparative assessment to benchmark business process on the basis od production cycle time, error rate, turnaround time, first response time, ticket backlog, etc.Find highly impressive Business Optimization Techniques Comparative Assessment To Benchmark Business Processes Diagrams PDF on Slidegeeks to deliver a meaningful presentation. You can save an ample amount of time using these presentation templates. No need to worry to prepare everything from scratch because Slidegeeks experts have already done a huge research and work for you. You need to download Business Optimization Techniques Comparative Assessment To Benchmark Business Processes Diagrams PDF for your upcoming presentation. All the presentation templates are 100 Precent editable and you can change the color and personalize the content accordingly. Download now.
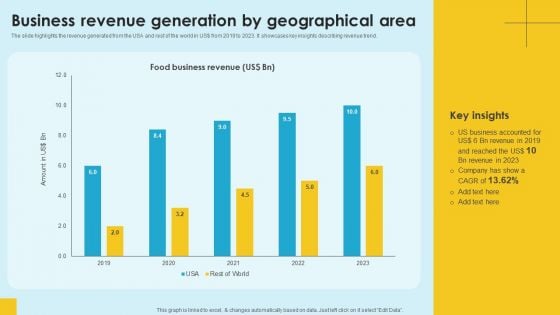
Food Company Financial Performance Summary Business Revenue Generation By Geographical Area Elements PDF
The slide highlights the revenue generated from the USA and rest of the world in US dollar from 2019 to 2023. It showcases key insights describing revenue trend. Retrieve professionally designed Food Company Financial Performance Summary Business Revenue Generation By Geographical Area Elements PDF to effectively convey your message and captivate your listeners. Save time by selecting pre-made slideshows that are appropriate for various topics, from business to educational purposes. These themes come in many different styles, from creative to corporate, and all of them are easily adjustable and can be edited quickly. Access them as PowerPoint templates or as Google Slides themes. You do not have to go on a hunt for the perfect presentation because Slidegeeks got you covered from everywhere.
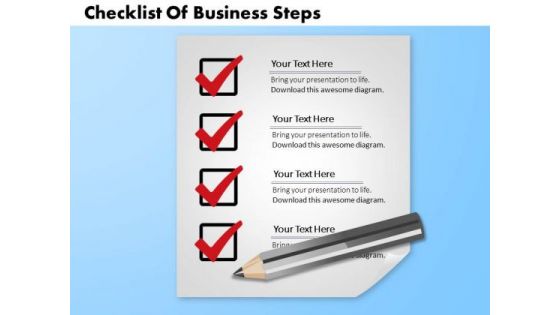
Business Diagram Checklist Of Business Steps Presentation Template
This business consulting diagram mostly used as processing step-charts and decision-charts. This diagram enables the user to create their own display of the required processes in an easy way.
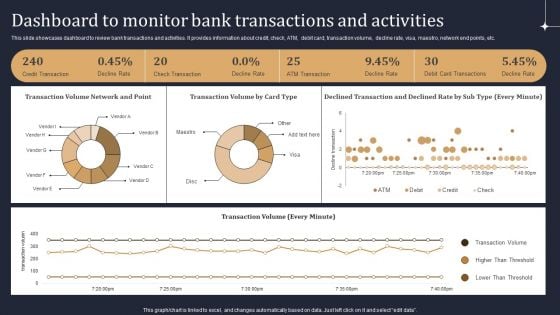
KYC Transaction Monitoring System Business Security Dashboard To Monitor Bank Transactions Mockup PDF
This slide showcases dashboard to review bank transactions and activities. It provides information about credit, check, ATM, debit card, transaction volume, decline rate, visa, maestro, network end points, etc. This KYC Transaction Monitoring System Business Security Dashboard To Monitor Bank Transactions Mockup PDF from Slidegeeks makes it easy to present information on your topic with precision. It provides customization options, so you can make changes to the colors, design, graphics, or any other component to create a unique layout. It is also available for immediate download, so you can begin using it right away. Slidegeeks has done good research to ensure that you have everything you need to make your presentation stand out. Make a name out there for a brilliant performance.
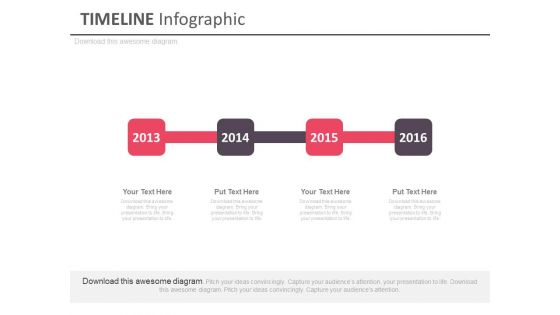
Linear Flow Year Based Timeline Diagram Powerpoint Slides
This PowerPoint template has been designed with graphics of linear steps timeline diagram. You may download this timeline diagram slide to show progress or the aims of your organizations. Chart the course you intend to take with this slide.
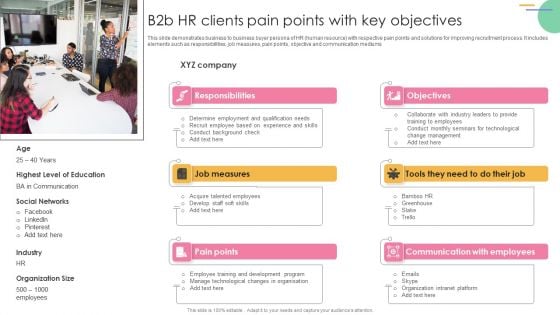
B2B HR Clients Pain Points With Key Objectives Diagrams PDF
This slide demonstrates business to business buyer persona of HR human resource with respective pain points and solutions for improving recruitment process. It includes elements such as responsibilities, job measures, pain points, objective and communication mediums. Presenting B2B HR Clients Pain Points With Key Objectives Diagrams PDF to dispense important information. This template comprises six stages. It also presents valuable insights into the topics including Job Measures, Communication With Employees, Organization Intranet Platform. This is a completely customizable PowerPoint theme that can be put to use immediately. So, download it and address the topic impactfully.
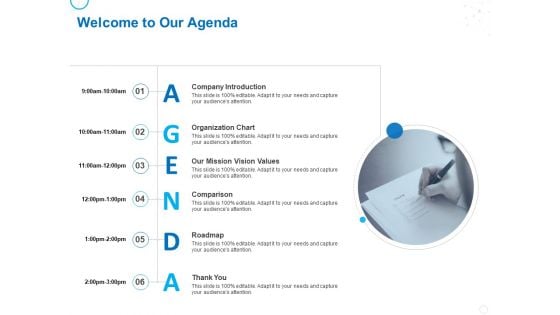
Service Strategy And Service Lifecycle Implementation Welcome To Our Agenda Ppt Inspiration Ideas PDF
Presenting this set of slides with name service strategy and service lifecycle implementation welcome to our agenda ppt inspiration ideas pdf. This is a six stage process. The stages in this process are company introduction, organization chart, our mission vision values, comparison, roadmap, thank you. This is a completely editable PowerPoint presentation and is available for immediate download. Download now and impress your audience.
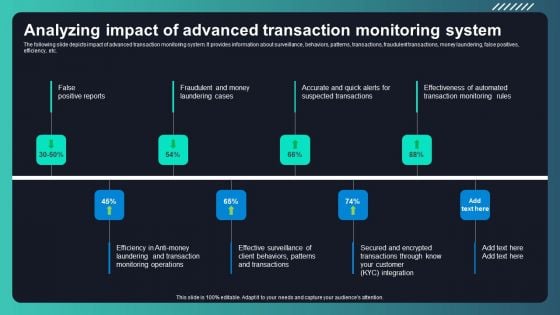
Deploying AML Transaction Monitoring Analyzing Impact Of Advanced Transaction Diagrams PDF
The following slide depicts impact of advanced transaction monitoring system. It provides information about surveillance, behaviors, patterns, transactions, fraudulent transactions, money laundering, false positives, efficiency, etc. Boost your pitch with our creative Deploying AML Transaction Monitoring Analyzing Impact Of Advanced Transaction Diagrams PDF. Deliver an awe-inspiring pitch that will mesmerize everyone. Using these presentation templates you will surely catch everyones attention. You can browse the ppts collection on our website. We have researchers who are experts at creating the right content for the templates. So you do not have to invest time in any additional work. Just grab the template now and use them.
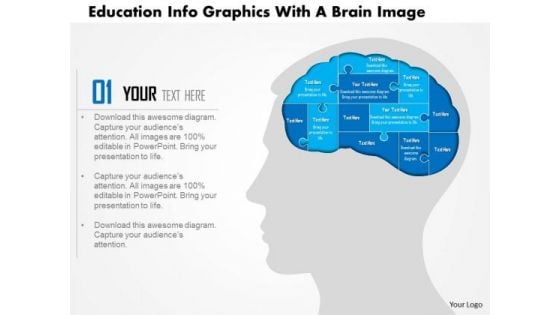
Business Diagram Education Info Graphics With A Brain Image Presentation Template
This business power point template has been crafted with graphic of octagon. This octagon contains the eight steps for displaying process flow. Use this diagram template in your presentations and display the linear process flow.

Growing Income And Business Chart PowerPoint Templates Ppt Backgrounds For Slides 0813
Collect accolades with our Growing Income And Business Chart PowerPoint Templates PPT Backgrounds For Slides. Your audience will dub you The Master. Drum it out loud and clear on our Finance PowerPoint Templates. Your words will ring in their ears. Remove the drudgery from it all. Cheer your audience with our Process and Flows PowerPoint Templates.
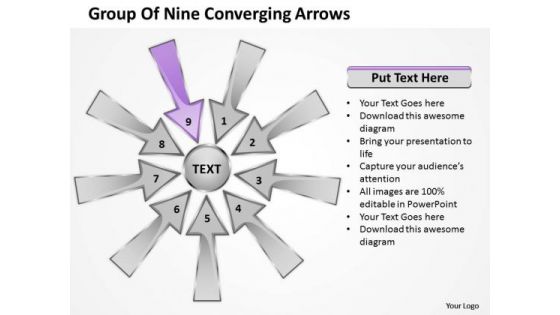
Group Of Nine Coverging Arrows Ppt Circular Flow Process PowerPoint Slide
We present our group of nine coverging arrows ppt Circular Flow Process PowerPoint Slide.Use our Success PowerPoint Templates because the majestic tiger lord of all it surveys.It exudes power even when it is in repose. Present our Symbol PowerPoint Templates because your foot is on the pedal and your company is purring along smoothly. Download and present our Arrows PowerPoint Templates because this template helps you to delve on these thoughts and brief your team on the value of your depth of understanding of the subject. Use our Process and Flows PowerPoint Templates because it can convey all the options that present themselves. Download our Shapes PowerPoint Templates because this helps in epitomised the values of teamwork.Use these PowerPoint slides for presentations relating to Arrow, Art, Business, Chart, Design, Development, Diagram, Flow, Flowchart, Graphic, Gray, Idea, Info, Graphic, Management, Method, Model, Process, Quality, Rainbow, Research, Sign, Software, Strategy, Success, System, Template, Text, Vector, Website, Work. The prominent colors used in the PowerPoint template are Purple, Gray, Black. Customers tell us our group of nine coverging arrows ppt Circular Flow Process PowerPoint Slide are Charming. Customers tell us our Chart PowerPoint templates and PPT Slides are Lush. Presenters tell us our group of nine coverging arrows ppt Circular Flow Process PowerPoint Slide are topically designed to provide an attractive backdrop to any subject. PowerPoint presentation experts tell us our Chart PowerPoint templates and PPT Slides are Youthful. Customers tell us our group of nine coverging arrows ppt Circular Flow Process PowerPoint Slide are Dynamic. Professionals tell us our Flowchart PowerPoint templates and PPT Slides are Perfect. Feed your thoughts into our Group Of Nine Coverging Arrows Ppt Circular Flow Process PowerPoint Slide. They will come off in a delightful way.
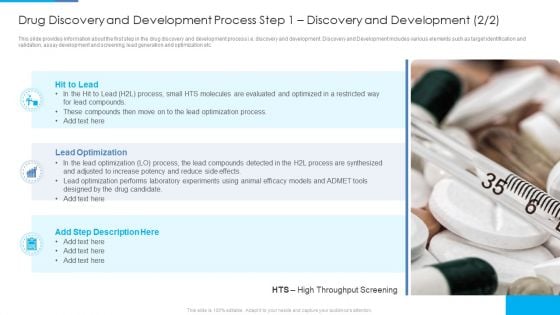
Drug Discovery And Development Process Step 1 Discovery And Development Diagrams PDF
This slide provides information about the first step in the drug discovery and development process i.e. discovery and development. Discovery and Development includes various elements such as target identification and validation, assay development and screening, lead generation and optimization etc. Deliver and pitch your topic in the best possible manner with this drug discovery and development process step 1 discovery and development diagrams pdf. Use them to share invaluable insights on lead optimization, lead optimization process, lead compounds and impress your audience. This template can be altered and modified as per your expectations. So, grab it now.


 Continue with Email

 Home
Home


