Control Icon
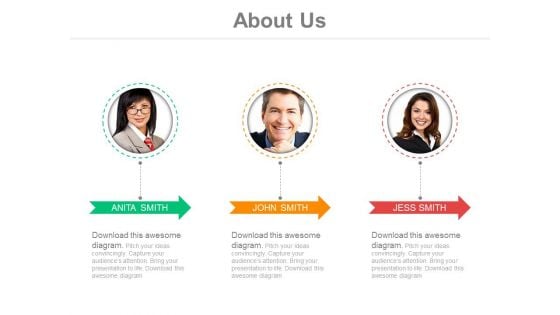
Team Working For Vision And Values Powerpoint Slides
This PowerPoint template has been designed with graphics of business team. This diagram is excellent visual tools to display business vision and values. Capture the attention of your audience using this PPT diagram slide.
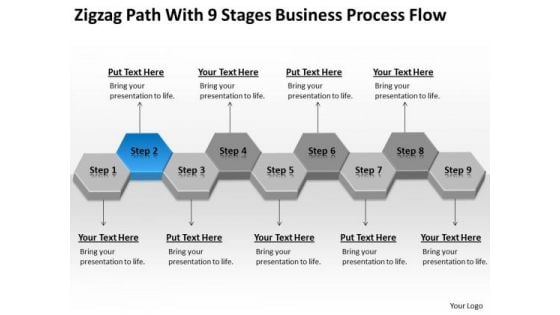
Path With 9 Stages Business Process Flow Ppt How Do You Write Plan PowerPoint Slides
We present our path with 9 stages business process flow ppt how do you write plan PowerPoint Slides.Download and present our Flow Charts PowerPoint Templates because You have gained great respect for your brilliant ideas. Use our PowerPoint Templates and Slides to strengthen and enhance your reputation. Use our Hexagon PowerPoint Templates because Our PowerPoint Templates and Slides are aesthetically designed to attract attention. We gaurantee that they will grab all the eyeballs you need. Present our Business PowerPoint Templates because Our PowerPoint Templates and Slides will let Your superior ideas hit the target always and everytime. Present our Process and Flows PowerPoint Templates because Our PowerPoint Templates and Slides will provide you the cutting edge. Slice through the doubts in the minds of your listeners. Download and present our Shapes PowerPoint Templates because They will bring a lot to the table. Their alluring flavours will make your audience salivate.Use these PowerPoint slides for presentations relating to Abstract, backdrop, background, cell, nine, communication, concept, connect, connection, design, detail, digital, element, form, futuristic,geometric, geometry, graphic, grid, hexagon, hexagonal, honeycomb, illustration, internet, network, path, pattern, reflection, science, shape, structure, technology, texture. The prominent colors used in the PowerPoint template are Blue, Black, Gray. Facing upto difficulties is an essential element. Bolster everyone's courage with our Path With 9 Stages Business Process Flow Ppt How Do You Write Plan PowerPoint Slides.
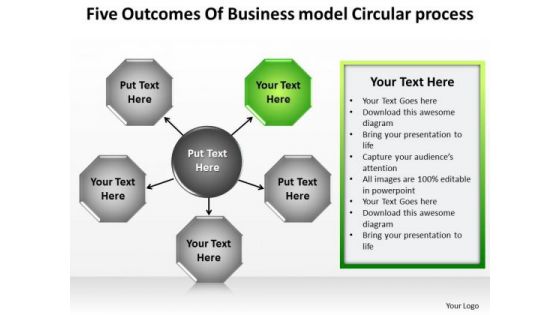
Five Outcomes Of Business Model Circular Process Ppt 1 Mock Plan PowerPoint Templates
We present our five outcomes of business model circular process ppt 1 mock plan PowerPoint templates.Download our Business PowerPoint Templates because this is the unerring accuracy in reaching the target. the effortless ability to launch into flight. Use our Arrows PowerPoint Templates because there is a very good saying that prevention is better than cure, either way you have a store of knowledge for sure. Download and present our Success PowerPoint Templates because the success of your venture depends on the performance of every team member. Download our Marketing PowerPoint Templates because you can Ring them out loud with your brilliant ideas. Present our Process and Flows PowerPoint Templates because they are logical, accurate and to the point.Use these PowerPoint slides for presentations relating to Background, business, chart, circle, colors, concept, cycle, data, development, diagram, graphic, illustration, model, objects, organization, phase, plan, process, product, project, shape, software, steps, strategy, success, system, team, workflow. The prominent colors used in the PowerPoint template are Green, Black, Gray. Use our five outcomes of business model circular process ppt 1 mock plan PowerPoint templates are Lush. Customers tell us our data PowerPoint templates and PPT Slides are effectively colour coded to prioritise your plans They automatically highlight the sequence of events you desire. You can be sure our five outcomes of business model circular process ppt 1 mock plan PowerPoint templates are Royal. The feedback we get is that our cycle PowerPoint templates and PPT Slides are Liberated. You can be sure our five outcomes of business model circular process ppt 1 mock plan PowerPoint templates are Swanky. People tell us our circle PowerPoint templates and PPT Slides are Excellent. Familiarise your team with your beliefs. Display your credo on our Five Outcomes Of Business Model Circular Process Ppt 1 Mock Plan PowerPoint Templates.
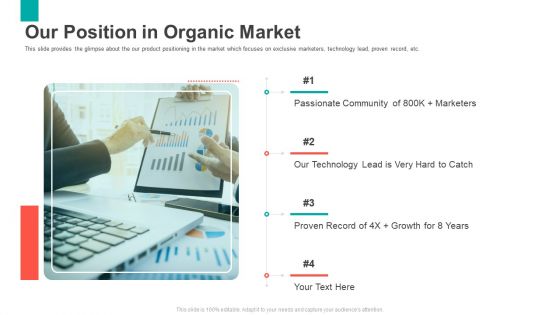
Series B Capital Funding Pitch Deck Our Position In Organic Market Themes PDF
This slide provides the glimpse about the our product positioning in the market which focuses on exclusive marketers, technology lead, proven record, etc. Presenting series b capital funding pitch deck our position in organic market themes pdf to provide visual cues and insights. Share and navigate important information on four stages that need your due attention. This template can be used to pitch topics like growth, technology, marketers. In addtion, this PPT design contains high resolution images, graphics, etc, that are easily editable and available for immediate download.
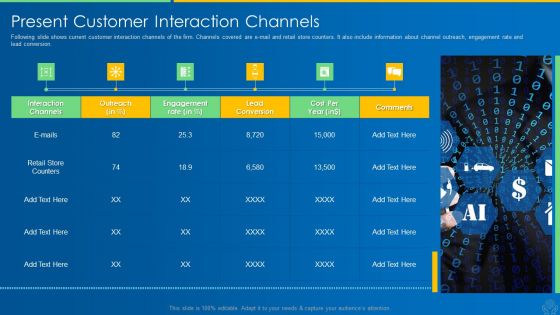
AI And ML Driving Monetary Value For Organization Present Customer Interaction Channels Themes PDF
Following slide shows current customer interaction channels of the firm. Channels covered are e-mail and retail store counters. It also include information about channel outreach, engagement rate and lead conversion. Deliver an awe inspiring pitch with this creative ai and ml driving monetary value for organization present customer interaction channels themes pdf bundle. Topics like interaction channels, outreach, engagement rate, lead conversion, cost per year can be discussed with this completely editable template. It is available for immediate download depending on the needs and requirements of the user.
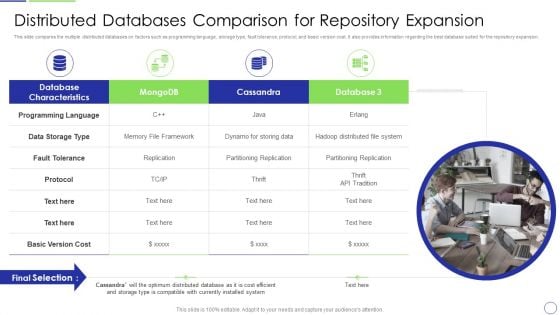
Developing Organization Primary Data Storage Action Plan Distributed Databases Comparison For Repository Expansion Themes PDF
This slide compares the multiple distributed databases on factors such as programming language, storage type, fault tolerance, protocol, and basic version cost. It also provides information regarding the best database suited for the repository expansion. Presenting developing organization primary data storage action plan distributed databases comparison for repository expansion themes pdf to provide visual cues and insights. Share and navigate important information on four stages that need your due attention. This template can be used to pitch topics like distributed databases comparison for repository expansion. In addtion, this PPT design contains high resolution images, graphics, etc, that are easily editable and available for immediate download.
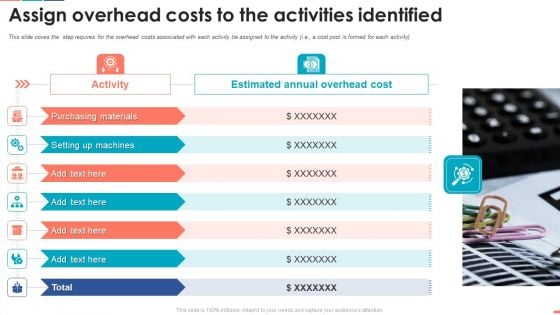
Summarize Techniques For Organization Cost Allocation Assign Overhead Costs Themes PDF
This slide coves the step requires for the overhead costs associated with each activity be assigned to the activity i.e. a cost pool is formed for each activity Presenting summarize techniques for organization cost allocation assign overhead costs themes pdf to provide visual cues and insights. Share and navigate important information on seven stages that need your due attention. This template can be used to pitch topics like purchasing materials, cost. In addtion, this PPT design contains high resolution images, graphics, etc, that are easily editable and available for immediate download.
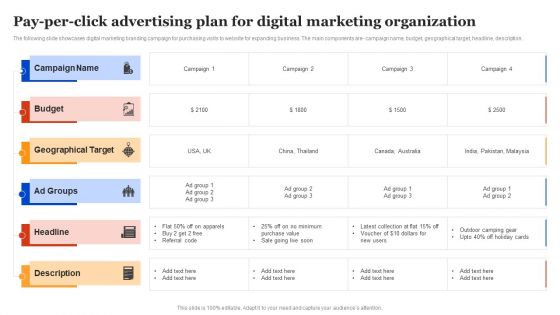
Pay Per Click Advertising Plan For Digital Marketing Organization Themes PDF
The following slide showcases digital marketing branding campaign for purchasing visits to website for expanding business. The main components are campaign name, budget, geographical target, headline, description. Pitch your topic with ease and precision using this Pay Per Click Advertising Plan For Digital Marketing Organization Themes PDF. This layout presents information on Campaign Name, Budget, Geographical Target. It is also available for immediate download and adjustment. So, changes can be made in the color, design, graphics or any other component to create a unique layout.
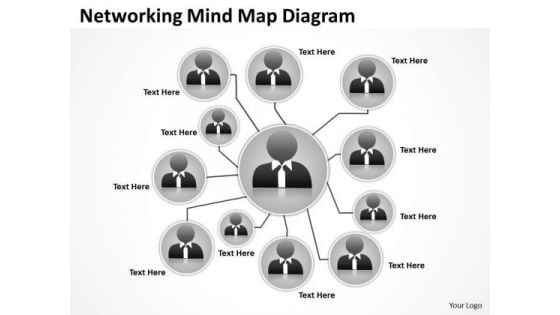
Networking Mind Map Diagram Ppt Business Plan For PowerPoint Slides
We present our networking mind map diagram ppt business plan for PowerPoint Slides.Present our People PowerPoint Templates because Our PowerPoint Templates and Slides are designed to help you succeed. They have all the ingredients you need. Download and present our Mindmaps PowerPoint Templates because Our PowerPoint Templates and Slides are effectively colour coded to prioritise your plans They automatically highlight the sequence of events you desire. Download our Communication PowerPoint Templates because Our PowerPoint Templates and Slides offer you the needful to organise your thoughts. Use them to list out your views in a logical sequence. Use our Process and Flows PowerPoint Templates because You are well armed with penetrative ideas. Our PowerPoint Templates and Slides will provide the gunpowder you need. Download and present our Business PowerPoint Templates because It is Aesthetically crafted by artistic young minds. Our PowerPoint Templates and Slides are designed to display your dexterity.Use these PowerPoint slides for presentations relating to 3d,network, social, center, call, virtual, support, business, customer, user, global, leader, isolated, greeting, friends, net, worldwide, community, telephone, teamwork,internet, partnership, service, digital, people, marketing, united, technology, union, team, illustration, connection, meet, group, share, person, metaphor, connected,businesspeople, message, office, online, man, more, communication. The prominent colors used in the PowerPoint template are Black, White, Gray. Achieving excellence is not extraordinary for our Networking Mind Map Diagram Ppt Business Plan For PowerPoint Slides. Being exceptional is the basic benchmark.
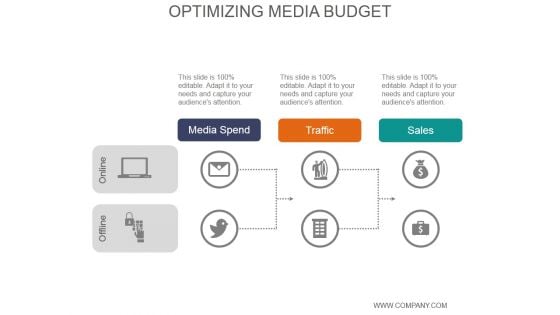
Optimizing Media Budget Ppt PowerPoint Presentation Inspiration
This is a optimizing media budget ppt powerpoint presentation inspiration. This is a three stage process. The stages in this process are media spend, traffic, sales.
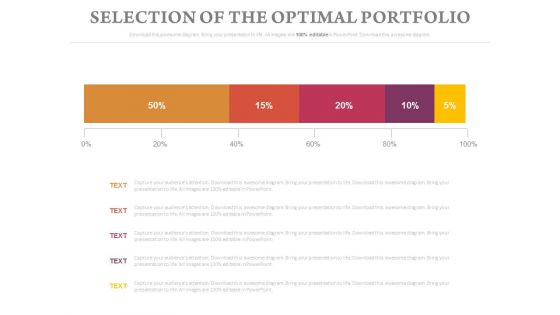
Selection Of The Optimal Portfolio Chart Ppt Slides
This is a selection of the optimal portfolio chart ppt slides. This is a five stage process. The stages in this process are business, finance, marketing.
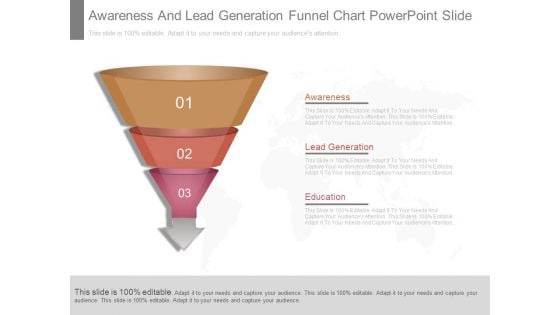
Awareness And Lead Generation Funnel Chart Powerpoint Slide
This is a awareness and lead generation funnel chart powerpoint slide. This is a three stage process. The stages in this process are awareness, lead generation, education.
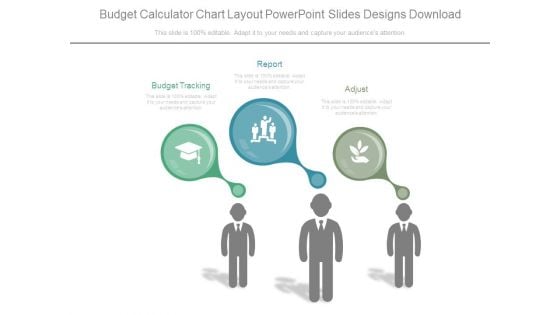
Budget Calculator Chart Layout Powerpoint Slides Designs Download
This is a budget calculator chart layout powerpoint slides designs download. This is a three stage process. The stages in this process are budget tracking, report, adjust.
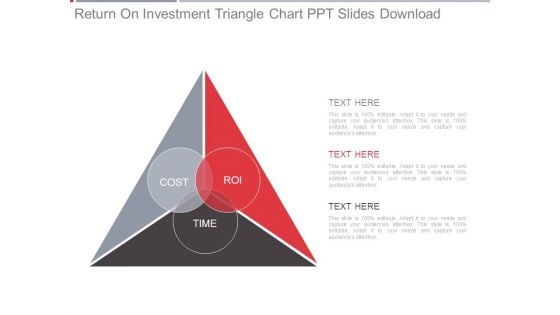
Return On Investment Triangle Chart Ppt Slides Download
This is a return on investment triangle chart ppt slides download. This is a three stage process. The stages in this process are cost, roi, time.
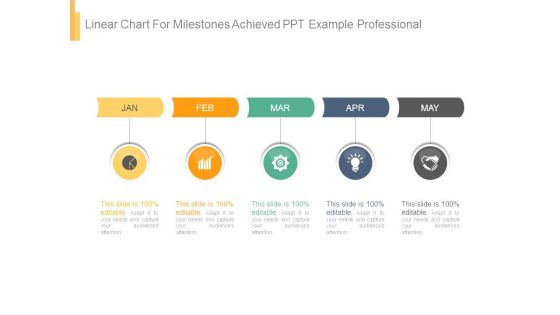
Linear Chart For Milestones Achieved Ppt Example Professional
This is a linear chart for milestones achieved ppt example professional. This is a five stage process. The stages in this process are jan, feb, mar, apr, may.
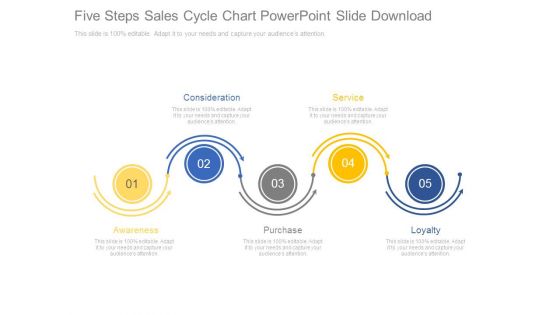
Five Steps Sales Cycle Chart Powerpoint Slide Download
This is a five steps sales cycle chart powerpoint slide download. This is a five stage process. The stages in this process are consideration, service, loyalty, purchase, awareness.
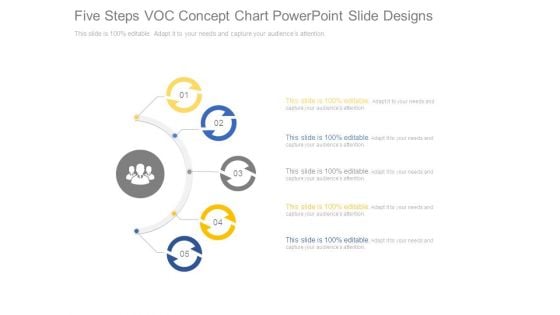
Five Steps Voc Concept Chart Powerpoint Slide Designs
This is a five steps voc concept chart powerpoint slide designs. This is a five stage process. The stages in this process are analysis, marketing, presentation, strategy.
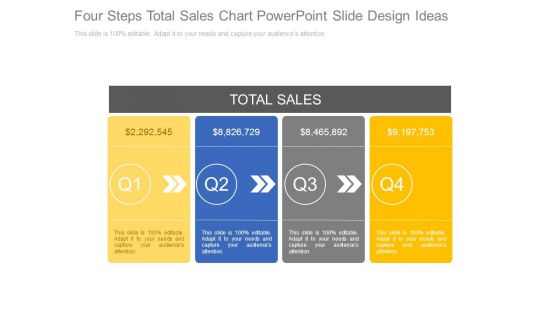
Four Steps Total Sales Chart Powerpoint Slide Design Ideas
This is a four steps total sales chart powerpoint slide design ideas. This is a four stage process. The stages in this process are total sales, marketing.
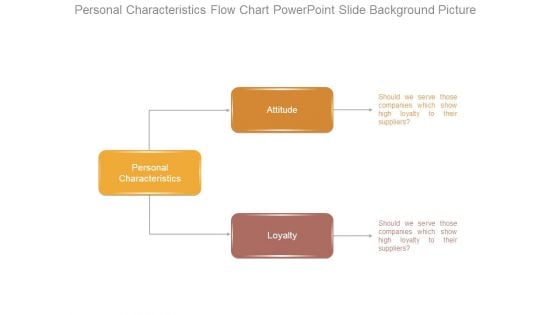
Personal Characteristics Flow Chart Powerpoint Slide Background Picture
This is a personal characteristics flow chart powerpoint slide background picture. This is a three stage process. The stages in this process are attitude, personal characteristics, loyalty.
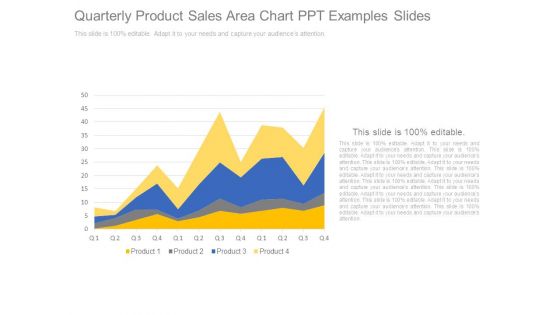
Quarterly Product Sales Area Chart Ppt Examples Slides
This is a quarterly product sales area chart ppt examples slides. This is a four stage process. The stages in this process are product, business, marketing, success, sales.
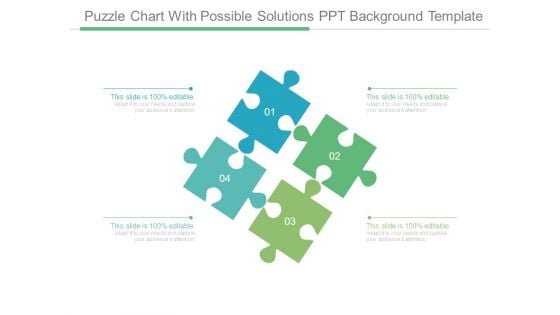
Puzzle Chart With Possible Solutions Ppt Background Template
This is a puzzle chart with possible solutions ppt background template. This is a four stage process. The stages in this process are puzzles, problem, solution, business, marketing.
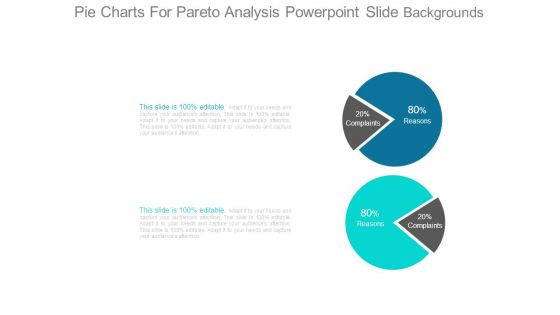
Pie Charts For Pareto Analysis Powerpoint Slide Backgrounds
This is a pie charts for pareto analysis powerpoint slide backgrounds. This is a two stage process. The stages in this process are reasons, complaints.
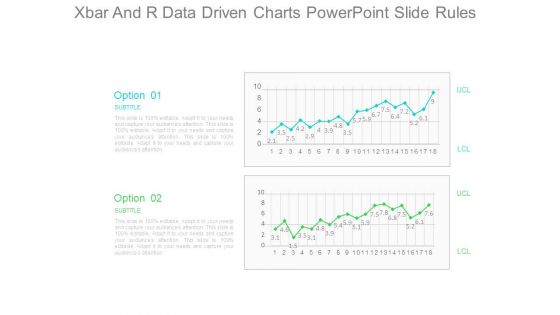
Xbar And R Data Driven Charts Powerpoint Slide Rules
This is a xbar and r data driven charts powerpoint slide rules. This is a two stage process. The stages in this process are option, subtitle, lcl, ucl.
What If Modelling Hexagon Chart Powerpoint Slide Graphics
This is a what if modelling hexagon chart powerpoint slide graphics. This is a three stage process. The stages in this process are what if modelling.
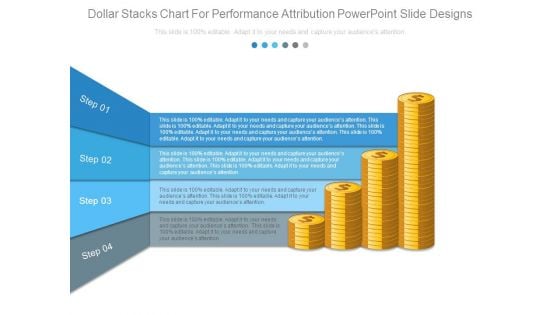
Dollar Stacks Chart For Performance Attribution Powerpoint Slide Designs
This is a dollar stacks chart for performance attribution powerpoint slide designs. This is a four stage process. The stages in this process are step.
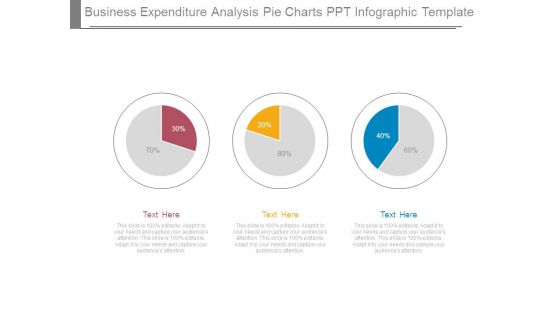
Business Expenditure Analysis Pie Charts Ppt Infographic Template
This is a business expenditure analysis pie charts ppt infographic template. This is a three stage process. The stages in this process are pie, business, marketing, finance, success.
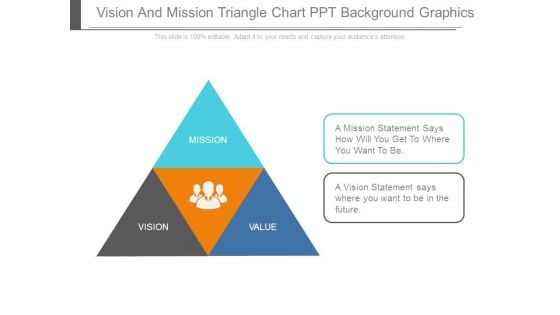
Vision And Mission Triangle Chart Ppt Background Graphics
This is a vision and mission triangle chart ppt background graphics. This is a three stage process. The stages in this process are mission, value, vision.
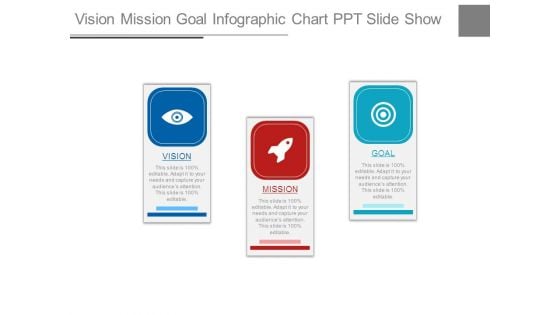
Vision Mission Goal Infographic Chart Ppt Slide Show
This is a vision mission goal infographic chart ppt slide show. This is a three stage process. The stages in this process are vision, mission, goal.
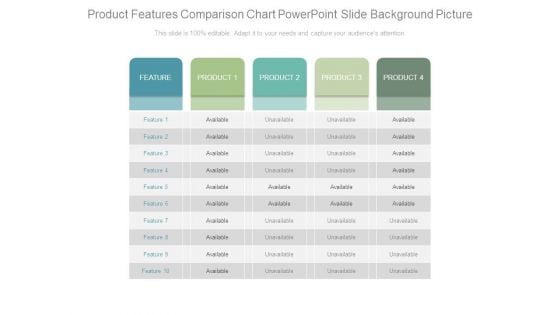
Product Features Comparison Chart Powerpoint Slide Background Picture
This is a product features comparison chart powerpoint slide background picture. This is a four stage process. The stages in this process are feature, product, available, unavailable.
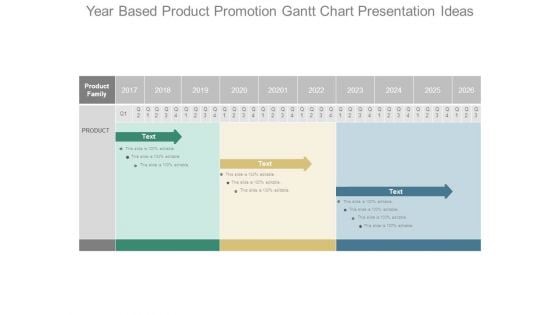
Year Based Product Promotion Gantt Chart Presentation Ideas
This is a year based product promotion gantt chart presentation ideas. This is a three stage process. The stages in this process are product family, product.
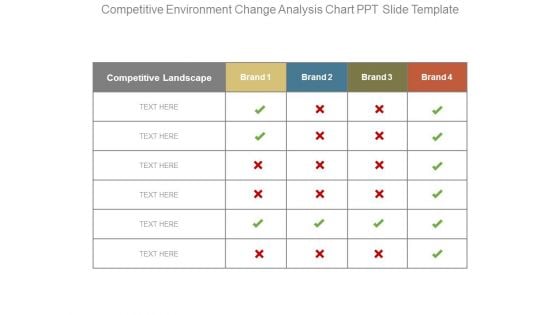
Competitive Environment Change Analysis Chart Ppt Slide Template
This is a competitive environment change analysis chart ppt slide template. This is a four stage process. The stages in this process are competitive landscape, brand.
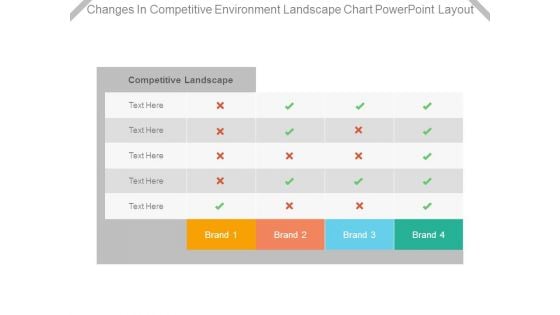
Changes In Competitive Environment Landscape Chart Powerpoint Layout
This is a changes in competitive environment landscape chart powerpoint layout. This is a four stage process. The stages in this process are competitive landscape, brand.
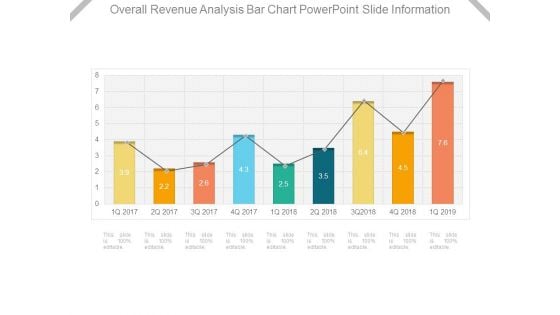
Overall Revenue Analysis Bar Chart Powerpoint Slide Information
This is a overall revenue analysis bar chart powerpoint slide information. This is a nine stage process. The stages in this process are finance, success, business, marketing, percentage.
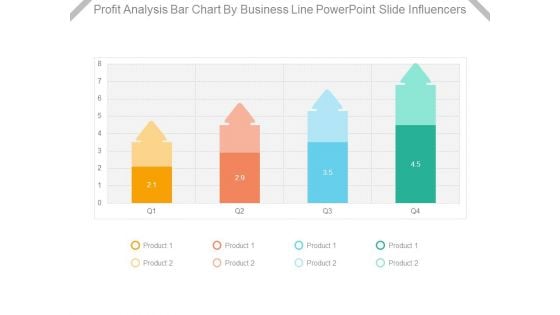
Profit Analysis Bar Chart By Business Line Powerpoint Slide Influencers
This is a profit analysis bar chart by business line powerpoint slide influencers. This is a four stage process. The stages in this process are product.
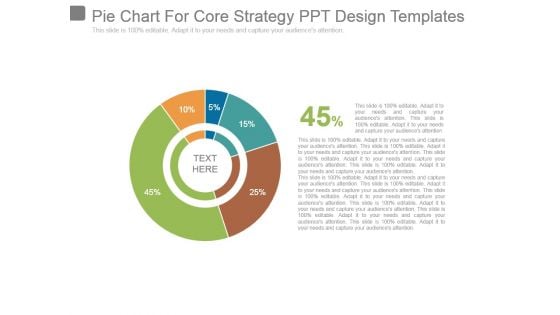
Pie Chart For Core Strategy Ppt Design Templates
This is a pie chart for core strategy ppt design templates. This is a five stage process. The stages in this process are business, marketing, strategy, finance, percentage.
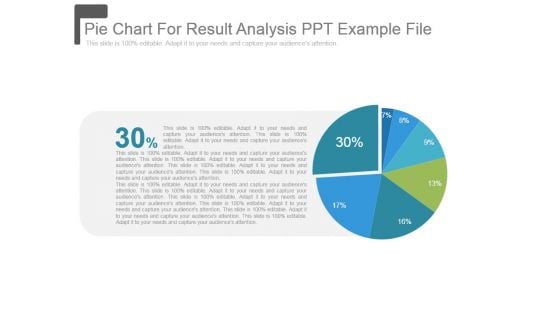
Pie Chart For Result Analysis Ppt Example File
This is a pie chart for result analysis ppt example file. This is a seven stage process. The stages in this process are pie, marketing, strategy, finance, percentage.
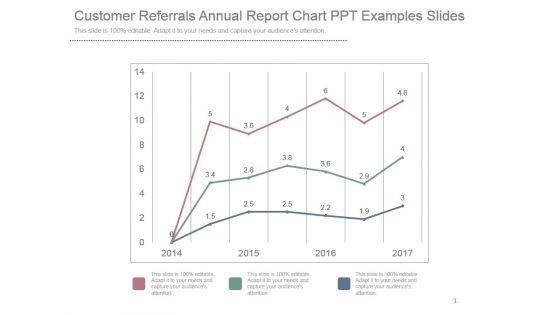
Customer Referrals Annual Report Chart Ppt Examples Slides
This is a customer referrals annual report chart ppt examples slides. This is a three stage process. The stages in this process are business, marketing, graph, success, years.
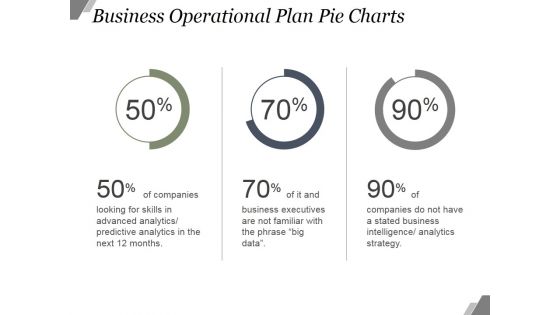
Business Operational Plan Pie Charts Ppt PowerPoint Presentation Templates
This is a business operational plan pie charts ppt powerpoint presentation templates. This is a three stage process. The stages in this process are finance, business, marketing, percentage.
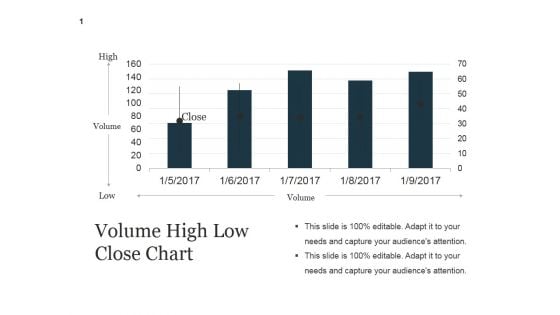
Volume High Low Close Chart Ppt PowerPoint Presentation Guide
This is a volume high low close chart ppt powerpoint presentation guide. This is a five stage process. The stages in this process are high, volume, close, low.
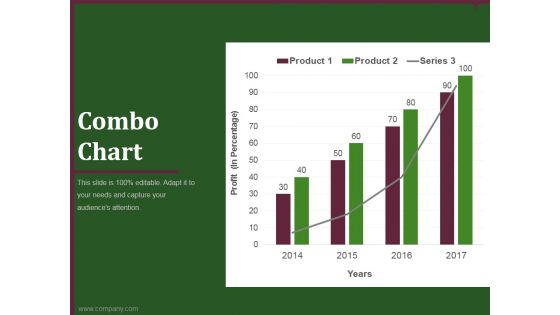
combo chart template 1 ppt powerpoint presentation show
This is a combo chart template 1 ppt powerpoint presentation show. This is a four stage process. The stages in this process are business, marketing, finance, analysis, growth.
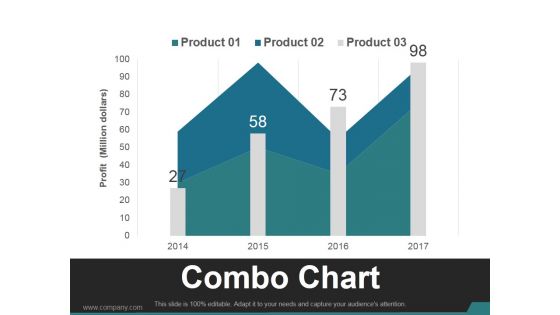
Combo Chart Template 2 Ppt PowerPoint Presentation Guidelines
This is a combo chart template 2 ppt powerpoint presentation guidelines. This is a four stage process. The stages in this process are business, marketing, growth, product, timeline.
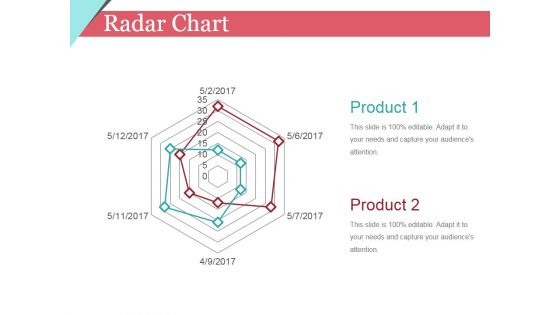
Radar Chart Ppt PowerPoint Presentation Infographic Template Design Templates
This is a radar chart ppt powerpoint presentation infographic template design templates. This is a seven stage process. The stages in this process are business, shapes, product, marketing.
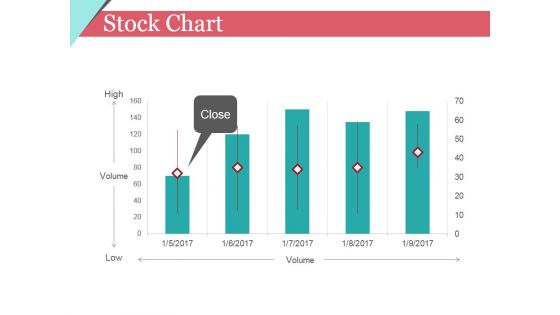
Stock Chart Ppt PowerPoint Presentation Infographic Template Clipart Images
This is a stock chart ppt powerpoint presentation infographic template clipart images. This is a five stage process. The stages in this process are high, volume, low, close.
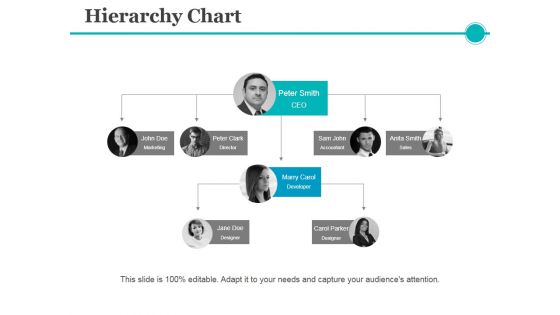
Hierarchy Chart Ppt PowerPoint Presentation Model Graphics Pictures
This is a hierarchy chart ppt powerpoint presentation model graphics pictures. This is a four stage process. The stages in this process are ceo, accountant, sales, developer, designer.

Scatter Chart Ppt PowerPoint Presentation Portfolio Design Inspiration
This is a scatter chart ppt powerpoint presentation portfolio design inspiration. This is a twelve stage process. The stages in this process are graph, growth, success, business.
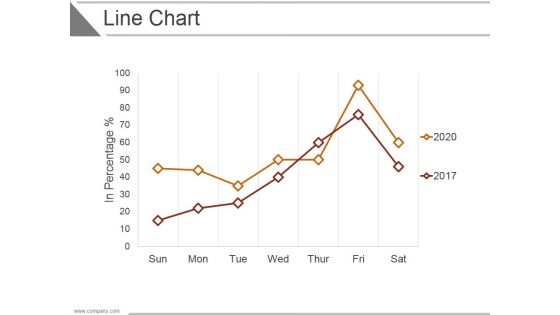
Line Chart Ppt PowerPoint Presentation Infographic Template Shapes
This is a line chart ppt powerpoint presentation infographic template shapes. This is a seven stage process. The stages in this process are business, strategy, analysis, marketing, growth.
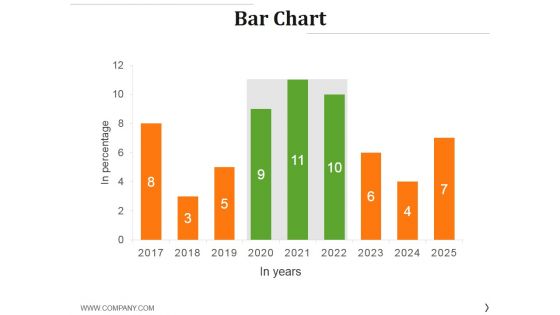
Bar Chart Ppt PowerPoint Presentation Styles Graphics Example
This is a bar chart ppt powerpoint presentation styles graphics example. This is a nine stage process. The stages in this process are graph, growth, success, business, finance.
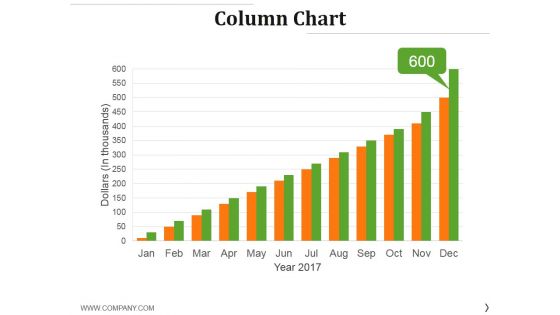
Column Chart Ppt PowerPoint Presentation Inspiration Example Topics
This is a column chart ppt powerpoint presentation inspiration example topics. This is a twelve stage process. The stages in this process are dollar, growth, business, marketing, success.
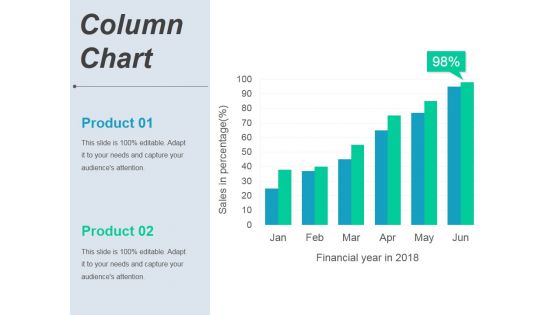
Column Chart Ppt PowerPoint Presentation Portfolio Graphics Template
This is a column chart ppt powerpoint presentation portfolio graphics template. This is a six stage process. The stages in this process are product, finance, growth, success, business.

Combo Chart Ppt PowerPoint Presentation Professional Graphics Example
This is a combo chart ppt powerpoint presentation professional graphics example. This is a eight stage process. The stages in this process are product, finance, growth, success, business.
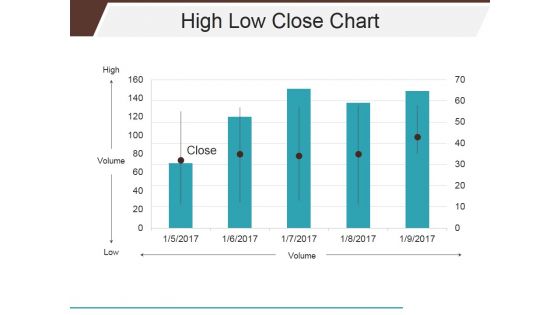
High Low Close Chart Ppt PowerPoint Presentation Infographics Shapes
This is a high low close chart ppt powerpoint presentation infographics shapes. This is a five stage process. The stages in this process are close, volume, high, low.
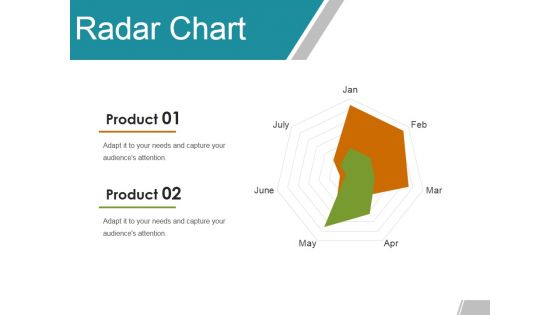
Radar Chart Ppt PowerPoint Presentation Gallery Example Topics
This is a radar chart ppt powerpoint presentation gallery example topics. This is a seven stage process. The stages in this process are product, business, marketing, shapes.
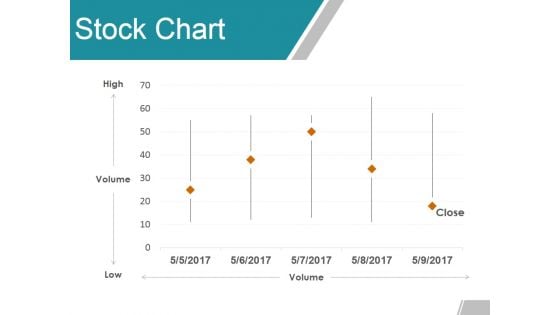
Stock Chart Ppt PowerPoint Presentation Summary Graphics Pictures
This is a stock chart ppt powerpoint presentation summary graphics pictures. This is a five stage process. The stages in this process are high, volume, low, close, finance.
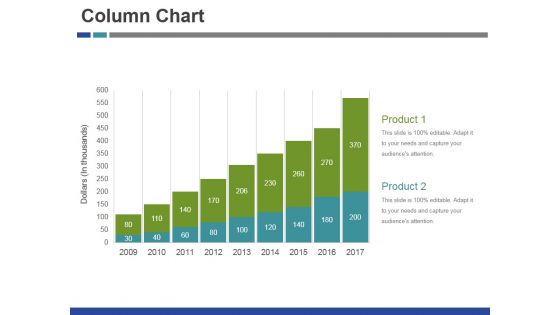
Column Chart Ppt PowerPoint Presentation Infographic Template Layouts
This is a column chart ppt powerpoint presentation infographic template layouts. This is a nine stage process. The stages in this process are product, growth, success, business, graph.
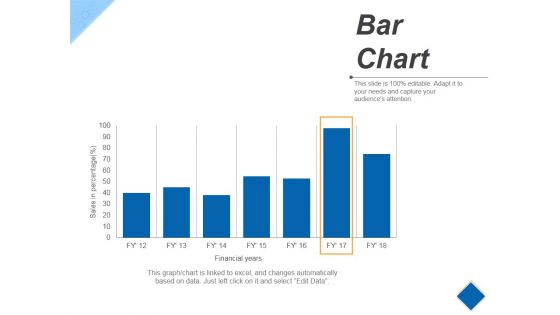
Bar Chart Ppt PowerPoint Presentation Infographic Template Example
This is a bar chart ppt powerpoint presentation infographic template example. This is a seven stage process. The stages in this process are business, finance, marketing, percentage.
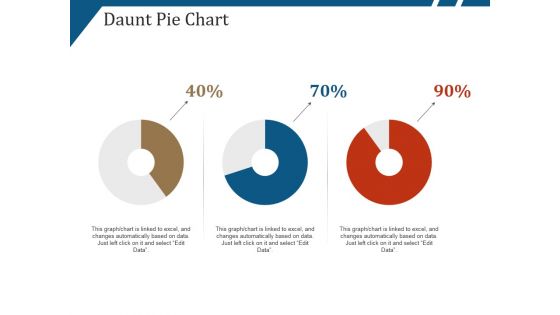
Daunt Pie Chart Ppt PowerPoint Presentation Layouts Portrait
This is a daunt pie chart ppt powerpoint presentation layouts portrait. This is a three stage process. The stages in this process are percentage, finance, donut, business.

Donut Pie Chart Ppt PowerPoint Presentation Professional Templates
This is a donut pie chart ppt powerpoint presentation professional templates. This is a three stage process. The stages in this process are finance, donut, business, marketing, strategy.
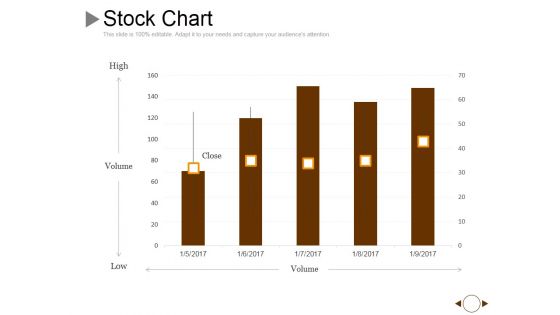
Stock Chart Ppt PowerPoint Presentation Gallery Graphics Example
This is a stock chart ppt powerpoint presentation gallery graphics example. This is a five stage process. The stages in this process are volume, high, low, close.

Radar Chart Ppt PowerPoint Presentation Infographic Template Graphics Template
This is a radar chart ppt powerpoint presentation infographic template graphics template. This is a six stage process. The stages in this process are product, business, marketing, shapes.
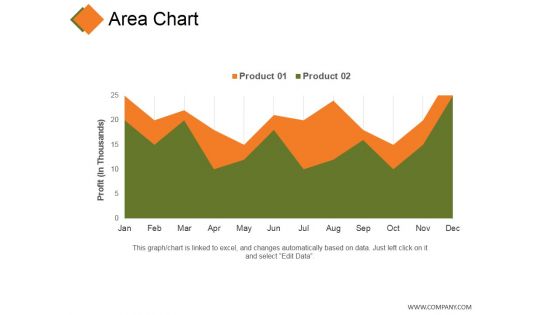
Area Chart Ppt PowerPoint Presentation Gallery Clipart Images
This is a area chart ppt powerpoint presentation gallery clipart images. This is a two stage process. The stages in this process are product, profit, business, finance, marketing.


 Continue with Email

 Home
Home


