Coordination
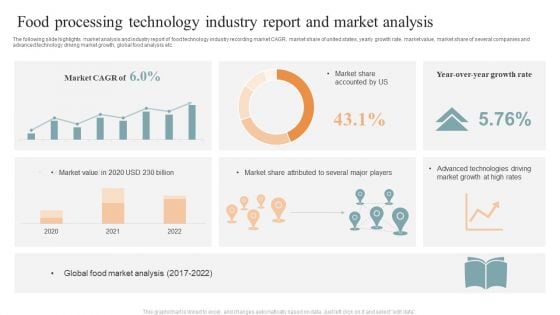
Food Processing Technology Industry Report And Market Analysis Brochure PDF
The following slide highlights market analysis and industry report of food technology industry recording market CAGR, market share of united states, yearly growth rate, market value, market share of several companies and advanced technology driving market growth, global food analysis etc. Pitch your topic with ease and precision using this Food Processing Technology Industry Report And Market Analysis Brochure PDF. This layout presents information on Market CAGR, Market Share Accounted, Global Food, Market Analysis. It is also available for immediate download and adjustment. So, changes can be made in the color, design, graphics or any other component to create a unique layout.
Market Penetration Dashboard With Population Metrics Ppt Icon Graphics Design PDF
This slide shows market penetration dashboard with key demographics. It provides information about census population, per capita income, leads to be penetrated and footfall. Showcasing this set of slides titled Market Penetration Dashboard With Population Metrics Ppt Icon Graphics Design PDF. The topics addressed in these templates are Census Population, Per Capita Income, Footfall. All the content presented in this PPT design is completely editable. Download it and make adjustments in color, background, font etc. as per your unique business setting.
Market Penetration Dashboard With Sales Metrics Ppt Icon Examples PDF
This slide shows market penetration dashboard for sales team. It provides information about regions, emerging markets, planned sales, actual sales, revenue, gender wise sales, etc. Pitch your topic with ease and precision using this Market Penetration Dashboard With Sales Metrics Ppt Icon Examples PDF. This layout presents information on Emerging Markets, Sales Gender, Actual Sales. It is also available for immediate download and adjustment. So, changes can be made in the color, design, graphics or any other component to create a unique layout.
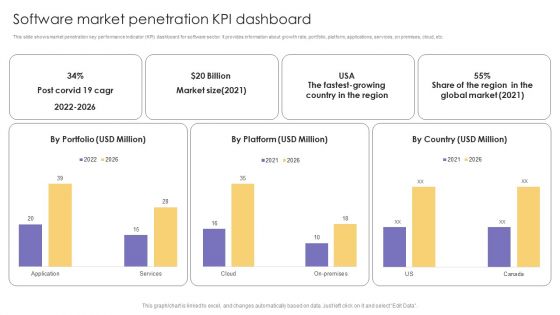
Software Market Penetration KPI Dashboard Ppt Outline Aids PDF
This slide shows market penetration key performance indicator KPI dashboard for software sector. It provides information about growth rate, portfolio, platform, applications, services, on premises, cloud, etc. Pitch your topic with ease and precision using this Software Market Penetration KPI Dashboard Ppt Outline Aids PDF. This layout presents information on Market Size, Global Market, Cloud. It is also available for immediate download and adjustment. So, changes can be made in the color, design, graphics or any other component to create a unique layout.
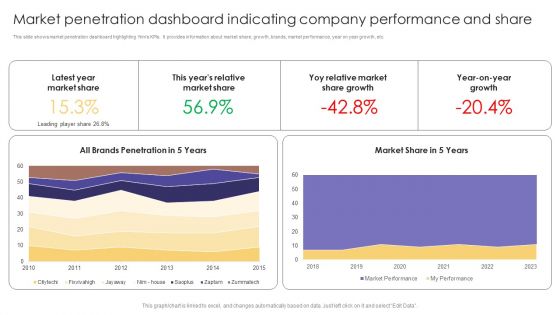
Market Penetration Dashboard Indicating Company Performance And Share Formats PDF
This slide shows market penetration dashboard highlighting firms KPIs. It provides information about market share, growth, brands, market performance, year on year growth, etc. Showcasing this set of slides titled Market Penetration Dashboard Indicating Company Performance And Share Formats PDF. The topics addressed in these templates are Latest Year, Market Share, Market Share Growth. All the content presented in this PPT design is completely editable. Download it and make adjustments in color, background, font etc. as per your unique business setting.
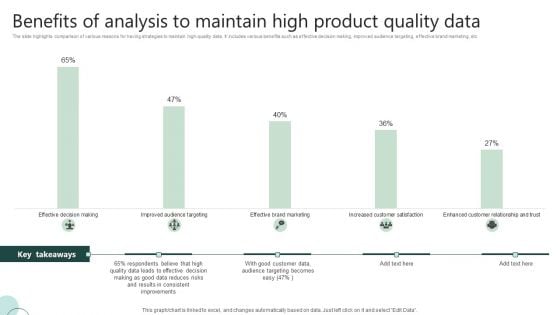
Benefits Of Analysis To Maintain High Product Quality Data Ppt Portfolio Gallery PDF
The slide highlights comparison of various reasons for having strategies to maintain high-quality data. It includes various benefits such as effective decision making, improved audience targeting, effective brand marketing, etc. Showcasing this set of slides titled Benefits Of Analysis To Maintain High Product Quality Data Ppt Portfolio Gallery PDF. The topics addressed in these templates are Effective Decision, Quality Data Leads, Good Customer Data. All the content presented in this PPT design is completely editable. Download it and make adjustments in color, background, font etc. as per your unique business setting.
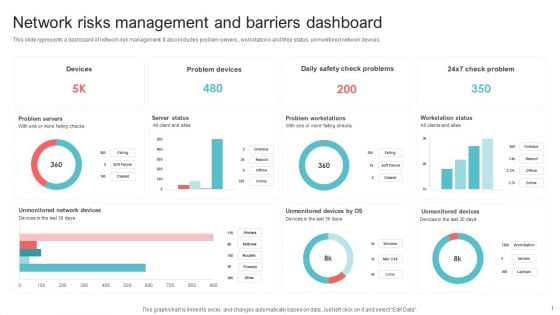
Network Risks Management And Barriers Dashboard Ppt PowerPoint Presentation Gallery Graphic Tips PDF
This slide represents a dashboard of network risk management. It also includes problem servers , workstations and their status, unmonitored network devices. Pitch your topic with ease and precision using this Network Risks Management And Barriers Dashboard Ppt PowerPoint Presentation Gallery Graphic Tips PDF. This layout presents information on Problem Servers, Server Status, Problem Workstations, Workstation Status. It is also available for immediate download and adjustment. So, changes can be made in the color, design, graphics or any other component to create a unique layout.
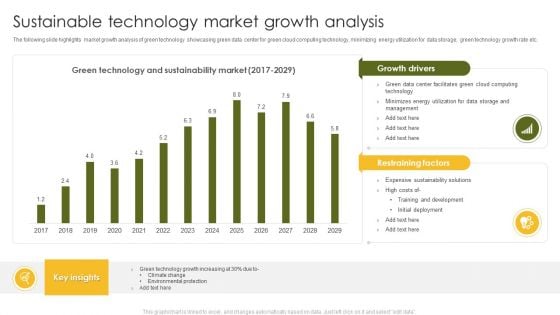
Sustainable Technology Market Growth Analysis Ppt Outline Slide Download PDF
The following slide highlights market growth analysis of green technology showcasing green data center for green cloud computing technology, minimizing energy utilization for data storage, green technology growth rate etc. Showcasing this set of slides titled Sustainable Technology Market Growth Analysis Ppt Outline Slide Download PDF. The topics addressed in these templates are Climate Change, Environmental Protection, Green Technology. All the content presented in this PPT design is completely editable. Download it and make adjustments in color, background, font etc. as per your unique business setting.
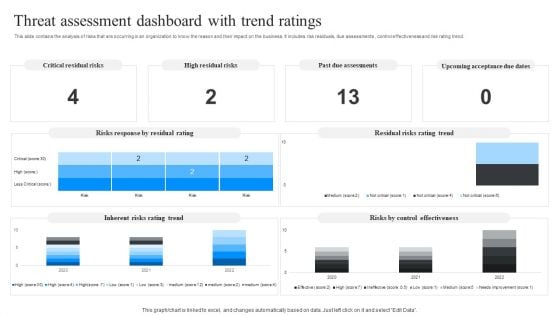
Threat Assessment Dashboard With Trend Ratings Ppt Model Vector PDF
This slide contains the analysis of risks that are occurring in an organization to know the reason and their impact on the business. It includes risk residuals, due assessments , control effectiveness and risk rating trend. Showcasing this set of slides titled Threat Assessment Dashboard With Trend Ratings Ppt Model Vector PDF. The topics addressed in these templates are Critical Residual Risks, High Residual Risks, Past Due Assessments. All the content presented in this PPT design is completely editable. Download it and make adjustments in color, background, font etc. as per your unique business setting.
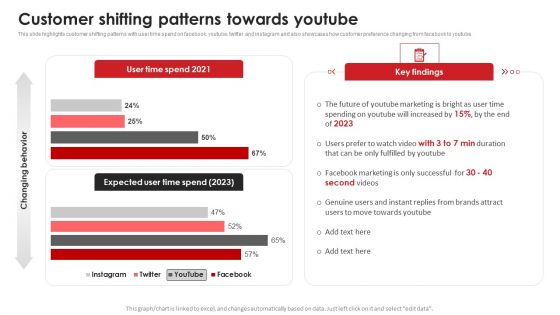
Customer Shifting Patterns Towards Youtube Video Content Advertising Strategies For Youtube Portrait PDF
This slide highlights customer shifting patterns with user time spend on facebook, youtube, twitter and instagram and also showcases how customer preference changing from facebook to youtube.Get a simple yet stunning designed Customer Shifting Patterns Towards Youtube Video Content Advertising Strategies For Youtube Portrait PDF. It is the best one to establish the tone in your meetings. It is an excellent way to make your presentations highly effective. So, download this PPT today from Slidegeeks and see the positive impacts. Our easy-to-edit Customer Shifting Patterns Towards Youtube Video Content Advertising Strategies For Youtube Portrait PDF can be your go-to option for all upcoming conferences and meetings. So, what are you waiting for Grab this template today.
Youtube Marketing Dashboard Highlighting Traffic Source And Average Views Icons PDF
This slide showcases the youtube marketing dashboard which includes subscriber gained vs loss list which includes traffic sources and lasted uploaded videos data.Create an editable Youtube Marketing Dashboard Highlighting Traffic Source And Average Views Icons PDF that communicates your idea and engages your audience. Whether you are presenting a business or an educational presentation, pre-designed presentation templates help save time. Youtube Marketing Dashboard Highlighting Traffic Source And Average Views Icons PDF is highly customizable and very easy to edit, covering many different styles from creative to business presentations. Slidegeeks has creative team members who have crafted amazing templates. So, go and get them without any delay.
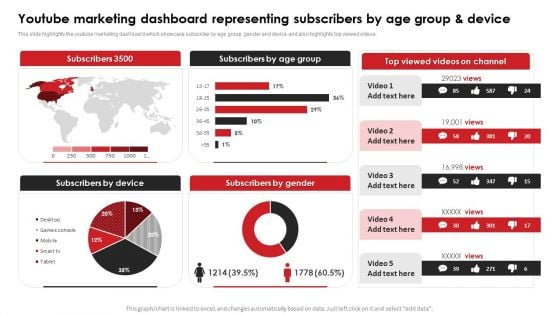
Youtube Marketing Dashboard Representing Subscribers By Age Group And Device Background PDF
This slide highlights the youtube marketing dashboard which showcase subscriber by age group, gender and device and also highlights top viewed videos.Slidegeeks is one of the best resources for PowerPoint templates. You can download easily and regulate Youtube Marketing Dashboard Representing Subscribers By Age Group And Device Background PDF for your personal presentations from our wonderful collection. A few clicks is all it takes to discover and get the most relevant and appropriate templates. Use our Templates to add a unique zing and appeal to your presentation and meetings. All the slides are easy to edit and you can use them even for advertisement purposes.
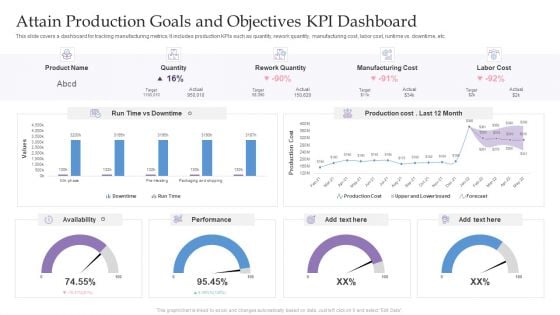
Attain Production Goals And Objectives KPI Dashboard Ppt Pictures Graphics PDF
This slide covers a dashboard for tracking manufacturing metrics. It includes production KPIs such as quantity, rework quantity, manufacturing cost, labor cost, runtime vs. downtime, etc. Showcasing this set of slides titled Attain Production Goals And Objectives KPI Dashboard Ppt Pictures Graphics PDF. The topics addressed in these templates are Product Name, Quantity, Rework Quantity, Manufacturing Cost. All the content presented in this PPT design is completely editable. Download it and make adjustments in color, background, font etc. as per your unique business setting.
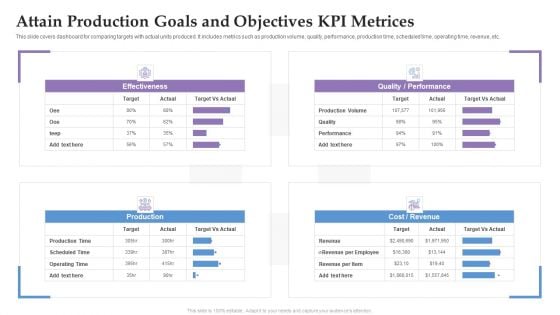
Attain Production Goals And Objectives KPI Metrices Ppt Summary Format Ideas PDF
This slide covers dashboard for comparing targets with actual units produced. It includes metrics such as production volume, quality, performance, production time, scheduled time, operating time, revenue, etc. Pitch your topic with ease and precision using this Attain Production Goals And Objectives KPI Metrices Ppt Summary Format Ideas PDF. This layout presents information on Production, Cost, Revenue, Performance. It is also available for immediate download and adjustment. So, changes can be made in the color, design, graphics or any other component to create a unique layout.
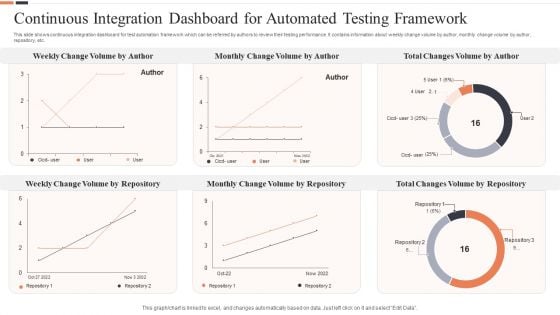
Continuous Integration Dashboard For Automated Testing Framework Ppt Layouts Layout Ideas PDF
This slide shows continuous integration dashboard for test automation framework which can be referred by authors to review their testing performance. It contains information about weekly change volume by author, monthly change volume by author, repository, etc. Pitch your topic with ease and precision using this Continuous Integration Dashboard For Automated Testing Framework Ppt Layouts Layout Ideas PDF. This layout presents information on Total Changes Volume, Monthly Change Volume, Weekly Change Volume. It is also available for immediate download and adjustment. So, changes can be made in the color, design, graphics or any other component to create a unique layout.
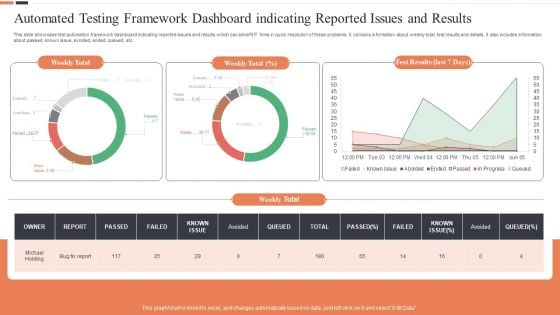
Automated Testing Framework Dashboard Indicating Reported Issues And Results Ideas PDF
This slide showcase test automation framework dashboard indicating reported issues and results which can benefit IT firms in quick resolution of these problems. It contains information about weekly total, test results and details. It also includes information about passed, known issue, avoided, ended, queued, etc. Showcasing this set of slides titled Automated Testing Framework Dashboard Indicating Reported Issues And Results Ideas PDF. The topics addressed in these templates are Weekly Total, Test Results, Last 7 Days. All the content presented in this PPT design is completely editable. Download it and make adjustments in color, background, font etc. as per your unique business setting.
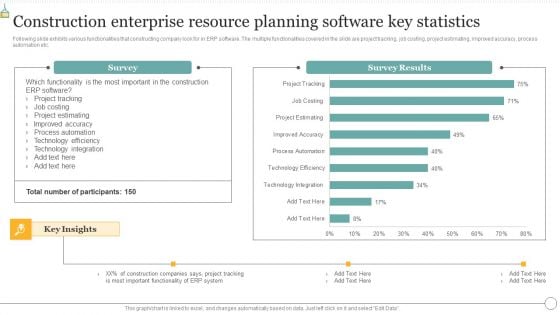
Construction Enterprise Resource Planning Software Key Statistics Sample PDF
Following slide exhibits various functionalities that constructing company look for in ERP software. The multiple functionalities covered in the slide are project tracking, job costing, project estimating, improved accuracy, process automation etc. Showcasing this set of slides titled Construction Enterprise Resource Planning Software Key Statistics Sample PDF. The topics addressed in these templates are Project Estimating, Project Tracking, Process Automation. All the content presented in this PPT design is completely editable. Download it and make adjustments in color, background, font etc. as per your unique business setting.
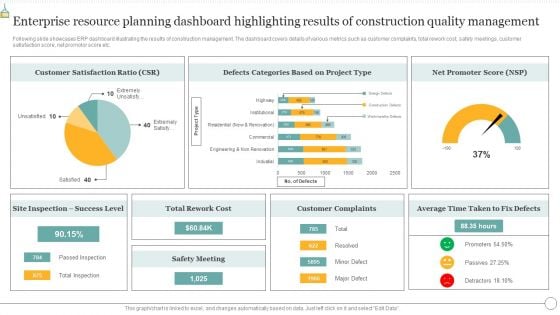
Enterprise Resource Planning Dashboard Highlighting Results Of Construction Quality Management Summary PDF
Following slide exhibits various functionalities that constructing company look for in ERP software. The multiple functionalities covered in the slide are project tracking, job costing, project estimating, improved accuracy, process automation etc. Pitch your topic with ease and precision using this Enterprise Resource Planning Dashboard Highlighting Results Of Construction Quality Management Summary PDF. This layout presents information on Technology Efficiency, Process Automation, Improved Accuracy. It is also available for immediate download and adjustment. So, changes can be made in the color, design, graphics or any other component to create a unique layout.
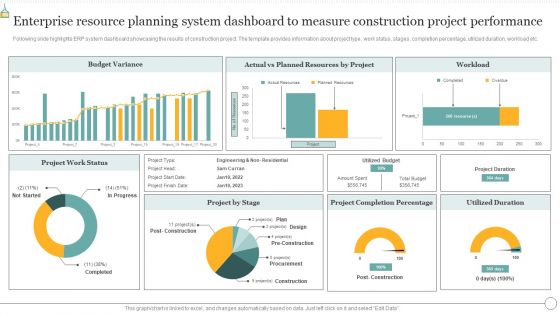
Enterprise Resource Planning System Dashboard To Measure Construction Project Performance Download PDF
Following slide highlights ERP system dashboard showcasing the results of construction project. The template provides information about project type, work status, stages, completion percentage, utilized duration, workload etc. Showcasing this set of slides titled Enterprise Resource Planning System Dashboard To Measure Construction Project Performance Download PDF. The topics addressed in these templates are Project By Stage, Project Completion, Planned Resources. All the content presented in this PPT design is completely editable. Download it and make adjustments in color, background, font etc. as per your unique business setting.
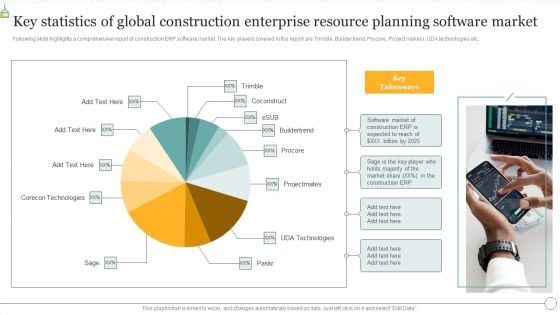
Key Statistics Of Global Construction Enterprise Resource Planning Software Market Sample PDF
Following slide highlights a comprehensive report of construction ERP software market. The key players covered in the report are Trimble, Builder trend, Procore, Project makers, UDA technologies etc. Pitch your topic with ease and precision using this Key Statistics Of Global Construction Enterprise Resource Planning Software Market Sample PDF. This layout presents information on Key Statistics, Global Construction Enterprise, Resource Planning Software Market. It is also available for immediate download and adjustment. So, changes can be made in the color, design, graphics or any other component to create a unique layout.
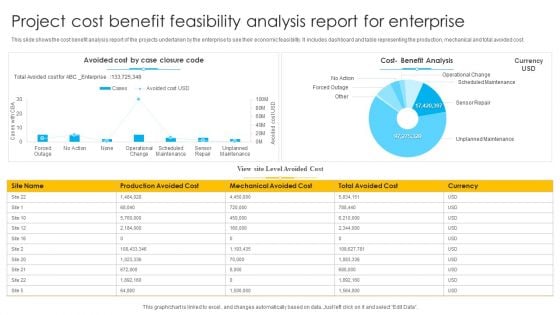
Project Cost Benefit Feasibility Analysis Report For Enterprise Ppt Layouts Background Image PDF
This slide shows the cost benefit analysis report of the projects undertaken by the enterprise to see their economic feasibility. It includes dashboard and table representing the production, mechanical and total avoided cost. Showcasing this set of slides titled Project Cost Benefit Feasibility Analysis Report For Enterprise Ppt Layouts Background Image PDF. The topics addressed in these templates are Avoided Cost, Case Closure Code, Cost Benefit Analysis, Total Avoided Cost. All the content presented in this PPT design is completely editable. Download it and make adjustments in color, background, font etc. as per your unique business setting.
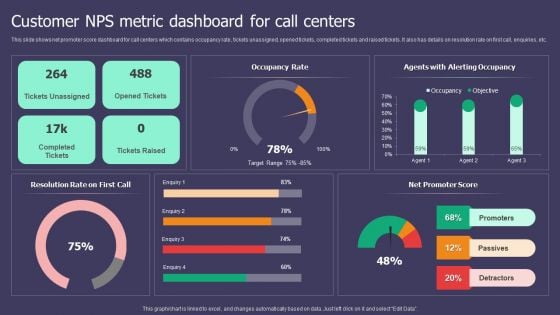
Customer NPS Metric Dashboard For Call Centers Ppt Inspiration Smartart PDF
This slide shows net promoter score dashboard for call centers which contains occupancy rate, tickets unassigned, opened tickets, completed tickets and raised tickets. It also has details on resolution rate on first call, enquiries, etc. Pitch your topic with ease and precision using this Customer NPS Metric Dashboard For Call Centers Ppt Inspiration Smartart PDF. This layout presents information on Occupancy Rate, Resolution Rate, Net Promoter Score. It is also available for immediate download and adjustment. So, changes can be made in the color, design, graphics or any other component to create a unique layout.
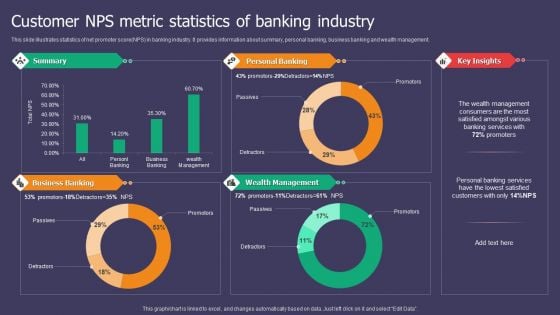
Customer NPS Metric Statistics Of Banking Industry Ppt Styles Microsoft PDF
This slide illustrates statistics of net promoter score NPS in banking industry. It provides information about summary, personal banking, business banking and wealth management. Pitch your topic with ease and precision using this Customer NPS Metric Statistics Of Banking Industry Ppt Styles Microsoft PDF. This layout presents information on Summary, Personal Banking, Business Banking, Wealth Management. It is also available for immediate download and adjustment. So, changes can be made in the color, design, graphics or any other component to create a unique layout.
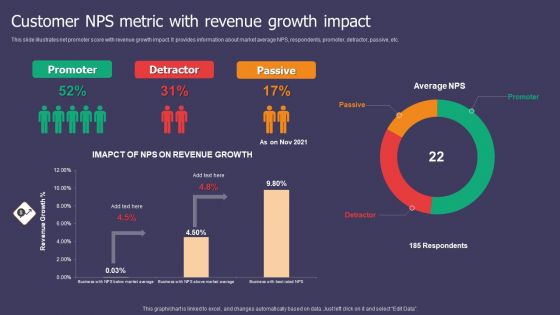
Customer NPS Metric With Revenue Growth Impact Ppt Show Portrait PDF
This slide illustrates net promoter score with revenue growth impact. It provides information about market average NPS, respondents, promoter, detractor, passive, etc. Pitch your topic with ease and precision using this Customer NPS Metric With Revenue Growth Impact Ppt Show Portrait PDF. This layout presents information on Promoter, Detractor, Passive. It is also available for immediate download and adjustment. So, changes can be made in the color, design, graphics or any other component to create a unique layout.
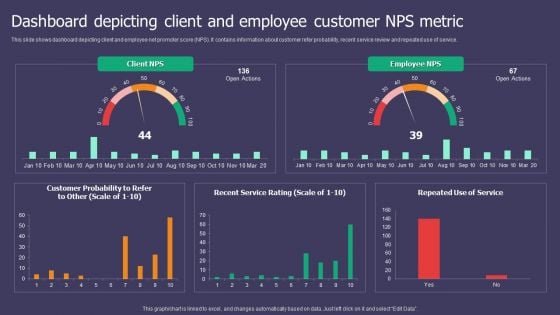
Dashboard Depicting Client And Employee Customer NPS Metric Ppt Gallery Deck PDF
This slide shows dashboard depicting client and employee net promoter score NPS. It contains information about customer refer probability, recent service review and repeated use of service. Showcasing this set of slides titled Dashboard Depicting Client And Employee Customer NPS Metric Ppt Gallery Deck PDF. The topics addressed in these templates are Client NPS, Employee NPS, Customer Probability. All the content presented in this PPT design is completely editable. Download it and make adjustments in color, background, font etc. as per your unique business setting.
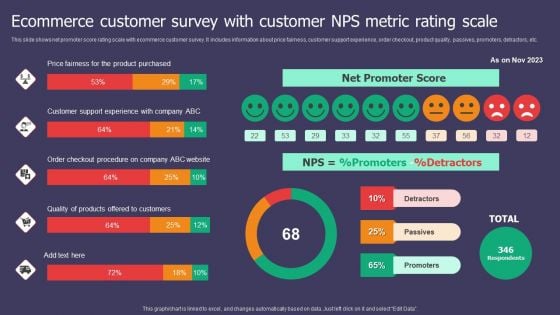
Ecommerce Customer Survey With Customer NPS Metric Rating Scale Ppt Inspiration Visual Aids PDF
This slide shows net promoter score rating scale with ecommerce customer survey. It includes information about price fairness, customer support experience, order checkout, product quality, passives, promoters, detractors, etc. Pitch your topic with ease and precision using this Ecommerce Customer Survey With Customer NPS Metric Rating Scale Ppt Inspiration Visual Aids PDF. This layout presents information on Net Promoter Score, Price Fairness, Product Purchased. It is also available for immediate download and adjustment. So, changes can be made in the color, design, graphics or any other component to create a unique layout.
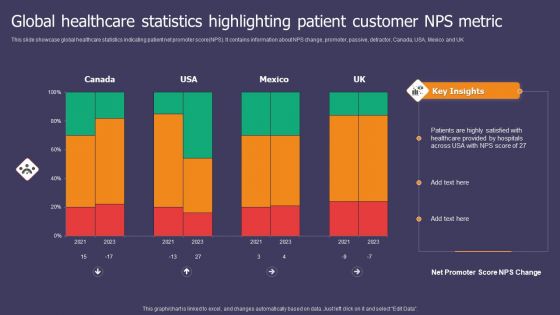
Global Healthcare Statistics Highlighting Patient Customer NPS Metric Ppt Summary Graphics Pictures PDF
This slide showcase global healthcare statistics indicating patient net promoter score NPS. It contains information about NPS change, promoter, passive, detractor, Canada, USA, Mexico and UK. Showcasing this set of slides titled Global Healthcare Statistics Highlighting Patient Customer NPS Metric Ppt Summary Graphics Pictures PDF. The topics addressed in these templates are Healthcare Provided, Hospitals Across, NPS Score. All the content presented in this PPT design is completely editable. Download it and make adjustments in color, background, font etc. as per your unique business setting.
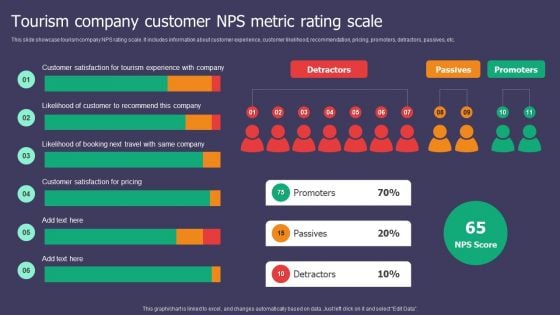
Tourism Company Customer NPS Metric Rating Scale Ppt Outline Format Ideas PDF
This slide showcase tourism company NPS rating scale. It includes information about customer experience, customer likelihood, recommendation, pricing, promoters, detractors, passives, etc. Showcasing this set of slides titled Tourism Company Customer NPS Metric Rating Scale Ppt Outline Format Ideas PDF. The topics addressed in these templates are Promoters, Passives, Detractors. All the content presented in this PPT design is completely editable. Download it and make adjustments in color, background, font etc. as per your unique business setting.
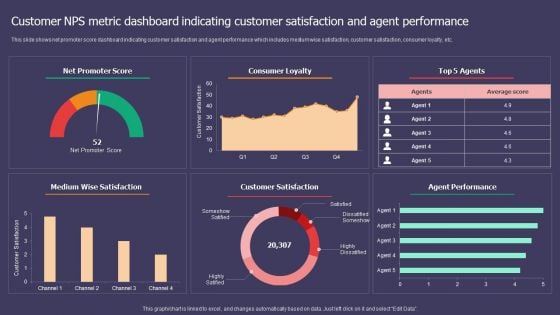
Customer NPS Metric Dashboard Indicating Customer Satisfaction And Agent Performance Template PDF
This slide shows net promoter score dashboard indicating customer satisfaction and agent performance which includes medium wise satisfaction, customer satisfaction, consumer loyalty, etc. Showcasing this set of slides titled Customer NPS Metric Dashboard Indicating Customer Satisfaction And Agent Performance Template PDF. The topics addressed in these templates are Net Promoter Score, Consumer Loyalty, Top 5 Agents. All the content presented in this PPT design is completely editable. Download it and make adjustments in color, background, font etc. as per your unique business setting.
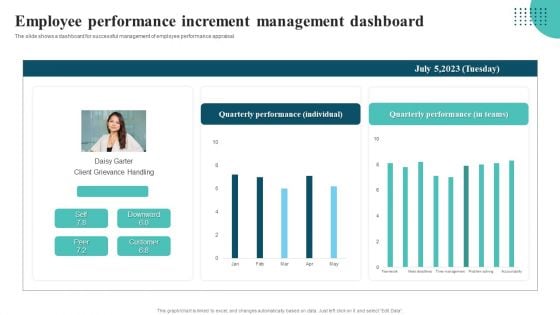
Employee Performance Increment Management Dashboard Summary PDF
The slide shows a dashboard for successful management of employee performance appraisal. Showcasing this set of slides titled Employee Performance Increment Management Dashboard Summary PDF. The topics addressed in these templates are Employee Performance Increment, Management Dashboard. All the content presented in this PPT design is completely editable. Download it and make adjustments in color, background, font etc. as per your unique business setting.
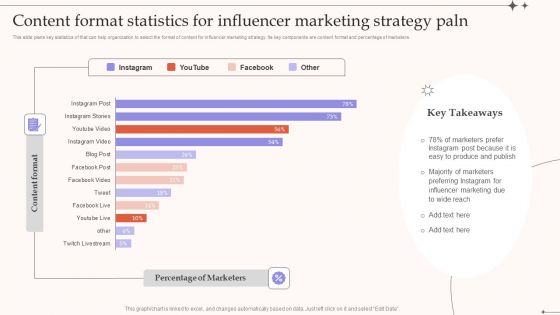
Content Format Statistics For Influencer Marketing Strategy Paln Mockup PDF
This slide plans key statistics of that can help organization to select the format of content for influencer marketing strategy. Its key components are content format and percentage of marketers.Showcasing this set of slides titled Content Format Statistics For Influencer Marketing Strategy Paln Mockup PDF. The topics addressed in these templates are Marketers Prefer, Instagram Post, Easy Produce. All the content presented in this PPT design is completely editable. Download it and make adjustments in color, background, font etc. as per your unique business setting.

SEO Marketing Dashboard Key Tactics To Drive Better Sales High Performance Themes PDF
This slide covers SEO marketing KPI dashboard to drive better sales performance. It involves data such as sessions from organic, organic sessions by source, organic conversion, pages per sessions from organic. Showcasing this set of slides titled SEO Marketing Dashboard Key Tactics To Drive Better Sales High Performance Themes PDF. The topics addressed in these templates are Sessions From Organic, Organic Revenue, Organic Conversion Rate. All the content presented in this PPT design is completely editable. Download it and make adjustments in color, background, font etc. as per your unique business setting.
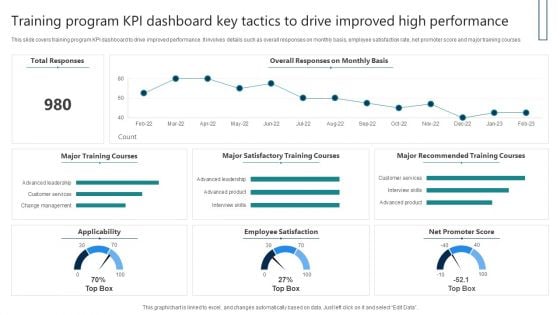
Training Program KPI Dashboard Key Tactics To Drive Improved High Performance Download PDF
This slide covers training program KPI dashboard to drive improved performance. It involves details such as overall responses on monthly basis, employee satisfaction rate, net promoter score and major training courses. Showcasing this set of slides titled Training Program KPI Dashboard Key Tactics To Drive Improved High Performance Download PDF. The topics addressed in these templates are Total Responses, Major Training Courses, Employee Satisfaction. All the content presented in this PPT design is completely editable. Download it and make adjustments in color, background, font etc. as per your unique business setting.
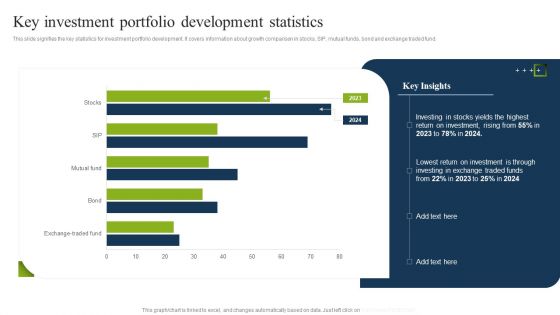
Key Investment Portfolio Development Statistics Ppt PowerPoint Presentation File Elements PDF
This slide signifies the key statistics for investment portfolio development. It covers information about growth comparison in stocks, SIP, mutual funds, bond and exchange traded fund. Showcasing this set of slides titled Key Investment Portfolio Development Statistics Ppt PowerPoint Presentation File Elements PDF. The topics addressed in these templates are Stocks Yields, Return On Investment, Lowest Return. All the content presented in this PPT design is completely editable. Download it and make adjustments in color, background, font etc. as per your unique business setting.
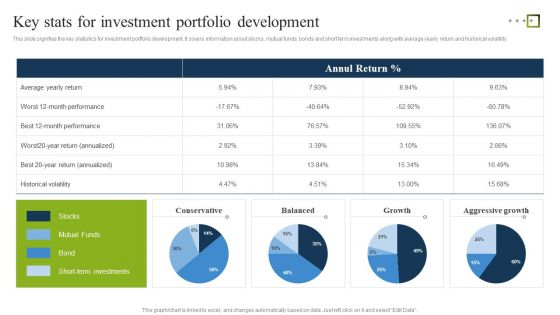
Key Stats For Investment Portfolio Development Ppt PowerPoint Presentation Gallery Good PDF
This slide signifies the key statistics for investment portfolio development. It covers information about stocks, mutual funds, bonds and short term investments along with average yearly return and historical volatility. Showcasing this set of slides titled Key Stats For Investment Portfolio Development Ppt PowerPoint Presentation Gallery Good PDF. The topics addressed in these templates are Average Yearly Return, Historical Volatility, Conservative. All the content presented in this PPT design is completely editable. Download it and make adjustments in color, background, font etc. as per your unique business setting.
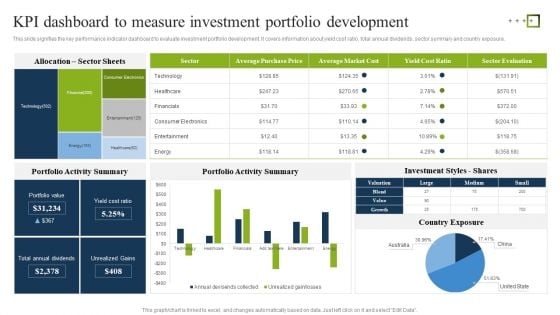
KPI Dashboard To Measure Investment Portfolio Development Ppt Inspiration Gallery PDF
This slide signifies the key performance indicator dashboard to evaluate investment portfolio development. It covers information about yield cost ratio, total annual dividends, sector summary and country exposure. Showcasing this set of slides titled KPI Dashboard To Measure Investment Portfolio Development Ppt Inspiration Gallery PDF. The topics addressed in these templates are Portfolio Activity Summary, Investment Styles Shares, Country Exposure. All the content presented in this PPT design is completely editable. Download it and make adjustments in color, background, font etc. as per your unique business setting.
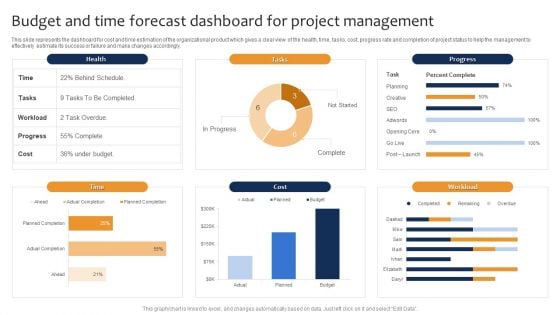
Budget And Time Forecast Dashboard For Project Management Ppt Pictures Format Ideas PDF
This slide represents the dashboard for cost and time estimation of the organizational product which gives a clear view of the health, time, tasks, cost, progress rate and completion of project status to help the management to effectively estimate its success or failure and make changes accordingly. Pitch your topic with ease and precision using this Budget And Time Forecast Dashboard For Project Management Ppt Pictures Format Ideas PDF. This layout presents information on Health, Progress, Cost, Workload. It is also available for immediate download and adjustment. So, changes can be made in the color, design, graphics or any other component to create a unique layout.
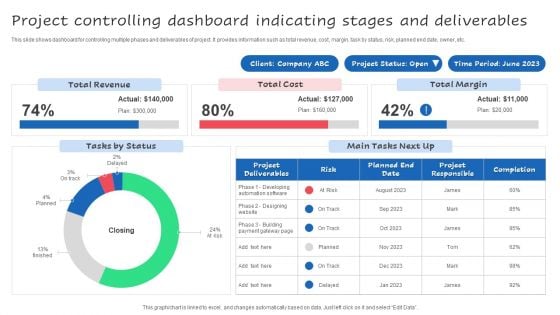
Project Controlling Dashboard Indicating Stages And Deliverables Ppt Styles Guide PDF
This slide shows dashboard for controlling multiple phases and deliverables of project. It provides information such as total revenue, cost, margin, task by status, risk, planned end date, owner, etc. Pitch your topic with ease and precision using this Project Controlling Dashboard Indicating Stages And Deliverables Ppt Styles Guide PDF. This layout presents information on Total Revenue, Total Margin, Total Cost. It is also available for immediate download and adjustment. So, changes can be made in the color, design, graphics or any other component to create a unique layout.
Project Status Dashboard With Stages And Deliverables Ppt Icon Design Inspiration PDF
This slide shows dashboard with project status based on stages and tasks. It provides information such as project cost performance, actual cost, budget, timeline, resource capacity, etc. Showcasing this set of slides titled Project Status Dashboard With Stages And Deliverables Ppt Icon Design Inspiration PDF. The topics addressed in these templates are Project Cost Performance, Actual Cost, Total Budget. All the content presented in this PPT design is completely editable. Download it and make adjustments in color, background, font etc. as per your unique business setting.
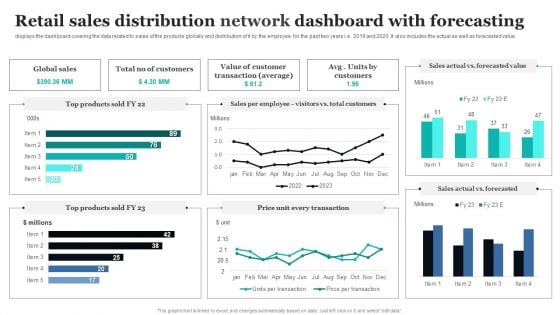
Retail Sales Distribution Network Dashboard With Forecasting Ppt PowerPoint Presentation File Design Templates PDF
Pitch your topic with ease and precision using this Retail Sales Distribution Network Dashboard With Forecasting Ppt PowerPoint Presentation File Design Templates PDF. This layout presents information on Global Sales, Value Customer, Total Customers. It is also available for immediate download and adjustment. So, changes can be made in the color, design, graphics or any other component to create a unique layout.
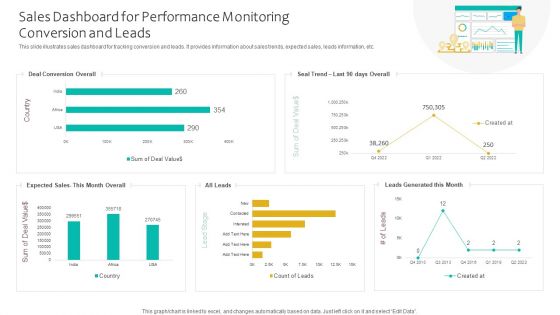
Sales Dashboard For Performance Monitoring Conversion And Leads Ppt Infographics Smartart PDF
This slide illustrates sales dashboard for tracking conversion and leads. It provides information about sales trends, expected sales, leads information, etc. Showcasing this set of slides titled Sales Dashboard For Performance Monitoring Conversion And Leads Ppt Infographics Smartart PDF. The topics addressed in these templates are Deal Conversion Overall, Expected Sales, Leads Generated. All the content presented in this PPT design is completely editable. Download it and make adjustments in color, background, font etc. as per your unique business setting.
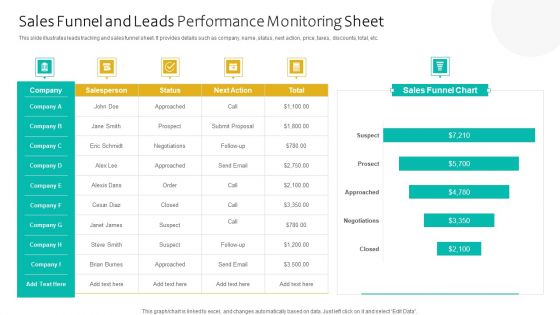
Sales Funnel And Leads Performance Monitoring Sheet Ppt Professional Tips PDF
This slide illustrates leads tracking and sales funnel sheet. It provides details such as company, name, status, next action, price, taxes, discounts, total, etc. Showcasing this set of slides titled Sales Funnel And Leads Performance Monitoring Sheet Ppt Professional Tips PDF. The topics addressed in these templates are Sales Funnel Chart, Salesperson, Next Action. All the content presented in this PPT design is completely editable. Download it and make adjustments in color, background, font etc. as per your unique business setting.
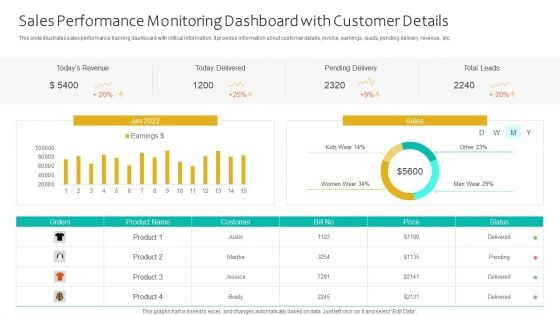
Sales Performance Monitoring Dashboard With Customer Details Ppt Infographics Themes PDF
This slide illustrates sales performance tracking dashboard with critical information. It provides information about customer details, invoice, earnings, leads, pending delivery, revenue, etc. Pitch your topic with ease and precision using this Sales Performance Monitoring Dashboard With Customer Details Ppt Infographics Themes PDF. This layout presents information on Todays Revenue, Today Delivered, Pending Delivery, Total Leads. It is also available for immediate download and adjustment. So, changes can be made in the color, design, graphics or any other component to create a unique layout.
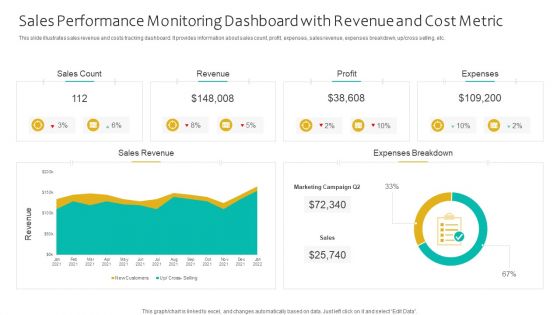
Sales Performance Monitoring Dashboard With Revenue And Cost Metric Ppt Portfolio Good PDF
This slide illustrates sales revenue and costs tracking dashboard. It provides information about sales count, profit, expenses, sales revenue, expenses breakdown, up or cross selling, etc. Showcasing this set of slides titled Sales Performance Monitoring Dashboard With Revenue And Cost Metric Ppt Portfolio Good PDF. The topics addressed in these templates are Sales Count, Revenue, Profit, Expenses. All the content presented in this PPT design is completely editable. Download it and make adjustments in color, background, font etc. as per your unique business setting.
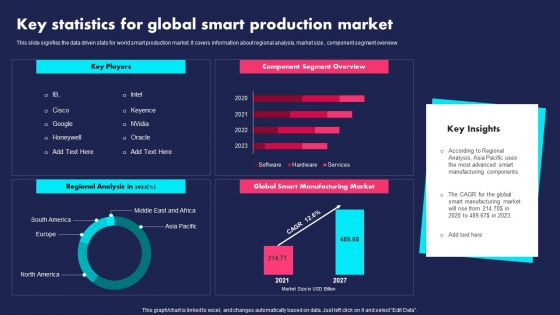
Key Statistics For Global Smart Production Market Ppt PowerPoint Presentation File Slides PDF
This slide signifies the data driven stats for world smart production market. It covers information about regional analysis, market size, component segment overview. Pitch your topic with ease and precision using this Key Statistics For Global Smart Production Market Ppt PowerPoint Presentation File Slides PDF. This layout presents information on Key Players, Component Segment Overview, Regional Analysis. It is also available for immediate download and adjustment. So, changes can be made in the color, design, graphics or any other component to create a unique layout.
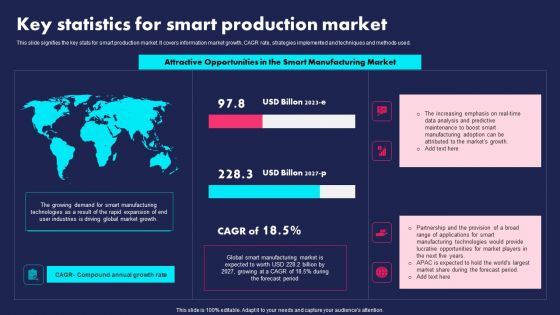
Key Statistics For Smart Production Market Ppt PowerPoint Presentation File Inspiration PDF
This slide signifies the key stats for smart production market. It covers information market growth, CAGR rate, strategies implemented and techniques and methods used. Showcasing this set of slides titled Key Statistics For Smart Production Market Ppt PowerPoint Presentation File Inspiration PDF. The topics addressed in these templates are Attractive Opportunities, Smart Manufacturing Market, Global. All the content presented in this PPT design is completely editable. Download it and make adjustments in color, background, font etc. as per your unique business setting.
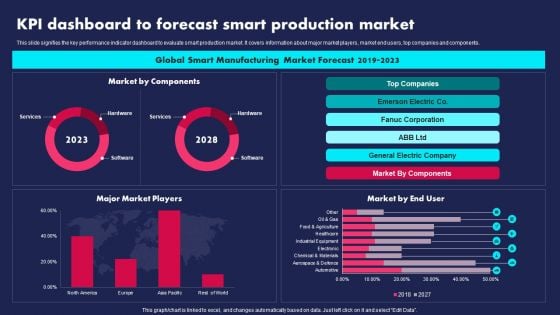
KPI Dashboard To Forecast Smart Production Market Ppt PowerPoint Presentation Gallery Visual Aids PDF
This slide signifies the key performance indicator dashboard to evaluate smart production market. It covers information about major market players, market end users, top companies and components. Pitch your topic with ease and precision using this KPI Dashboard To Forecast Smart Production Market Ppt PowerPoint Presentation Gallery Visual Aids PDF. This layout presents information on Global Smart Manufacturing, Market Forecast, 2019 To 2023. It is also available for immediate download and adjustment. So, changes can be made in the color, design, graphics or any other component to create a unique layout.
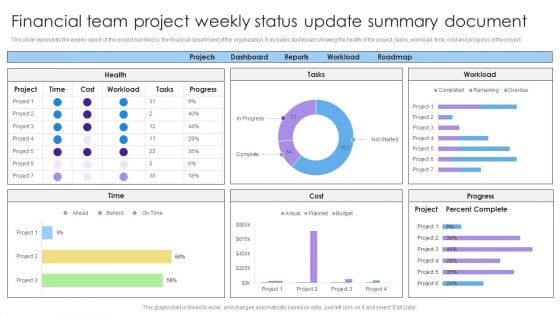
Financial Team Project Weekly Status Update Summary Document Background PDF
This slide represents the weekly report of the project handled by the financial department of the organization. It includes dashboard showing the health of the project, tasks, workload, time, cost and progress of the project. Showcasing this set of slides titled Financial Team Project Weekly Status Update Summary Document Background PDF. The topics addressed in these templates are Projects, Dashboard, Reports, Workload, Roadmap. All the content presented in this PPT design is completely editable. Download it and make adjustments in color, background, font etc. as per your unique business setting.
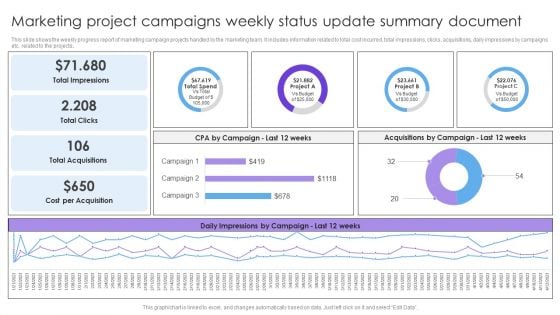
Marketing Project Campaigns Weekly Status Update Summary Document Formats PDF
This slide shows the weekly progress report of marketing campaign projects handled by the marketing team. It includes information related to total cost incurred, total impressions, clicks, acquisitions, daily impressions by campaigns etc. related to the projects. Pitch your topic with ease and precision using this Marketing Project Campaigns Weekly Status Update Summary Document Formats PDF. This layout presents information on Total Impressions, Total Clicks, Total Acquisitions. It is also available for immediate download and adjustment. So, changes can be made in the color, design, graphics or any other component to create a unique layout.
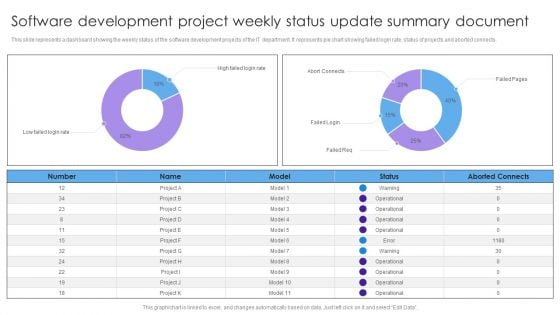
Software Development Project Weekly Status Update Summary Document Inspiration PDF
This slide represents a dashboard showing the weekly status of the software development projects of the IT department. It represents pie chart showing failed login rate, status of projects and aborted connects. Pitch your topic with ease and precision using this Software Development Project Weekly Status Update Summary Document Inspiration PDF. This layout presents information on High Failed, Login Rate, Abort Connects, Failed Login. It is also available for immediate download and adjustment. So, changes can be made in the color, design, graphics or any other component to create a unique layout.
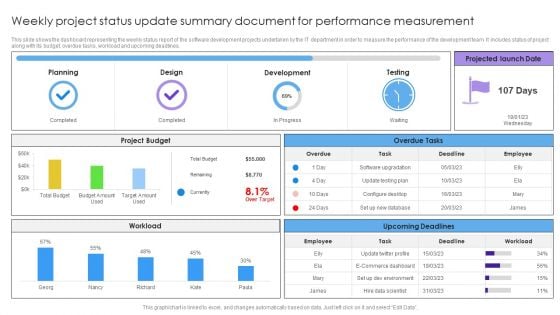
Weekly Project Status Update Summary Document For Performance Measurement Mockup PDF
This slide shows the dashboard representing the weekly status report of the software development projects undertaken by the IT department in order to measure the performance of the development team. It includes status of project along with its budget, overdue tasks, workload and upcoming deadlines. Pitch your topic with ease and precision using this Weekly Project Status Update Summary Document For Performance Measurement Mockup PDF. This layout presents information on Planning, Design, Development, Testing. It is also available for immediate download and adjustment. So, changes can be made in the color, design, graphics or any other component to create a unique layout.
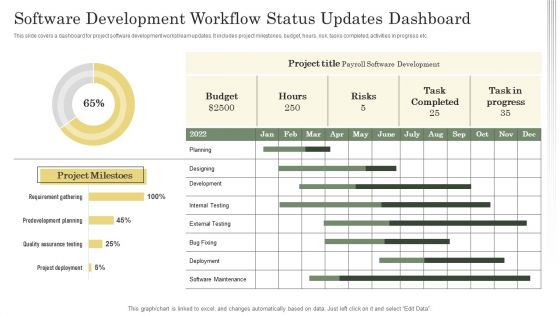
Software Development Workflow Status Updates Dashboard Ppt Gallery Slides PDF
This slide covers a dashboard for project software development workstream updates. It includes project milestones, budget, hours, risk, tasks completed, activities in progress etc. Showcasing this set of slides titled Software Development Workflow Status Updates Dashboard Ppt Gallery Slides PDF. The topics addressed in these templates are Project Milestones, Project Title, Planning. All the content presented in this PPT design is completely editable. Download it and make adjustments in color, background, font etc. as per your unique business setting.
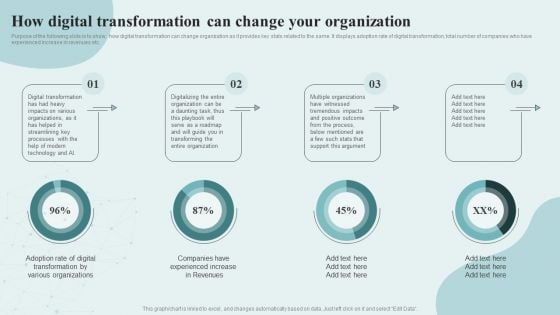
Digital Competency Evaluation And Modification How Digital Transformation Can Change Your Formats PDF
Purpose of the following slide is to show, how digital transformation can change organization as it provides key stats related to the same. It displays adoption rate of digital transformation, total number of companies who have experienced increase in revenues etc. There are so many reasons you need a Digital Competency Evaluation And Modification How Digital Transformation Can Change Your Formats PDF. The first reason is you cant spend time making everything from scratch, Thus, Slidegeeks has made presentation templates for you too. You can easily download these templates from our website easily.
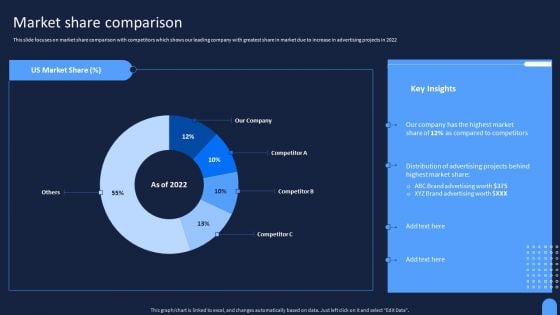
Ad And Media Agency Company Profile Market Share Comparison Infographics PDF
This slide focuses on market share comparison with competitors which shows our leading company with greatest share in market due to increase in advertising projects in 2022. If your project calls for a presentation, then Slidegeeks is your go-to partner because we have professionally designed, easy-to-edit templates that are perfect for any presentation. After downloading, you can easily edit Ad And Media Agency Company Profile Market Share Comparison Infographics PDF and make the changes accordingly. You can rearrange slides or fill them with different images. Check out all the handy templates.
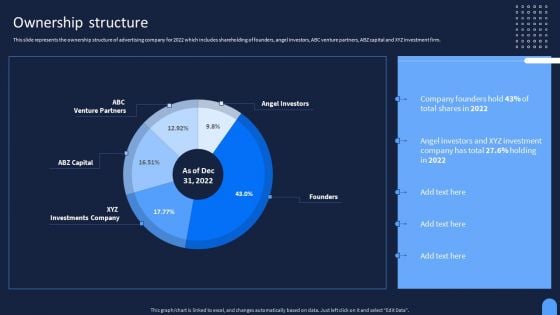
Ad And Media Agency Company Profile Ownership Structure Template PDF
This slide represents the ownership structure of advertising company for 2022 which includes shareholding of founders, angel investors, ABC venture partners, ABZ capital and XYZ investment firm. This modern and well-arranged Ad And Media Agency Company Profile Ownership Structure Template PDF provides lots of creative possibilities. It is very simple to customize and edit with the Powerpoint Software. Just drag and drop your pictures into the shapes. All facets of this template can be edited with Powerpoint, no extra software is necessary. Add your own material, put your images in the places assigned for them, adjust the colors, and then you can show your slides to the world, with an animated slide included.
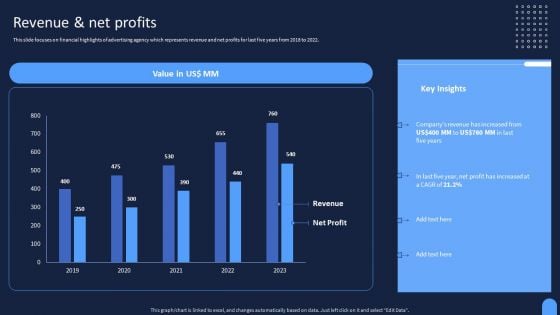
Ad And Media Agency Company Profile Revenue And Net Profits Diagrams PDF
This slide focuses on financial highlights of advertising agency which represents revenue and net profits for last five years from 2018 to 2022. Welcome to our selection of the Ad And Media Agency Company Profile Revenue And Net Profits Diagrams PDF. These are designed to help you showcase your creativity and bring your sphere to life. Planning and Innovation are essential for any business that is just starting out. This collection contains the designs that you need for your everyday presentations. All of our PowerPoints are 100 percent editable, so you can customize them to suit your needs. This multi-purpose template can be used in various situations. Grab these presentation templates today.
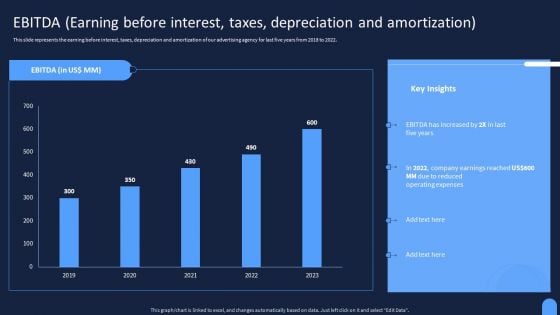
Ad And Media Agency Company Profile Ebitda Earning Before Interest Taxes Depreciation Structure PDF
This slide represents the earning before interest, taxes, depreciation and amortization of our advertising agency for last five years from 2018 to 2022. Presenting this PowerPoint presentation, titled Ad And Media Agency Company Profile Ebitda Earning Before Interest Taxes Depreciation Structure PDF, with topics curated by our researchers after extensive research. This editable presentation is available for immediate download and provides attractive features when used. Download now and captivate your audience. Presenting this Ad And Media Agency Company Profile Ebitda Earning Before Interest Taxes Depreciation Structure PDF. Our researchers have carefully researched and created these slides with all aspects taken into consideration. This is a completely customizable Ad And Media Agency Company Profile Ebitda Earning Before Interest Taxes Depreciation Structure PDF that is available for immediate downloading. Download now and make an impact on your audience. Highlight the attractive features available with our PPTs.
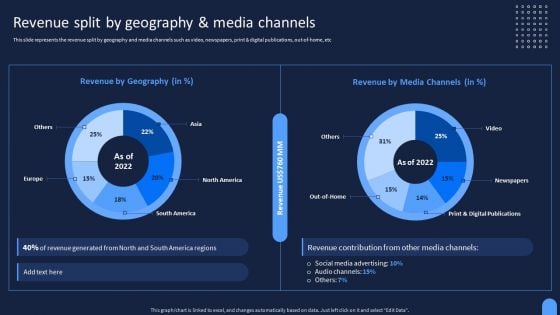
Ad And Media Agency Company Profile Revenue Split By Geography And Media Channels Clipart PDF
This slide represents the revenue split by geography and media channels such as video, newspapers, print and digital publications, out-of-home, etc This Ad And Media Agency Company Profile Revenue Split By Geography And Media Channels Clipart PDF from Slidegeeks makes it easy to present information on your topic with precision. It provides customization options, so you can make changes to the colors, design, graphics, or any other component to create a unique layout. It is also available for immediate download, so you can begin using it right away. Slidegeeks has done good research to ensure that you have everything you need to make your presentation stand out. Make a name out there for a brilliant performance.
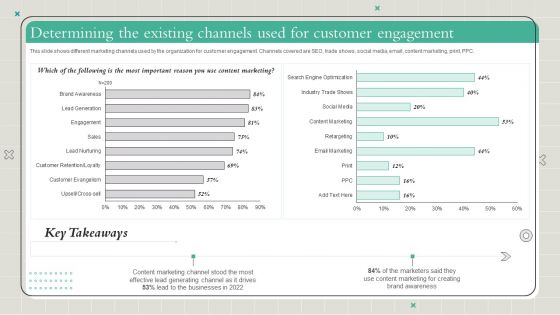
Playbook To Formulate Efficient Determining The Existing Channels Used For Customer Themes PDF
This slide shows different marketing channels used by the organization for customer engagement. Channels covered are SEO, trade shows, social media, email, content marketing, print, PPC. If your project calls for a presentation, then Slidegeeks is your go-to partner because we have professionally designed, easy-to-edit templates that are perfect for any presentation. After downloading, you can easily edit Playbook To Formulate Efficient Determining The Existing Channels Used For Customer Themes PDF and make the changes accordingly. You can rearrange slides or fill them with different images. Check out all the handy templates
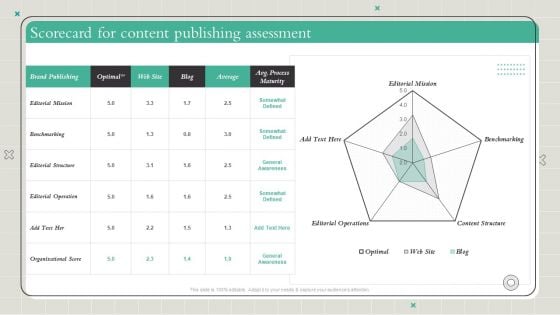
Playbook To Formulate Efficient Scorecard For Content Publishing Assessment Demonstration PDF
Coming up with a presentation necessitates that the majority of the effort goes into the content and the message you intend to convey. The visuals of a PowerPoint presentation can only be effective if it supplements and supports the story that is being told. Keeping this in mind our experts created Playbook To Formulate Efficient Scorecard For Content Publishing Assessment Demonstration PDF to reduce the time that goes into designing the presentation. This way, you can concentrate on the message while our designers take care of providing you with the right template for the situation.


 Continue with Email

 Home
Home


