Coordination
Dashboard For Tracking Sales Order Processing Rate Inspiration PDF
The following slide showcases sales order fulfilment rate dashboard to measure efficiency of shipping, process and packaging. It includes components such as partially fulfilled orders, pending orders, total number of orders etc. Showcasing this set of slides titled Dashboard For Tracking Sales Order Processing Rate Inspiration PDF. The topics addressed in these templates are Order Fulfilment, Partially Fulfilled, Pending. All the content presented in this PPT design is completely editable. Download it and make adjustments in color, background, font etc. as per your unique business setting.
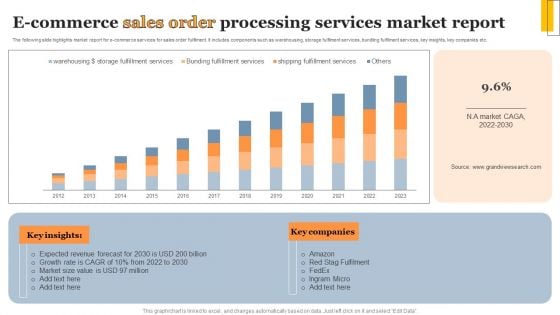
E Commerce Sales Order Processing Services Market Report Structure PDF
The following slide highlights market report for e-commerce services for sales order fulfilment. It includes components such as warehousing, storage fulfilment services, bundling fulfilment services, key insights, key companies etc. Showcasing this set of slides titled E Commerce Sales Order Processing Services Market Report Structure PDF. The topics addressed in these templates are Expected Revenue Forecast, Growth Rate, Market Size Value. All the content presented in this PPT design is completely editable. Download it and make adjustments in color, background, font etc. as per your unique business setting.
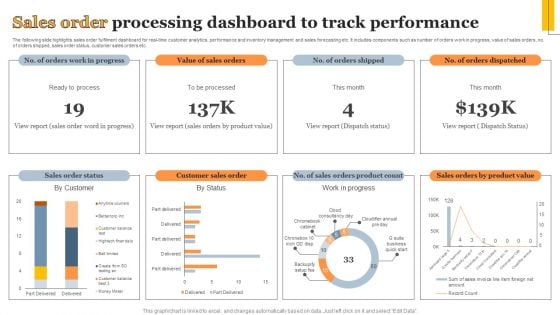
Sales Order Processing Dashboard To Track Performance Information PDF
The following slide highlights sales order fulfilment dashboard for real-time customer analytics, performance and inventory management and sales forecasting etc. It includes components such as number of orders work in progress, value of sales orders, no. of orders shipped, sales order status, customer sales orders etc. Showcasing this set of slides titled Sales Order Processing Dashboard To Track Performance Information PDF. The topics addressed in these templates are Sales Order Status, Customer Sales Order, Work Progress. All the content presented in this PPT design is completely editable. Download it and make adjustments in color, background, font etc. as per your unique business setting.
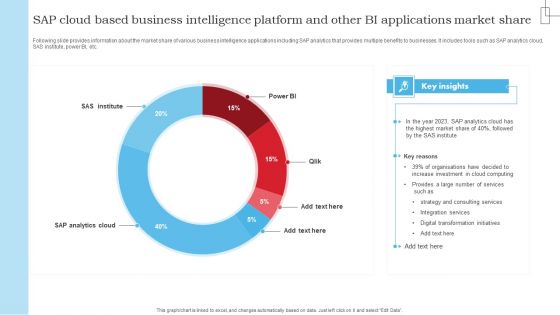
SAP Cloud Based Business Intelligence Platform And Other BI Applications Market Share Structure PDF
Following slide provides information about the market share of various business intelligence applications including SAP analytics that provides multiple benefits to businesses. It includes tools such as SAP analytics cloud, SAS institute, power BI, etc. Showcasing this set of slides titled SAP Cloud Based Business Intelligence Platform And Other BI Applications Market Share Structure PDF. The topics addressed in these templates are Strategy Consulting Services, Integration Services, Digital Transformation Initiatives. All the content presented in this PPT design is completely editable. Download it and make adjustments in color, background, font etc. as per your unique business setting.
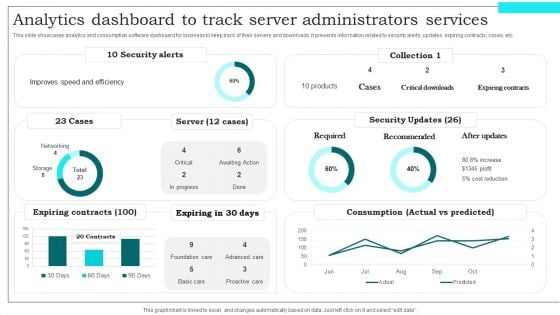
Analytics Dashboard To Track Server Administrators Services Demonstration PDF
This slide showcases analytics and consumption software dashboard for business to keep track of their servers and downloads. It presents information related to security alerts, updates, expiring contracts, cases, etc. Showcasing this set of slides titled Analytics Dashboard To Track Server Administrators Services Demonstration PDF. The topics addressed in these templates are Expiring Contracts, Security Updates, Required. All the content presented in this PPT design is completely editable. Download it and make adjustments in color, background, font etc. as per your unique business setting.
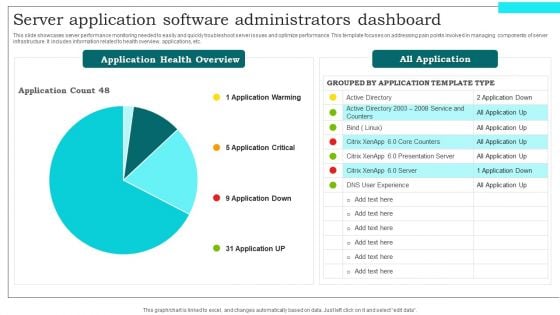
Server Application Software Administrators Dashboard Slides PDF
This slide showcases server performance monitoring needed to easily and quickly troubleshoot server issues and optimize performance. This template focuses on addressing pain points involved in managing components of server infrastructure. It includes information related to health overview, applications, etc. Showcasing this set of slides titled Server Application Software Administrators Dashboard Slides PDF. The topics addressed in these templates are Application Warming, Application Critical, Application Down. All the content presented in this PPT design is completely editable. Download it and make adjustments in color, background, font etc. as per your unique business setting.
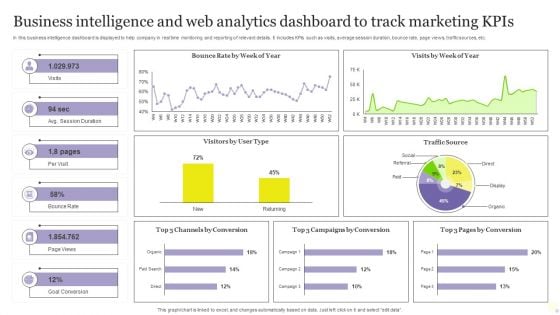
Business Intelligence And Web Analytics Dashboard To Track Marketing Kpis Inspiration PDF
In this business intelligence dashboard is displayed to help company in real time monitoring and reporting of relevant details. It includes KPIs such as visits, average session duration, bounce rate, page views, traffic sources, etc. Showcasing this set of slides titled Business Intelligence And Web Analytics Dashboard To Track Marketing Kpis Inspiration PDF. The topics addressed in these templates are Goal Conversion, Track Marketing Kpis, Web Analytics Dashboard. All the content presented in this PPT design is completely editable. Download it and make adjustments in color, background, font etc. as per your unique business setting.
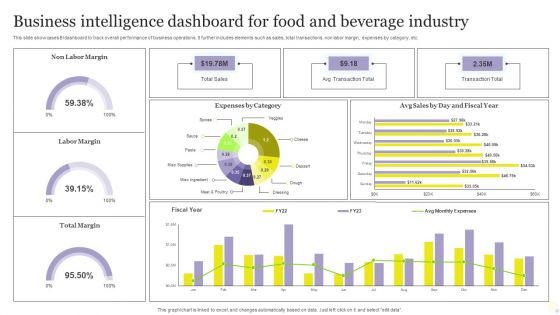
Business Intelligence Dashboard For Food And Beverage Industry Diagrams PDF
This slide showcases BI dashboard to track overall performance of business operations. It further includes elements such as sales, total transactions, non labor margin, expenses by category, etc. Pitch your topic with ease and precision using this Business Intelligence Dashboard For Food And Beverage Industry Diagrams PDF. This layout presents information on Expenses, Sales, Business Intelligence Dashboard. It is also available for immediate download and adjustment. So, changes can be made in the color, design, graphics or any other component to create a unique layout.
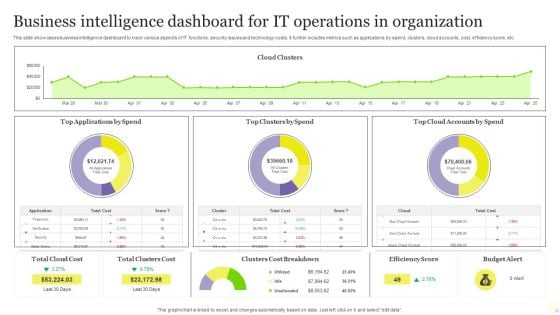
Business Intelligence Dashboard For It Operations In Organization Themes PDF
This slide showcases business intelligence dashboard to track various aspects of IT functions, security issues and technology costs. It further includes metrics such as applications by spend, clusters, cloud accounts, cost, efficiency score, etc. Showcasing this set of slides titled Business Intelligence Dashboard For It Operations In Organization Themes PDF. The topics addressed in these templates are Business Intelligence Dashboard, IT Operations, Organization. All the content presented in this PPT design is completely editable. Download it and make adjustments in color, background, font etc. as per your unique business setting.
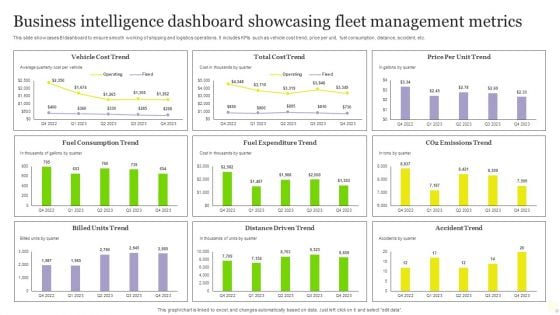
Business Intelligence Dashboard Showcasing Fleet Management Metrics Elements PDF
This slide showcases BI dashboard to ensure smooth working of shipping and logistics operations. It includes KPIs such as vehicle cost trend, price per unit, fuel consumption, distance, accident, etc. Showcasing this set of slides titled Business Intelligence Dashboard Showcasing Fleet Management Metrics Elements PDF. The topics addressed in these templates are Cost Trend, Price Per Unit Trend, Vehicle Cost Trend. All the content presented in this PPT design is completely editable. Download it and make adjustments in color, background, font etc. as per your unique business setting.
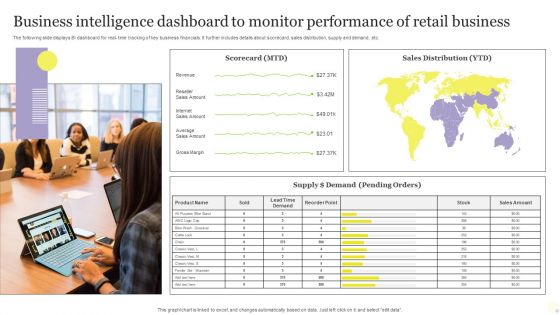
Business Intelligence Dashboard To Monitor Performance Of Retail Business Infographics PDF
The following slide displays BI dashboard for real time tracking of key business financials. It further includes details about scorecard, sales distribution, supply and demand, etc. Pitch your topic with ease and precision using this Business Intelligence Dashboard To Monitor Performance Of Retail Business Infographics PDF. This layout presents information on Business Intelligence Dashboard, Monitor Performance, Retail Business. It is also available for immediate download and adjustment. So, changes can be made in the color, design, graphics or any other component to create a unique layout.
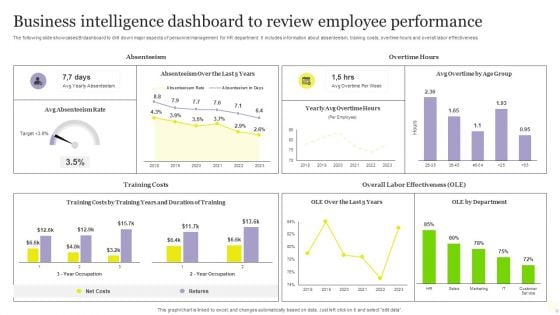
Business Intelligence Dashboard To Review Employee Performance Pictures PDF
The following slide showcases BI dashboard to drill down major aspects of personnel management for HR department. It includes information about absenteeism, training costs, overtime hours and overall labor effectiveness. Showcasing this set of slides titled Business Intelligence Dashboard To Review Employee Performance Pictures PDF. The topics addressed in these templates are Business Intelligence Dashboard, Review Employee Performance. All the content presented in this PPT design is completely editable. Download it and make adjustments in color, background, font etc. as per your unique business setting.
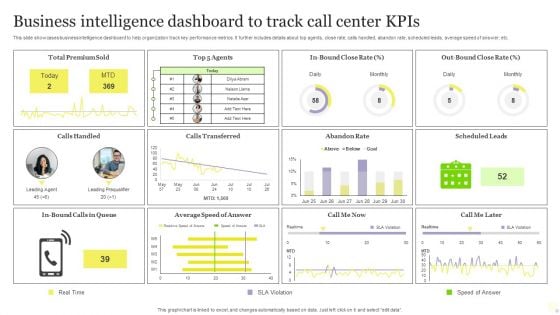
Business Intelligence Dashboard To Track Call Center Kpis Download PDF
This slide showcases business intelligence dashboard to help organization track key performance metrics. It further includes details about top agents, close rate, calls handled, abandon rate, scheduled leads, average speed of answer, etc. Pitch your topic with ease and precision using this Business Intelligence Dashboard To Track Call Center Kpis Download PDF. This layout presents information on Business Intelligence Dashboard, Track Call Center Kpis. It is also available for immediate download and adjustment. So, changes can be made in the color, design, graphics or any other component to create a unique layout.
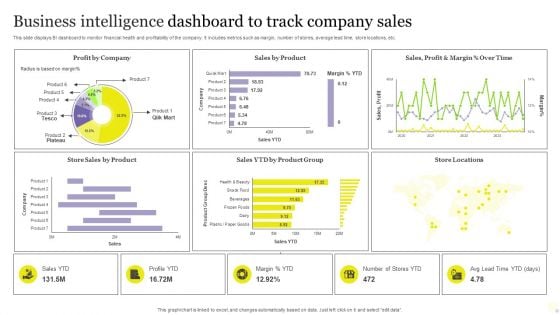
Business Intelligence Dashboard To Track Company Sales Rules PDF
This slide displays BI dashboard to monitor financial health and profitability of the company. It includes metrics such as margin, number of stores, average lead time, store locations, etc. Showcasing this set of slides titled Business Intelligence Dashboard To Track Company Sales Rules PDF. The topics addressed in these templates are Business Intelligence Dashboard, Track Company Sales. All the content presented in this PPT design is completely editable. Download it and make adjustments in color, background, font etc. as per your unique business setting.
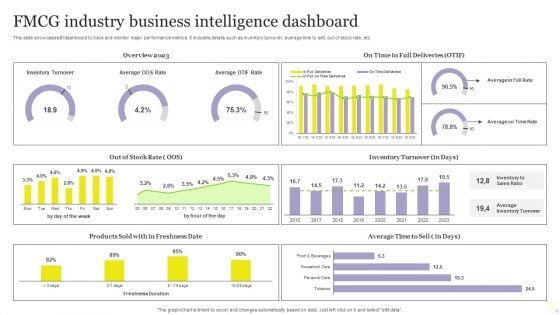
FMCG Industry Business Intelligence Dashboard Mockup PDF
This slide showcases BI dashboard to track and monitor major performance metrics. It includes details such as inventory turnover, average time to sell, out of stock rate, etc. Pitch your topic with ease and precision using this FMCG Industry Business Intelligence Dashboard Mockup PDF. This layout presents information on Average, Inventory Turnover, Business Intelligence Dashboard. It is also available for immediate download and adjustment. So, changes can be made in the color, design, graphics or any other component to create a unique layout.
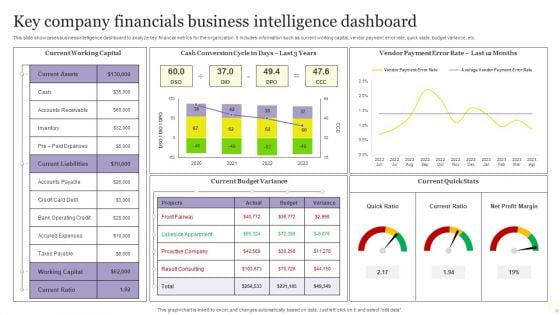
Key Company Financials Business Intelligence Dashboard Graphics PDF
This slide showcases business intelligence dashboard to analyze key financial metrics for the organization. It includes information such as current working capital, vendor payment error rate, quick stats, budget variance, etc. Showcasing this set of slides titled Key Company Financials Business Intelligence Dashboard Graphics PDF. The topics addressed in these templates are Key Company Financials, Business Intelligence Dashboard. All the content presented in this PPT design is completely editable. Download it and make adjustments in color, background, font etc. as per your unique business setting.
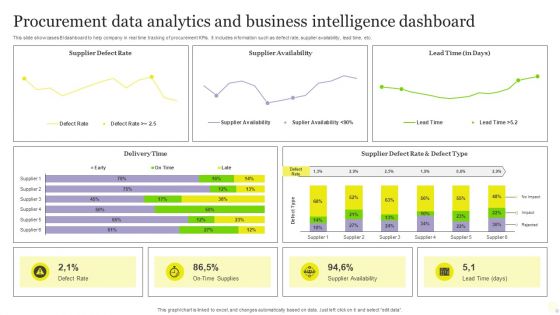
Procurement Data Analytics And Business Intelligence Dashboard Pictures PDF
This slide showcases BI dashboard to help company in real time tracking of procurement KPIs. It includes information such as defect rate, supplier availability, lead time, etc. Pitch your topic with ease and precision using this Procurement Data Analytics And Business Intelligence Dashboard Pictures PDF. This layout presents information on Procurement Data Analytics, Business Intelligence Dashboard. It is also available for immediate download and adjustment. So, changes can be made in the color, design, graphics or any other component to create a unique layout.
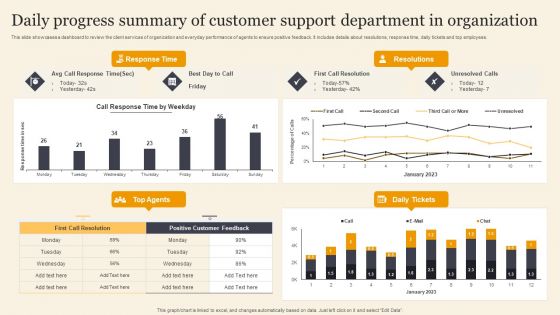
Daily Progress Summary Of Customer Support Department In Organization Portrait PDF
This slide showcases a dashboard to review the client services of organization and everyday performance of agents to ensure positive feedback. It includes details about resolutions, response time, daily tickets and top employees. Showcasing this set of slides titled Daily Progress Summary Of Customer Support Department In Organization Portrait PDF. The topics addressed in these templates are Daily Progress Summary, Customer Support, Department In Organization. All the content presented in this PPT design is completely editable. Download it and make adjustments in color, background, font etc. as per your unique business setting.
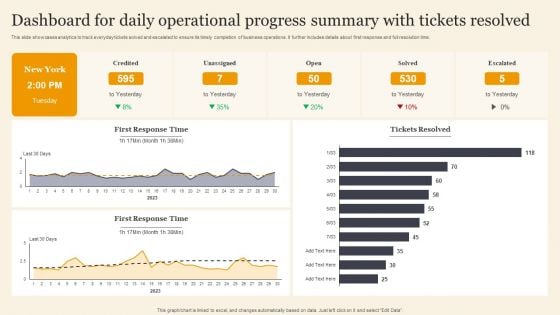
Dashboard For Daily Operational Progress Summary With Tickets Resolved Background PDF
This slide showcases analytics to track everyday tickets solved and escalated to ensure its timely completion of business operations. It further includes details about first response and full resolution time. Pitch your topic with ease and precision using this Dashboard For Daily Operational Progress Summary With Tickets Resolved Background PDF. This layout presents information on Dashboard For Daily Operational, Progress Summary, Tickets Resolved. It is also available for immediate download and adjustment. So, changes can be made in the color, design, graphics or any other component to create a unique layout.

HR Cost Budget For Training And Development Program Brochure PDF
This slide displays the training budget to improve individuals skills and competencies required to complete the job. Some of the training programs include employee induction, soft skills training, web based training, software training, etc. Pitch your topic with ease and precision using this HR Cost Budget For Training And Development Program Brochure PDF. This layout presents information on HR Cost Budget, Training And Development Program. It is also available for immediate download and adjustment. So, changes can be made in the color, design, graphics or any other component to create a unique layout.
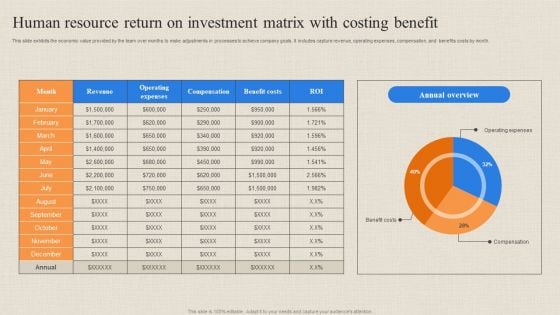
Human Resource Return On Investment Matrix With Costing Benefit Microsoft PDF
This slide exhibits the economic value provided by the team over months to make adjustments in processes to achieve company goals. It includes capture revenue, operating expenses, compensation, and benefits costs by month. Showcasing this set of slides titled Human Resource Return On Investment Matrix With Costing Benefit Microsoft PDF. The topics addressed in these templates are Operating Expenses, Benefit Costs, Revenue. All the content presented in this PPT design is completely editable. Download it and make adjustments in color, background, font etc. as per your unique business setting.
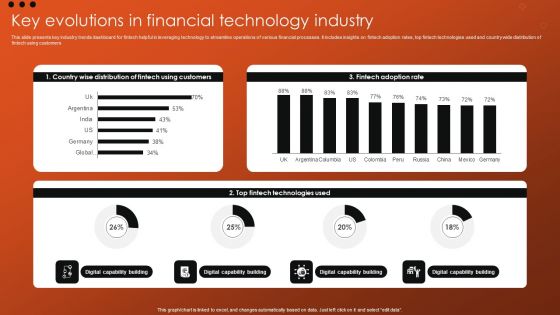
Key Evolutions In Financial Technology Industry Ideas PDF
This slide presents key industry trends dashboard for fintech helpful in leveraging technology to streamline operations of various financial processes. It includes insights on fintech adoption rates, top fintech technologies used and countrywide distribution of fintech using customers. Showcasing this set of slides titled Key Evolutions In Financial Technology Industry Ideas PDF. The topics addressed in these templates are Key Evolutions, Financial Technology Industry. All the content presented in this PPT design is completely editable. Download it and make adjustments in color, background, font etc. as per your unique business setting.
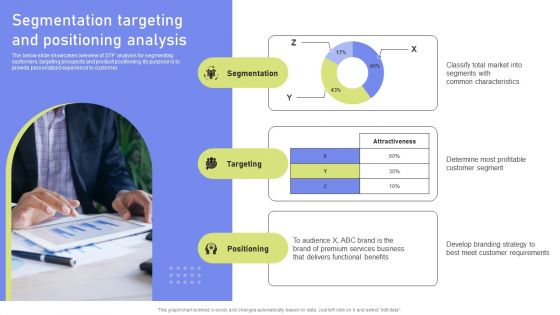
Segmentation Targeting And Positioning Analysis Elements PDF
The below slide showcases overview of STP analysis for segmenting customers, targeting prospects and product positioning. Its purpose is to provide personalized experience to customer. From laying roadmaps to briefing everything in detail, our templates are perfect for you. You can set the stage with your presentation slides. All you have to do is download these easy-to-edit and customizable templates. Segmentation Targeting And Positioning Analysis Elements PDF will help you deliver an outstanding performance that everyone would remember and praise you for. Do download this presentation today.
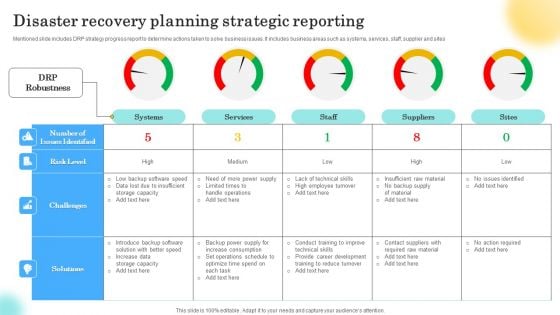
Disaster Recovery Planning Strategic Reporting Inspiration PDF
Mentioned slide includes DRP strategy progress report to determine actions taken to solve business issues. It includes business areas such as systems, services, staff, supplier and sites Pitch your topic with ease and precision using this Disaster Recovery Planning Strategic Reporting Inspiration PDF. This layout presents information on Systems, Services, Staff. It is also available for immediate download and adjustment. So, changes can be made in the color, design, graphics or any other component to create a unique layout.
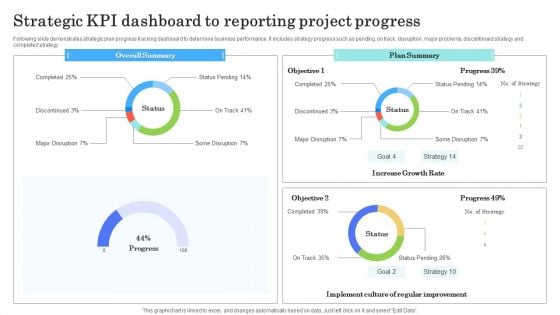
Strategic Kpi Dashboard To Reporting Project Progress Sample PDF
Following slide demonstrates strategic plan progress tracking dashboard to determine business performance. It includes strategy progress such as pending, on track, disruption, major problems, discontinued strategy and completed strategy Pitch your topic with ease and precision using this Strategic Kpi Dashboard To Reporting Project Progress Sample PDF. This layout presents information on Overall Summary, Plan Summary, Growth Rate. It is also available for immediate download and adjustment. So, changes can be made in the color, design, graphics or any other component to create a unique layout.
Strategic Performance Evaluation Reporting Icon Sample PDF
Showcasing this set of slides titled Strategic Performance Evaluation Reporting Icon Sample PDF. The topics addressed in these templates are Strategic Performance, Evaluation, Reporting. All the content presented in this PPT design is completely editable. Download it and make adjustments in color, background, font etc. as per your unique business setting.
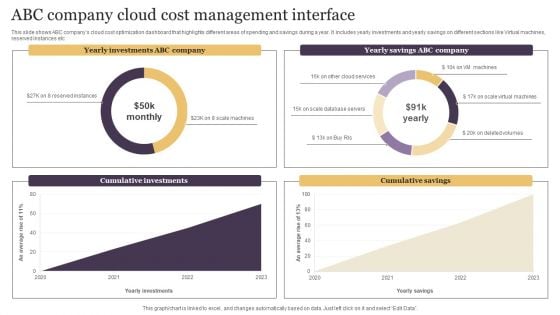
ABC Company Cloud Cost Management Interface Inspiration PDF
This slide shows ABC companys cloud cost optimization dashboard that highlights different areas of spending and savings during a year. It includes yearly investments and yearly savings on different sections like Virtual machines, reserved instances etc. Showcasing this set of slides titled ABC Company Cloud Cost Management Interface Inspiration PDF. The topics addressed in these templates are Yearly Investments ABC Company, Yearly Savings ABC Company, Cumulative Savings. All the content presented in this PPT design is completely editable. Download it and make adjustments in color, background, font etc. as per your unique business setting.
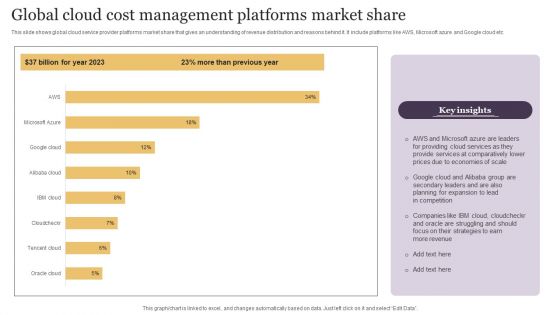
Global Cloud Cost Management Platforms Market Share Structure PDF
This slide shows global cloud service provider platforms market share that gives an understanding of revenue distribution and reasons behind it. It include platforms like AWS, Microsoft azure and Google cloud etc. Showcasing this set of slides titled Global Cloud Cost Management Platforms Market Share Structure PDF. The topics addressed in these templates are AWS Microsoft, Google Cloud Alibaba, Companies Like IBM Cloud. All the content presented in this PPT design is completely editable. Download it and make adjustments in color, background, font etc. as per your unique business setting.

Two Years Cloud Cost Management Trends Portrait PDF
This side shows two year trends of cost cloud optimization which track downs future areas of cost cutting. It include basic cost function areas like shutdown workloads of system, instances of rightsizing and required tagging etc. Showcasing this set of slides titled Two Years Cloud Cost Management Trends Portrait PDF. The topics addressed in these templates are Cost Optimization, Expansion Process, Legal Validation. All the content presented in this PPT design is completely editable. Download it and make adjustments in color, background, font etc. as per your unique business setting.
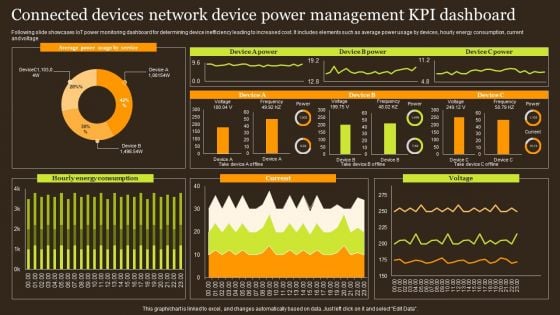
Connected Devices Network Device Power Management KPI Dashboard Template PDF
Following slide showcases IoT power monitoring dashboard for determining device inefficiency leading to increased cost. It includes elements such as average power usage by devices, hourly energy consumption, current and voltage. Showcasing this set of slides titled Connected Devices Network Device Power Management KPI Dashboard Template PDF. The topics addressed in these templates are Hourly Energy Consumption, Average Power Usage Service, Current. All the content presented in this PPT design is completely editable. Download it and make adjustments in color, background, font etc. as per your unique business setting.
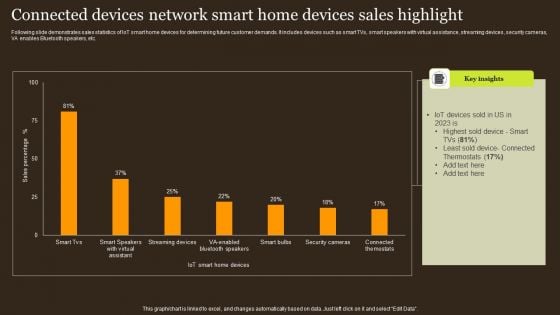
Connected Devices Network Smart Home Devices Sales Highlight Structure PDF
Following slide demonstrates sales statistics of IoT smart home devices for determining future customer demands. It includes devices such as smart TVs, smart speakers with virtual assistance, streaming devices, security cameras, VA enables Bluetooth speakers, etc. Showcasing this set of slides titled Connected Devices Network Smart Home Devices Sales Highlight Structure PDF. The topics addressed in these templates are Iot Devices, Least Sold Device, Thermostats. All the content presented in this PPT design is completely editable. Download it and make adjustments in color, background, font etc. as per your unique business setting.
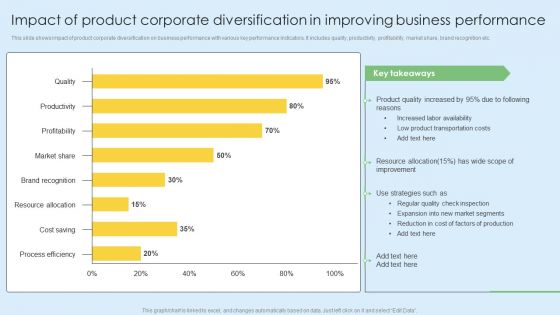
Impact Of Product Corporate Diversification In Improving Business Performance Infographics PDF
This slide shows impact of product corporate diversification on business performance with various key performance indicators. It includes quality, productivity, profitability, market share, brand recognition etc. Showcasing this set of slides titled Impact Of Product Corporate Diversification In Improving Business Performance Infographics PDF. The topics addressed in these templates are Product Transportation Costs, Product Quality, Market Segments. All the content presented in this PPT design is completely editable. Download it and make adjustments in color, background, font etc. as per your unique business setting.
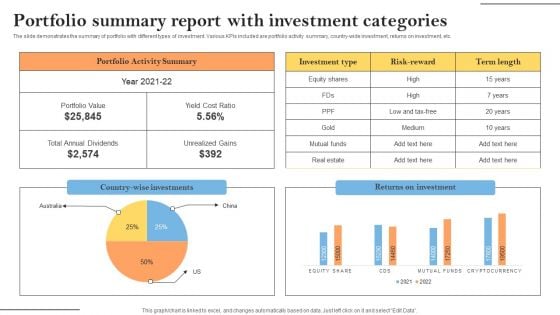
Portfolio Summary Report With Investment Categories Elements PDF
The slide demonstrates the summary of portfolio with different types of investment. Various KPIs included are portfolio activity summary, country-wide investment, returns on investment, etc. Pitch your topic with ease and precision using this Portfolio Summary Report With Investment Categories Elements PDF. This layout presents information on Portfolio Activity Summary, Investment, Risk Reward. It is also available for immediate download and adjustment. So, changes can be made in the color, design, graphics or any other component to create a unique layout.
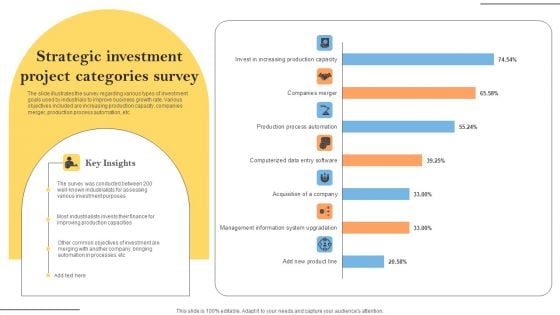
Strategic Investment Project Categories Survey Infographics PDF
The slide illustrates the survey regarding various types of investment goals used by industrials to improve business growth rate. Various objectives included are increasing production capacity, companies merger, production process automation, etc . Showcasing this set of slides titled Strategic Investment Project Categories Survey Infographics PDF. The topics addressed in these templates are Investment, Automation In Processes, Key Insights. All the content presented in this PPT design is completely editable. Download it and make adjustments in color, background, font etc. as per your unique business setting.
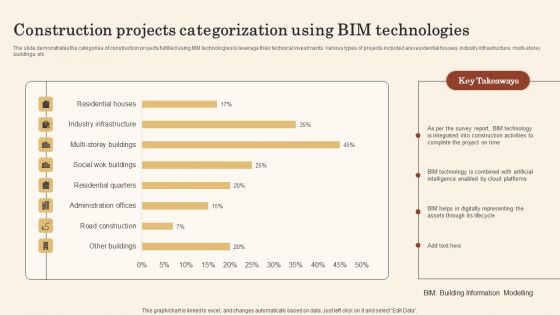
Construction Projects Categorization Using BIM Technologies Professional PDF
The slide demonstrates the categories of construction projects fulfilled using BIM technologies to leverage their technical investments. Various types of projects included are residential houses, industry infrastructure, multi-storey buildings, etc. Pitch your topic with ease and precision using this Construction Projects Categorization Using BIM Technologies Professional PDF. This layout presents information on Technology, Integrated, Survey Report. It is also available for immediate download and adjustment. So, changes can be made in the color, design, graphics or any other component to create a unique layout.
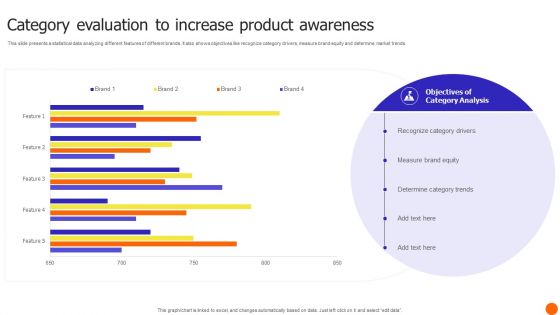
Category Evaluation To Increase Product Awareness Template PDF
This slide presents a statistical data analyzing different features of different brands. It also shows objectives like recognize category drivers, measure brand equity and determine market trends. Showcasing this set of slides titled Category Evaluation To Increase Product Awareness Template PDF. The topics addressed in these templates are Determine Category Trends, Measure Brand Equity, Recognize Category Drivers. All the content presented in this PPT design is completely editable. Download it and make adjustments in color, background, font etc. as per your unique business setting.
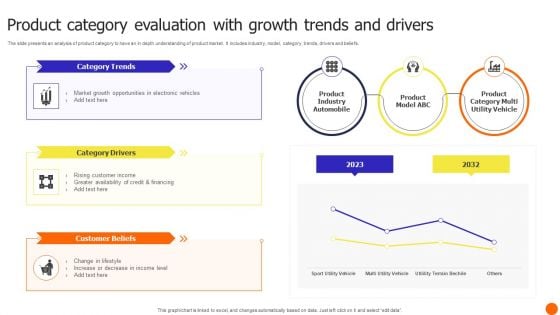
Product Category Evaluation With Growth Trends And Drivers Themes PDF
The slide presents an analysis of product category to have an in depth understanding of product market. It includes industry, model, category, trends, drivers and beliefs. Pitch your topic with ease and precision using this Product Category Evaluation With Growth Trends And Drivers Themes PDF. This layout presents information on Product Industry Automobile, Customer Beliefs, Category Drivers. It is also available for immediate download and adjustment. So, changes can be made in the color, design, graphics or any other component to create a unique layout.
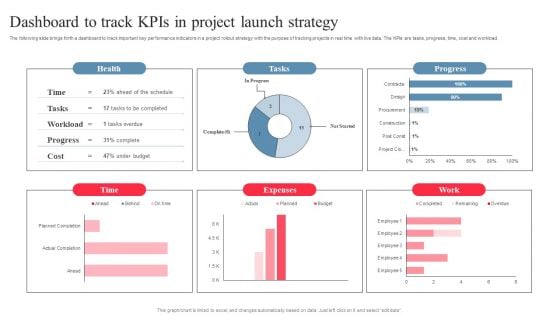
Dashboard To Track Kpis In Project Launch Strategy Pictures PDF
The following slide brings forth a dashboard to track important key performance indicators in a project rollout strategy with the purpose of tracking projects in real time with live data. The KPIs are tasks, progress, time, cost and workload. Showcasing this set of slides titled Dashboard To Track Kpis In Project Launch Strategy Pictures PDF. The topics addressed in these templates are Expenses, Project Launch Strategy, Dashboard To Track Kpis. All the content presented in this PPT design is completely editable. Download it and make adjustments in color, background, font etc. as per your unique business setting.
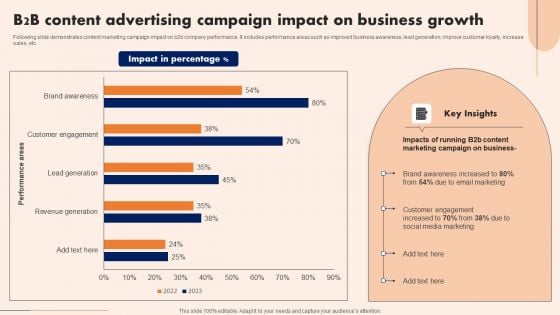
B2B Content Advertising Campaign Impact On Business Growth Sample PDF
Following slide demonstrates content marketing campaign impact on b2b company performance. It includes performance areas such as improved business awareness, lead generation, improve customer loyalty, increase sales, etc. Pitch your topic with ease and precision using this B2B Content Advertising Campaign Impact On Business Growth Sample PDF. This layout presents information on Key Insights, Growth, Marketing . It is also available for immediate download and adjustment. So, changes can be made in the color, design, graphics or any other component to create a unique layout.
Dashboard For Tracking Direct Mail Advertising Campaign Performance Inspiration PDF
This slide represents dashboard showcasing direct mail marketing campaign performance progress. It provides information regarding click through rate, campaign performance, web conversions, total revenue etc. Showcasing this set of slides titled Dashboard For Tracking Direct Mail Advertising Campaign Performance Inspiration PDF. The topics addressed in these templates are Product Delivery Rate, Deliverables, App Uninstalls. All the content presented in this PPT design is completely editable. Download it and make adjustments in color, background, font etc. as per your unique business setting.
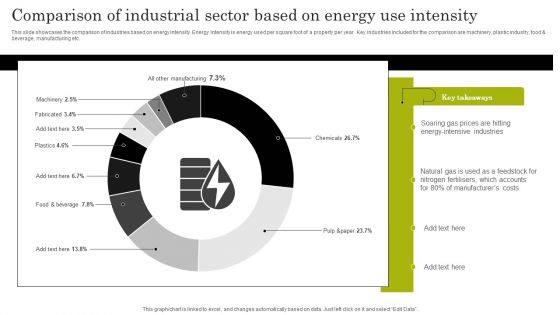
Comparison Of Industrial Sector Based On Energy Use Intensity Themes PDF
This slide showcases the comparison of industries based on energy intensity. Energy intensity is energy used per square foot of a property per year. Key industries included for the comparison are machinery, plastic industry, food and beverage, manufacturing etc. Showcasing this set of slides titled Comparison Of Industrial Sector Based On Energy Use Intensity Themes PDF. The topics addressed in these templates are Machinery, Fabricated, Plastics. All the content presented in this PPT design is completely editable. Download it and make adjustments in color, background, font etc. as per your unique business setting.
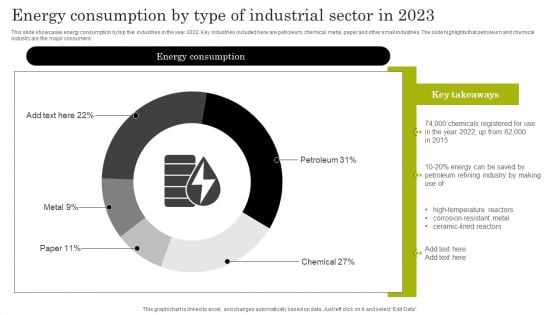
Energy Consumption By Type Of Industrial Sector In 2023 Structure PDF
This slide showcases energy consumption by top five industries in the year 2022. Key industries included here are petroleum, chemical, metal, paper and other small industries. The slide highlights that petroleum and chemical industry are the major consumers. Showcasing this set of slides titled Energy Consumption By Type Of Industrial Sector In 2023 Structure PDF. The topics addressed in these templates are Petroleum, Chemical, Metal. All the content presented in this PPT design is completely editable. Download it and make adjustments in color, background, font etc. as per your unique business setting.
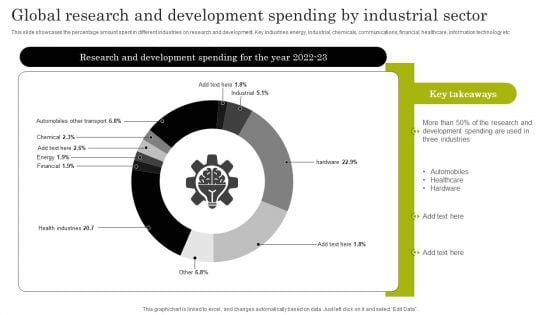
Global Research And Development Spending By Industrial Sector Portrait PDF
This slide showcases the percentage amount spent in different industries on research and development. Key industries energy, industrial, chemicals, communications, financial, healthcare, information technology etc. Showcasing this set of slides titled Global Research And Development Spending By Industrial Sector Portrait PDF. The topics addressed in these templates are Automobiles Other Transport, Hardware, Financial. All the content presented in this PPT design is completely editable. Download it and make adjustments in color, background, font etc. as per your unique business setting.
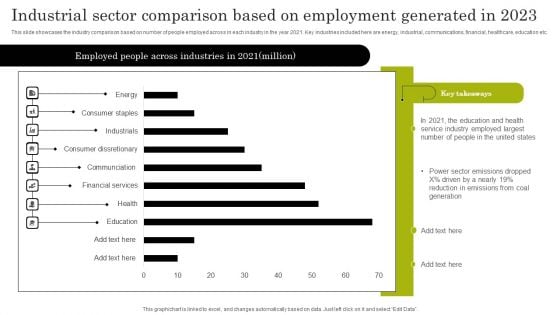
Industrial Sector Comparison Based On Employment Generated In 2023 Portrait PDF
This slide showcases the industry comparison based on number of people employed across in each industry in the year 2021. Key industries included here are energy, industrial, communications, financial, healthcare, education etc. Showcasing this set of slides titled Industrial Sector Comparison Based On Employment Generated In 2023 Portrait PDF. The topics addressed in these templates are Employed People, Across Industries, Power Sector Emissions. All the content presented in this PPT design is completely editable. Download it and make adjustments in color, background, font etc. as per your unique business setting.
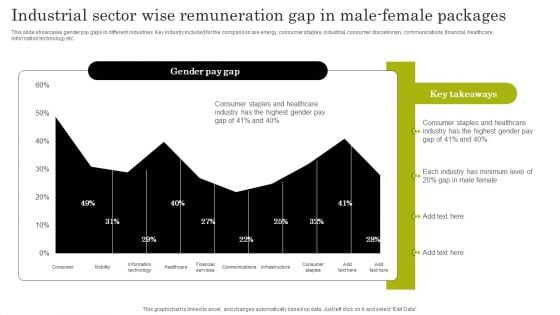
Industrial Sector Wise Remuneration Gap In Male Female Packages Mockup PDF
This slide showcases gender pay gaps in different industries. Key industry included for the comparison are energy, consumer staples, industrial, consumer discretionary, communications, financial, healthcare, information technology etc. Showcasing this set of slides titled Industrial Sector Wise Remuneration Gap In Male Female Packages Mockup PDF. The topics addressed in these templates are Consumer Staples, Healthcare, Highest Gender Pay. All the content presented in this PPT design is completely editable. Download it and make adjustments in color, background, font etc. as per your unique business setting.
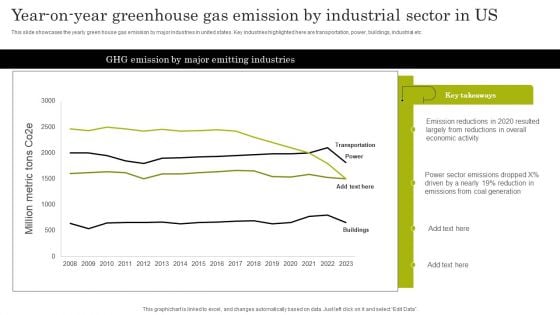
Year On Year Greenhouse Gas Emission By Industrial Sector In Us Introduction PDF
This slide showcases the yearly green house gas emission by major industries in united states. Key industries highlighted here are transportation, power, buildings, industrial etc. Showcasing this set of slides titled Year On Year Greenhouse Gas Emission By Industrial Sector In Us Introduction PDF. The topics addressed in these templates are Emission Reductions, Power Sector Emissions, Coal Generation. All the content presented in this PPT design is completely editable. Download it and make adjustments in color, background, font etc. as per your unique business setting.
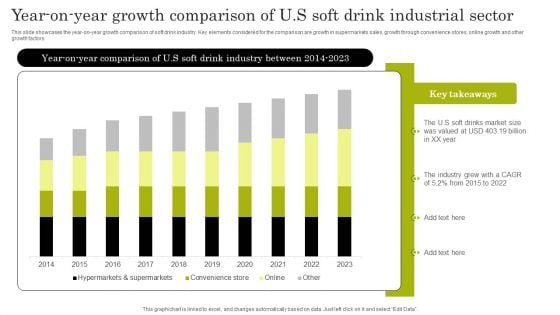
Year On Year Growth Comparison Of U S Soft Drink Industrial Sector Topics PDF
This slide showcases the year-on-year growth comparison of soft drink industry. Key elements considered for the comparison are growth in supermarkets sales, growth through convenience stores, online growth and other growth factors. Showcasing this set of slides titled Year On Year Growth Comparison Of U S Soft Drink Industrial Sector Topics PDF. The topics addressed in these templates are The Industry Grew, Soft Drinks, Market Size. All the content presented in this PPT design is completely editable. Download it and make adjustments in color, background, font etc. as per your unique business setting.
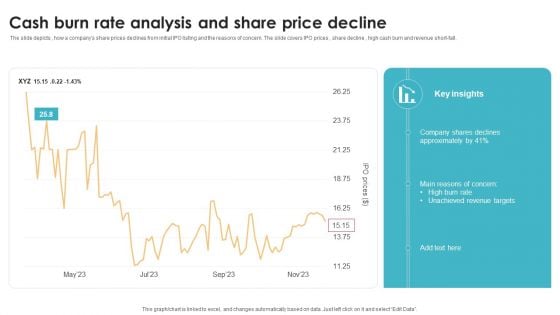
Cash Burn Rate Analysis And Share Price Decline Formats PDF
The slide depicts , how a companys share prices declines from initial IPO listing and the reasons of concern. The slide covers IPO prices , share decline , high cash burn and revenue short-fall. Pitch your topic with ease and precision using this Cash Burn Rate Analysis And Share Price Decline Formats PDF. This layout presents information on Key Insights, Decline, Targets. It is also available for immediate download and adjustment. So, changes can be made in the color, design, graphics or any other component to create a unique layout.
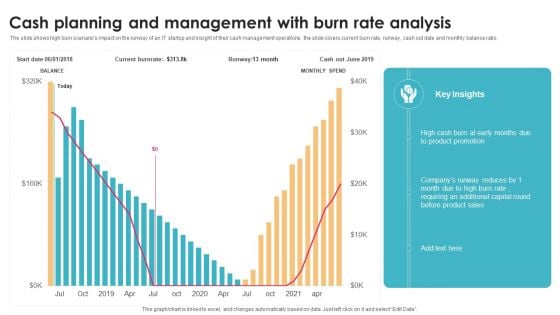
Cash Planning And Management With Burn Rate Analysis Background PDF
The slide shows high burn scenarios impact on the runway of an IT startup and insight of their cash management operations . the slide covers current burn rate, runway, cash out date and monthly balance ratio. Pitch your topic with ease and precision using this Cash Planning And Management With Burn Rate Analysis Background PDF. This layout presents information on Analysis, Key Insights, Product Sales. It is also available for immediate download and adjustment. So, changes can be made in the color, design, graphics or any other component to create a unique layout.
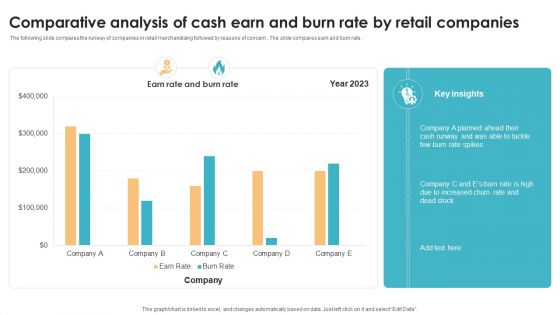
Comparative Analysis Of Cash Earn And Burn Rate By Retail Companies Slides PDF
The following slide compares the runway of companies in retail merchandising followed by reasons of concern . The slide compares earn and burn rate . Pitch your topic with ease and precision using this Comparative Analysis Of Cash Earn And Burn Rate By Retail Companies Slides PDF. This layout presents information on Key Insights, Companies, Company. It is also available for immediate download and adjustment. So, changes can be made in the color, design, graphics or any other component to create a unique layout.
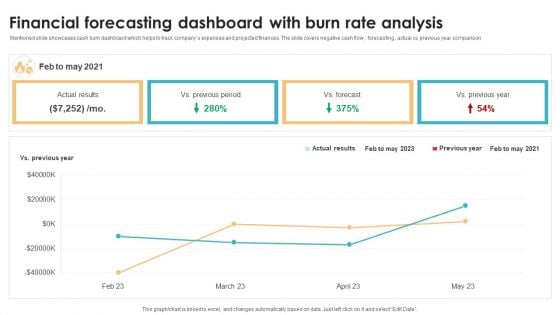
Financial Forecasting Dashboard With Burn Rate Analysis Brochure PDF
Mentioned slide showcases cash burn dashboard which helps to track companys expenses and projected finances. The slide covers negative cash flow , forecasting , actual vs previous year comparison Showcasing this set of slides titled Financial Forecasting Dashboard With Burn Rate Analysis Brochure PDF. The topics addressed in these templates are Previous Year, Analysis, Forecast. All the content presented in this PPT design is completely editable. Download it and make adjustments in color, background, font etc. as per your unique business setting.
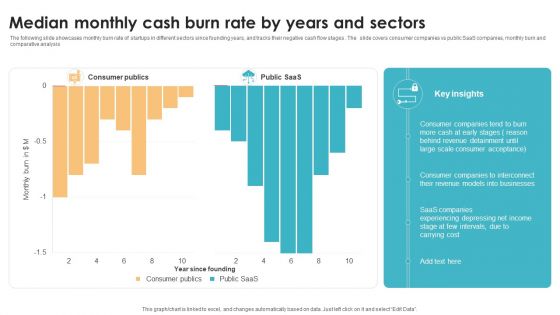
Median Monthly Cash Burn Rate By Years And Sectors Mockup PDF
The following slide showcases monthly burn rate of startups in different sectors since founding years, and tracks their negative cash flow stages . The slide covers consumer companies vs public SaaS companies, monthly burn and comparative analysis Pitch your topic with ease and precision using this Median Monthly Cash Burn Rate By Years And Sectors Mockup PDF. This layout presents information on Sectors, Key Insights, Consumer Acceptance. It is also available for immediate download and adjustment. So, changes can be made in the color, design, graphics or any other component to create a unique layout.
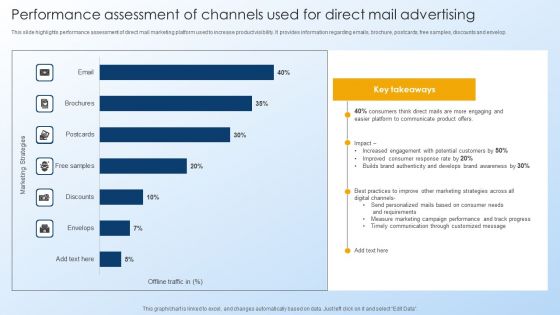
Performance Assessment Of Channels Used For Direct Mail Advertising Designs PDF
This slide highlights performance assessment of direct mail marketing platform used to increase product visibility. It provides information regarding emails, brochure, postcards, free samples, discounts and envelop. Showcasing this set of slides titled Performance Assessment Of Channels Used For Direct Mail Advertising Designs PDF. The topics addressed in these templates are Consumers, Communicate Product, Increased Engagement. All the content presented in this PPT design is completely editable. Download it and make adjustments in color, background, font etc. as per your unique business setting.
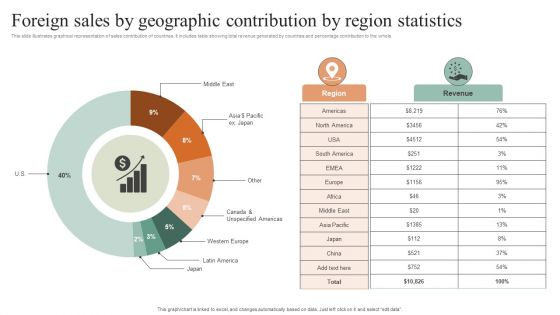
Foreign Sales By Geographic Contribution By Region Statistics Information PDF
This slide illustrates graphical representation of sales contribution of countries. It includes table showing total revenue generated by countries and percentage contribution to the whole. Showcasing this set of slides titled Foreign Sales By Geographic Contribution By Region Statistics Information PDF. The topics addressed in these templates are Region Statistics, Geographic Contribution, Foreign Sales. All the content presented in this PPT design is completely editable. Download it and make adjustments in color, background, font etc. as per your unique business setting.
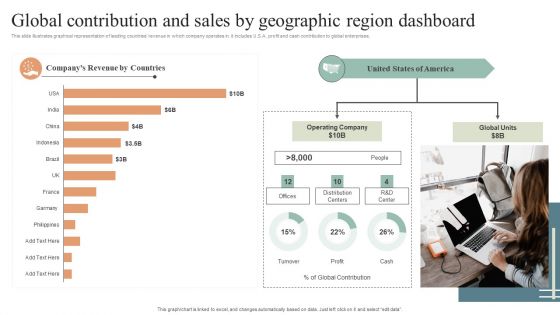
Global Contribution And Sales By Geographic Region Dashboard Diagrams PDF
This slide illustrates graphical representation of leading countries revenue in which company operates in. it includes U.S.A. profit and cash contribution to global enterprises. Pitch your topic with ease and precision using this Global Contribution And Sales By Geographic Region Dashboard Diagrams PDF. This layout presents information on Global Contribution, Sales By Geographic, Region Dashboard. It is also available for immediate download and adjustment. So, changes can be made in the color, design, graphics or any other component to create a unique layout.
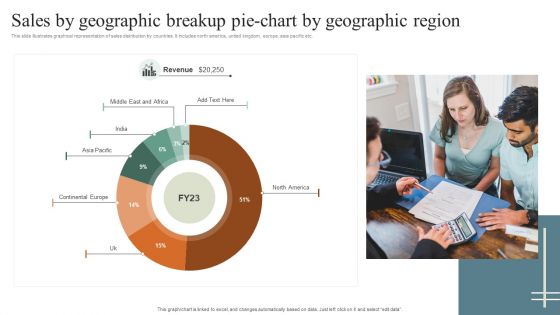
Sales By Geographic Breakup Pie Chart By Geographic Region Rules PDF
This slide illustrates graphical representation of sales distribution by countries. It includes north america, united kingdom, europe, asia pacific etc. Pitch your topic with ease and precision using this Sales By Geographic Breakup Pie Chart By Geographic Region Rules PDF. This layout presents information on Sales By Geographic, Geographic Region. It is also available for immediate download and adjustment. So, changes can be made in the color, design, graphics or any other component to create a unique layout.
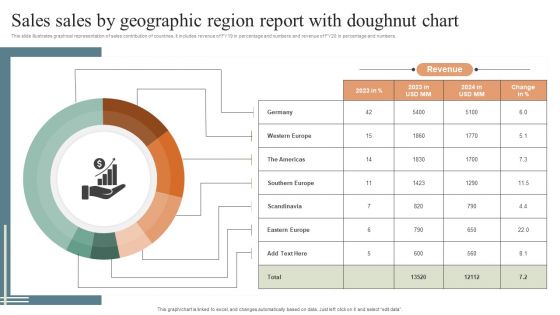
Sales Sales By Geographic Region Report With Doughnut Chart Themes PDF
This slide illustrates graphical representation of sales contribution of countries. It includes revenue of FY19 in percentage and numbers and revenue of FY20 in percentage and numbers. Showcasing this set of slides titled Sales Sales By Geographic Region Report With Doughnut Chart Themes PDF. The topics addressed in these templates are Revenue, Doughnut Chart, Geographic Region Report. All the content presented in this PPT design is completely editable. Download it and make adjustments in color, background, font etc. as per your unique business setting.
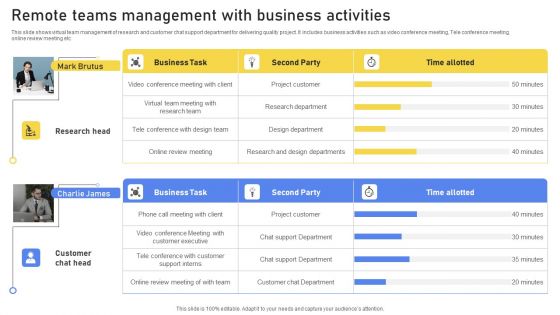
Remote Teams Management With Business Activities Graphics PDF
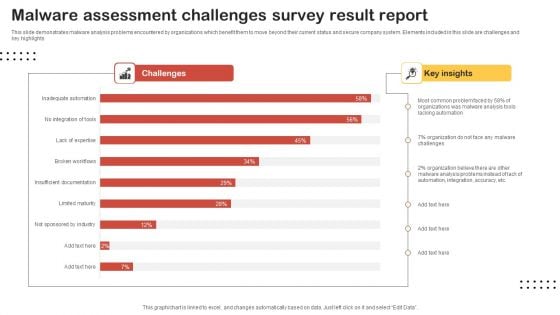
Malware Assessment Challenges Survey Result Report Slides PDF
This slide demonstrates malware analysis problems encountered by organizations which benefit them to move beyond their current status and secure company system. Elements included in this slide are challenges and key highlights. Showcasing this set of slides titled Malware Assessment Challenges Survey Result Report Slides PDF. The topics addressed in these templates are Most Common Problem, Organization, Malware Challenges. All the content presented in this PPT design is completely editable. Download it and make adjustments in color, background, font etc. as per your unique business setting.
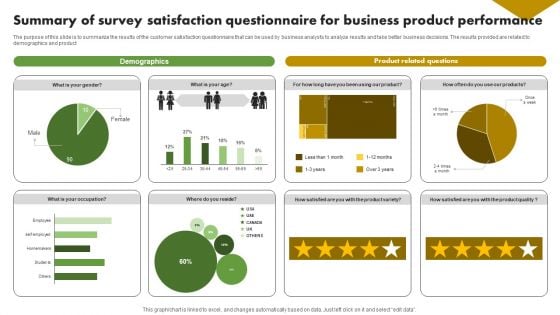
Summary Of Survey Satisfaction Questionnaire For Business Product Performance Survey SS
Pitch your topic with ease and precision using this Summary Of Survey Satisfaction Questionnaire For Business Product Performance Survey SS. This layout presents information on Product Related, Performance, Demographics . It is also available for immediate download and adjustment. So, changes can be made in the color, design, graphics or any other component to create a unique layout.


 Continue with Email

 Home
Home


