Coordination
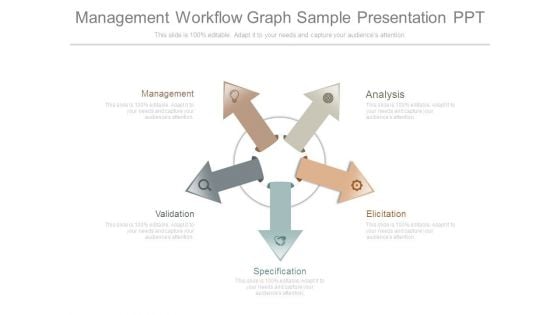
Management Workflow Graph Sample Presentation Ppt
This is a management workflow graph sample presentation ppt. This is a five stage process. The stages in this process are management, analysis, validation, specification, elicitation.
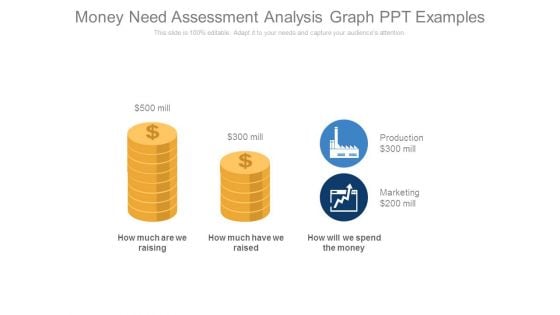
Money Need Assessment Analysis Graph Ppt Examples
This is a money need assessment analysis graph ppt examples. This is a two stage process. The stages in this process are production, marketing, need, money, finance.
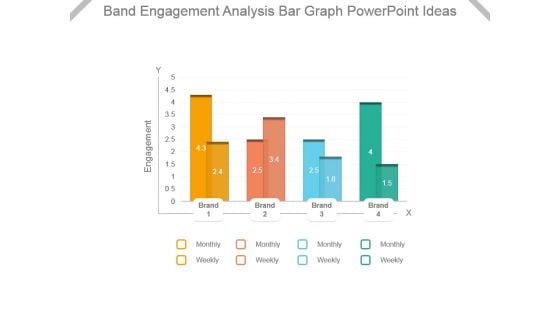
Band Engagement Analysis Bar Graph Powerpoint Ideas
This is a band engagement analysis bar graph powerpoint ideas. This is a four stage process. The stages in this process are engagement, brand, monthly, weekly.
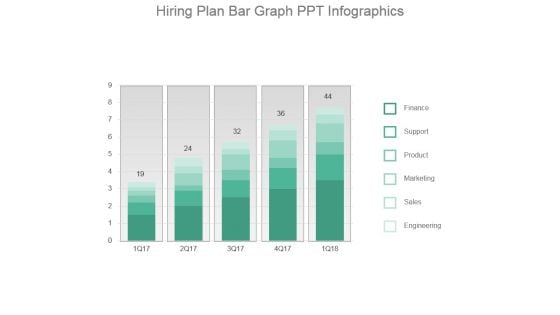
Hiring Plan Bar Graph Ppt Infographics
This is a hiring plan bar graph ppt infographics. This is a five stage process. The stages in this process are finance, support, product, marketing, sales, engineering.
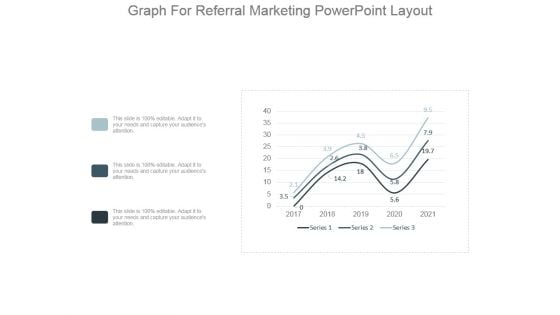
Graph For Referral Marketing Powerpoint Layout
This is a graph for referral marketing powerpoint layout. This is a three stage process. The stages in this process are series.
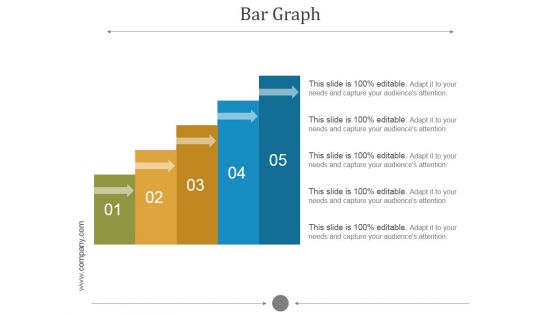
Bar Graph Ppt PowerPoint Presentation Slide Download
This is a bar graph ppt powerpoint presentation slide download. This is a five stage process. The stages in this process are arrow, business, bargraph, growth, success.
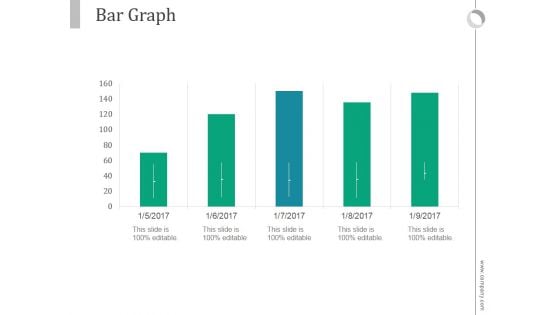
Bar Graph Ppt PowerPoint Presentation Model
This is a bar graph ppt powerpoint presentation model. This is a five stage process. The stages in this process are business, marketing, bar slides, management, finance.
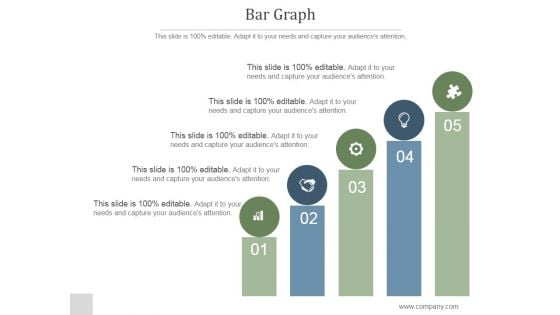
Bar Graph Ppt PowerPoint Presentation Topics
This is a bar graph ppt powerpoint presentation topics. This is a five stage process. The stages in this process are business, strategy, icons, management.
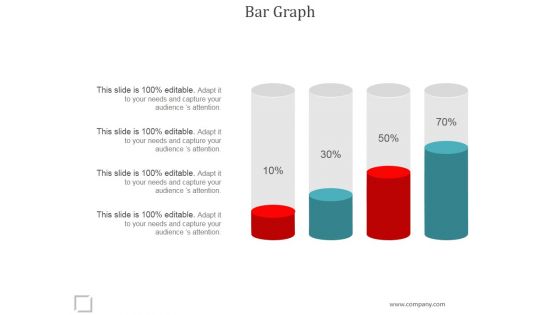
Bar Graph Ppt PowerPoint Presentation Backgrounds
This is a bar graph ppt powerpoint presentation backgrounds. This is a four stage process. The stages in this process are business, marketing, finance, growth, management.
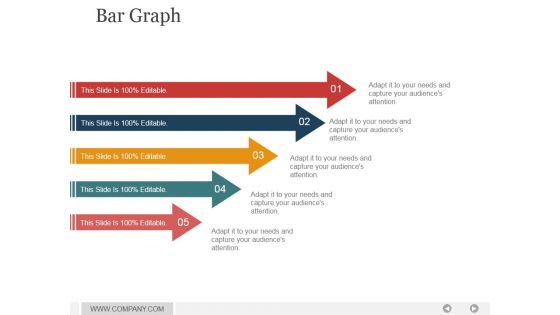
Bar Graph Ppt PowerPoint Presentation Shapes
This is a bar graph ppt powerpoint presentation shapes. This is a five stage process. The stages in this process are arrows, marketing, strategy, business, success.
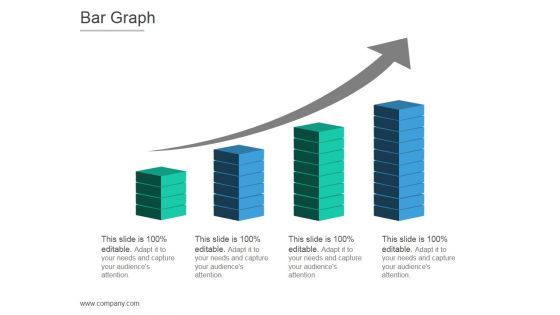
Bar Graph Ppt PowerPoint Presentation Templates
This is a bar graph ppt powerpoint presentation templates. This is a four stage process. The stages in this process are arrows, business, marketing, strategy, growth, graphic.
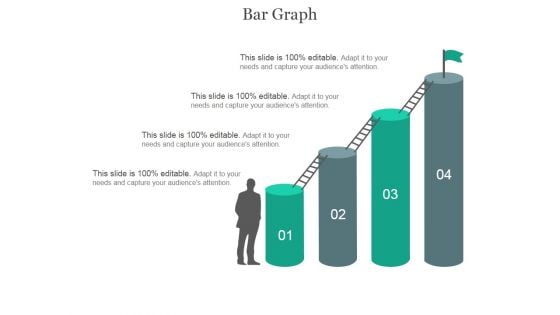
Bar Graph Ppt PowerPoint Presentation Clipart
This is a bar graph ppt powerpoint presentation clipart. This is a four stage process. The stages in this process are silhouettes, business, success, growth, stair.
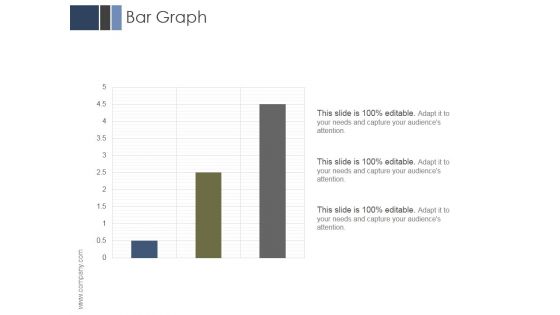
Bar Graph Ppt PowerPoint Presentation Layout
This is a bar graph ppt powerpoint presentation layout. This is a three stage process. The stages in this process are business, marketing, management, analysis, growth.
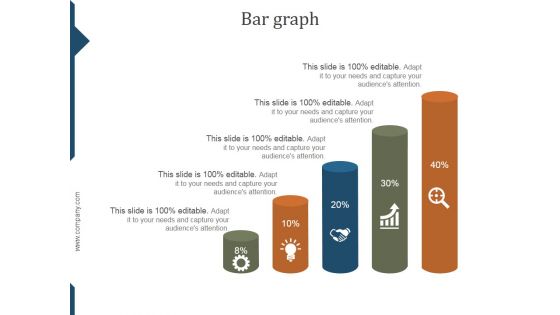
Bar Graph Ppt PowerPoint Presentation Deck
This is a bar graph ppt powerpoint presentation deck. This is a five stage process. The stages in this process are percentage, process, strategy, success, marketing.
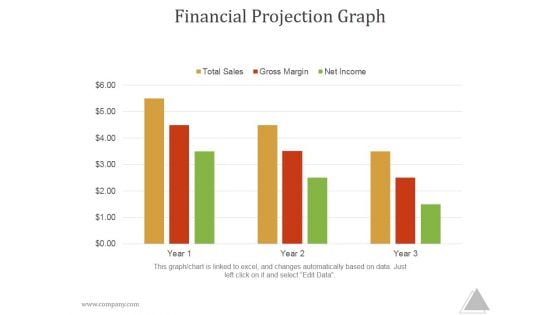
Financial Projection Graph Ppt PowerPoint Presentation Introduction
This is a financial projection graph ppt powerpoint presentation introduction. This is a five stage process. The stages in this process are jan, feb ,mar, apr, may, jun.

Bar Graph Ppt PowerPoint Presentation Images
This is a bar graph ppt powerpoint presentation images. This is a four stage process. The stages in this process are business, strategy, marketing, analysis, success, growth.
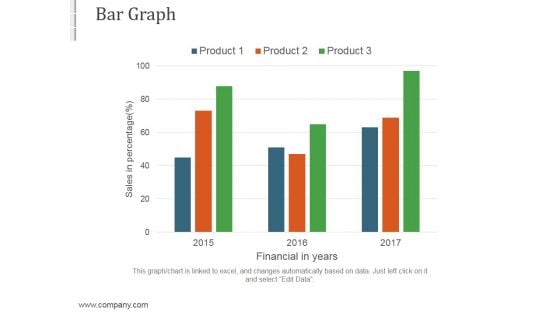
Bar Graph Ppt PowerPoint Presentation Themes
This is a bar graph ppt powerpoint presentation themes. This is a three stage process. The stages in this process are business, marketing, strategy, success, management.
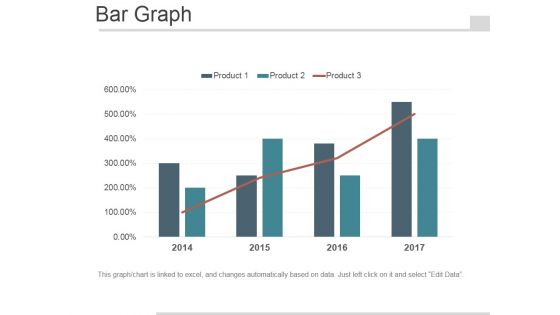
Bar Graph Ppt PowerPoint Presentation Design Ideas
This is a bar graph ppt powerpoint presentation design ideas. This is a four stage process. The stages in this process are business, management, marketing, finance, year.
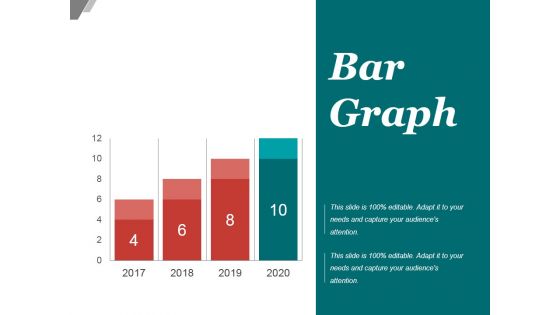
Bar Graph Ppt PowerPoint Presentation Design Templates
This is a bar graph ppt powerpoint presentation design templates. This is a four stage process. The stages in this process are business, marketing, success, growth, years.
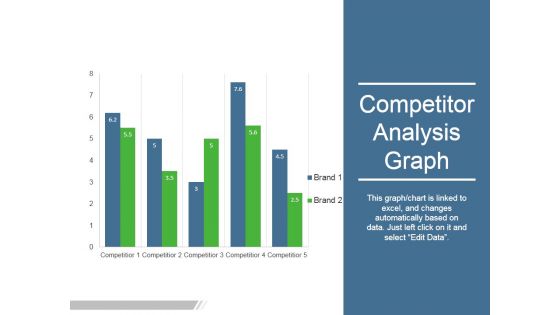
Competitor Analysis Graph Ppt PowerPoint Presentation Graphics
This is a competitor analysis graph ppt powerpoint presentation graphics. This is a five stage process. The stages in this process are competitor, business, marketing.
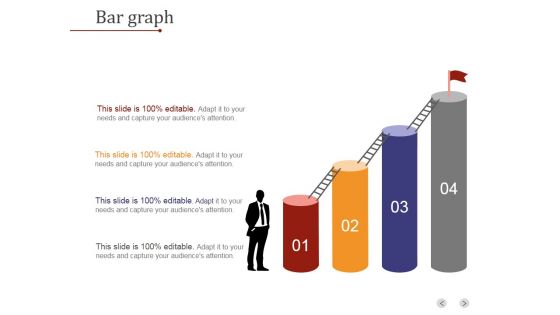
Bar Graph Ppt PowerPoint Presentation Tips
This is a bar graph ppt powerpoint presentation tips. This is a four stage process. The stages in this process are business, strategy, analysis, success, growth strategy, stair.
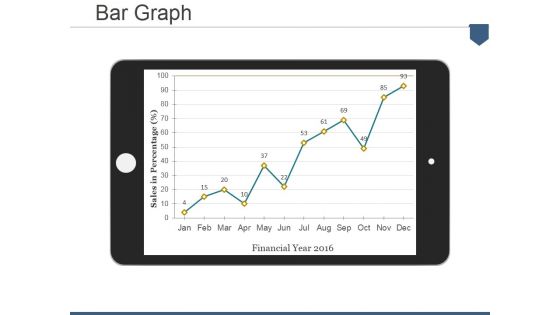
Bar Graph Ppt PowerPoint Presentation Pictures Display
This is a bar graph ppt powerpoint presentation pictures display. This is a one stage process. The stages in this process are sales in percentage, financial year.
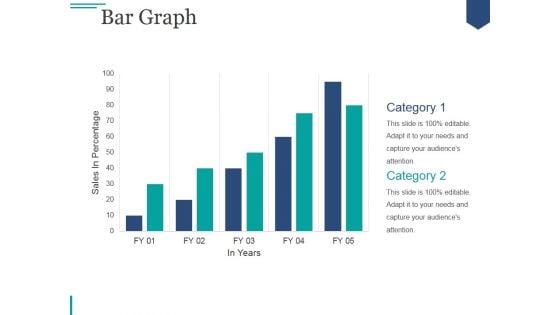
Bar Graph Ppt PowerPoint Presentation Slides Format
This is a bar graph ppt powerpoint presentation slides format. This is a two stage process. The stages in this process are business, marketing, growth, planning, sales plan.
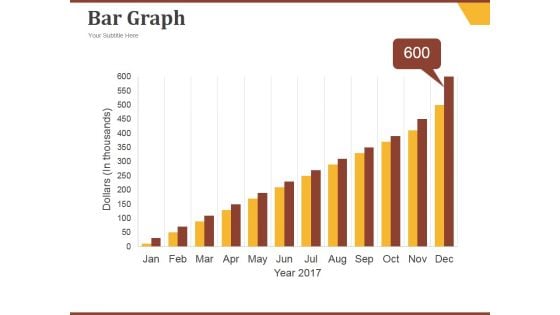
Bar Graph Ppt PowerPoint Presentation Ideas Diagrams
This is a bar graph ppt powerpoint presentation ideas diagrams. This is a twelve stage process. The stages in this process are jan, feb, mar, apr, may, growth.
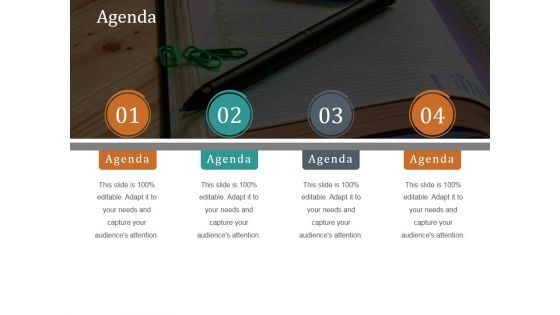
Agenda Ppt PowerPoint Presentation Diagram Graph Charts
This is a agenda ppt powerpoint presentation diagram graph charts. This is a four stage process. The stages in this process are agenda, planning, management, business, list.
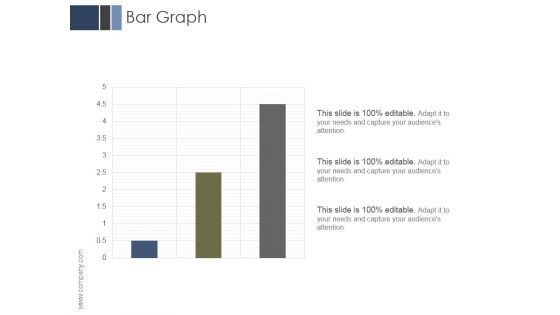
Bar Graph Ppt PowerPoint Presentation Outline Slides
This is a bar graph ppt powerpoint presentation outline slides. This is a three stage process. The stages in this process are business, marketing, management, analysis, growth.
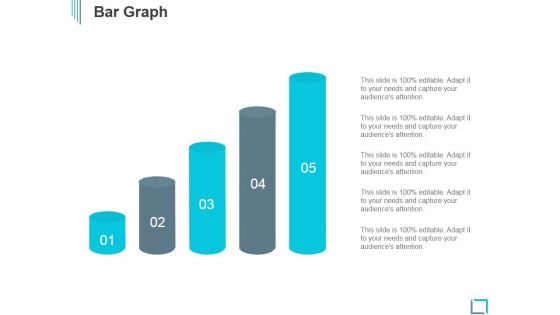
Bar Graph Ppt PowerPoint Presentation Ideas Professional
This is a bar graph ppt powerpoint presentation ideas professional. This is a five stage process. The stages in this process are business, marketing, growth, planning, process.
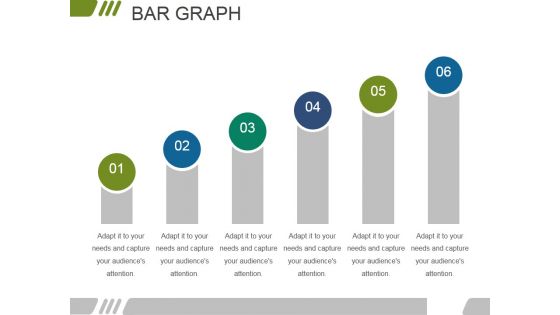
Bar Graph Ppt PowerPoint Presentation Gallery Maker
This is a bar graph ppt powerpoint presentation gallery maker. This is a six stage process. The stages in this process are business, marketing, growth, planning, management.
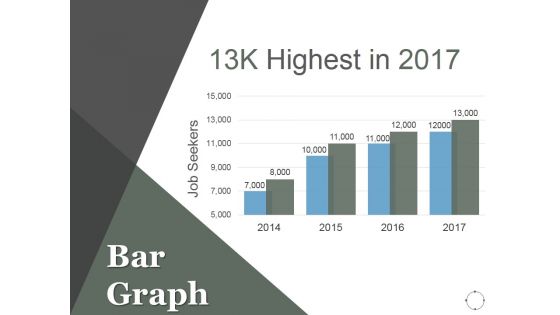
Bar Graph Ppt PowerPoint Presentation Model Images
This is a bar graph ppt powerpoint presentation model images. This is a four stage process. The stages in this process are business, marketing, finance, growth, management.
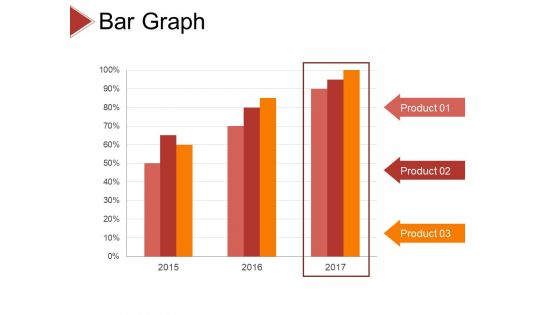
Bar Graph Ppt PowerPoint Presentation Layouts Gridlines
This is a bar graph ppt powerpoint presentation layouts gridlines. this is a three stage process. The stages in this process are product, percentage, business, marketing, management.
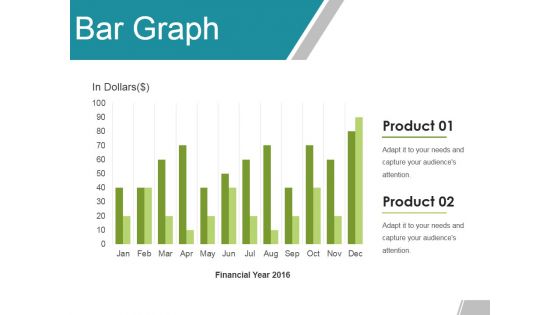
Bar Graph Ppt Powerpoint Presentation Model Topics
This is a bar graph ppt powerpoint presentation model topics. This is a twelve stage process. The stages in this process are jan, feb, mar, mar, apr.

Bar Graph Ppt PowerPoint Presentation Gallery Inspiration
This is a bar graph ppt powerpoint presentation gallery inspiration. This is a three stage process. The stages in this process are product, sales in percentage, finance, success.
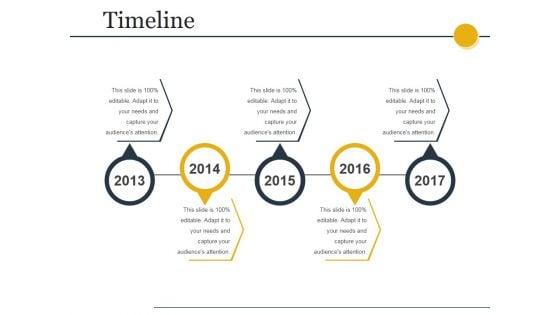
Timeline Ppt PowerPoint Presentation Diagram Graph Charts
This is a timeline ppt powerpoint presentation diagram graph charts. This is a five stage process. The stages in this process are timeline, years, business, marketing, planning.
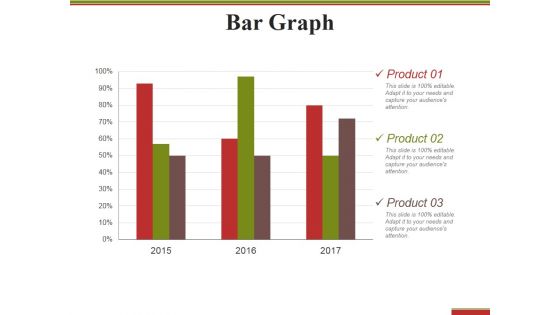
Bar Graph Ppt PowerPoint Presentation Outline Structure
This is a bar graph ppt powerpoint presentation outline structure. This is a three stage process. The stages in this process are product, percentage, finance, business.
Bar Graph Ppt PowerPoint Presentation Icon
This is a bar graph ppt powerpoint presentation icon. This is a three stage process. The stages in this process are business, finance, marketing, strategy, analysis.
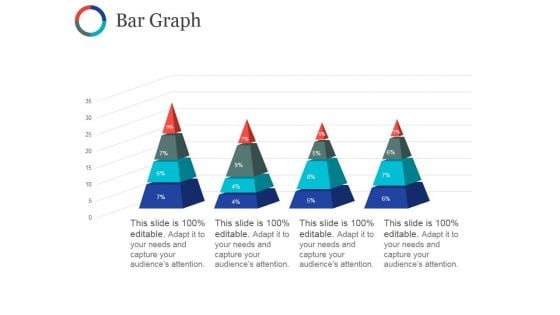
Bar Graph Ppt PowerPoint Presentation Inspiration Sample
This is a bar graph ppt powerpoint presentation inspiration sample. This is a four stage process. The stages in this process are business, pyramid, marketing, strategy, planning.
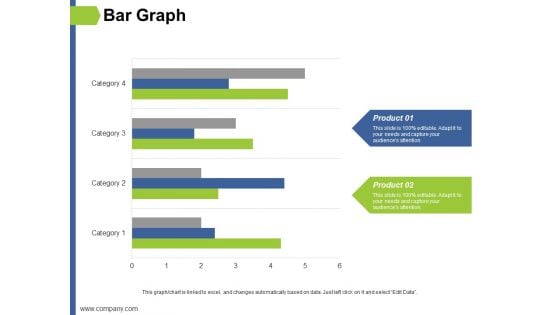
Bar Graph Ppt PowerPoint Presentation Show Slides
This is a bar graph ppt powerpoint presentation show slides. This is a two stage process. The stages in this process are finance, marketing, management, investment, analysis.
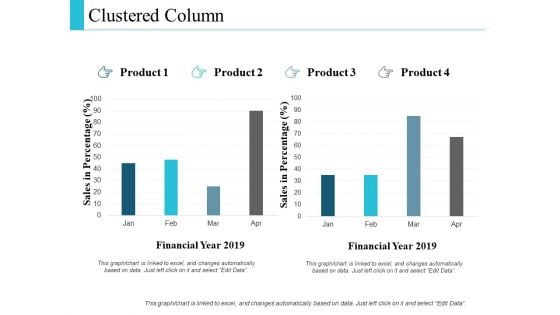
Clustered Column Graph Ppt PowerPoint Presentation Layouts
This is a clustered column graph ppt powerpoint presentation layouts. This is a two stage process. The stages in this process are finance, marketing, management, investment, analysis.
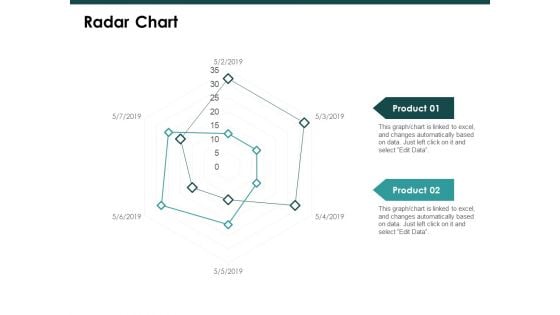
Radar Chart Graph Ppt PowerPoint Presentation Slide
This is a radar chart graph ppt powerpoint presentation slide. This is a two stage process. The stages in this process are finance, marketing, management, investment, analysis.
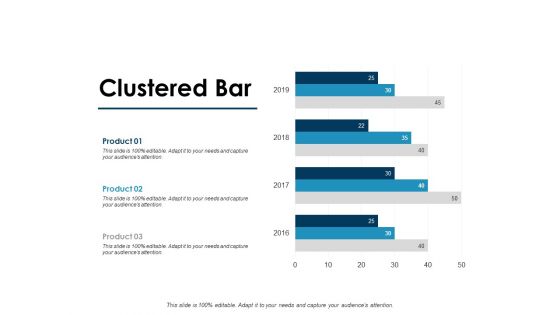
Clustered Bar Graph Ppt PowerPoint Presentation Templates
This is a clustered bar graph ppt powerpoint presentation templates. This is a three stage process. The stages in this process are finance, marketing, management, investment, analysis.

Financial Graph Ppt PowerPoint Presentation Visuals
This is a financial graph ppt powerpoint presentation visuals. This is a three stage process. The stages in this process are finance, marketing, analysis, investment, million.
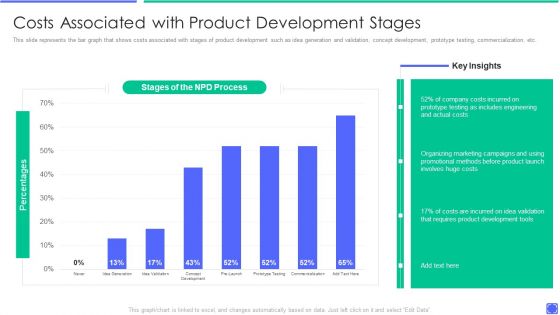
Best Techniques To Enhance New Product Management Efficiency Costs Associated With Product Formats PDF
This slide represents the bar graph that shows costs associated with stages of product development such as idea generation and validation, concept development, prototype testing, commercialization, etc. Deliver an awe inspiring pitch with this creative best techniques to enhance new product management efficiency comparing product metrics themes pdf bundle. Topics like costs associated with product development stages can be discussed with this completely editable template. It is available for immediate download depending on the needs and requirements of the user.

RPA IT Uipath Robotic Process Automation Tool Ppt Layouts Microsoft PDF
This slide represents the UiPath tool that is used for the RPA. It also describes its pros, cons, and feature, namely productivity, usability, extensibility, debugging, and collaboration. Presenting rpa it uipath robotic process automation tool ppt layouts microsoft pdf to provide visual cues and insights. Share and navigate important information on seven stages that need your due attention. This template can be used to pitch topics like productivity, usability, extensibility, debugging, collaboration. In addtion, this PPT design contains high resolution images, graphics, etc, that are easily editable and available for immediate download.
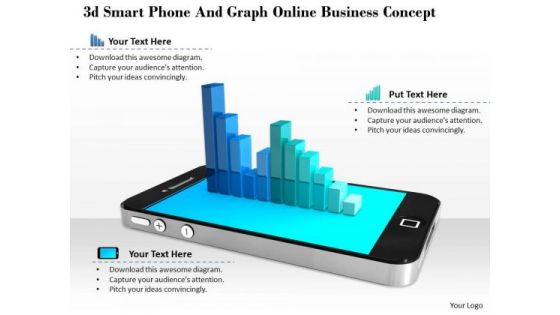
Stock Photo Smartphone Business Graph PowerPoint Slide
This image slide displays smartphone with bar graph. This image slide has been crafted with graphic of smart phone with bar graph on screen on grey shaded background. Use this image slide to express views on technology and business management. Make wonderful presentations using this image slide.
Manager Checking Incident Management Graph Clipart PDF
Persuade your audience using this manager checking incident management graph clipart pdf. This PPT design covers three stages, thus making it a great tool to use. It also caters to a variety of topics including manager checking incident management graph. Download this PPT design now to present a convincing pitch that not only emphasizes the topic but also showcases your presentation skills.
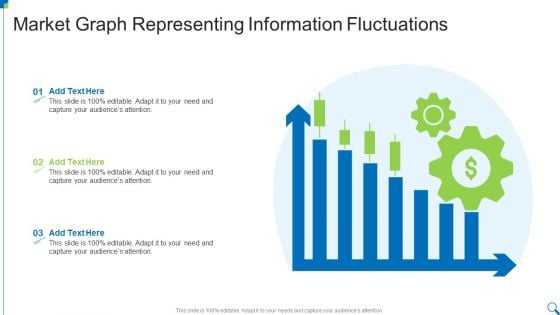
Market Graph Representing Information Fluctuations Diagrams PDF
Presenting Market Graph Representing Information Fluctuations Diagrams PDF to dispense important information. This template comprises three stages. It also presents valuable insights into the topics including Market Graph, Representing, Information Fluctuations This is a completely customizable PowerPoint theme that can be put to use immediately. So, download it and address the topic impactfully.
Investment Portfolio Advantages Graph Icon Rules PDF
Presenting Investment Portfolio Advantages Graph Icon Rules PDF to dispense important information. This template comprises three stages. It also presents valuable insights into the topics including Investment Portfolio, Advantages Graph Icon. This is a completely customizable PowerPoint theme that can be put to use immediately. So, download it and address the topic impactfully.
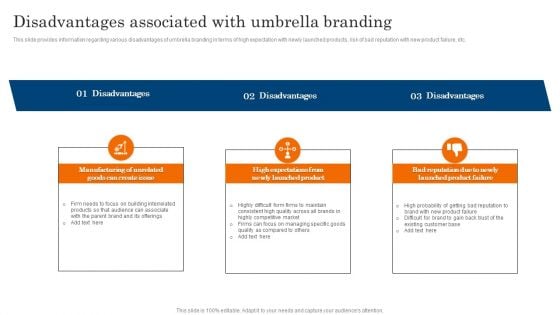
Disadvantages Associated With Umbrella Branding Ppt PowerPoint Presentation File Background Images PDF
This slide provides information regarding various disadvantages of umbrella branding in terms of high expectation with newly launched products, risk of bad reputation with new product failure, etc. If you are looking for a format to display your unique thoughts, then the professionally designed Disadvantages Associated With Umbrella Branding Ppt PowerPoint Presentation File Background Images PDF is the one for you. You can use it as a Google Slides template or a PowerPoint template. Incorporate impressive visuals, symbols, images, and other charts. Modify or reorganize the text boxes as you desire. Experiment with shade schemes and font pairings. Alter, share or cooperate with other people on your work. Download Disadvantages Associated With Umbrella Branding Ppt PowerPoint Presentation File Background Images PDF and find out how to give a successful presentation. Present a perfect display to your team and make your presentation unforgettable.
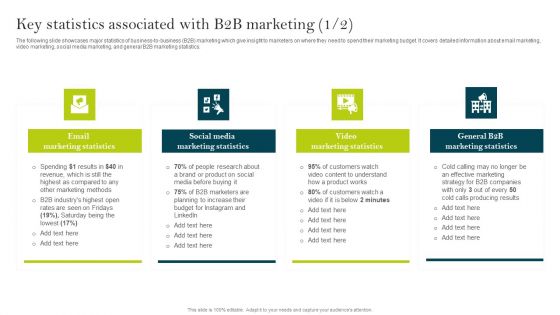
Key Statistics Associated With B2B Marketing Ppt PowerPoint Presentation File Background Images PDF
The following slide showcases major statistics of business-to-business B2B marketing which give insight to marketers on where they need to spend their marketing budget. It covers detailed information about email marketing, video marketing, social media marketing, and general B2B marketing statistics. If you are looking for a format to display your unique thoughts, then the professionally designed Key Statistics Associated With B2B Marketing Ppt PowerPoint Presentation File Background Images PDF is the one for you. You can use it as a Google Slides template or a PowerPoint template. Incorporate impressive visuals, symbols, images, and other charts. Modify or reorganize the text boxes as you desire. Experiment with shade schemes and font pairings. Alter, share or cooperate with other people on your work. Download Key Statistics Associated With B2B Marketing Ppt PowerPoint Presentation File Background Images PDF and find out how to give a successful presentation. Present a perfect display to your team and make your presentation unforgettable.
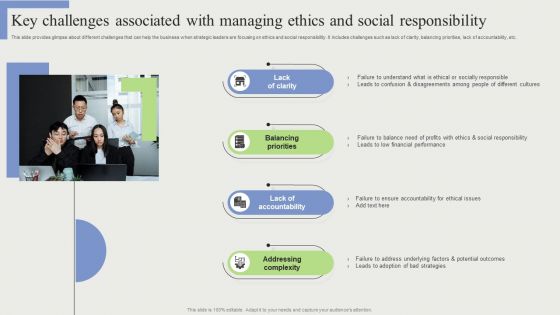
Key Challenges Associated With Managing Ethics And Social Responsibility Slides PDF
This slide provides glimpse about different challenges that can help the business when strategic leaders are focusing on ethics and social responsibility. It includes challenges such as lack of clarity, balancing priorities, lack of accountability, etc. If you are looking for a format to display your unique thoughts, then the professionally designed Key Challenges Associated With Managing Ethics And Social Responsibility Slides PDF is the one for you. You can use it as a Google Slides template or a PowerPoint template. Incorporate impressive visuals, symbols, images, and other charts. Modify or reorganize the text boxes as you desire. Experiment with shade schemes and font pairings. Alter, share or cooperate with other people on your work. Download Key Challenges Associated With Managing Ethics And Social Responsibility Slides PDF and find out how to give a successful presentation. Present a perfect display to your team and make your presentation unforgettable.

Core Team Financial Management Software Capital Raising Deck Formats Pdf
This slide caters to details about key members associated with Companys founding team along with their past work experiences. Do you have to make sure that everyone on your team knows about any specific topic I yes, then you should give Core Team Financial Management Software Capital Raising Deck Formats Pdf a try. Our experts have put a lot of knowledge and effort into creating this impeccable Core Team Financial Management Software Capital Raising Deck Formats Pdf. You can use this template for your upcoming presentations, as the slides are perfect to represent even the tiniest detail. You can download these templates from the Slidegeeks website and these are easy to edit. So grab these today. This slide caters to details about key members associated with Companys founding team along with their past work experiences.
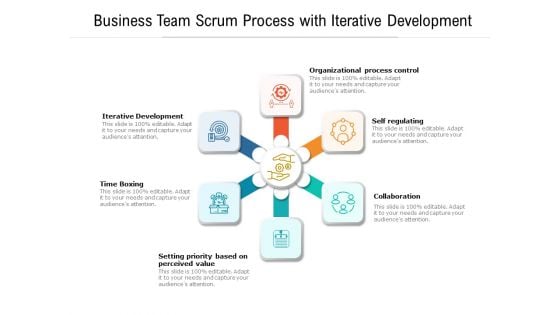
Business Team Scrum Process With Iterative Development Ppt PowerPoint Presentation Gallery Template PDF
Persuade your audience using this business team scrum process with iterative development ppt powerpoint presentation gallery template pdf. This PPT design covers six stages, thus making it a great tool to use. It also caters to a variety of topics including organizational process control, self regulating, collaboration, iterative development, time boxing, setting priority based on perceived value. Download this PPT design now to present a convincing pitch that not only emphasizes the topic but also showcases your presentation skills.
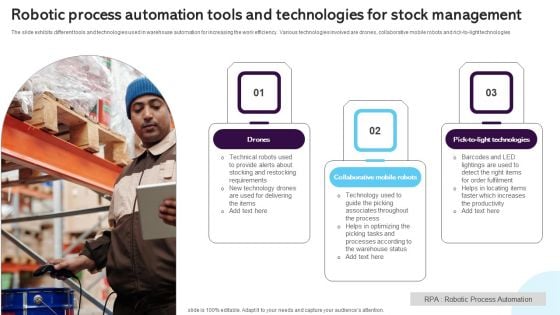
Robotic Process Automation Tools And Technologies For Stock Management Infographics PDF
The slide exhibits different tools and technologies used in warehouse automation for increasing the work efficiency. Various technologies involved are drones, collaborative mobile robots and rick-to-light technologies. Showcasing this set of slides titled Robotic Process Automation Tools And Technologies For Stock Management Infographics PDF. The topics addressed in these templates are Drones, Collaborative Mobile Robots, Pick Light Technologies. All the content presented in this PPT design is completely editable. Download it and make adjustments in color, background, font etc. as per your unique business setting.
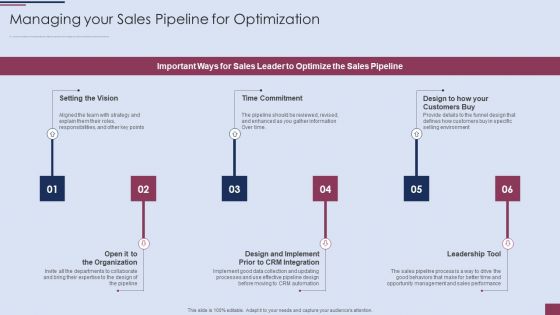
Sales Process Management To Boost Business Effectiveness Managing Your Sales Pipeline For Optimization Information PDF
This is a Sales Process Management To Boost Business Effectiveness Managing Your Sales Pipeline For Optimization Information PDF template with various stages. Focus and dispense information on six stages using this creative set, that comes with editable features. It contains large content boxes to add your information on topics like Time Commitment, Design And Implement, Departments To Collaborate. You can also showcase facts, figures, and other relevant content using this PPT layout. Grab it now.
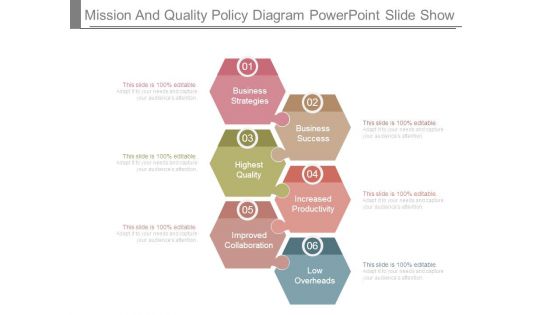
Mission And Quality Policy Diagram Powerpoint Slide Show
This is a mission and quality policy diagram powerpoint slide show. This is a six stage process. The stages in this process are business strategies, business success, highest quality, increased productivity, improved collaboration, low overheads.

Graph Business PowerPoint Background And Template 1210
Microsoft PowerPoint Template and Background with a 3d rendering of a gold bars histogram Holster your thoughts in our Graph Business PowerPoint Background And Template 1210. You'll be faster on the draw.
Business Graph Adjust PowerPoint Icon C
Microsoft powerpoint template and Background with a multi colored bar chart inside the center opening of a large gear Our Business Graph Adjust PowerPoint Icon C ensure an admirable address. The audience won't be able to fault your ideas.
Business Graph Adjust PowerPoint Icon Cc
Microsoft powerpoint template and Background with a multi colored bar chart inside the center opening of a large gear Keep them driven with our Business Graph Adjust PowerPoint Icon Cc. You will come out on top.
Business Graph Adjust PowerPoint Icon F
Microsoft powerpoint template and Background with a multi colored bar chart inside the center opening of a large gear Collect all the evidence on our Business Graph Adjust PowerPoint Icon F. Connect the clues and come to conclusions with ease.
Business Graph Adjust PowerPoint Icon R
Microsoft powerpoint template and Background with a multi colored bar chart inside the center opening of a large gear Our Business Graph Adjust PowerPoint Icon R are good for any contest. They enjoy every challenge put to them.


 Continue with Email

 Home
Home


