Coordination
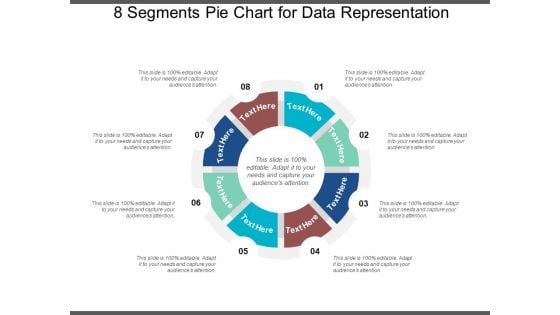
8 Segments Pie Chart For Data Representation Ppt PowerPoint Presentation Infographics Design Templates
This is a 8 segments pie chart for data representation ppt powerpoint presentation infographics design templates. This is a eight stage process. The stages in this process are 6 piece pie chart, 6 segment pie chart, 6 parts pie chart.
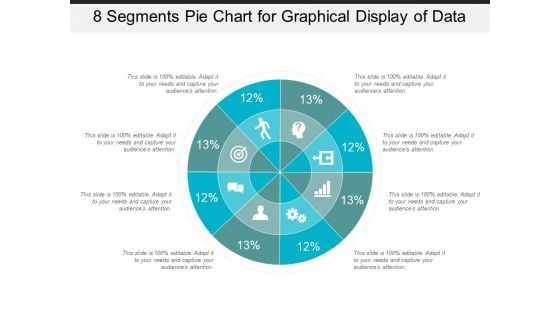
8 Segments Pie Chart For Graphical Display Of Data Ppt PowerPoint Presentation Infographic Template Templates
This is a 8 segments pie chart for graphical display of data ppt powerpoint presentation infographic template templates. This is a eight stage process. The stages in this process are 6 piece pie chart, 6 segment pie chart, 6 parts pie chart.
Eight Sections Pie Chart For Percentage Data Analysis Ppt PowerPoint Presentation Styles Icons
This is a eight sections pie chart for percentage data analysis ppt powerpoint presentation styles icons. This is a eight stage process. The stages in this process are 6 piece pie chart, 6 segment pie chart, 6 parts pie chart.
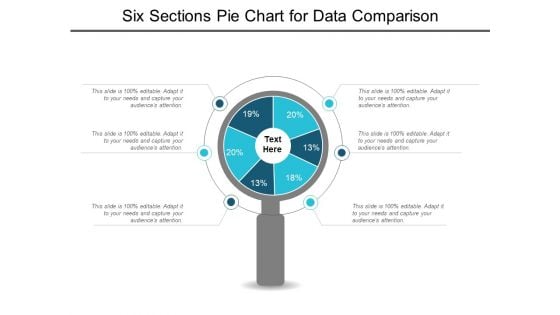
Six Sections Pie Chart For Data Comparison Ppt PowerPoint Presentation Styles Graphics Example
This is a six sections pie chart for data comparison ppt powerpoint presentation styles graphics example. This is a six stage process. The stages in this process are 6 piece pie chart, 6 segment pie chart, 6 parts pie chart.
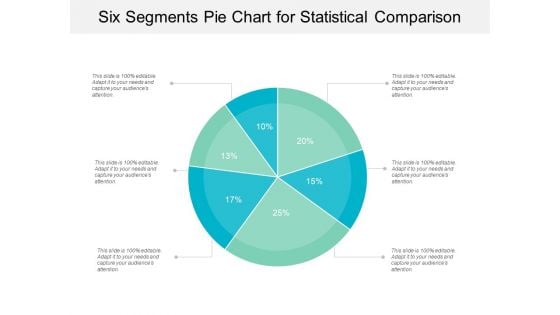
Six Segments Pie Chart For Statistical Comparison Ppt PowerPoint Presentation Gallery Background
This is a six segments pie chart for statistical comparison ppt powerpoint presentation gallery background. This is a six stage process. The stages in this process are 6 piece pie chart, 6 segment pie chart, 6 parts pie chart.
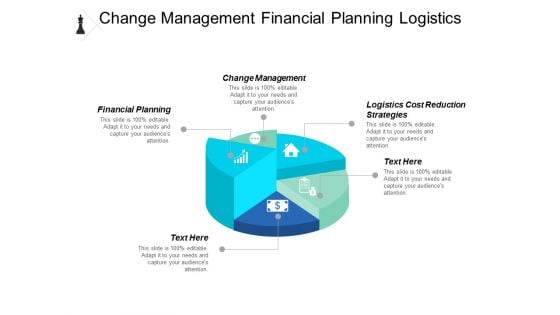
Change Management Financial Planning Logistics Cost Reduction Strategies Ppt PowerPoint Presentation Gallery Visuals
This is a change management financial planning logistics cost reduction strategies ppt powerpoint presentation gallery visuals. This is a five stage process. The stages in this process are change management, financial planning, logistics cost reduction strategies.
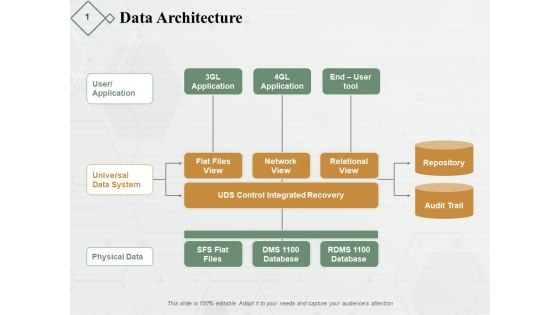
Data Architecture Ppt PowerPoint Presentation Layouts Shapes
This is a data architecture ppt powerpoint presentation layouts shapes. This is a three stage process. The stages in this process are network view, repository, audit trail, physical data, flat files view.
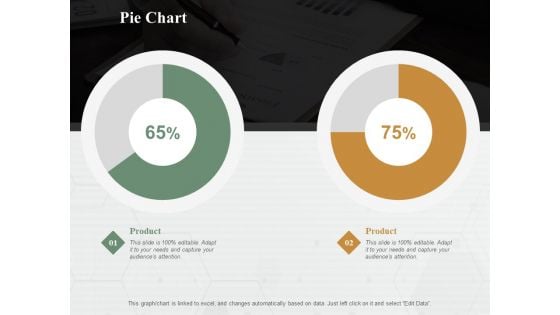
Pie Chart Finance Ppt PowerPoint Presentation Diagram Lists
This is a pie chart finance ppt powerpoint presentation diagram lists. This is a two stage process. The stages in this process are pie chart, finance, marketing, analysis, business.
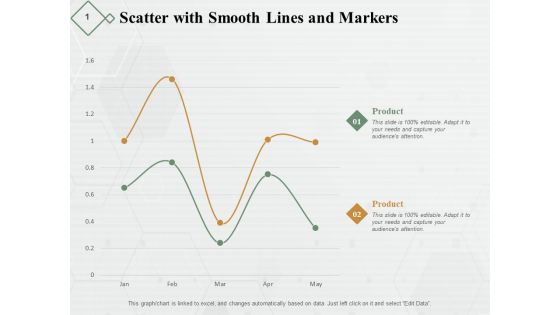
Scatter With Smooth Lines And Markers Ppt PowerPoint Presentation Diagram Lists
This is a scatter with smooth lines and markers ppt powerpoint presentation diagram lists. This is a two stage process. The stages in this process are finance, marketing, analysis, business, investment.
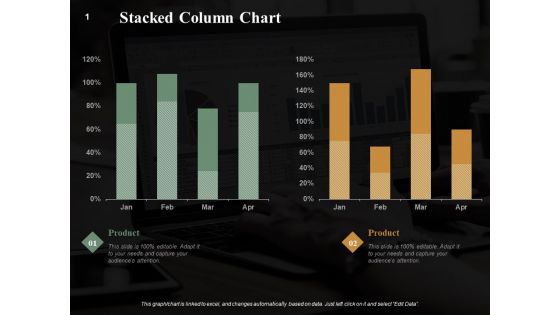
Stacked Column Chart Finance Ppt PowerPoint Presentation Summary Graphics Example
This is a stacked column chart finance ppt powerpoint presentation summary graphics example. This is a two stage process. The stages in this process are stacked column chart, marketing, analysis, business, investment.
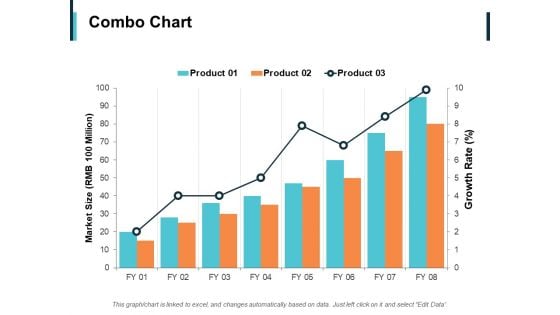
Combo Chart Finance Ppt PowerPoint Presentation Infographic Template Outline
This is a combo chart finance ppt powerpoint presentation infographic template outline. This is a three stage process. The stages in this process are combo chart, finance, analysis, business, investment.
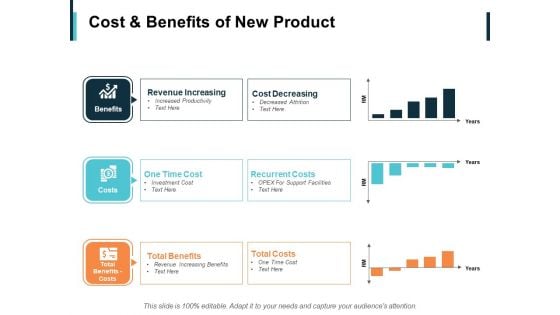
Cost And Benefits Of New Product Ppt PowerPoint Presentation Inspiration Diagrams
This is a cost and benefits of new product ppt powerpoint presentation inspiration diagrams. This is a three stage process. The stages in this process are recurrent costs, cost decreasing, revenue increasing, benefits, costs.
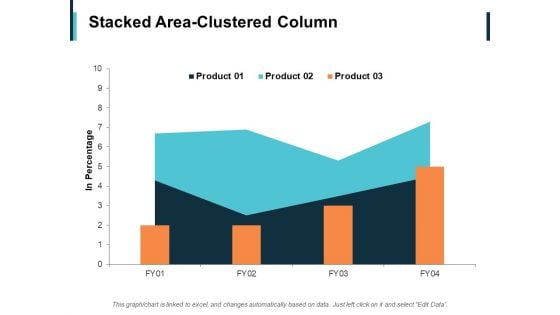
Stacked Area Clustered Column Ppt PowerPoint Presentation Inspiration
This is a stacked area clustered column ppt powerpoint presentation inspiration. This is a three stage process. The stages in this process are finance, marketing, analysis, business, investment.
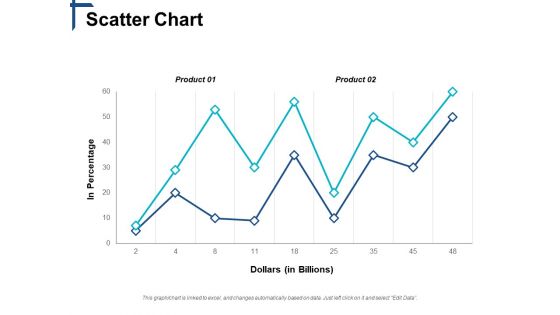
Scatter Chart Competitive Differentiation Ppt PowerPoint Presentation Show Slides
This is a scatter chart competitive differentiation ppt powerpoint presentation show slides. This is a two stage process. The stages in this process are business, management, marketing, strategy, sales.
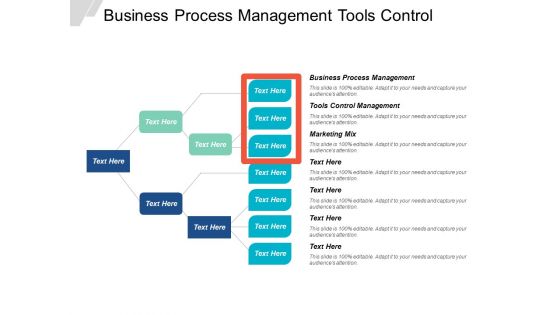
Business Process Management Tools Control Management Marketing Mix Ppt PowerPoint Presentation Gallery Deck
This is a business process management tools control management marketing mix ppt powerpoint presentation gallery deck. This is a seven stage process. The stages in this process are business process management, tools control management, marketing mix.
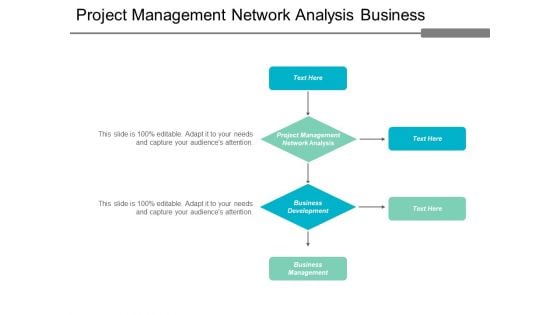
Project Management Network Analysis Business Development Business Management Ppt PowerPoint Presentation Gallery Visuals
This is a project management network analysis business development business management ppt powerpoint presentation gallery visuals. This is a two stage process. The stages in this process are project management network analysis, business development, business management.
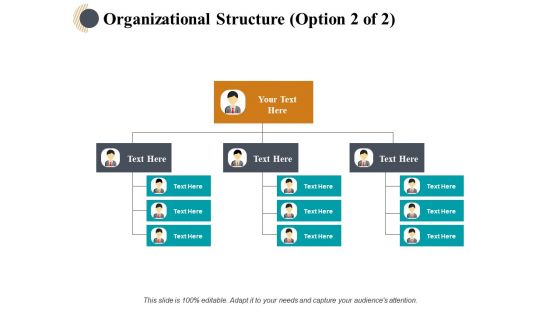
Organizational Structure Management Ppt PowerPoint Presentation Styles Design Templates
This is a organizational structure management ppt powerpoint presentation styles design templates. This is a three stage process. The stages in this process are business, planning, strategy, marketing, management.
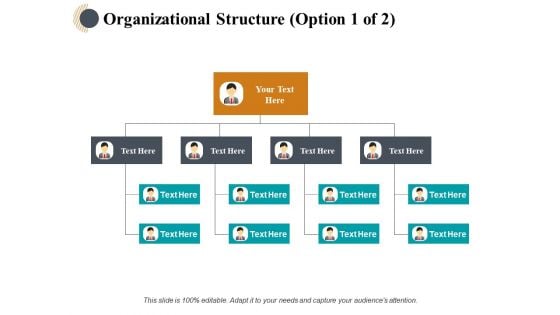
Organizational Structure Ppt PowerPoint Presentation Outline Layouts
This is a organizational structure ppt powerpoint presentation outline layouts. This is a three stage process. The stages in this process are business, planning, strategy, marketing, management.
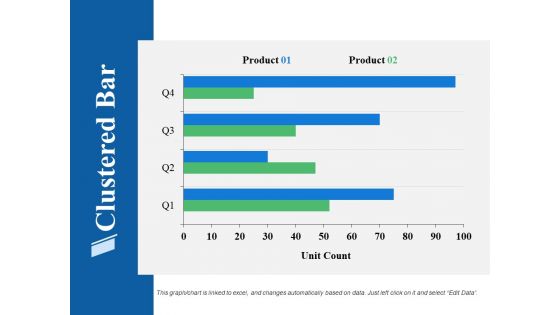
Clustered Bar Finance Ppt PowerPoint Presentation Show Background Image
This is a clustered bar finance ppt powerpoint presentation show background image. This is a two stage process. The stages in this process are finance, analysis, business, investment, marketing.
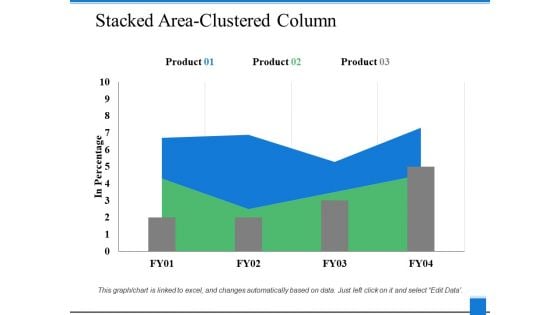
Stacked Area Clustered Column Finance Ppt PowerPoint Presentation Good
This is a stacked area clustered column finance ppt powerpoint presentation good. This is a three stage process. The stages in this process are finance, analysis, business, investment, marketing.
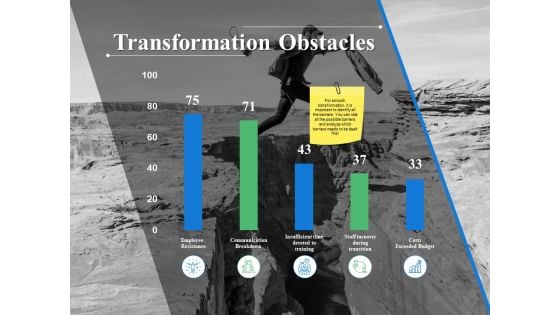
Transformation Obstacles Ppt PowerPoint Presentation Summary Microsoft
This is a transformation obstacles ppt powerpoint presentation summary microsoft. This is a five stage process. The stages in this process are finance, analysis, business, investment, marketing.
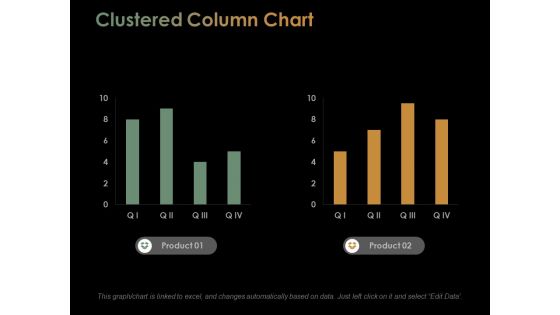
Clustered Column Chart Ppt PowerPoint Presentation Slides Information
This is a clustered column chart ppt powerpoint presentation slides information. This is a two stage process. The stages in this process are percentage, product, business, marketing.
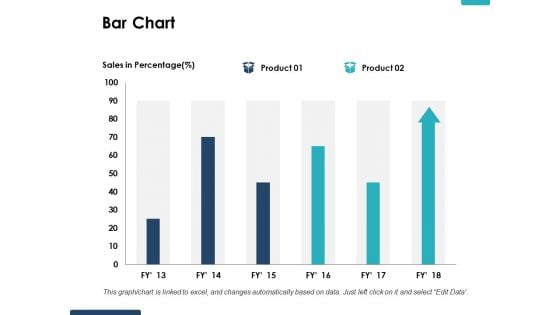
Bar Chart Ppt PowerPoint Presentation Show Deck
This is a bar chart ppt powerpoint presentation show deck. This is a two stage process. The stages in this process are percentage, product, business, marketing.
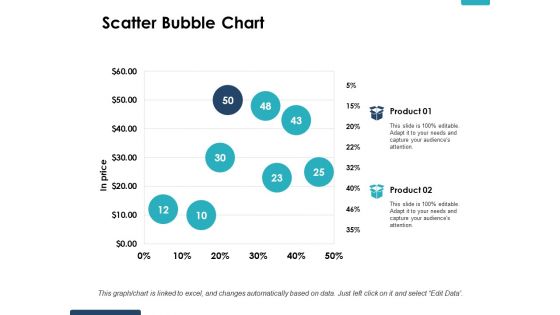
Scatter Bubble Chart Ppt PowerPoint Presentation Layouts Gridlines
This is a scatter bubble chart ppt powerpoint presentation layouts gridlines. This is a two stage process. The stages in this process are percentage, product, business, marketing.
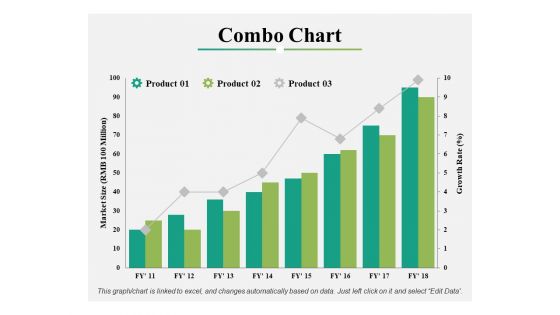
Combo Chart Ppt PowerPoint Presentation Styles Format Ideas
This is a combo chart ppt powerpoint presentation styles format ideas. This is a three stage process. The stages in this process are percentage, product, marketing.
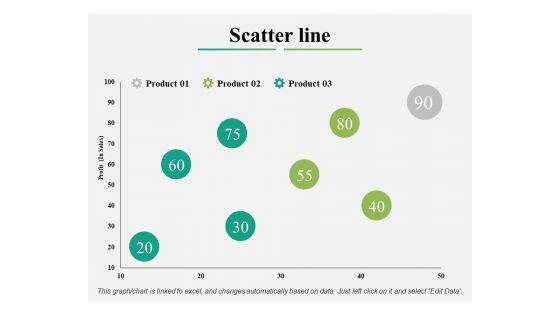
Scatter Line Ppt PowerPoint Presentation Show Designs Download
This is a scatter line ppt powerpoint presentation show designs download. This is a three stage process. The stages in this process are percentage, product, business, marketing.
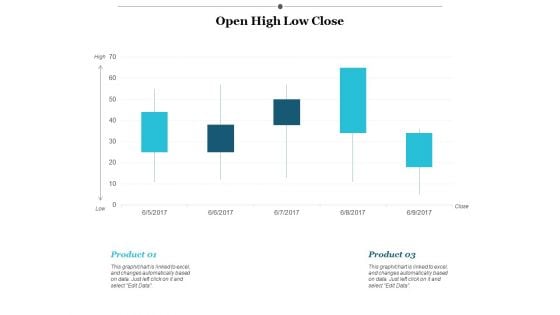
Open High Low Close Ppt PowerPoint Presentation Gallery Graphics Template
This is a open high low close ppt powerpoint presentation gallery graphics template. This is a two stage process. The stages in this process are finance, marketing, management, investment, analysis.
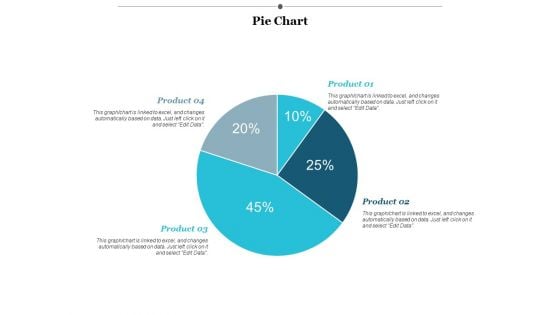
Pie Chart Finance Ppt PowerPoint Presentation Layouts Designs
This is a Pie Chart Finance Ppt PowerPoint Presentation Layouts Designs. This is a four stage process. The stages in this process are finance, marketing, management, investment, analysis.
Performance Dashboard Management Ppt PowerPoint Presentation Icon Themes
This is a performance dashboard management ppt powerpoint presentation icon themes. This is a four stage process. The stages in this process are finance, marketing, analysis, business, investment.
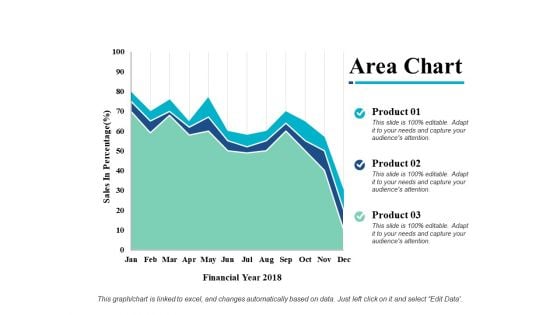
Area Chart Finance Marketing Ppt PowerPoint Presentation Infographic Template Master Slide
This is a area chart finance marketing ppt powerpoint presentation infographic template master slide. This is a three stage process. The stages in this process are area chart, finance, marketing, analysis, investment.
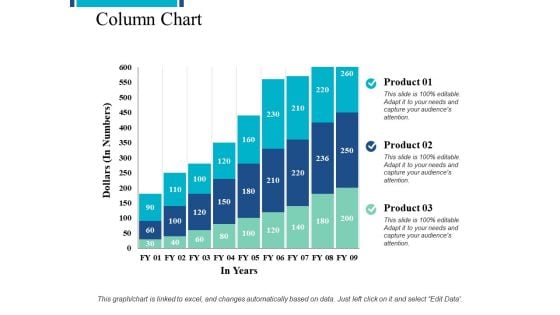
Column Chart Investment Ppt PowerPoint Presentation Show Diagrams
This is a column chart investment ppt powerpoint presentation show diagrams. This is a three stage process. The stages in this process are finance, analysis, business, investment, marketing.
Clustered Bar Finance Ppt PowerPoint Presentation Icon Infographic Template
This is a clustered bar finance ppt powerpoint presentation icon infographic template. This is a three stage process. The stages in this process are finance, analysis, business, investment, marketing.
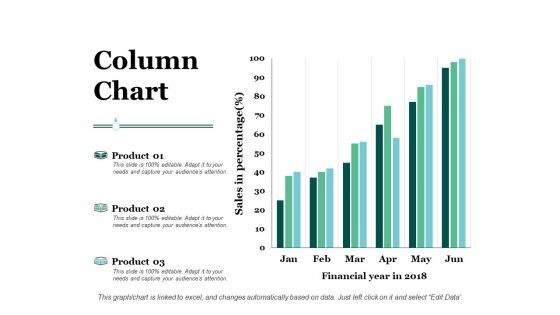
Column Chart Investment Ppt PowerPoint Presentation Professional Pictures
This is a column chart investment ppt powerpoint presentation professional pictures. This is a three stage process. The stages in this process are finance, analysis, business, investment, marketing.
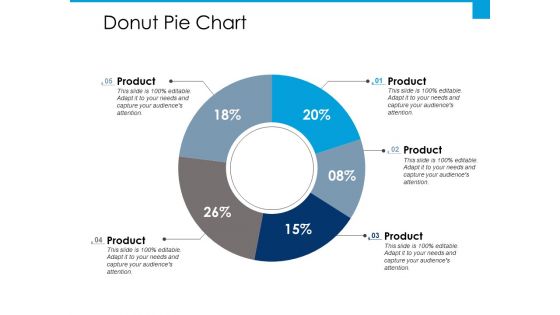
Donut Pie Chart Ppt PowerPoint Presentation Gallery Design Ideas
This is a donut pie chart ppt powerpoint presentation gallery design ideas. This is a five stage process. The stages in this process are business, marketing, percentage, product.
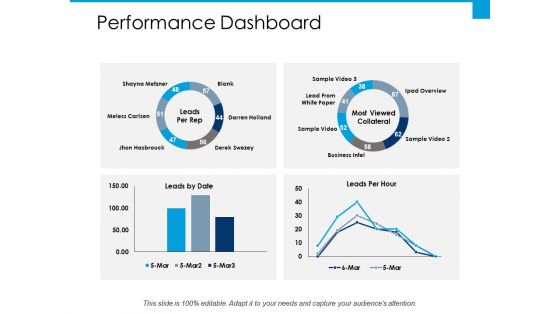
Performance Dashboard Ppt PowerPoint Presentation File Design Templates
This is a performance dashboard ppt powerpoint presentation file design templates. This is a four stage process. The stages in this process are percentage, product, management, marketing, business.
Stacked Area Clustered Column Ppt PowerPoint Presentation Icon Examples
This is a stacked area clustered column ppt powerpoint presentation icon examples. This is a three stage process. The stages in this process are percentage, product, management, marketing, business.
Clustered Column Finance Ppt PowerPoint Presentation Icon Show
This is a clustered column finance ppt powerpoint presentation gallery rules. This is a two stage process. The stages in this process are finance, marketing, management, investment, analysis.
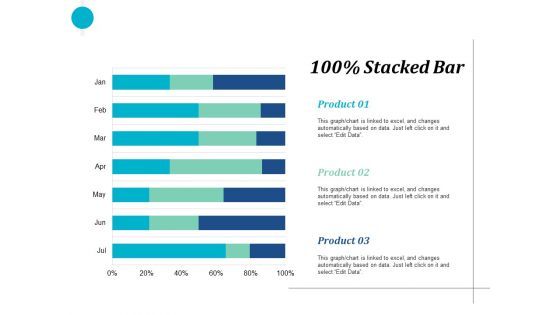
stacked bar finance ppt powerpoint presentation file layouts
This is a stacked bar finance ppt powerpoint presentation file layouts. This is a three stage process. The stages in this process are finance, marketing, management, investment, analysis.
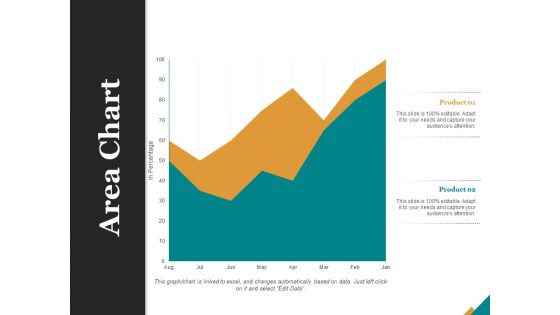
Area Chart Finance Ppt PowerPoint Presentation Summary Design Templates
This is a area chart finance ppt powerpoint presentation summary design templates. This is a two stage process. The stages in this process are finance, marketing, management, investment, analysis.
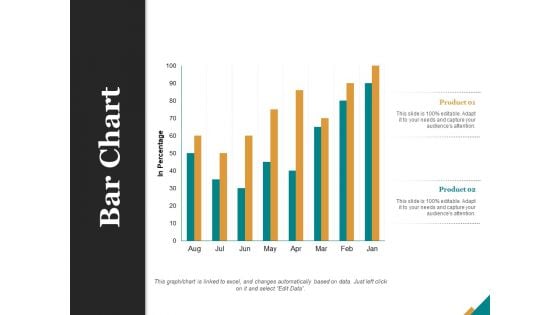
Bar Chart Finance Ppt PowerPoint Presentation Portfolio Model
This is a bar chart finance ppt powerpoint presentation portfolio model. This is a two stage process. The stages in this process are finance, marketing, management, investment, analysis.
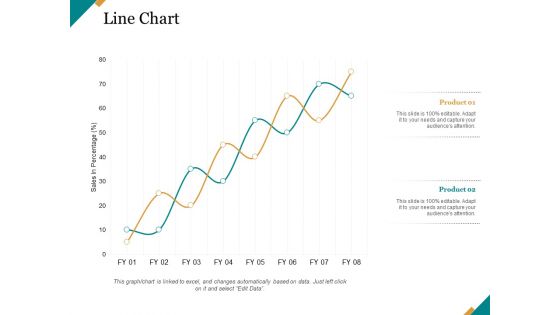
Line Chart Ppt PowerPoint Presentation Pictures Graphics
This is a line chart ppt powerpoint presentation pictures graphics. This is a two stage process. The stages in this process are finance, marketing, management, investment, analysis.
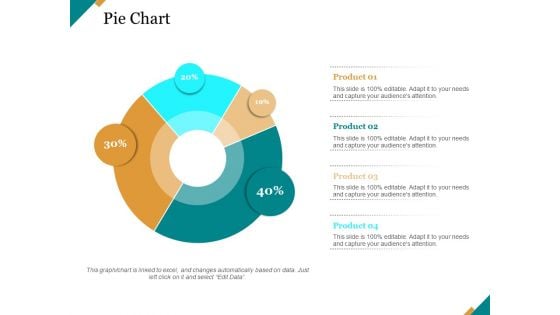
Pie Chart Finance Ppt PowerPoint Presentation Model Ideas
This is a pie chart finance ppt powerpoint presentation model ideas. This is a four stage process. The stages in this process are finance, marketing, management, investment, analysis.
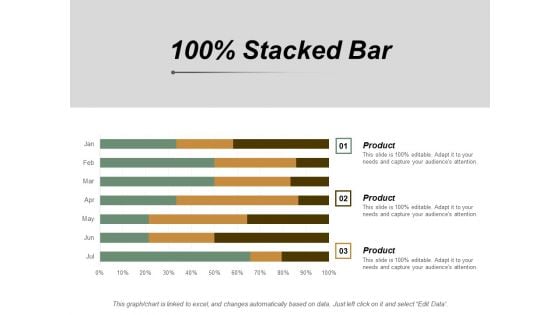
100 Percent Stacked Bar Ppt PowerPoint Presentation Layouts Graphics Template
This is a 100 percent stacked bar ppt powerpoint presentation layouts graphics template. This is a three stage process. The stages in this process are finance, marketing, management, investment, analysis.
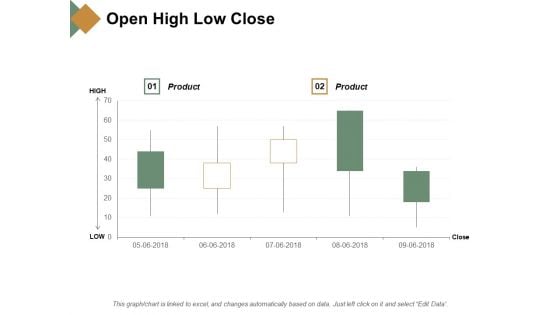
Open High Low Close Ppt PowerPoint Presentation Show Graphics Template
This is a open high low close ppt powerpoint presentation show graphics template. This is a two stage process. The stages in this process are finance, marketing, management, investment, analysis.
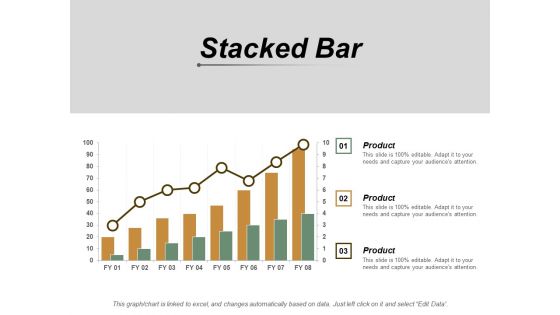
Stacked Bar Chart Ppt PowerPoint Presentation Gallery Outfit
This is a stacked bar chart ppt powerpoint presentation gallery outfit. This is a three stage process. The stages in this process are finance, marketing, management, investment, analysis.
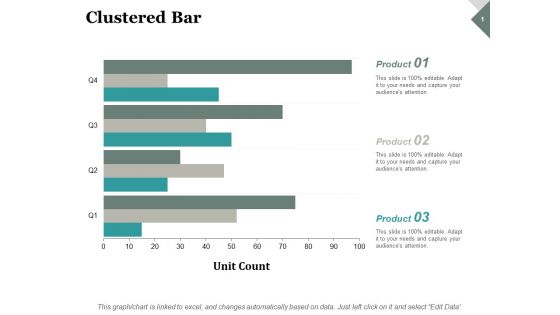
Clustered Bar Finance Marketing Ppt PowerPoint Presentation Outline Professional
This is a clustered bar finance marketing ppt powerpoint presentation outline professional. This is a three stage process. The stages in this process are finance, analysis, business, investment, marketing.
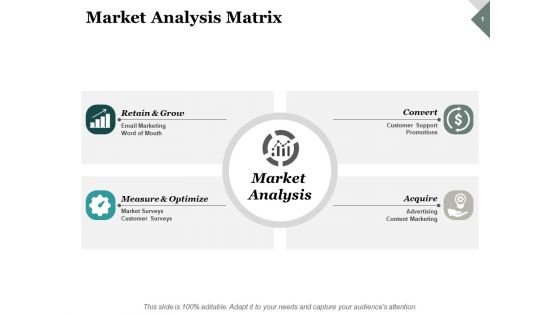
Market Analysis Matrix Ppt PowerPoint Presentation Model Layouts
This is a market analysis matrix ppt powerpoint presentation model layouts. This is a four stage process. The stages in this process are content marketing, convert, acquire, market surveys, customer surveys.
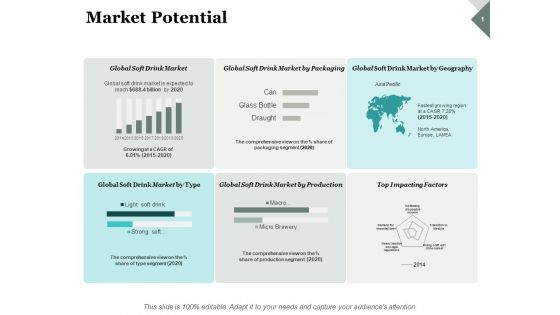
Market Potential Ppt PowerPoint Presentation File Shapes
This is a market potential ppt powerpoint presentation file shapes. This is a six stage process. The stages in this process are finance, analysis, business, investment, marketing.
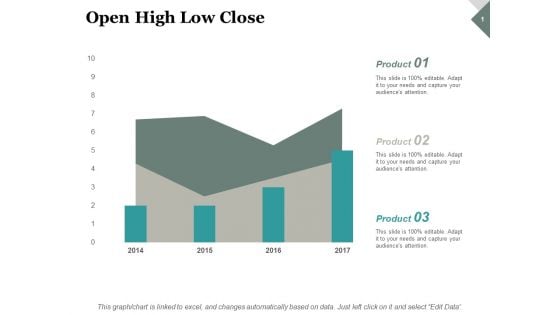
Open High Low Close Finance Ppt PowerPoint Presentation Professional Layout
This is a open high low close finance ppt powerpoint presentation professional layout. This is a three stage process. The stages in this process are finance, analysis, business, investment, marketing.
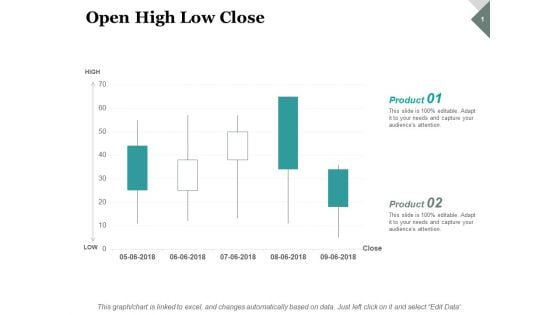
Open High Low Close Investment Ppt PowerPoint Presentation Slides Portrait
This is a open high low close investment ppt powerpoint presentation slides portrait. This is a two stage process. The stages in this process are finance, analysis, business, investment, marketing.
Pie Chart Investment Ppt PowerPoint Presentation Gallery Icon
This is a pie chart investment ppt powerpoint presentation gallery icon. This is a three stage process. The stages in this process are pie chart, finance, marketing, analysis, investment.
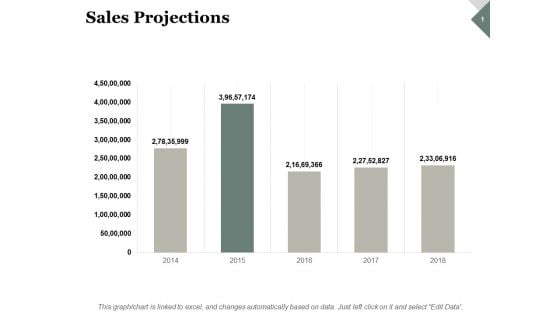
Sales Projections Ppt PowerPoint Presentation Gallery Infographic Template
This is a sales projections ppt powerpoint presentation gallery infographic template. This is a five stage process. The stages in this process are finance, analysis, business, investment, marketing.
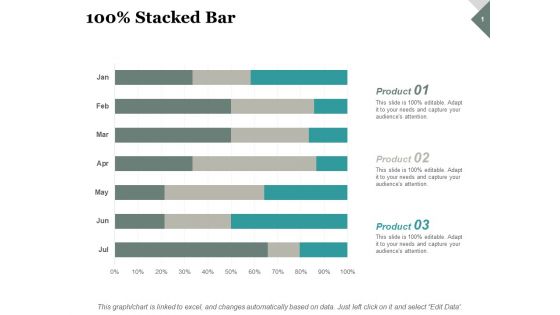
Stacked Bar Finance Ppt PowerPoint Presentation Ideas Good
This is a stacked bar finance ppt powerpoint presentation ideas good. This is a three stage process. The stages in this process are finance, analysis, business, investment, marketing.
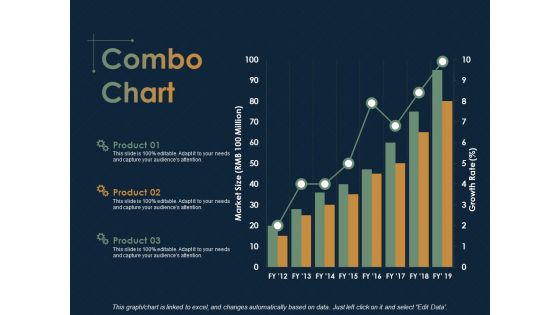
Combo Chart Finance Ppt PowerPoint Presentation Ideas Microsoft
This is a combo chart finance ppt powerpoint presentation ideas microsoft. This is a three stage process. The stages in this process are combo chart, Finance, Analysis, Business, Investment.
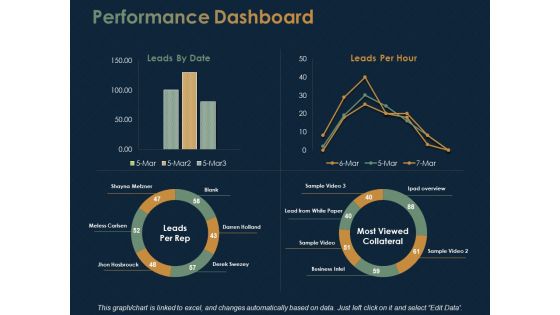
Performance Dashboard Marketing Ppt PowerPoint Presentation Show Microsoft
This is a performance dashboard marketing ppt powerpoint presentation show microsoft. This is a four stage process. The stages in this process are finance, marketing, analysis, business, investment.
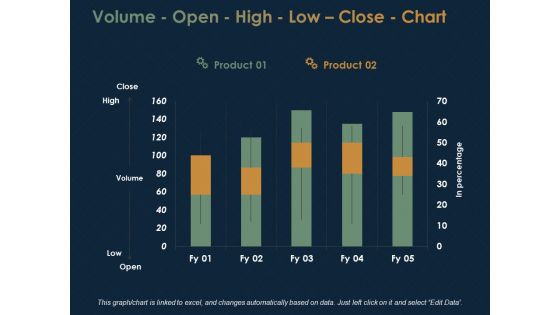
Volume Open High Low Close Chart Finance Ppt PowerPoint Presentation Gallery Graphic Tips
This is a volume open high low close chart finance ppt powerpoint presentation gallery graphic tips. This is a two stage process. The stages in this process are finance, analysis, business, investment, marketing.
Combo Chart Finance Ppt PowerPoint Presentation Icon Designs Download
This is a combo chart finance ppt powerpoint presentation icon designs download. This is a three stage process. The stages in this process are combo chart, finance, analysis, business, investment.
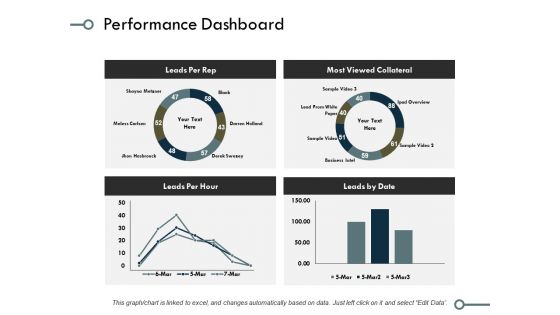
Performance Dashboard Ppt PowerPoint Presentation Model Graphics Example
This is a performance dashboard ppt powerpoint presentation model graphics example. This is a four stage process. The stages in this process are finance, marketing, analysis, business, investment.
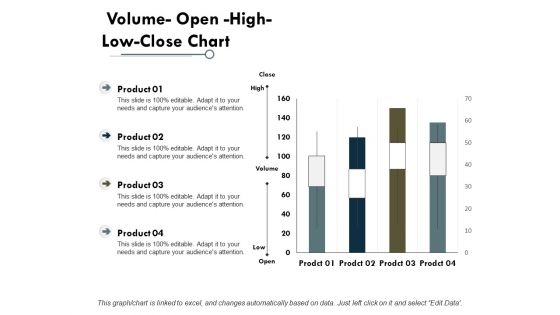
Volume Open High Low Close Chart Finance Ppt PowerPoint Presentation Professional Background Image
This is a volume open high low close chart finance ppt powerpoint presentation professional background image. This is a four stage process. The stages in this process are finance, analysis, business, investment, marketing.
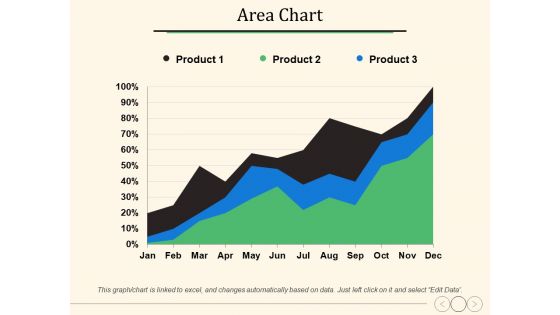
Area Chart Ppt PowerPoint Presentation Show Graphics
This is a area chart ppt powerpoint presentation show graphics. This is a three stage process. The stages in this process are percentage, product, marketing, management, business.


 Continue with Email

 Home
Home


