Corporate Banking
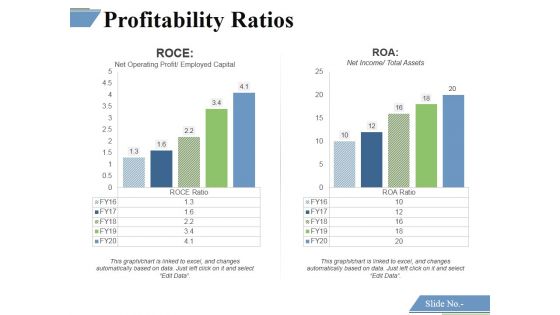
Profitability Ratios Template 6 Ppt PowerPoint Presentation Portfolio Graphics
This is a profitability ratios template 6 ppt powerpoint presentation portfolio graphics. This is a two stage process. The stages in this process are roce, roa.
Solvency Ratios Template 1 Ppt PowerPoint Presentation Portfolio Icon
This is a solvency ratios template 1 ppt powerpoint presentation portfolio icon. This is a two stage process. The stages in this process are debt equity ratio, time interest earned ratio.
Solvency Ratios Template 2 Ppt PowerPoint Presentation Icon Sample
This is a solvency ratios template 2 ppt powerpoint presentation icon sample. This is a two stage process. The stages in this process are debt equity ratio, time interest earned ratio.
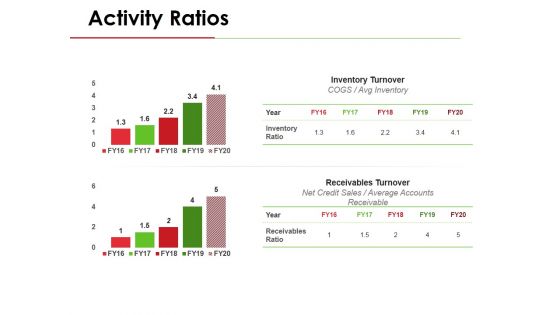
Activity Ratios Template 1 Ppt PowerPoint Presentation Pictures Graphics Example
This is a activity ratios template 1 ppt powerpoint presentation pictures graphics example. This is a two stage process. The stages in this process are inventory turnover, receivables turnover, avg inventory, net credit sales, average accounts receivable.

Activity Ratios Template 2 Ppt PowerPoint Presentation Layouts Clipart Images
This is a activity ratios template 2 ppt powerpoint presentation layouts clipart images. This is a two stage process. The stages in this process are inventory turnover, receivables turnover, avg inventory, net credit sales, average accounts receivable.
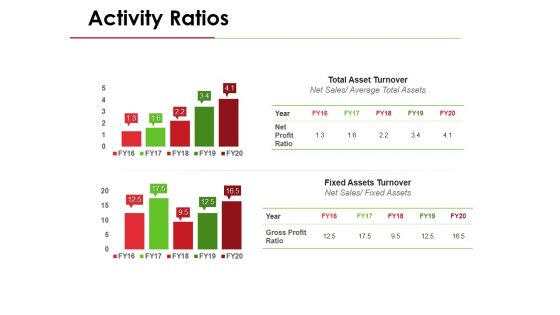
Activity Ratios Template 3 Ppt PowerPoint Presentation Inspiration Example File
This is a activity ratios template 3 ppt powerpoint presentation inspiration example file. This is a two stage process. The stages in this process are total asset turnover, net sales, average total assets, fixed assets turnover, fixed assets.
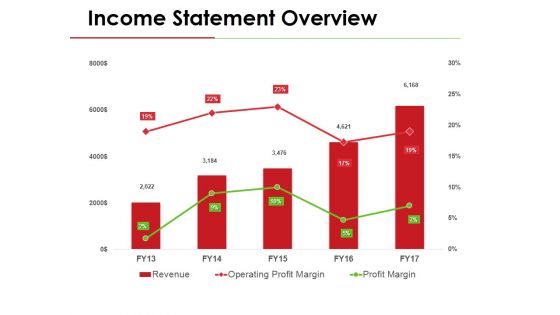
Income Statement Overview Ppt PowerPoint Presentation Gallery Template
This is a income statement overview ppt powerpoint presentation gallery template. This is a three stage process. The stages in this process are revenue, operating profit margin, profit margin.
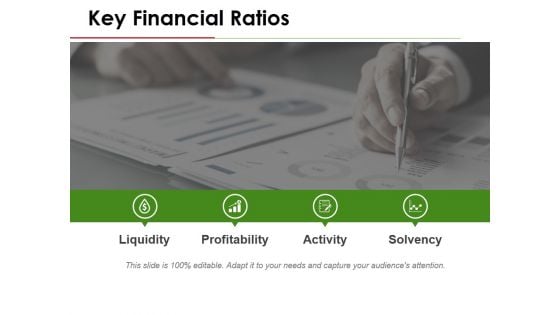
Key Financial Ratios Template 3 Ppt PowerPoint Presentation Model Deck
This is a key financial ratios template 3 ppt powerpoint presentation model deck. This is a four stage process. The stages in this process are liquidity, profitability, activity, solvency.
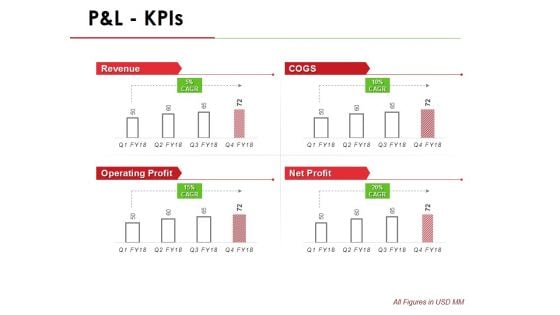
P And L Kpis Template 1 Ppt PowerPoint Presentation Infographic Template Outline
This is a p and l kpis template 1 ppt powerpoint presentation infographic template outline. This is a four stage process. The stages in this process are revenue, operating profit, cogs, net profit.
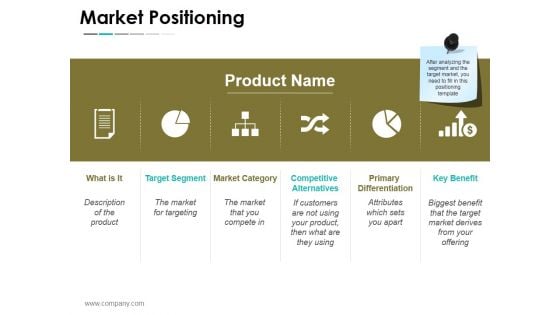
Market Positioning Ppt PowerPoint Presentation File Show
This is a market positioning ppt powerpoint presentation file show. This is a six stage process. The stages in this process are product name, market category, competitive, alternatives, primary, differentiation, key benefit, target segment.
Market Segmentation Evaluation Segment Size And Growth Potential Ppt PowerPoint Presentation Icon Master Slide
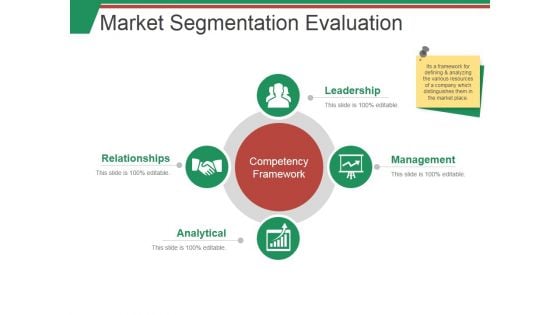
This is a market segmentation evaluation segment size and growth potential ppt powerpoint presentation icon master slide. This is a four stage process. The stages in this process are leadership, management, relationships, analytical, competency, framework.
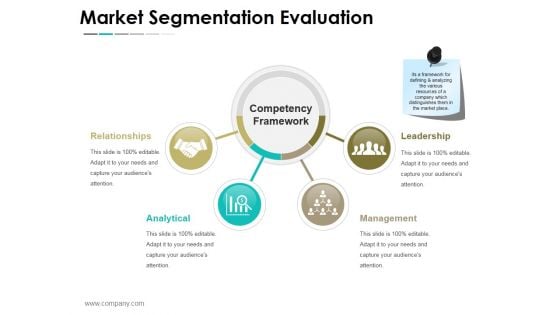
Market Segmentation Evaluation Ppt PowerPoint Presentation Layouts Images
This is a market segmentation evaluation ppt powerpoint presentation layouts images. This is a two stage process. The stages in this process are market sales, net profit, confectionary, milk products, beverages, nutrition and health care.
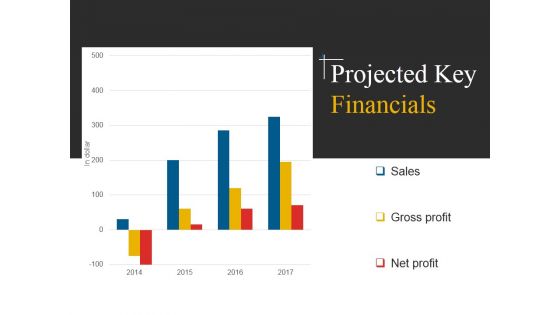
Projected Key Financials Template 2 Ppt PowerPoint Presentation Inspiration Example File
This is a projected key financials template 2 ppt powerpoint presentation inspiration example file. This is a four stage process. The stages in this process are sales, gross profit, net profit.
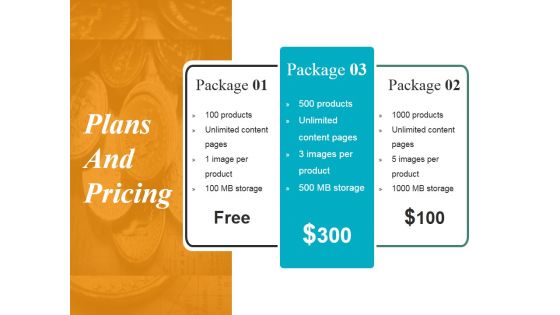
Plans And Pricing Ppt PowerPoint Presentation Infographics Portfolio
This is a plans and pricing ppt powerpoint presentation infographics portfolio. This is a three stage process. The stages in this process are package, free, images per product, unlimited content pages.
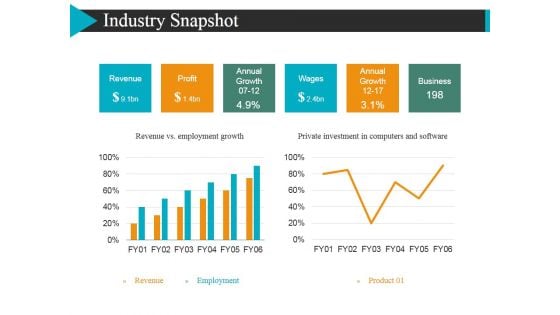
Industry Snapshot Template 2 Ppt Powerpoint Presentation Layouts Sample
This is a industry snapshot template 2 ppt powerpoint presentation layouts sample. This is a two stage process. The stages in this process are revenue, profit, annual growth, wages.
Market Size Ppt Powerpoint Presentation Slides Icons
This is a market size ppt powerpoint presentation slides icons. This is a two stage process. The stages in this process are market size, competitive analysis, market type.
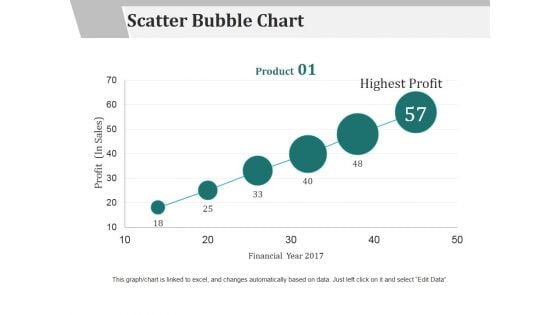
Scatter Bubble Chart Ppt PowerPoint Presentation Professional Skills
This is a scatter bubble chart ppt powerpoint presentation professional skills. This is a six stage process. The stages in this process are financial, marketing, management, strategy, planning.

Financial Ppt PowerPoint Presentation Ideas Template
This is a financial ppt powerpoint presentation ideas template. This is a three stage process. The stages in this process are revenue, deposits, net income.
Market Segmentation Evaluation Template 1 Ppt PowerPoint Presentation Summary Smartart
This is a market segmentation evaluation template 1 ppt powerpoint presentation summary smartart. This is a two stage process. The stages in this process are market sales, net profit, beverages, milk product, nutrition.
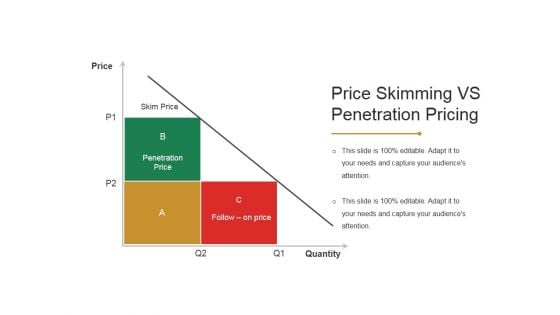
Price Skimming Vs Penetration Pricing Ppt PowerPoint Presentation Gallery Outline
This is a price skimming vs penetration pricing ppt powerpoint presentation gallery outline. This is a three stage process. The stages in this process are price, skim price, penetration price, follow on price, quantity.
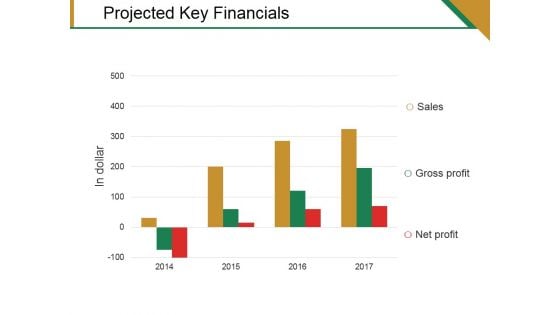
Projected Key Financials Template 1 Ppt PowerPoint Presentation File Portfolio
This is a projected key financials template 1 ppt powerpoint presentation file portfolio. This is a three stage process. The stages in this process are sales, gross profit, net profit.
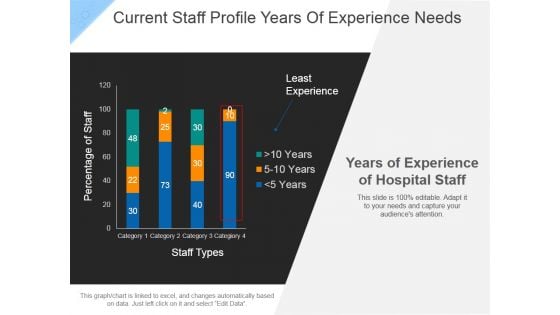
Current Staff Profile Years Of Experience Needs Ppt PowerPoint Presentation Portfolio Deck
This is a current staff profile years of experience needs ppt powerpoint presentation portfolio deck. This is a four stage process. The stages in this process are least experience, staff types, percentage of staff.
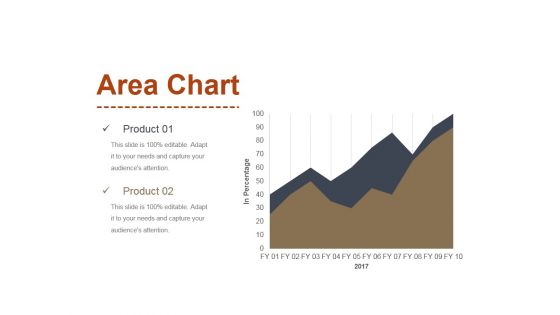
Area Chart Ppt PowerPoint Presentation Inspiration Slides
This is a area chart ppt powerpoint presentation inspiration slides. This is a two stage process. The stages in this process are area chart, product, in percentage.

Combo Chart Ppt PowerPoint Presentation Professional Infographics
This is a combo chart ppt powerpoint presentation professional infographics. This is a three stage process. The stages in this process are combo chart, market size, product.
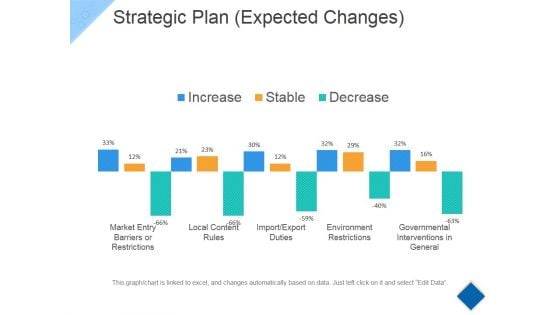
Strategic Plan Template 2 Ppt PowerPoint Presentation Summary Graphic Images
This is a strategic plan template 2 ppt powerpoint presentation summary graphic images. This is a ten stage process. The stages in this process are increase, decrease, stable, environment restrictions.
Stock Chart Ppt PowerPoint Presentation Icon Microsoft
This is a stock chart ppt powerpoint presentation icon microsoft. This is a five stage process. The stages in this process are product, high, volume, low.
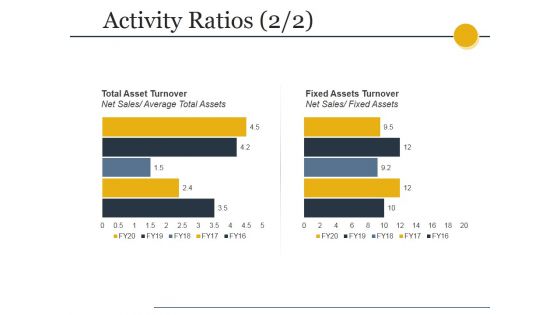
Activity Ratios Template 1 Ppt PowerPoint Presentation Outline Design Templates
This is a activity ratios template 1 ppt powerpoint presentation outline design templates. This is a two stage process. The stages in this process are inventory turnover, receivable turnover, graph, success, growth.
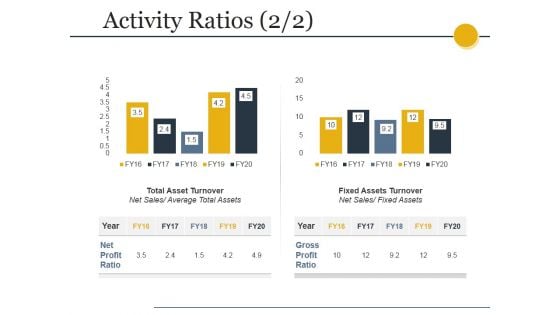
Activity Ratios Template 3 Ppt PowerPoint Presentation Professional Example
This is a activity ratios template 3 ppt powerpoint presentation professional example. This is a two stage process. The stages in this process are total asset turnover, net sales, fixed assets turnover, fixed assets.
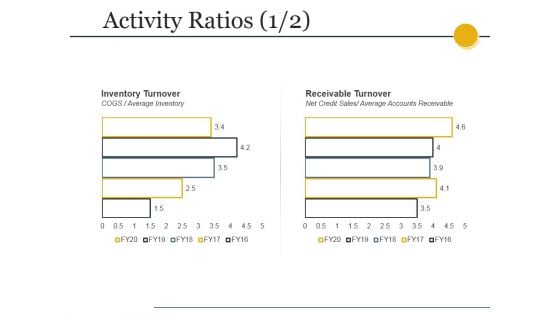
Activity Ratios Template Ppt PowerPoint Presentation Summary Slides
This is a activity ratios template ppt powerpoint presentation summary slides. This is a two stage process. The stages in this process are total asset turnover, net sales, fixed assets turnover, fixed assets.
Activity Ratios Ppt PowerPoint Presentation Icon Themes
This is a activity ratios ppt powerpoint presentation icon themes. This is a two stage process. The stages in this process are inventory turnover, cogs, average inventory, receivable turnover, net credit sales, average accounts receivable .
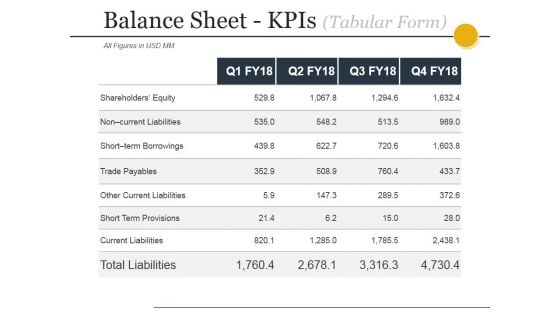
Balance Sheet Kpis Tabular Form Ppt PowerPoint Presentation Infographics Good
This is a balance sheet kpis tabular form ppt powerpoint presentation infographics good. This is a four stage process. The stages in this process are current assets, current liabilities, total assets, total liabilities.
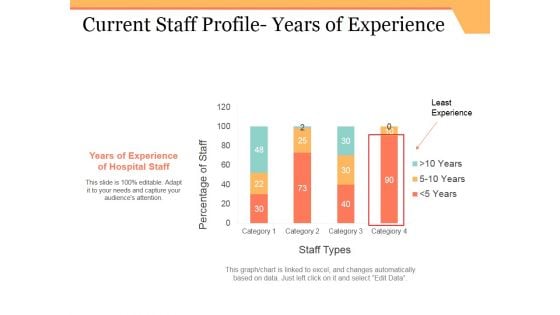
Current Staff Profile Years Of Experience Ppt PowerPoint Presentation Infographics Example
This is a current staff profile years of experience ppt powerpoint presentation infographics example. This is a four stage process. The stages in this process are years of experience of hospital staff, least experience, staff types.
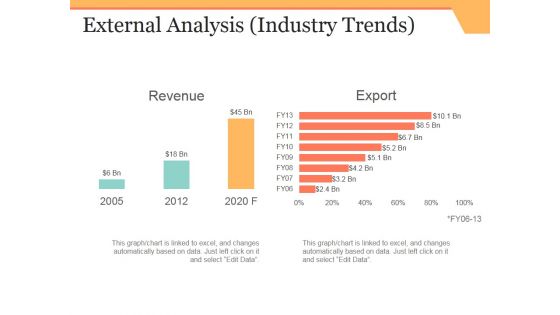
External Analysis Template 2 Ppt PowerPoint Presentation Pictures Grid
This is a external analysis template 2 ppt powerpoint presentation pictures grid. This is a two stage process. The stages in this process are revenue, export.
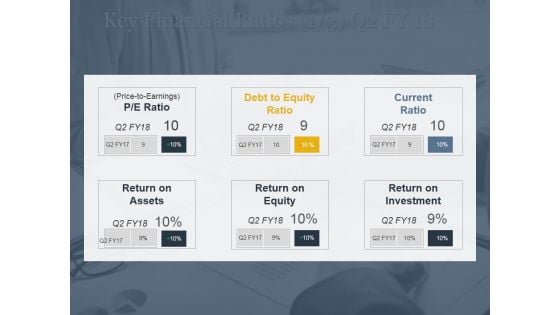
Key Financial Ratios Ppt PowerPoint Presentation Model Objects
This is a key financial ratios ppt powerpoint presentation model objects. This is a three stage process. The stages in this process are p e ratio, price to earnings, debt, equity ratio, current, ratio.

Location Ppt PowerPoint Presentation Layouts Outline
This is a location ppt powerpoint presentation layouts outline. This is a three stage process. The stages in this process are brazil, africa, australia.
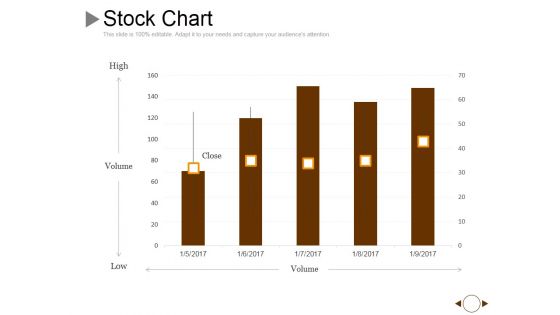
Stock Chart Ppt PowerPoint Presentation Gallery Graphics Example
This is a stock chart ppt powerpoint presentation gallery graphics example. This is a five stage process. The stages in this process are volume, high, low, close.
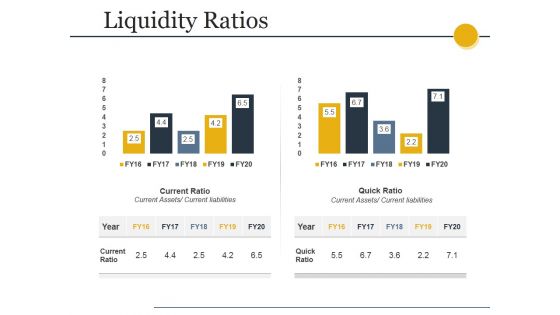
Liquidity Ratios Ppt PowerPoint Presentation Summary Gallery
This is a liquidity ratios ppt powerpoint presentation summary gallery. This is a two stage process. The stages in this process are current ratio, current assets current liabilities, quick ratio, current assets current liabilities.
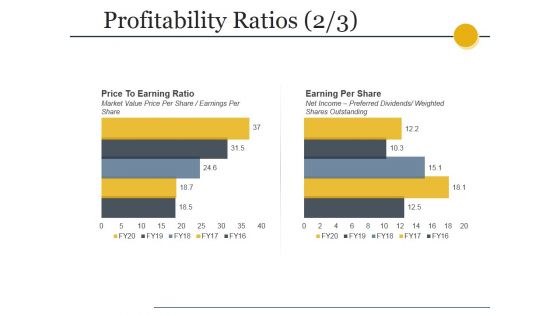
Profitability Ratios Template 2 Ppt PowerPoint Presentation Gallery Designs
This is a profitability ratios template 2 ppt powerpoint presentation gallery designs. This is a two stage process. The stages in this process are price to earning ratio, market value price per share earnings per share, earning per share, net income preferred dividends, weighted shares outstanding.
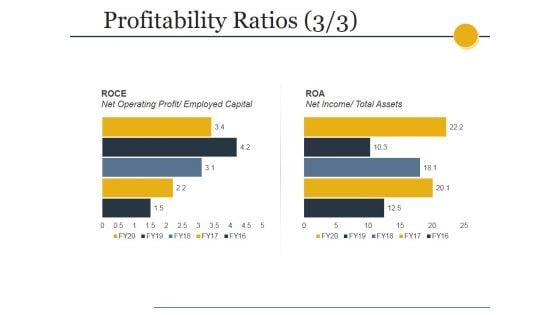
Profitability Ratios Template 3 Ppt PowerPoint Presentation Show Graphics Download
This is a profitability ratios template 3 ppt powerpoint presentation show graphics download. This is a two stage process. The stages in this process are roce, net operating profit, employed capital, roa, net income, total assets.
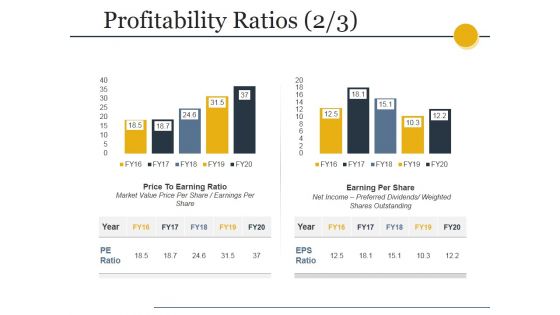
Profitability Ratios Template 4 Ppt PowerPoint Presentation Professional Deck
This is a profitability ratios template 4 ppt powerpoint presentation professional deck. This is a two stage process. The stages in this process are price to earning ratio, market value price per share earnings per share, earning per share, net income preferred dividends, weighted shares outstanding.
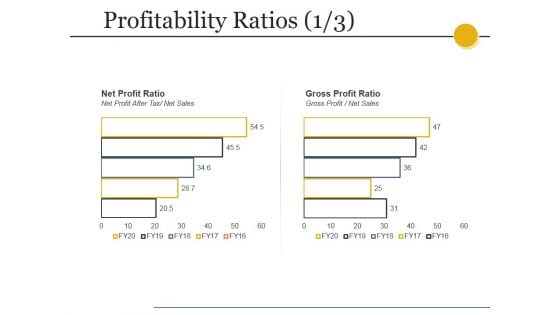
Profitability Ratios Template Ppt PowerPoint Presentation Styles Slide
This is a profitability ratios template ppt powerpoint presentation styles slide. This is a two stage process. The stages in this process are net profit ratio, net profit after tax net sales, gross profit ratio, gross profit net sales.
Solvency Ratios Template Ppt PowerPoint Presentation Inspiration Icons
This is a solvency ratios template ppt powerpoint presentation inspiration icons. This is a two stage process. The stages in this process are debt equity ratio, total liabilities total equity, time interest earned ratio, ebit interest expense.
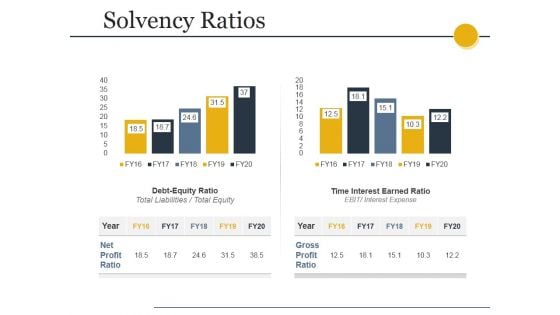
Solvency Ratios Ppt PowerPoint Presentation Inspiration Guidelines
This is a solvency ratios ppt powerpoint presentation inspiration guidelines. This is a two stage process. The stages in this process are debt equity ratio, total liabilities total equity, time interest earned ratio, ebit interest expense.
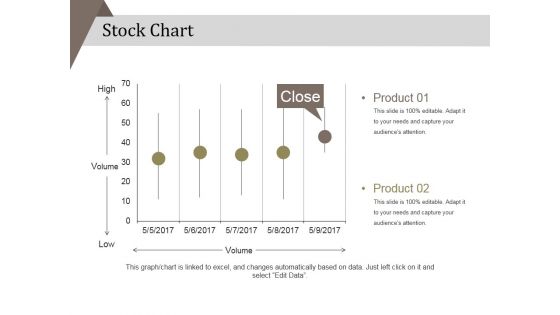
Stock Chart Ppt PowerPoint Presentation Portfolio Background Designs
This is a stock chart ppt powerpoint presentation portfolio background designs. This is a five stage process. The stages in this process are product, high, low .
Addressable Market In Sector 1 Ppt PowerPoint Presentation Ideas Icons
This is a addressable market in sector 1 ppt powerpoint presentation ideas icons. This is a two stage process. The stages in this process are fossil fuels, nuclear, bioenergy, biofuels.
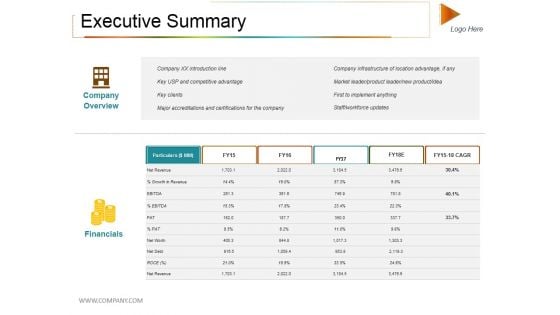
Executive Summary Ppt PowerPoint Presentation Visual Aids Inspiration
This is a executive summary ppt powerpoint presentation visual aids inspiration. This is a five stage process. The stages in this process are company overview, financials, net revenue, particulars.
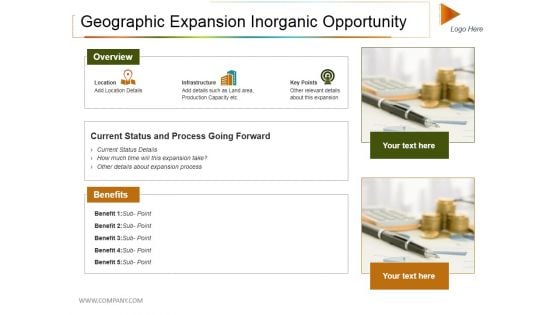
Geographic Expansion Inorganic Opportunity Ppt PowerPoint Presentation Summary Example Introduction
This is a geographic expansion inorganic opportunity ppt powerpoint presentation summary example introduction. This is a two stage process. The stages in this process are overview, benefits, current status and process going forward.
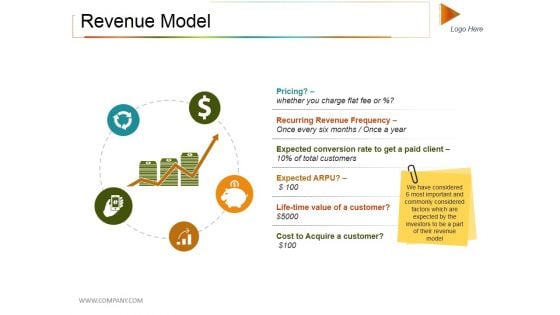
Revenue Model Ppt PowerPoint Presentation Outline Example
This is a revenue model ppt powerpoint presentation outline example. This is a five stage process. The stages in this process are pricing, recurring revenue frequency, expected arpu.
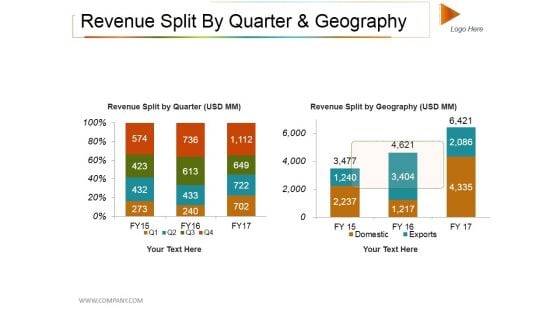
Revenue Split By Quarter And Geography Ppt PowerPoint Presentation Professional Slide Download
This is a revenue split by quarter and geography ppt powerpoint presentation professional slide download. This is a two stage process. The stages in this process are domestic, exports, revenue split by quarter, revenue split by geography.
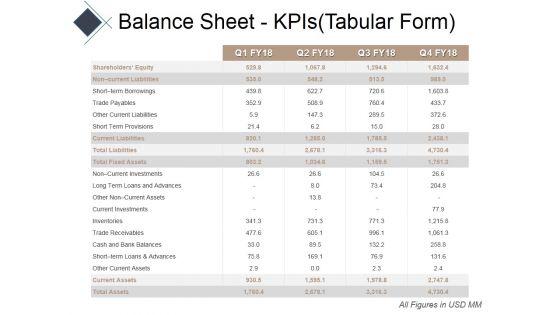
Balance Sheet Kpis Tabular Form Ppt PowerPoint Presentation Show Example Introduction
This is a balance sheet kpis tabular form ppt powerpoint presentation show example introduction. This is a four stage process. The stages in this process are current assets, current liabilities, total assets, total liabilities.
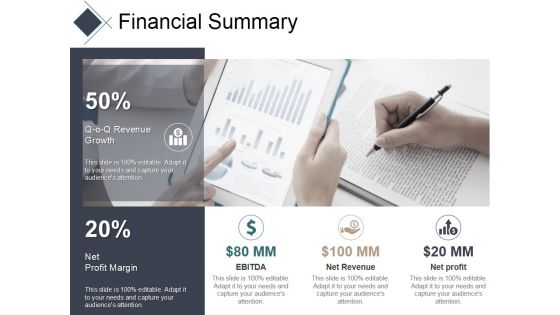
Financial Summary Ppt PowerPoint Presentation Professional Template
This is a financial summary ppt powerpoint presentation professional template. This is a two stage process. The stages in this process are revenue growth, net, profit margin, ebitda, net revenue, net profit.
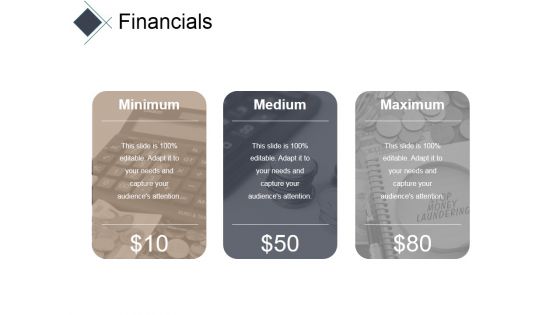
Financials Ppt PowerPoint Presentation Infographics Outfit
This is a financials ppt powerpoint presentation infographics outfit. This is a three stage process. The stages in this process are minimum, medium, maximum.
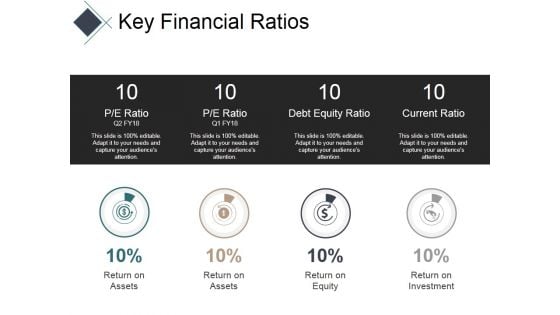
Key Financial Ratios Ppt PowerPoint Presentation Summary Inspiration
This is a key financial ratios ppt powerpoint presentation summary inspiration. This is a four stage process. The stages in this process are pe ratio, debt equity ratio, current ratio.
Competitive Analysis Template 6 Scatter Chart Ppt PowerPoint Presentation Icon Example Topics
This is a competitive analysis template 6 scatter chart ppt powerpoint presentation icon example topics. This is a eight stage process. The stages in this process are users interface, data import, example, pricing, support, update, tutorials, easy to use.
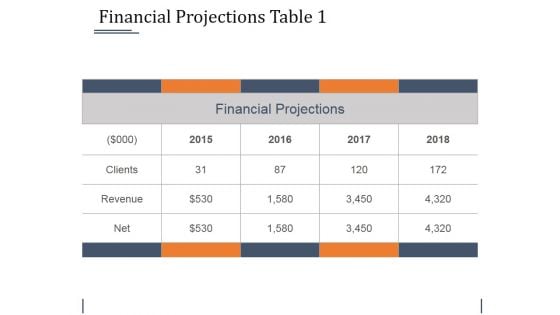
Financial Projections Table 1 Ppt PowerPoint Presentation Summary Background Image
This is a financial projections table 1 ppt powerpoint presentation summary background image. This is a four stage process. The stages in this process are financial projections, clients, revenue, net.
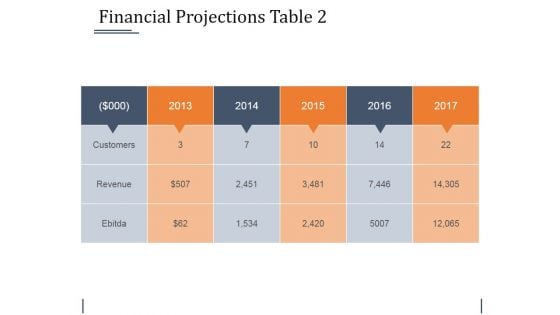
Financial Projections Table 2 Ppt PowerPoint Presentation Styles Slides
This is a financial projections table 2 ppt powerpoint presentation styles slides. This is a five stage process. The stages in this process are customers, revenue, ebitda.

Go To Market Strategy Market Segmentation Ppt PowerPoint Presentation File Summary
This is a go to market strategy market segmentation ppt powerpoint presentation file summary. This is a two stage process. The stages in this process are market, market segments.
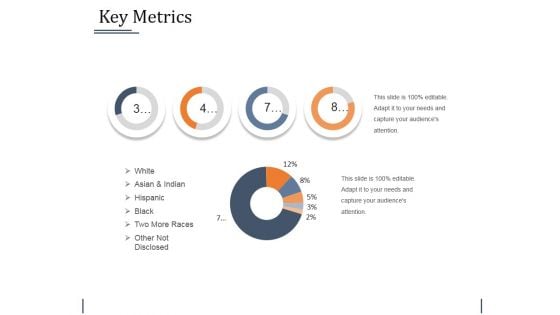
Key Metrics Ppt PowerPoint Presentation Outline Templates
This is a key metrics ppt powerpoint presentation outline templates. This is a four stage process. The stages in this process are white, asian and indian, hispanic, black, two more races, other not disclosed.
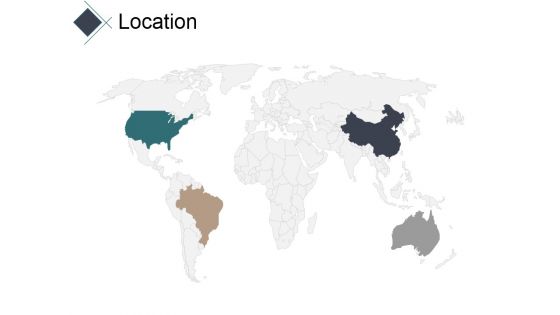
Location Ppt PowerPoint Presentation Professional Model
This is a location ppt powerpoint presentation professional model. This is a four stage process. The stages in this process are usa, china, brazil, australia.
Pandl Kpis Tabular Form Ppt PowerPoint Presentation Gallery Icon
This is a pandl kpis tabular form ppt powerpoint presentation gallery icon. This is a four stage process. The stages in this process are revenue, cogs, operating profit, net profit.


 Continue with Email

 Home
Home


