Corporate Finance
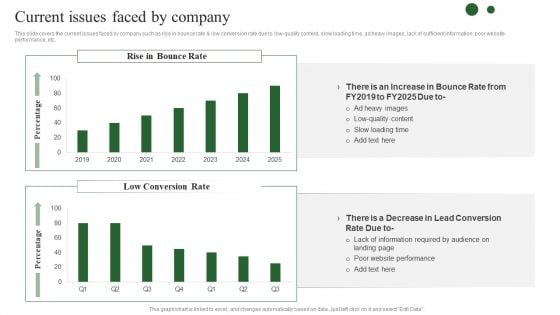
Brand Development Techniques To Increase Revenues Current Issues Faced By Company Elements PDF
This slide covers the current issues faced by company such as rise in bounce rate and low conversion rate due to low quality content, slow loading time, ad heavy images, lack of sufficient information, poor website performance, etc. If you are looking for a format to display your unique thoughts, then the professionally designed Brand Development Techniques To Increase Revenues Current Issues Faced By Company Elements PDF is the one for you. You can use it as a Google Slides template or a PowerPoint template. Incorporate impressive visuals, symbols, images, and other charts. Modify or reorganize the text boxes as you desire. Experiment with shade schemes and font pairings. Alter, share or cooperate with other people on your work. Download Brand Development Techniques To Increase Revenues Current Issues Faced By Company Elements PDF and find out how to give a successful presentation. Present a perfect display to your team and make your presentation unforgettable.

Logistics Transport Company Financial Report Net Profit And Margin Ppt Layouts Graphics Tutorials PDF
The slide showcases the net profit and margin for transport company. It depicts change in net profit and profit margin for last five financial years form 2018 to 2022. Slidegeeks is here to make your presentations a breeze with Logistics Transport Company Financial Report Net Profit And Margin Ppt Layouts Graphics Tutorials PDF With our easy-to-use and customizable templates, you can focus on delivering your ideas rather than worrying about formatting. With a variety of designs to choose from, you are sure to find one that suits your needs. And with animations and unique photos, illustrations, and fonts, you can make your presentation pop. So whether you are giving a sales pitch or presenting to the board, make sure to check out Slidegeeks first
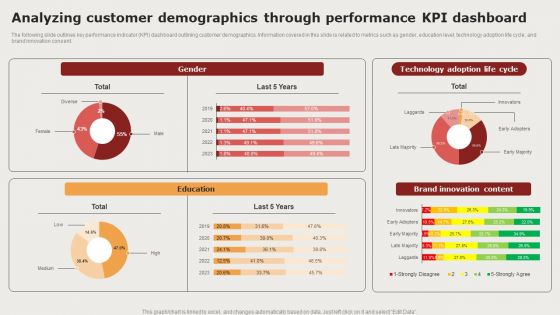
Creating Positioning Techniques For Market Research Analyzing Customer Demographics Through Performance Background PDF
The following slide outlines key performance indicator KPI dashboard outlining customer demographics. Information covered in this slide is related to metrics such as gender, education level, technology adoption life cycle, and brand innovation consent. If you are looking for a format to display your unique thoughts, then the professionally designed Creating Positioning Techniques For Market Research Analyzing Customer Demographics Through Performance Background PDF is the one for you. You can use it as a Google Slides template or a PowerPoint template. Incorporate impressive visuals, symbols, images, and other charts. Modify or reorganize the text boxes as you desire. Experiment with shade schemes and font pairings. Alter, share or cooperate with other people on your work. Download Creating Positioning Techniques For Market Research Analyzing Customer Demographics Through Performance Background PDF and find out how to give a successful presentation. Present a perfect display to your team and make your presentation unforgettable.
Claims Tracking Dashboard Utilized By Insurance Agency Diagrams PDF
This slide provides glimpse about claim activities tracking by insurance agency in terms of claim amount collected, number of claims, claims by product line, claim status assessment, claim expense by product line, etc. If you are looking for a format to display your unique thoughts, then the professionally designed Claims Tracking Dashboard Utilized By Insurance Agency Diagrams PDF is the one for you. You can use it as a Google Slides template or a PowerPoint template. Incorporate impressive visuals, symbols, images, and other charts. Modify or reorganize the text boxes as you desire. Experiment with shade schemes and font pairings. Alter, share or cooperate with other people on your work. Download Claims Tracking Dashboard Utilized By Insurance Agency Diagrams PDF and find out how to give a successful presentation. Present a perfect display to your team and make your presentation unforgettable.
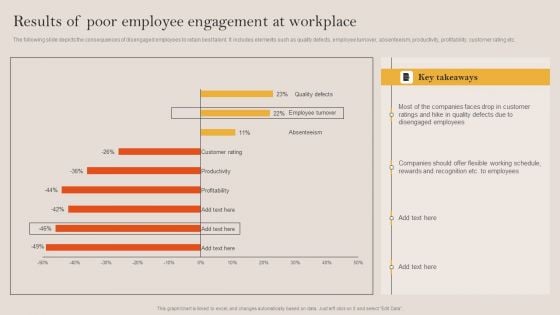
Tactical Employee Engagement Action Planning Results Of Poor Employee Engagement At Workplace Slides PDF
The following slide depicts the consequences of disengaged employees to retain best talent. It includes elements such as quality defects, employee turnover, absenteeism, productivity, profitability, customer rating etc. Slidegeeks is here to make your presentations a breeze with Tactical Employee Engagement Action Planning Results Of Poor Employee Engagement At Workplace Slides PDF With our easy to use and customizable templates, you can focus on delivering your ideas rather than worrying about formatting. With a variety of designs to choose from, you are sure to find one that suits your needs. And with animations and unique photos, illustrations, and fonts, you can make your presentation pop. So whether you are giving a sales pitch or presenting to the board, make sure to check out Slidegeeks first
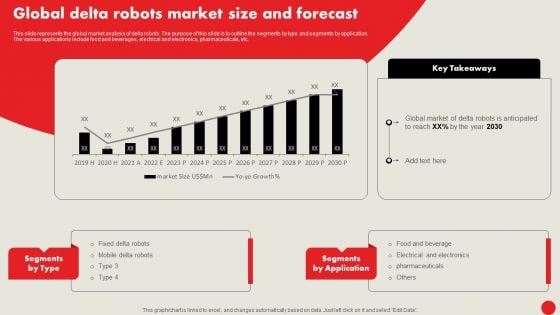
Types Of Robots For Industrial Operations Global Delta Robots Market Size And Forecast Mockup PDF
This slide represents the global market analysis of delta robots. The purpose of this slide is to outline the segments by type and segments by application. The various applications include food and beverages, electrical and electronics, pharmaceuticals, etc. Slidegeeks is here to make your presentations a breeze with Types Of Robots For Industrial Operations Global Delta Robots Market Size And Forecast Mockup PDF With our easy-to-use and customizable templates, you can focus on delivering your ideas rather than worrying about formatting. With a variety of designs to choose from, you are sure to find one that suits your needs. And with animations and unique photos, illustrations, and fonts, you can make your presentation pop. So whether you are giving a sales pitch or presenting to the board, make sure to check out Slidegeeks first
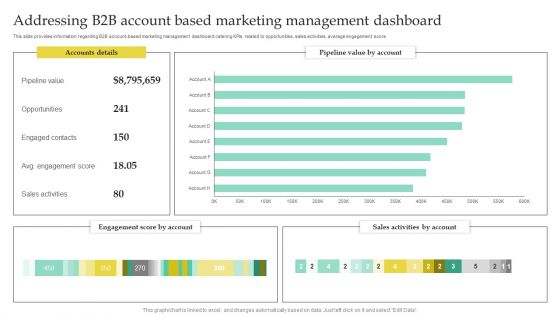
Addressing B2B Account Based Marketing Management Dashboard Elements PDF
This slide provides information regarding B2B account-based marketing management dashboard catering KPIs related to opportunities, sales activities, average engagement score. If you are looking for a format to display your unique thoughts, then the professionally designed Addressing B2B Account Based Marketing Management Dashboard Elements PDF is the one for you. You can use it as a Google Slides template or a PowerPoint template. Incorporate impressive visuals, symbols, images, and other charts. Modify or reorganize the text boxes as you desire. Experiment with shade schemes and font pairings. Alter, share or cooperate with other people on your work. Download Addressing B2B Account Based Marketing Management Dashboard Elements PDF and find out how to give a successful presentation. Present a perfect display to your team and make your presentation unforgettable.

Smartphone Game Development And Advertising Technique Casual Gaming User Demographics And Daily Time Mockup PDF
If you are looking for a format to display your unique thoughts, then the professionally designed Smartphone Game Development And Advertising Technique Casual Gaming User Demographics And Daily Time Mockup PDF is the one for you. You can use it as a Google Slides template or a PowerPoint template. Incorporate impressive visuals, symbols, images, and other charts. Modify or reorganize the text boxes as you desire. Experiment with shade schemes and font pairings. Alter, share or cooperate with other people on your work. Download Smartphone Game Development And Advertising Technique Casual Gaming User Demographics And Daily Time Mockup PDF and find out how to give a successful presentation. Present a perfect display to your team and make your presentation unforgettable.
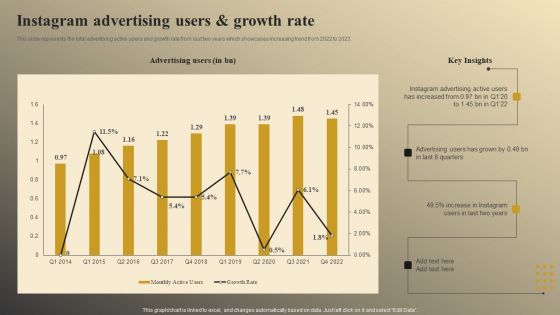
Instagram Advertising Users And Growth Rate Inspiration PDF
This slide represents the total advertising active users and growth rate from last two years which showcases increasing trend from 2022 to 2023. If you are looking for a format to display your unique thoughts, then the professionally designed Instagram Advertising Users And Growth Rate Inspiration PDF is the one for you. You can use it as a Google Slides template or a PowerPoint template. Incorporate impressive visuals, symbols, images, and other charts. Modify or reorganize the text boxes as you desire. Experiment with shade schemes and font pairings. Alter, share or cooperate with other people on your work. Download Instagram Advertising Users And Growth Rate Inspiration PDF and find out how to give a successful presentation. Present a perfect display to your team and make your presentation unforgettable.
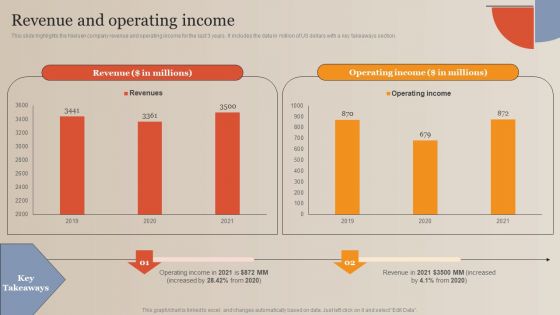
Market Study Company Outline Revenue And Operating Income Themes PDF
This slide highlights the Nielsen company revenue and operating income for the last 3 years. It includes the data in million of US dollars with a key takeaways section. Slidegeeks is here to make your presentations a breeze with Market Study Company Outline Revenue And Operating Income Themes PDF With our easy to use and customizable templates, you can focus on delivering your ideas rather than worrying about formatting. With a variety of designs to choose from, you are sure to find one that suits your needs. And with animations and unique photos, illustrations, and fonts, you can make your presentation pop. So whether you are giving a sales pitch or presenting to the board, make sure to check out Slidegeeks first.
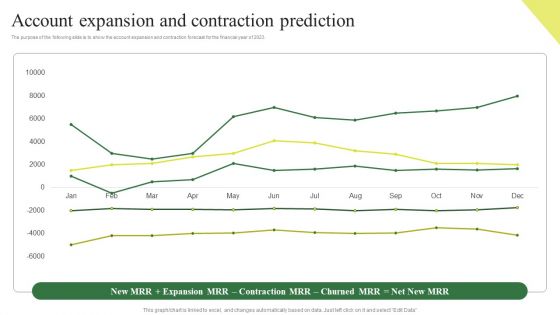
Consumption Based Pricing Model Account Expansion And Contraction Prediction Inspiration PDF
The purpose of the following slide is to show the account expansion and contraction forecast for the financial year of 2023. If you are looking for a format to display your unique thoughts, then the professionally designed Consumption Based Pricing Model Account Expansion And Contraction Prediction Inspiration PDF is the one for you. You can use it as a Google Slides template or a PowerPoint template. Incorporate impressive visuals, symbols, images, and other charts. Modify or reorganize the text boxes as you desire. Experiment with shade schemes and font pairings. Alter, share or cooperate with other people on your work. Download Consumption Based Pricing Model Account Expansion And Contraction Prediction Inspiration PDF and find out how to give a successful presentation. Present a perfect display to your team and make your presentation unforgettable.
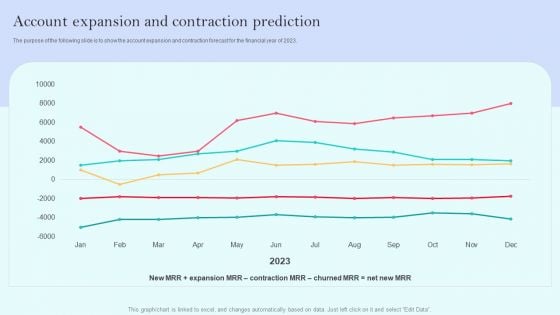
Recurring Income Generation Model Account Expansion And Contraction Prediction Demonstration PDF
The purpose of the following slide is to show the account expansion and contraction forecast for the financial year of 2023. If you are looking for a format to display your unique thoughts, then the professionally designed Recurring Income Generation Model Account Expansion And Contraction Prediction Demonstration PDF is the one for you. You can use it as a Google Slides template or a PowerPoint template. Incorporate impressive visuals, symbols, images, and other charts. Modify or reorganize the text boxes as you desire. Experiment with shade schemes and font pairings. Alter, share or cooperate with other people on your work. Download Recurring Income Generation Model Account Expansion And Contraction Prediction Demonstration PDF and find out how to give a successful presentation. Present a perfect display to your team and make your presentation unforgettable.
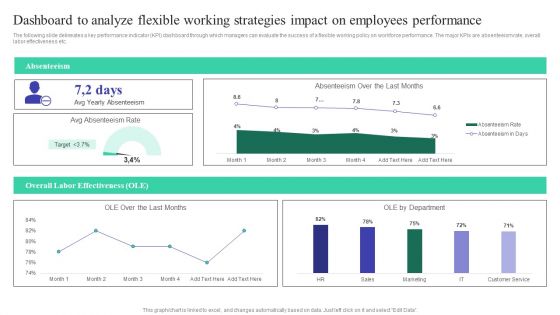
Dashboard To Analyze Flexible Working Strategies Impact On Employees Performance Professional PDF
The following slide delineates a key performance indicator KPI dashboard through which managers can evaluate the success of a flexible working policy on workforce performance. The major KPIs are absenteeism rate, overall labor effectiveness etc. If you are looking for a format to display your unique thoughts, then the professionally designed Dashboard To Analyze Flexible Working Strategies Impact On Employees Performance Professional PDF is the one for you. You can use it as a Google Slides template or a PowerPoint template. Incorporate impressive visuals, symbols, images, and other charts. Modify or reorganize the text boxes as you desire. Experiment with shade schemes and font pairings. Alter, share or cooperate with other people on your work. Download Dashboard To Analyze Flexible Working Strategies Impact On Employees Performance Professional PDF and find out how to give a successful presentation. Present a perfect display to your team and make your presentation unforgettable.
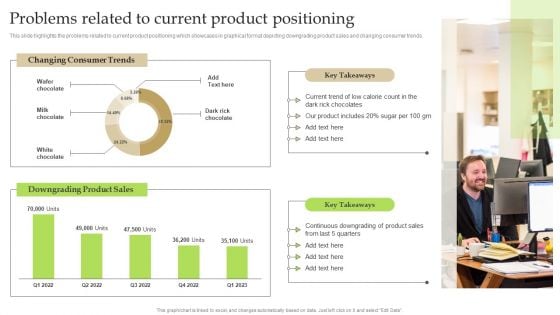
Problems Related To Current Product Positioning Ppt PowerPoint Presentation Diagram Graph Charts PDF
This slide highlights the problems related to current product positioning which showcases in graphical format depicting downgrading product sales and changing consumer trends. Do you have an important presentation coming up Are you looking for something that will make your presentation stand out from the rest Look no further than Problems Related To Current Product Positioning Ppt PowerPoint Presentation Diagram Graph Charts PDF. With our professional designs, you can trust that your presentation will pop and make delivering it a smooth process. And with Slidegeeks, you can trust that your presentation will be unique and memorable. So why wait Grab Problems Related To Current Product Positioning Ppt PowerPoint Presentation Diagram Graph Charts PDF today and make your presentation stand out from the rest

Mitigating Sales Risks With Strategic Action Planning Assessing Impact Of Sales Risk Management Diagrams PDF
The following slide highlights some key performance indicators KPIs to measure the influence of executing sales risk management strategies on revenue performance. It includes elements such as target attainment rate, gross profit, annual growth rate etc. If you are looking for a format to display your unique thoughts, then the professionally designed Mitigating Sales Risks With Strategic Action Planning Assessing Impact Of Sales Risk Management Diagrams PDF is the one for you. You can use it as a Google Slides template or a PowerPoint template. Incorporate impressive visuals, symbols, images, and other charts. Modify or reorganize the text boxes as you desire. Experiment with shade schemes and font pairings. Alter, share or cooperate with other people on your work. Download Mitigating Sales Risks With Strategic Action Planning Assessing Impact Of Sales Risk Management Diagrams PDF and find out how to give a successful presentation. Present a perfect display to your team and make your presentation unforgettable.
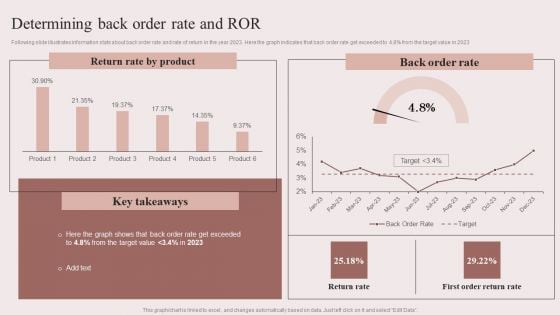
Enhancing Retail Process By Effective Inventory Management Determining Back Order Rate And ROR Information PDF
Following slide illustrates information stats about back order rate and rate of return in the year 2023. Here the graph indicates that back order rate get exceeded to 4.8percent from the target value in 2023 Slidegeeks is here to make your presentations a breeze with Enhancing Retail Process By Effective Inventory Management Determining Back Order Rate And ROR Information PDF With our easy to use and customizable templates, you can focus on delivering your ideas rather than worrying about formatting. With a variety of designs to choose from, you are sure to find one that suits your needs. And with animations and unique photos, illustrations, and fonts, you can make your presentation pop. So whether you are giving a sales pitch or presenting to the board, make sure to check out Slidegeeks first.
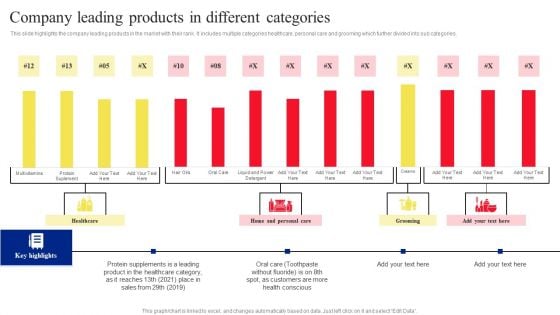
Company Leading Products In Different Categories Rules PDF
This slide highlights the company leading products in the market with their rank. It includes multiple categories healthcare, personal care and grooming which further divided into sub categories. Slidegeeks is here to make your presentations a breeze with Company Leading Products In Different Categories Rules PDF With our easy to use and customizable templates, you can focus on delivering your ideas rather than worrying about formatting. With a variety of designs to choose from, you are sure to find one that suits your needs. And with animations and unique photos, illustrations, and fonts, you can make your presentation pop. So whether you are giving a sales pitch or presenting to the board, make sure to check out Slidegeeks first.
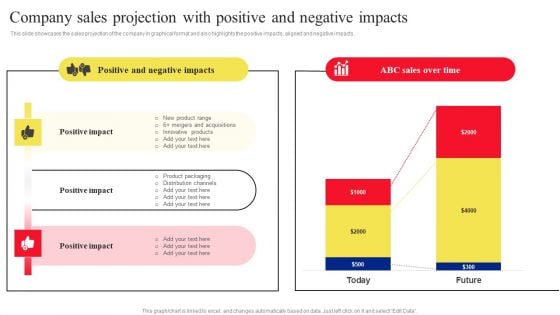
Company Sales Projection With Positive And Negative Impacts Information PDF
This slide showcases the sales projection of the company in graphical format and also highlights the positive impacts, aligned and negative impacts. Are you in need of a template that can accommodate all of your creative concepts This one is crafted professionally and can be altered to fit any style. Use it with Google Slides or PowerPoint. Include striking photographs, symbols, depictions, and other visuals. Fill, move around, or remove text boxes as desired. Test out color palettes and font mixtures. Edit and save your work, or work with colleagues. Download Company Sales Projection With Positive And Negative Impacts Information PDF and observe how to make your presentation outstanding. Give an impeccable presentation to your group and make your presentation unforgettable.
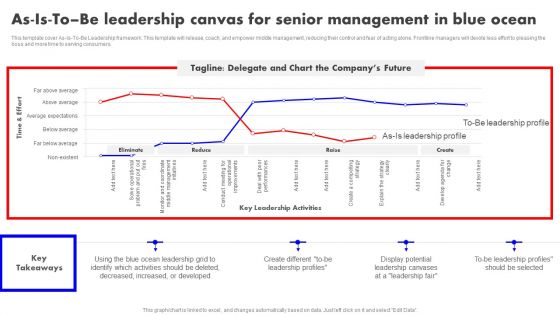
Detailed Analysis Of Red Ocean Vs Blue Ocean Approach As Is To Be Leadership Canvas Senior Management Topics PDF
This template cover As-Is-To-Be Leadership framework. This template will release, coach, and empower middle management, reducing their control and fear of acting alone. Frontline managers will devote less effort to pleasing the boss and more time to serving consumers. Slidegeeks is here to make your presentations a breeze with Detailed Analysis Of Red Ocean Vs Blue Ocean Approach As Is To Be Leadership Canvas Senior Management Topics PDF With our easy to use and customizable templates, you can focus on delivering your ideas rather than worrying about formatting. With a variety of designs to choose from, you are sure to find one that suits your needs. And with animations and unique photos, illustrations, and fonts, you can make your presentation pop. So whether you are giving a sales pitch or presenting to the board, make sure to check out Slidegeeks first.
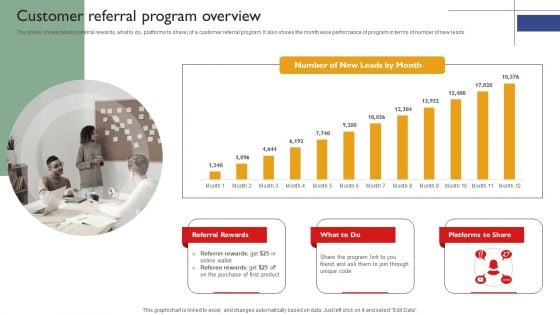
Techniques To Enhance Brand Awareness Customer Referral Program Overview Structure PDF
The slides shows details referral rewards, what to do, platforms to share of a customer referral program. It also shows the month wise performance of program in terms of number of new leads If you are looking for a format to display your unique thoughts, then the professionally designed Techniques To Enhance Brand Awareness Customer Referral Program Overview Structure PDF is the one for you. You can use it as a Google Slides template or a PowerPoint template. Incorporate impressive visuals, symbols, images, and other charts. Modify or reorganize the text boxes as you desire. Experiment with shade schemes and font pairings. Alter, share or cooperate with other people on your work. Download Techniques To Enhance Brand Awareness Customer Referral Program Overview Structure PDF and find out how to give a successful presentation. Present a perfect display to your team and make your presentation unforgettable.
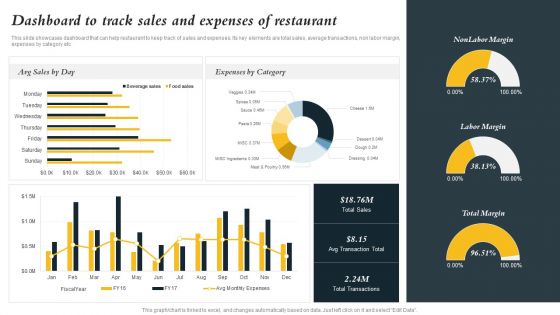
Marketing Initiatives To Promote Fast Food Cafe Dashboard To Track Sales And Expenses Of Restaurant Portrait PDF
This slide showcases dashboard that can help restaurant to keep track of sales and expenses. Its key elements are total sales, average transactions, non labor margin, expenses by category etc If you are looking for a format to display your unique thoughts, then the professionally designed Marketing Initiatives To Promote Fast Food Cafe Dashboard To Track Sales And Expenses Of Restaurant Portrait PDF is the one for you. You can use it as a Google Slides template or a PowerPoint template. Incorporate impressive visuals, symbols, images, and other charts. Modify or reorganize the text boxes as you desire. Experiment with shade schemes and font pairings. Alter, share or cooperate with other people on your work. Download Marketing Initiatives To Promote Fast Food Cafe Dashboard To Track Sales And Expenses Of Restaurant Portrait PDF and find out how to give a successful presentation. Present a perfect display to your team and make your presentation unforgettable.
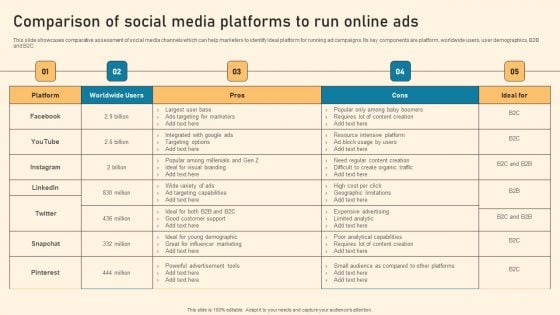
Comparison Of Social Media Platforms To Run Online Ads Ppt PowerPoint Presentation Diagram Graph Charts PDF
This slide showcases comparative assessment of social media channels which can help marketers to identify ideal platform for running ad campaigns. Its key components are platform, worldwide users, user demographics, B2B and B2C Slidegeeks is here to make your presentations a breeze with Comparison Of Social Media Platforms To Run Online Ads Ppt PowerPoint Presentation Diagram Graph Charts PDF With our easy to use and customizable templates, you can focus on delivering your ideas rather than worrying about formatting. With a variety of designs to choose from, you are sure to find one that suits your needs. And with animations and unique photos, illustrations, and fonts, you can make your presentation pop. So whether you are giving a sales pitch or presenting to the board, make sure to check out Slidegeeks first.
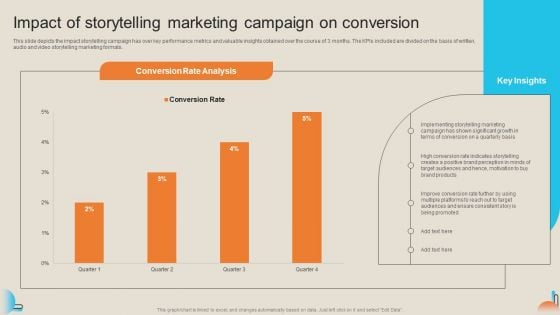
Comprehensive Guide For Storytelling Promotion Impact Of Storytelling Marketing Campaign On Conversion Demonstration PDF
This slide depicts the impact storytelling campaign has over key performance metrics and valuable insights obtained over the course of 3 months. The KPIs included are divided on the basis of written, audio and video storytelling marketing formats. Formulating a presentation can take up a lot of effort and time, so the content and message should always be the primary focus. The visuals of the PowerPoint can enhance the presenters message, so our Comprehensive Guide For Storytelling Promotion Impact Of Storytelling Marketing Campaign On Conversion Demonstration PDF was created to help save time. Instead of worrying about the design, the presenter can concentrate on the message while our designers work on creating the ideal templates for whatever situation is needed. Slidegeeks has experts for everything from amazing designs to valuable content, we have put everything into Comprehensive Guide For Storytelling Promotion Impact Of Storytelling Marketing Campaign On Conversion Demonstration PDF

Niche Marketing Guide To Target Specific Customer Groups Perform Social Media Audit To Breakdown Brochure PDF
The following slide represents social media content audit to plan and minimize content gap for website traffic generation. It includes elements such as age, gender, technology breakdown, device, web, authors by age etc. Slidegeeks is here to make your presentations a breeze with Niche Marketing Guide To Target Specific Customer Groups Perform Social Media Audit To Breakdown Brochure PDF With our easy to use and customizable templates, you can focus on delivering your ideas rather than worrying about formatting. With a variety of designs to choose from, you are sure to find one that suits your needs. And with animations and unique photos, illustrations, and fonts, you can make your presentation pop. So whether you are giving a sales pitch or presenting to the board, make sure to check out Slidegeeks first.
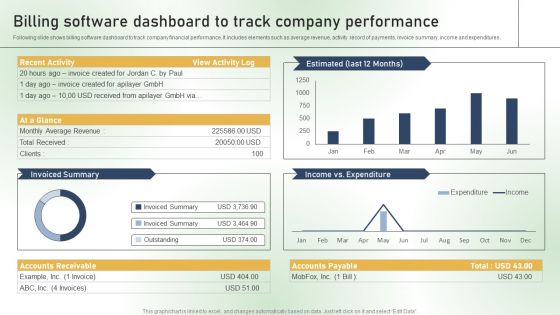
Billing Software Dashboard To Track Company Performance Ppt PowerPoint Presentation File Professional PDF
Following slide shows billing software dashboard to track company financial performance. It includes elements such as average revenue, activity record of payments, invoice summary, income and expenditures. Slidegeeks is here to make your presentations a breeze with Billing Software Dashboard To Track Company Performance Ppt PowerPoint Presentation File Professional PDF With our easy to use and customizable templates, you can focus on delivering your ideas rather than worrying about formatting. With a variety of designs to choose from, you are sure to find one that suits your needs. And with animations and unique photos, illustrations, and fonts, you can make your presentation pop. So whether you are giving a sales pitch or presenting to the board, make sure to check out Slidegeeks first.
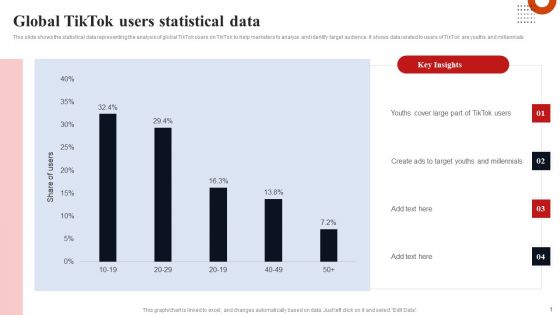
Global Tiktok Users Statistical Data Portrait PDF
This slide shows the statistical data representing the analysis of global TikTok users on TikTok to help marketers to analyze and identify target audience. It shows data related to users of TikTok are youths and millennials. If you are looking for a format to display your unique thoughts, then the professionally designed Global Tiktok Users Statistical Data Portrait PDF is the one for you. You can use it as a Google Slides template or a PowerPoint template. Incorporate impressive visuals, symbols, images, and other charts. Modify or reorganize the text boxes as you desire. Experiment with shade schemes and font pairings. Alter, share or cooperate with other people on your work. Download Global Tiktok Users Statistical Data Portrait PDF and find out how to give a successful presentation. Present a perfect display to your team and make your presentation unforgettable.
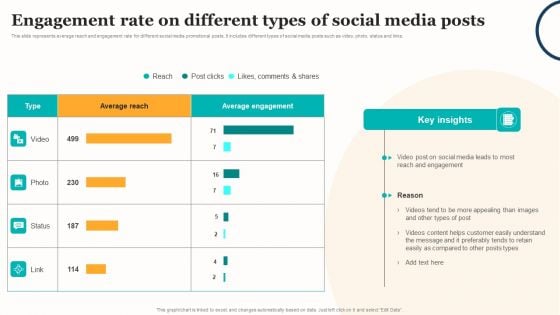
Marketing Strategy For A Recruitment Company Engagement Rate On Different Types Of Social Media Posts Inspiration PDF
This slide represents average reach and engagement rate for different social media promotional posts. It includes different types of social media posts such as video, photo, status and links. Slidegeeks is here to make your presentations a breeze with Marketing Strategy For A Recruitment Company Engagement Rate On Different Types Of Social Media Posts Inspiration PDF With our easy to use and customizable templates, you can focus on delivering your ideas rather than worrying about formatting. With a variety of designs to choose from, you are sure to find one that suits your needs. And with animations and unique photos, illustrations, and fonts, you can make your presentation pop. So whether you are giving a sales pitch or presenting to the board, make sure to check out Slidegeeks first.
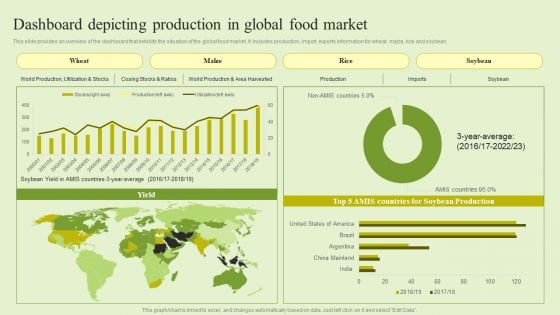
Agriculture Marketing Strategy To Improve Revenue Performance Dashboard Depicting Production Global Food Market Brochure PDF
This slide provides an overview of the dashboard that exhibits the situation of the global food market. It includes production, import, exports information for wheat, maize, rice and soybean. If you are looking for a format to display your unique thoughts, then the professionally designed Agriculture Marketing Strategy To Improve Revenue Performance Dashboard Depicting Production Global Food Market Brochure PDF is the one for you. You can use it as a Google Slides template or a PowerPoint template. Incorporate impressive visuals, symbols, images, and other charts. Modify or reorganize the text boxes as you desire. Experiment with shade schemes and font pairings. Alter, share or cooperate with other people on your work. Download Agriculture Marketing Strategy To Improve Revenue Performance Dashboard Depicting Production Global Food Market Brochure PDF and find out how to give a successful presentation. Present a perfect display to your team and make your presentation unforgettable.
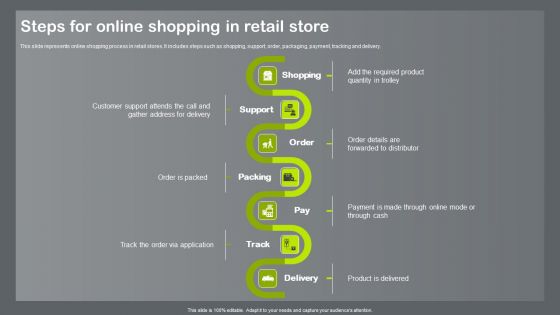
Shopper And Client Marketing Plan To Boost Sales Steps For Online Shopping In Retail Store Infographics PDF
This slide represents key statistics for shopper marketing that enables marketers to study store shopping behavior of customers. It includes loyalty program, shopping experience etc. Slidegeeks is here to make your presentations a breeze with Shopper And Client Marketing Plan To Boost Sales Steps For Online Shopping In Retail Store Infographics PDF With our easy to use and customizable templates, you can focus on delivering your ideas rather than worrying about formatting. With a variety of designs to choose from, you are sure to find one that suits your needs. And with animations and unique photos, illustrations, and fonts, you can make your presentation pop. So whether you are giving a sales pitch or presenting to the board, make sure to check out Slidegeeks first.
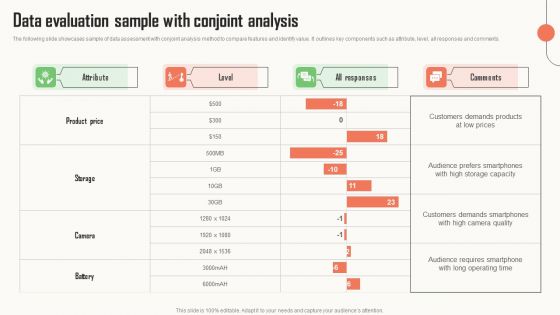
Strategic Market Insight Implementation Guide Data Evaluation Sample With Conjoint Analysis Background PDF
The following slide showcases sample of data assessment with conjoint analysis method to compare features and identify value. It outlines key components such as attribute, level, all responses and comments. Slidegeeks is here to make your presentations a breeze with Strategic Market Insight Implementation Guide Data Evaluation Sample With Conjoint Analysis Background PDF With our easy to use and customizable templates, you can focus on delivering your ideas rather than worrying about formatting. With a variety of designs to choose from, you are sure to find one that suits your needs. And with animations and unique photos, illustrations, and fonts, you can make your presentation pop. So whether you are giving a sales pitch or presenting to the board, make sure to check out Slidegeeks first.
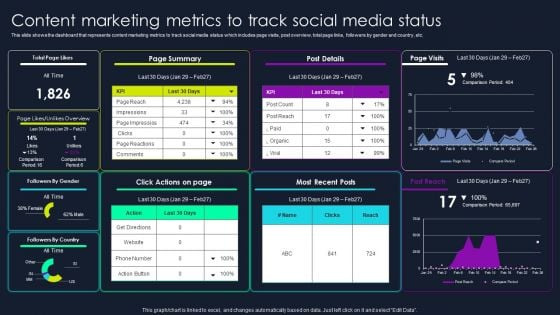
Lead Nurturing Tactics For Lead Generation Content Marketing Metrics To Track Social Media Status Topics PDF
This slide shows the dashboard that represents content marketing metrics to track social media status which includes page visits, post overview, total page links, followers by gender and country, etc. Slidegeeks is here to make your presentations a breeze with Lead Nurturing Tactics For Lead Generation Content Marketing Metrics To Track Social Media Status Topics PDF With our easy to use and customizable templates, you can focus on delivering your ideas rather than worrying about formatting. With a variety of designs to choose from, you are sure to find one that suits your needs. And with animations and unique photos, illustrations, and fonts, you can make your presentation pop. So whether you are giving a sales pitch or presenting to the board, make sure to check out Slidegeeks first.
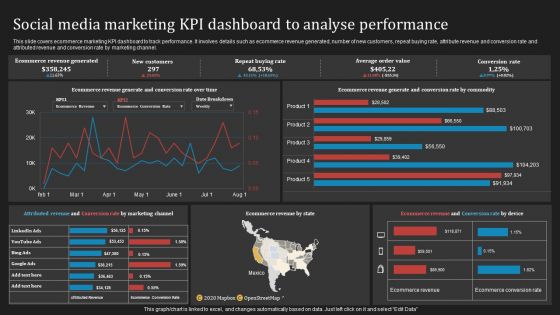
Deploying B2B Advertising Techniques For Lead Generation Social Media Marketing Kpi Dashboard Analyse Pictures PDF
This slide covers ecommerce marketing KPI dashboard to track performance. It involves details such as ecommerce revenue generated, number of new customers, repeat buying rate, attribute revenue and conversion rate and attributed revenue and conversion rate by marketing channel. Slidegeeks is here to make your presentations a breeze with Deploying B2B Advertising Techniques For Lead Generation Social Media Marketing Kpi Dashboard Analyse Pictures PDF With our easy to use and customizable templates, you can focus on delivering your ideas rather than worrying about formatting. With a variety of designs to choose from, you are sure to find one that suits your needs. And with animations and unique photos, illustrations, and fonts, you can make your presentation pop. So whether you are giving a sales pitch or presenting to the board, make sure to check out Slidegeeks first.
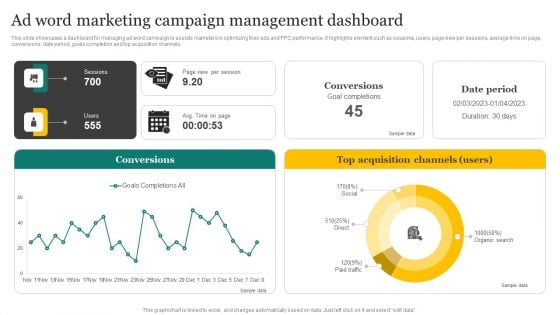
Strategic Promotion Plan Development Stages Ad Word Marketing Campaign Management Dashboard Template PDF
This slide showcases a dashboard for managing ad word campaign to assists marketers in optimizing their ads and PPC performance. It highlights element such as sessions, users, page view per sessions, average time on page, conversions, date period, goals completion and top acquisition channels. If you are looking for a format to display your unique thoughts, then the professionally designed Strategic Promotion Plan Development Stages Ad Word Marketing Campaign Management Dashboard Template PDF is the one for you. You can use it as a Google Slides template or a PowerPoint template. Incorporate impressive visuals, symbols, images, and other charts. Modify or reorganize the text boxes as you desire. Experiment with shade schemes and font pairings. Alter, share or cooperate with other people on your work. Download Strategic Promotion Plan Development Stages Ad Word Marketing Campaign Management Dashboard Template PDF and find out how to give a successful presentation. Present a perfect display to your team and make your presentation unforgettable.
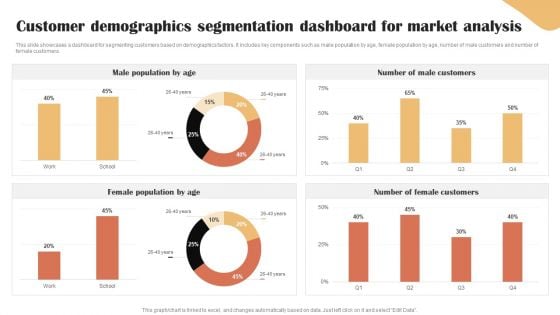
Categories Of Segmenting And Profiling Customers Customer Demographics Segmentation Dashboard Guidelines PDF
This slide showcases a dashboard for segmenting customers based on demographics factors. It includes key components such as make population by age, female population by age, number of male customers and number of female customers. If you are looking for a format to display your unique thoughts, then the professionally designed Categories Of Segmenting And Profiling Customers Customer Demographics Segmentation Dashboard Guidelines PDF is the one for you. You can use it as a Google Slides template or a PowerPoint template. Incorporate impressive visuals, symbols, images, and other charts. Modify or reorganize the text boxes as you desire. Experiment with shade schemes and font pairings. Alter, share or cooperate with other people on your work. Download Categories Of Segmenting And Profiling Customers Customer Demographics Segmentation Dashboard Guidelines PDF and find out how to give a successful presentation. Present a perfect display to your team and make your presentation unforgettable.
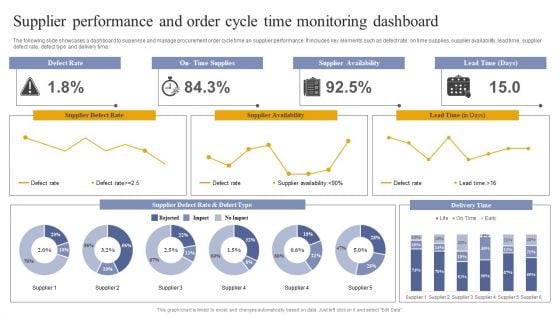
Vendor Performance Analysis And Administration Supplier Performance And Order Cycle Time Monitoring Dashboard Themes PDF
The following slide showcases a dashboard to supervise and manage procurement order cycle time an supplier performance. It includes key elements such as defect rate, on time supplies, supplier availability, lead time, supplier defect rate, defect type and delivery time. If you are looking for a format to display your unique thoughts, then the professionally designed Vendor Performance Analysis And Administration Supplier Performance And Order Cycle Time Monitoring Dashboard Themes PDF is the one for you. You can use it as a Google Slides template or a PowerPoint template. Incorporate impressive visuals, symbols, images, and other charts. Modify or reorganize the text boxes as you desire. Experiment with shade schemes and font pairings. Alter, share or cooperate with other people on your work. Download Vendor Performance Analysis And Administration Supplier Performance And Order Cycle Time Monitoring Dashboard Themes PDF and find out how to give a successful presentation. Present a perfect display to your team and make your presentation unforgettable.
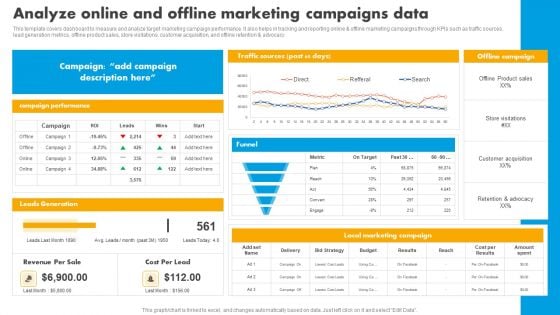
Analyze Online And Offline Marketing Campaigns Data Graphics PDF
This template covers dashboard to measure and analyze target marketing campaign performance. It also helps in tracking and reporting online and offline marketing campaigns through KPIs such as traffic sources, lead generation metrics, offline product sales, store visitations, customer acquisition, and offline retention and advocacy. If you are looking for a format to display your unique thoughts, then the professionally designed Analyze Online And Offline Marketing Campaigns Data Graphics PDF is the one for you. You can use it as a Google Slides template or a PowerPoint template. Incorporate impressive visuals, symbols, images, and other charts. Modify or reorganize the text boxes as you desire. Experiment with shade schemes and font pairings. Alter, share or cooperate with other people on your work. Download Analyze Online And Offline Marketing Campaigns Data Graphics PDF and find out how to give a successful presentation. Present a perfect display to your team and make your presentation unforgettable.
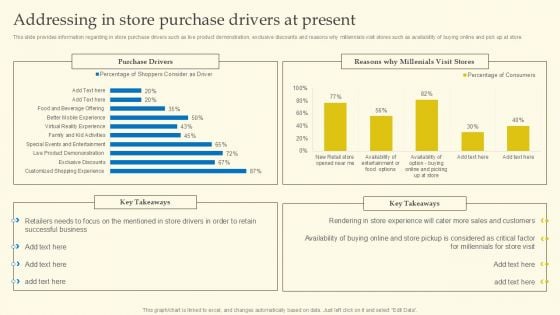
Experiential Shopping Outlet Overview Addressing In Store Purchase Drivers At Present Topics PDF
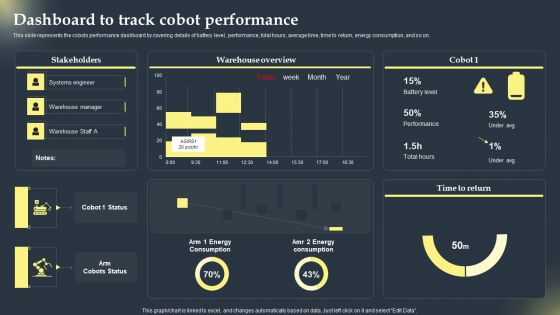
Cobots Global Statistics Dashboard To Track Cobot Performance Mockup PDF
This slide represents the cobots performance dashboard by covering details of battery level, performance, total hours, average time, time to return, energy consumption, and so on. If you are looking for a format to display your unique thoughts, then the professionally designed Cobots Global Statistics Dashboard To Track Cobot Performance Mockup PDF is the one for you. You can use it as a Google Slides template or a PowerPoint template. Incorporate impressive visuals, symbols, images, and other charts. Modify or reorganize the text boxes as you desire. Experiment with shade schemes and font pairings. Alter, share or cooperate with other people on your work. Download Cobots Global Statistics Dashboard To Track Cobot Performance Mockup PDF and find out how to give a successful presentation. Present a perfect display to your team and make your presentation unforgettable.
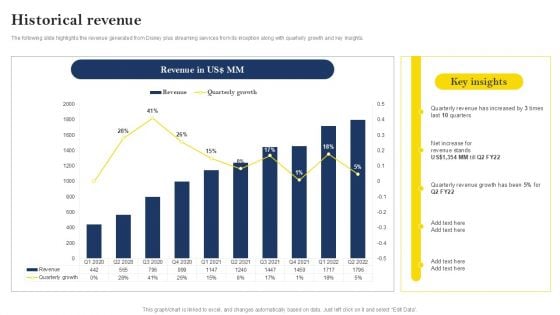
Over The Top Platform Company Profile Historical Revenue Topics PDF

Determining The Most Important Leadership Skill To Succeed In Digital Workspace Ppt Infographic Template Example Topics PDF
Purpose of this slide is to addresses information statistics about the skills that a leader should have in order to successfully navigate digital transformation. Skills covered are transformative vision, forward thinking, change oriented etc. If you are looking for a format to display your unique thoughts, then the professionally designed Determining The Most Important Leadership Skill To Succeed In Digital Workspace Ppt Infographic Template Example Topics PDF is the one for you. You can use it as a Google Slides template or a PowerPoint template. Incorporate impressive visuals, symbols, images, and other charts. Modify or reorganize the text boxes as you desire. Experiment with shade schemes and font pairings. Alter, share or cooperate with other people on your work. Download Determining The Most Important Leadership Skill To Succeed In Digital Workspace Ppt Infographic Template Example Topics PDF and find out how to give a successful presentation. Present a perfect display to your team and make your presentation unforgettable.
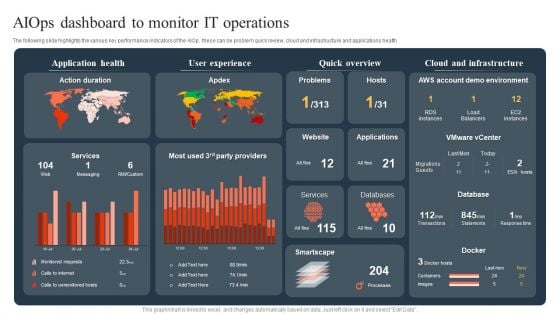
Ml And Big Data In Information Technology Processes Aiops Dashboard To Monitor IT Operations Sample PDF
The following slide highlights the various key performance indicators of the AIOp, these can be problem quick review, cloud and infrastructure and applications health If you are looking for a format to display your unique thoughts, then the professionally designed Ml And Big Data In Information Technology Processes Aiops Dashboard To Monitor IT Operations Sample PDF is the one for you. You can use it as a Google Slides template or a PowerPoint template. Incorporate impressive visuals, symbols, images, and other charts. Modify or reorganize the text boxes as you desire. Experiment with shade schemes and font pairings. Alter, share or cooperate with other people on your work. Download Ml And Big Data In Information Technology Processes Aiops Dashboard To Monitor IT Operations Sample PDF and find out how to give a successful presentation. Present a perfect display to your team and make your presentation unforgettable.
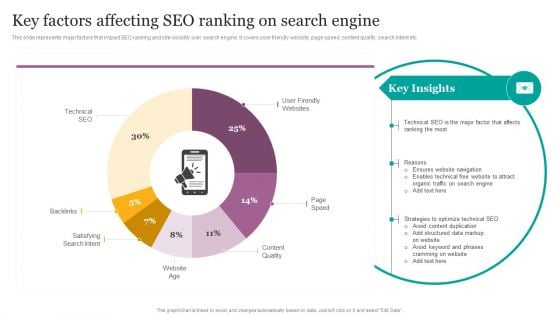
Key Factors Affecting SEO Ranking On Search Engine Ppt Infographics Diagrams PDF
This slide represents major factors that impact SEO ranking and site visibility over search engine. It covers user friendly website, page speed, content quality, search intent etc. If you are looking for a format to display your unique thoughts, then the professionally designed Key Factors Affecting SEO Ranking On Search Engine Ppt Infographics Diagrams PDF is the one for you. You can use it as a Google Slides template or a PowerPoint template. Incorporate impressive visuals, symbols, images, and other charts. Modify or reorganize the text boxes as you desire. Experiment with shade schemes and font pairings. Alter, share or cooperate with other people on your work. Download Key Factors Affecting SEO Ranking On Search Engine Ppt Infographics Diagrams PDF and find out how to give a successful presentation. Present a perfect display to your team and make your presentation unforgettable.
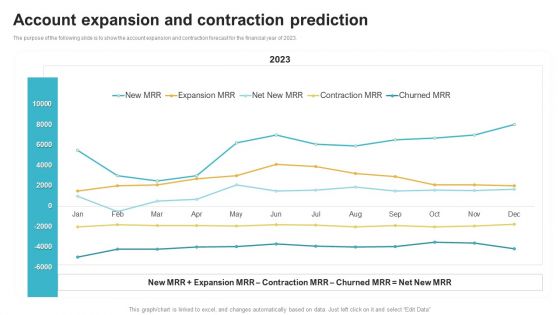
Saas Continuous Income Generation Model For Software Startup Account Expansion And Contraction Prediction Mockup PDF
The purpose of the following slide is to show the account expansion and contraction forecast for the financial year of 2023. If you are looking for a format to display your unique thoughts, then the professionally designed Saas Continuous Income Generation Model For Software Startup Account Expansion And Contraction Prediction Mockup PDF is the one for you. You can use it as a Google Slides template or a PowerPoint template. Incorporate impressive visuals, symbols, images, and other charts. Modify or reorganize the text boxes as you desire. Experiment with shade schemes and font pairings. Alter, share or cooperate with other people on your work. Download Saas Continuous Income Generation Model For Software Startup Account Expansion And Contraction Prediction Mockup PDF and find out how to give a successful presentation. Present a perfect display to your team and make your presentation unforgettable.
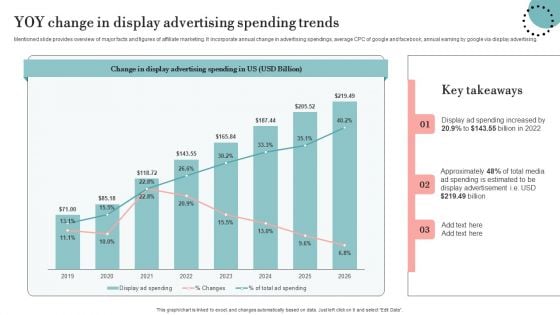
YOY Change In Display Advertising Spending Trends Rules PDF
Mentioned slide provides overview of major facts and figures of affiliate marketing. It incorporate annual change in advertising spendings, average CPC of google and facebook, annual earning by google via display advertising. Slidegeeks is here to make your presentations a breeze with YOY Change In Display Advertising Spending Trends Rules PDF With our easy to use and customizable templates, you can focus on delivering your ideas rather than worrying about formatting. With a variety of designs to choose from, you are sure to find one that suits your needs. And with animations and unique photos, illustrations, and fonts, you can make your presentation pop. So whether you are giving a sales pitch or presenting to the board, make sure to check out Slidegeeks first.
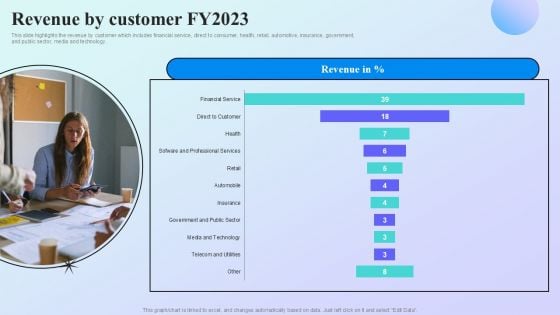
Information Analytics Company Outline Revenue By Customer Fy2023 Topics PDF
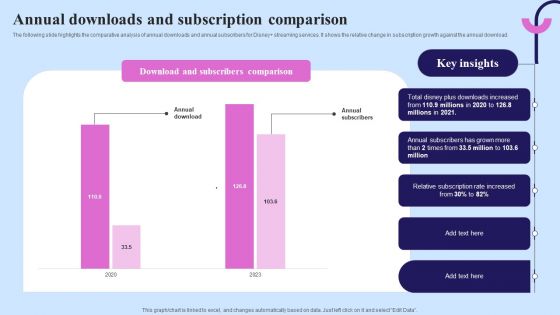
Video Streaming Technology Company Introduction Annual Downloads And Subscription Diagrams PDF
The following slide highlights the comparative analysis of annual downloads and annual subscribers for Disney plus streaming services. It shows the relative change in subscription growth against the annual download. If you are looking for a format to display your unique thoughts, then the professionally designed Video Streaming Technology Company Introduction Annual Downloads And Subscription Diagrams PDF is the one for you. You can use it as a Google Slides template or a PowerPoint template. Incorporate impressive visuals, symbols, images, and other charts. Modify or reorganize the text boxes as you desire. Experiment with shade schemes and font pairings. Alter, share or cooperate with other people on your work. Download Video Streaming Technology Company Introduction Annual Downloads And Subscription Diagrams PDF and find out how to give a successful presentation. Present a perfect display to your team and make your presentation unforgettable.
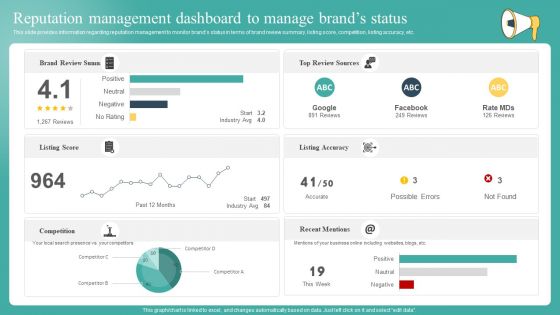
Reputation Management Dashboard To Manage Brands Status Designs PDF
This slide provides information regarding reputation management to monitor brands status in terms of brand review summary, listing score, competition, listing accuracy, etc. Slidegeeks is here to make your presentations a breeze with Reputation Management Dashboard To Manage Brands Status Designs PDF With our easy to use and customizable templates, you can focus on delivering your ideas rather than worrying about formatting. With a variety of designs to choose from, you are sure to find one that suits your needs. And with animations and unique photos, illustrations, and fonts, you can make your presentation pop. So whether you are giving a sales pitch or presenting to the board, make sure to check out Slidegeeks first.
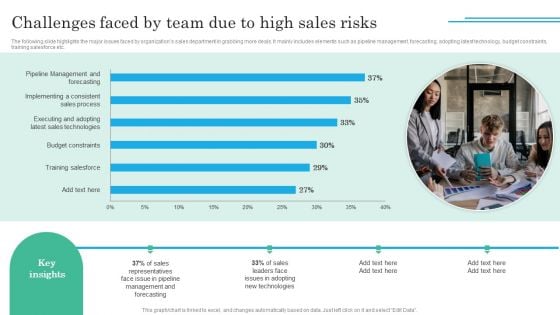
Implementing Sales Volatility Management Techniques Challenges Faced By Team Due To High Sales Risks Guidelines PDF
If you are looking for a format to display your unique thoughts, then the professionally designed Implementing Sales Volatility Management Techniques Challenges Faced By Team Due To High Sales Risks Guidelines PDF is the one for you. You can use it as a Google Slides template or a PowerPoint template. Incorporate impressive visuals, symbols, images, and other charts. Modify or reorganize the text boxes as you desire. Experiment with shade schemes and font pairings. Alter, share or cooperate with other people on your work. Download Implementing Sales Volatility Management Techniques Challenges Faced By Team Due To High Sales Risks Guidelines PDF and find out how to give a successful presentation. Present a perfect display to your team and make your presentation unforgettable.
Information Technology Solutions Company Outline Employee Count And Diversity Icons PDF
This slide focuses on employee count and diversity which shows employee by gender and functions such as data platforms and operations, general administration, management, etc Slidegeeks is here to make your presentations a breeze with Information Technology Solutions Company Outline Employee Count And Diversity Icons PDF With our easy to use and customizable templates, you can focus on delivering your ideas rather than worrying about formatting. With a variety of designs to choose from, you are sure to find one that suits your needs. And with animations and unique photos, illustrations, and fonts, you can make your presentation pop. So whether you are giving a sales pitch or presenting to the board, make sure to check out Slidegeeks first.
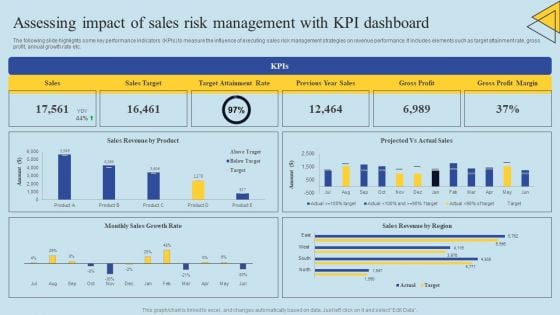
Determining Risks In Sales Administration Procedure Assessing Impact Of Sales Risk Management Sample PDF
The following slide highlights some key performance indicators KPIs to measure the influence of executing sales risk management strategies on revenue performance. It includes elements such as target attainment rate, gross profit, annual growth rate etc. If you are looking for a format to display your unique thoughts, then the professionally designed Determining Risks In Sales Administration Procedure Assessing Impact Of Sales Risk Management Sample PDF is the one for you. You can use it as a Google Slides template or a PowerPoint template. Incorporate impressive visuals, symbols, images, and other charts. Modify or reorganize the text boxes as you desire. Experiment with shade schemes and font pairings. Alter, share or cooperate with other people on your work. Download Determining Risks In Sales Administration Procedure Assessing Impact Of Sales Risk Management Sample PDF and find out how to give a successful presentation. Present a perfect display to your team and make your presentation unforgettable.
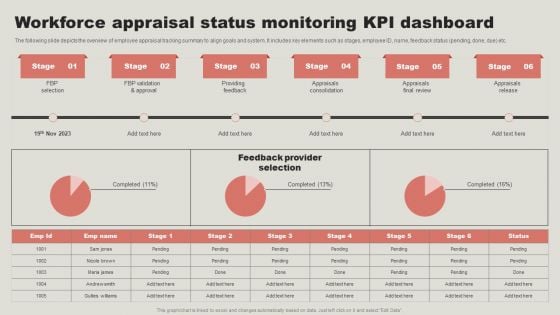
Workforce Appraisal Status Monitoring Kpi Dashboard Template PDF
The following slide depicts the overview of employee appraisal tracking summary to align goals and system. It includes key elements such as stages, employee ID, name, feedback status pending, done, due etc. Slidegeeks is here to make your presentations a breeze with Workforce Appraisal Status Monitoring Kpi Dashboard Template PDF With our easy to use and customizable templates, you can focus on delivering your ideas rather than worrying about formatting. With a variety of designs to choose from, you are sure to find one that suits your needs. And with animations and unique photos, illustrations, and fonts, you can make your presentation pop. So whether you are giving a sales pitch or presenting to the board, make sure to check out Slidegeeks first.
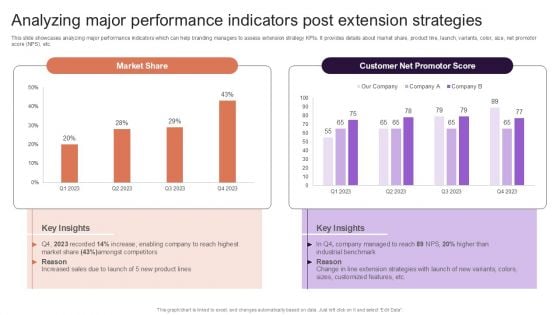
Implementing Brand Extension Initiatives For Apple Company Analyzing Major Performance Indicators Post Extension Topics PDF
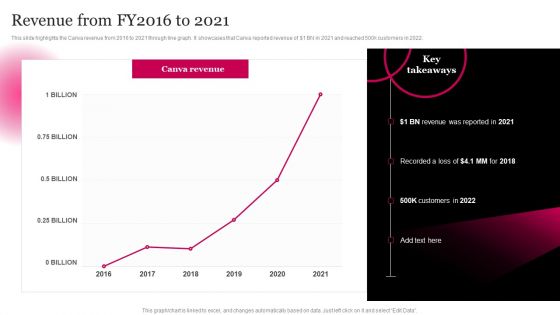
Picture Editing Company Outline Revenue From FY2016 To 2021 Rules PDF
This slide highlights the Canva revenue from 2016 to 2021 through line graph. It showcases that Canva reported revenue of doller 1 BN in 2021 and reached 500k customers in 2022. Slidegeeks is here to make your presentations a breeze with Picture Editing Company Outline Revenue From FY2016 To 2021 Rules PDF With our easy to use and customizable templates, you can focus on delivering your ideas rather than worrying about formatting. With a variety of designs to choose from, you are sure to find one that suits your needs. And with animations and unique photos, illustrations, and fonts, you can make your presentation pop. So whether you are giving a sales pitch or presenting to the board, make sure to check out Slidegeeks first.
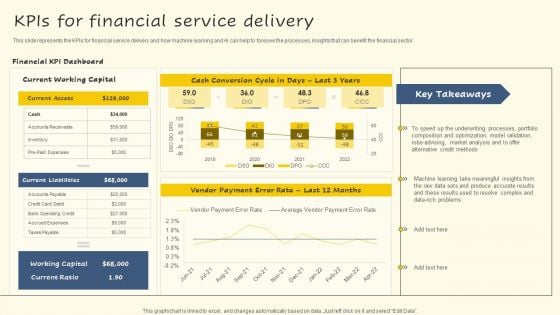
Kpis For Financial Service Delivery Background PDF
This slide represents the KPIs for financial service delivery and how machine learning and AI can help to foresee the processes, insights that can benefit the financial sector. If you are looking for a format to display your unique thoughts, then the professionally designed Kpis For Financial Service Delivery Background PDF is the one for you. You can use it as a Google Slides template or a PowerPoint template. Incorporate impressive visuals, symbols, images, and other charts. Modify or reorganize the text boxes as you desire. Experiment with shade schemes and font pairings. Alter, share or cooperate with other people on your work. Download Kpis For Financial Service Delivery Background PDF and find out how to give a successful presentation. Present a perfect display to your team and make your presentation unforgettable.
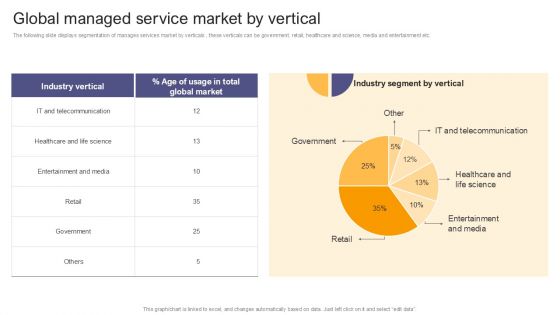
Per Device Pricing Strategy For Managed Solutions Global Managed Service Market By Vertical Topics PDF
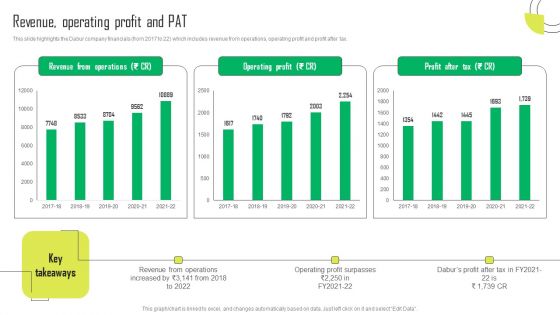
Herbal Products Company Profile Revenue Operating Profit And PAT Clipart PDF
This slide highlights the Dabur company financials from 2017 to 22 which includes revenue from operations, operating profit and profit after tax. Slidegeeks is here to make your presentations a breeze with Herbal Products Company Profile Revenue Operating Profit And PAT Clipart PDF With our easy to use and customizable templates, you can focus on delivering your ideas rather than worrying about formatting. With a variety of designs to choose from, you are sure to find one that suits your needs. And with animations and unique photos, illustrations, and fonts, you can make your presentation pop. So whether you are giving a sales pitch or presenting to the board, make sure to check out Slidegeeks first.
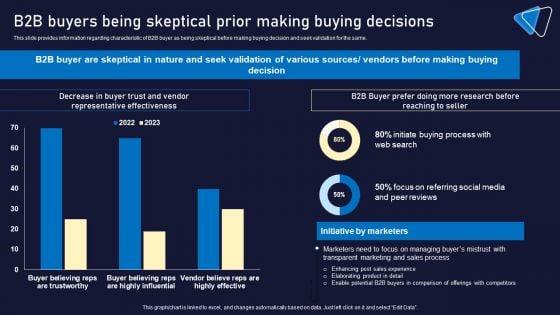
B2B Buyers Being Skeptical Prior Making Buying Decisions Information PDF
This slide provides information regarding characteristic of B2B buyer as being skeptical before making buying decision and seek validation for the same. If you are looking for a format to display your unique thoughts, then the professionally designed B2B Buyers Being Skeptical Prior Making Buying Decisions Information PDF is the one for you. You can use it as a Google Slides template or a PowerPoint template. Incorporate impressive visuals, symbols, images, and other charts. Modify or reorganize the text boxes as you desire. Experiment with shade schemes and font pairings. Alter, share or cooperate with other people on your work. Download B2B Buyers Being Skeptical Prior Making Buying Decisions Information PDF and find out how to give a successful presentation. Present a perfect display to your team and make your presentation unforgettable.
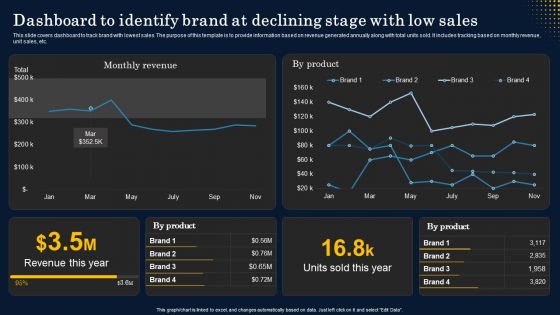
Dashboard To Identify Brand At Declining Stage With Low Sales Demonstration PDF
This slide covers dashboard to track brand with lowest sales. The purpose of this template is to provide information based on revenue generated annually along with total units sold. It includes tracking based on monthly revenue, unit sales, etc. If you are looking for a format to display your unique thoughts, then the professionally designed Dashboard To Identify Brand At Declining Stage With Low Sales Demonstration PDF is the one for you. You can use it as a Google Slides template or a PowerPoint template. Incorporate impressive visuals, symbols, images, and other charts. Modify or reorganize the text boxes as you desire. Experiment with shade schemes and font pairings. Alter, share or cooperate with other people on your work. Download Dashboard To Identify Brand At Declining Stage With Low Sales Demonstration PDF and find out how to give a successful presentation. Present a perfect display to your team and make your presentation unforgettable.
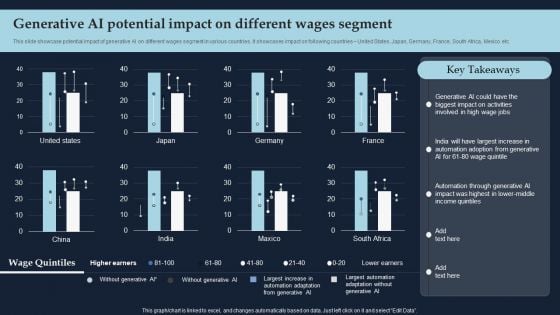
Generative AI Potential Impact On Different Wages Segment Topics PDF
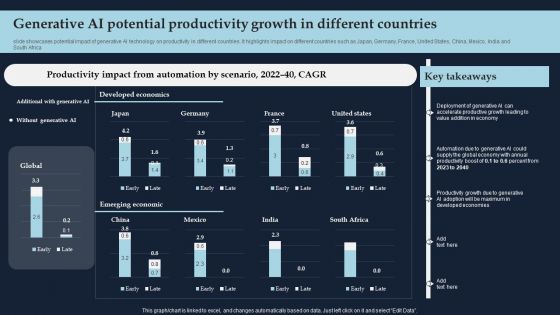
Generative AI Potential Productivity Growth In Different Countries Brochure PDF


 Continue with Email

 Home
Home


