Corporate Finance
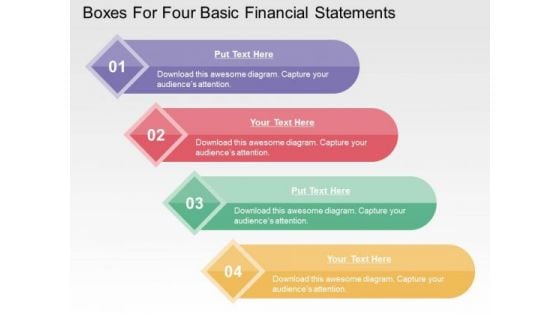
Boxes For Four Basic Financial Statements PowerPoint Templates
This business slide contains graphics of four text boxes. This diagram is suitable to present four basic financial statements. Visual effect of this diagram helps in maintaining the flow of the discussion and provides more clarity to the subject.
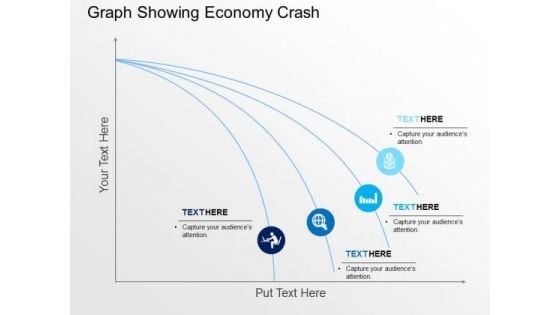
Graph Showing Economy Crash PowerPoint Templates
This business slide contains design of graph. This diagram is suitable to present downfall and economy crash. Visual effect of this diagram helps in maintaining the flow of the discussion and provides more clarity to the subject.

Illustration Of Dollar Growth Graph PowerPoint Template
This business slide contains graphics of dollar symbols on graph. This diagram helps to portray concept of financial planning. Present your views using this innovative slide and be assured of leaving a lasting impression.
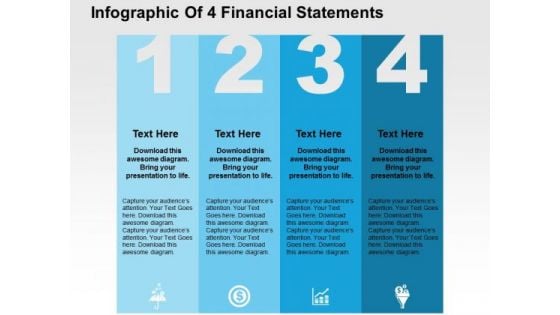
Infographic Of 4 Financial Statements PowerPoint Template
Four financial statements can be displayed in this business diagram. This slide contains the graphic of four text boxes with icons Use this editable slide to build quality presentation for your viewers.
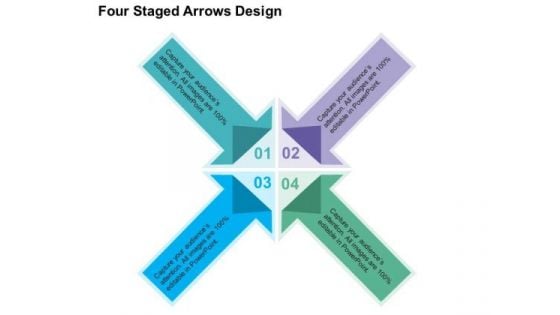
Four Staged Arrows Design PowerPoint Templates
This PowerPoint template has been designed with arrows infographic. You can easily impart your information with help of this PowerPoint template. The slide can be customized as per requirements of business education or any other theme.
Four Pencils Bar Graph And Icons Powerpoint Template
Develop competitive advantage with our above template which contains a diagram of five pencils bar graph. This diagram provides an effective way of displaying business information. You can edit text, color, shade and style as per you need.
Bar Graph With Five Icons Powerpoint Slides
This PowerPoint slide contains diagram bar graph with icons. This PPT slide helps to exhibit concepts of financial deal and planning. Use this business slide to make impressive presentations.
Checklist With Financial Planning Icons Powerpoint Slides
This PowerPoint template contains business checklist with icons. Download this diagram slide to display financial planning and analysis. Etch your views in the brains of your audience with this diagram slide.
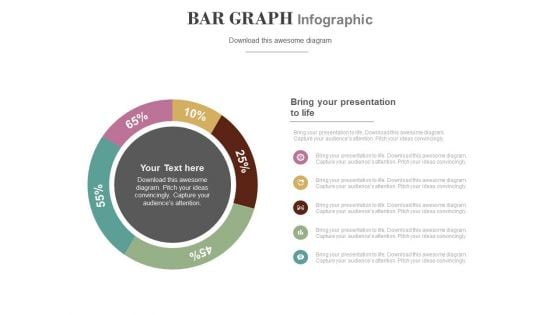
Circle Chart With Percentage Value Analysis Powerpoint Slides
This PowerPoint template has been designed with circular process diagram. This business diagram helps to exhibit financial process control and analysis. Use this diagram to visually support your content.
Four Linear Steps And Icons Powerpoint Slides
This PPT slide has been designed with four linear text boxes with icons. This PowerPoint template helps to exhibit process of business planning. Use this diagram slide to build an exclusive presentation.
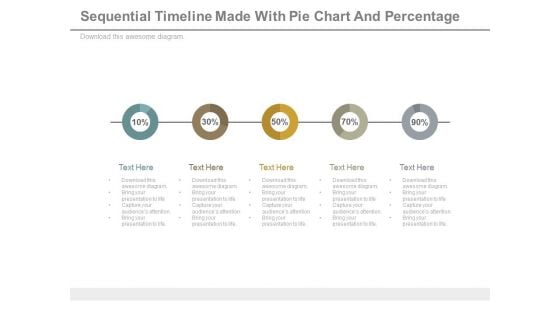
Sequential Timeline Diagram With Percentage Values Powerpoint Slides
This diagram contains graphics of linear circles timeline diagram. Download this diagram slide to display business planning and management. This diagram is editable you can edit text, color, shade and style as per you need.
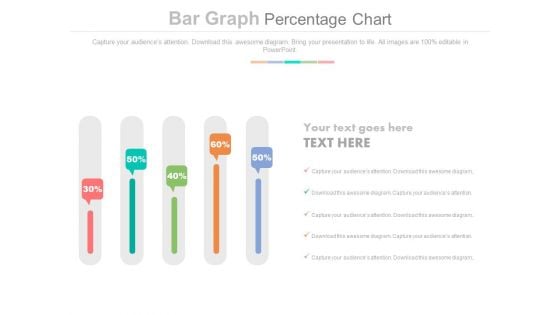
Sliders Percentage Data Chart Powerpoint Slides
This PowerPoint slide has been designed with slider chart and percentage data. This PPT diagram may be used to display business trends. This diagram slide can be used to make impressive presentations.
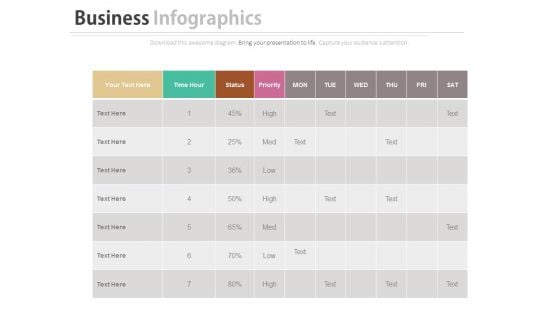
Work Sheet For Daily Activity Plan Schedule Powerpoint Slides
Our above business slide contains graphics of daily worksheet. This PowerPoint slide may be used to exhibit activity plan and schedule. Capture the attention of your audience with this slide.
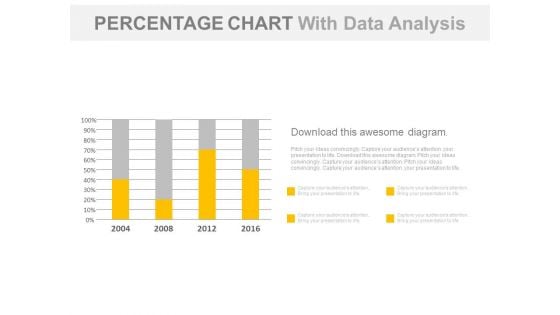
Year Based Chart With Percentage Data Analysis Powerpoint Slides
Our above business slide contains year based statistical chart. This PowerPoint template can be used to display percentage data analysis. Capture the attention of your audience with this slide.
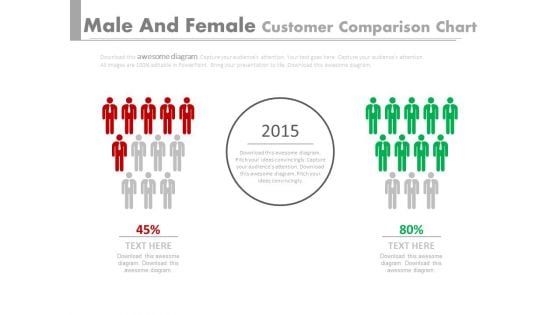
Red Green Teams Comparison Chart Powerpoint Slides
This PPT slide displays graphics of two red and green teams. Use this PPT design to display comparison of teams performances. This PowerPoint template can be customized as per requirements of business education or any other theme.
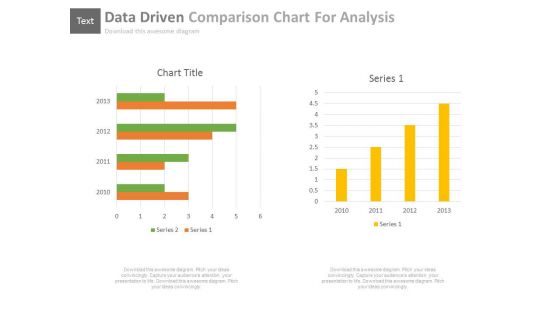
Data Driven Comparison Charts For Analysis Powerpoint Slides
You can download this PowerPoint template to display statistical data and analysis. This PPT slide contains data driven comparison charts. Draw an innovative business idea using this professional diagram.
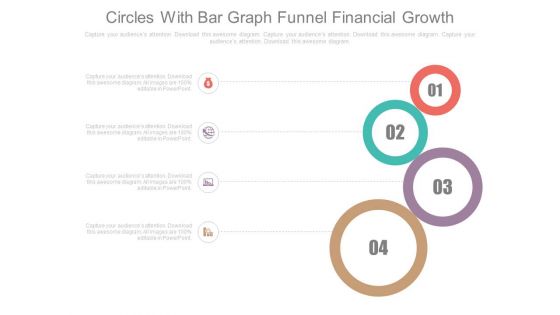
Four Circles Chart Financial Growth Steps Powerpoint Slides
Our professionally designed business diagram is as an effective tool for communicating cyclic processes. It contains circular graphics with icons. Above slide is suitable to display process management steps.
Four Clouds With Arrows And Icons Powerpoint Slides
This business slide displays diagram of four clouds with arrow and icons. Download this PowerPoint diagram to display technology development and management. Enlighten your audience with your breathtaking ideas.
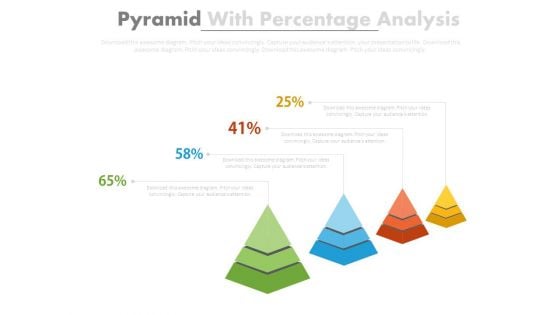
Four Pyramids With Growth Steps Powerpoint Slides
This business slide has been designed with four pyramids. This PowerPoint template may use to display sales growth and analysis. Prove the viability of your ideas using this impressive slide.
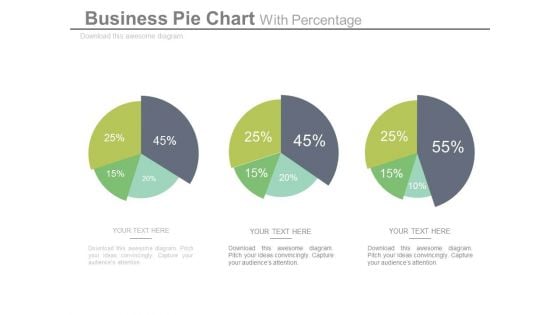
Pie Charts For Relative Comparison Study Powerpoint Slides
This power point template illustrates diagram of three pie charts with percentage values. This business slide can be used for relative comparison study. Present your views and ideas with this impressive slide.

Tap With Water Drops Diagram Powerpoint Slides
This PowerPoint template has been designed with graphics of tap with water drops. Download this business diagram to display save water concept. Present your views and ideas with this impressive design.
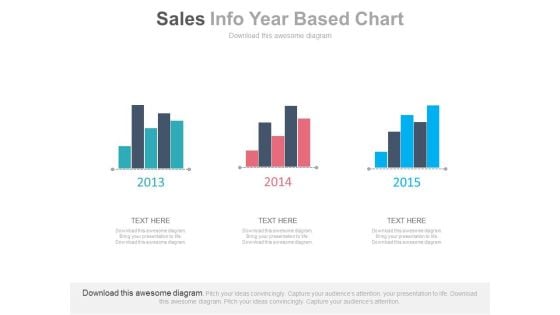
Three Years Sales Data Bar Graph Powerpoint Slides
This PowerPoint template has been designed with bar charts. This business slide may be used to display three years sales data for comparison. Present your views and ideas with this impressive design.
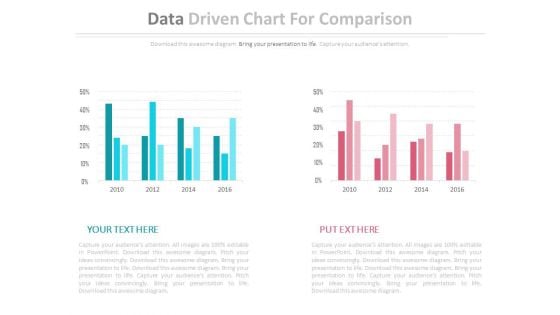
Two Data Driven Comparison Charts Powerpoint Slides
This PowerPoint template contains diagram of two data driven charts. You may use this PPT slide to depict strategic analysis for business. The color coding of this template is specifically designed to highlight you points.
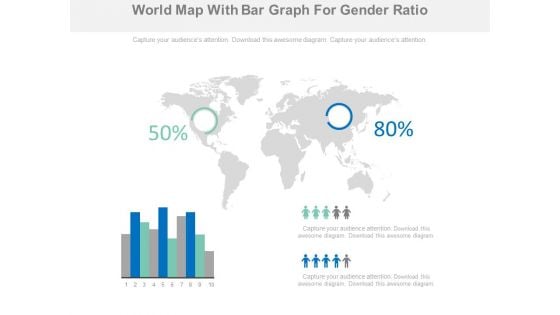
World Map With Bar Graph And Higher Population Areas Powerpoint Slides
This professionally designed PowerPoint template is as an effective tool to display high population areas on world. You can download this diagram to visually support your content. Above PPT slide is suitable for business presentation.
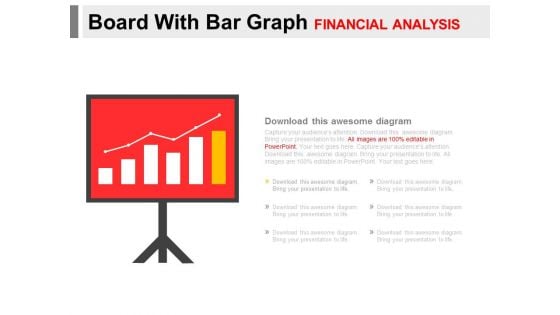
Board With Bar Graph For Financial Analysis Powerpoint Slides
You can download this PowerPoint template to display statistical data and analysis. This PPT slide contains display board with bar graph. Draw an innovative business idea using this professional diagram.
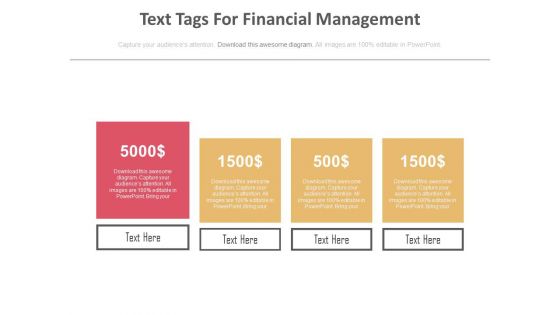
Four Text Tags For Financial Management Powerpoint Slides
Our professionally designed business diagram is as an effective tool for communicating concept of financial management. It contains graphics of four text tags. Above slide is also suitable to display financial planning and strategy.
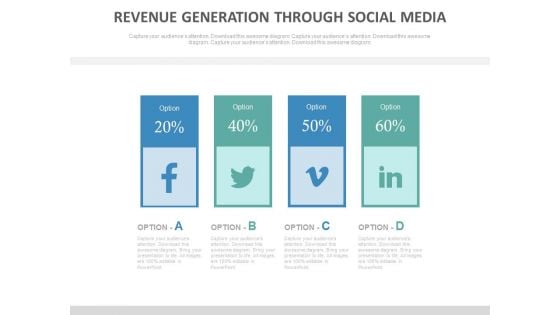
Revenue Generation Through Social Media Powerpoint Slides
This business slide has been designed with four text tags and social media icons. This PowerPoint template may use to display revenue generation through social media. Prove the viability of your ideas using this impressive slide.
Six Steps Circular Chart With Icons Powerpoint Slides
This PowerPoint template has been designed with six steps circular chart with icons. This PPT slide may be used to display business and management functions. Download this slide to build unique presentation.

Three Circles With Percentage Values For Financial Analysis Powerpoint Slides
This PowerPoint template has been designed with three circles and percentage values. This PPT slide may be used to display financial analysis for business. Download this slide to build unique presentation.
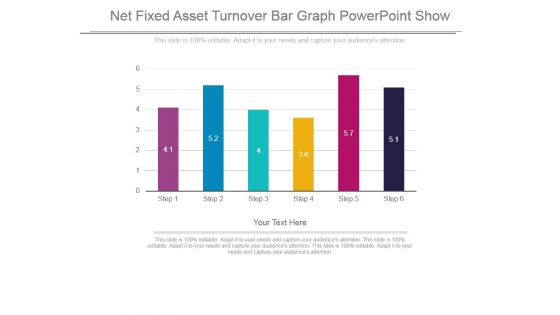
Net Fixed Asset Turnover Bar Graph Powerpoint Show
This is a net fixed asset turnover bar graph powerpoint show. This is a six stage process. The stages in this process are bar graph, presentation, strategy, business, management.

Company Marketing Analysis Report Ppt PowerPoint Presentation Complete Deck With Slides
Annual Report Production Timeline Ppt PowerPoint Presentation Complete Deck With Slides
This is a annual report production timeline ppt powerpoint presentation complete deck with slides. This is a one stage process. The stages in this process are annual report, production timeline, management, strategy, business.
Our Goal Ppt PowerPoint Presentation Inspiration Clipart Images
This is a our goal ppt powerpoint presentation inspiration clipart images. This is a two stage process. The stages in this process are our goals, target, success, business, achievement.
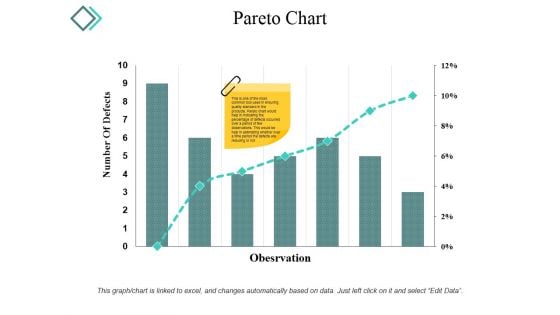
Pareto Chart Ppt PowerPoint Presentation Infographic Template Microsoft
This is a pareto chart ppt powerpoint presentation infographic template microsoft. This is a seven stage process. The stages in this process are number of defects, observation, graph, percentage, business.
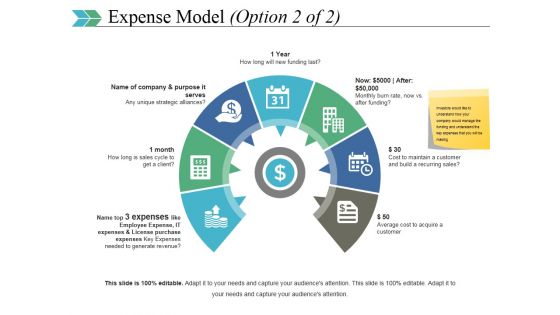
Expense Model Template 2 Ppt PowerPoint Presentation Pictures Grid
This is a expense model template 2 ppt powerpoint presentation pictures grid. This is a seven stage process. The stages in this process are icons, strategy, business, semi, management.
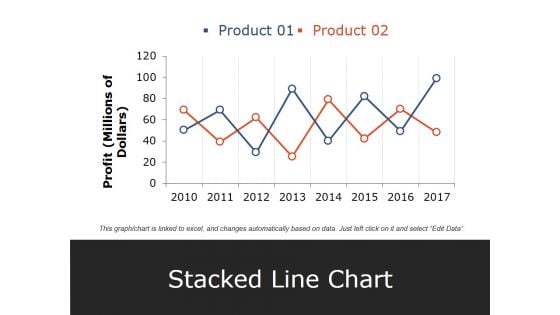
Stacked Line Chart Ppt PowerPoint Presentation Pictures Elements
This is a stacked line chart ppt powerpoint presentation pictures elements. This is a two stage process. The stages in this process are product, profit, stacked line chart, year, business.
Our Main Goal Ppt PowerPoint Presentation Pictures Background
This is a our main goal ppt powerpoint presentation pictures background. This is a one stage process. The stages in this process are our goals, target, success, business, achievement.
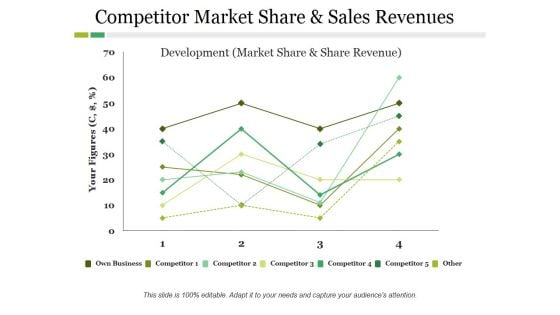
Competitor Market Share And Sales Revenues Ppt PowerPoint Presentation Ideas Slide
This is a competitor market share and sales revenues ppt powerpoint presentation ideas slide. This is a four stage process. The stages in this process are competitor, development, own business, your figures.
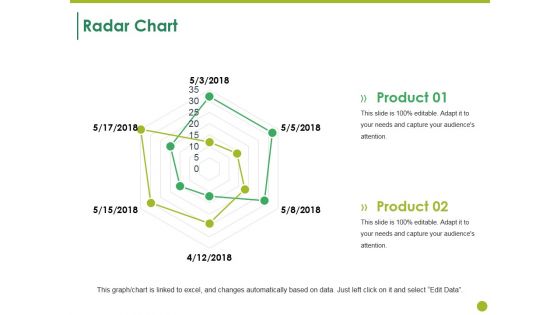
Radar Chart Ppt PowerPoint Presentation Summary Design Templates
This is a radar chart ppt powerpoint presentation summary design templates. This is a two stage process. The stages in this process are radar chart, product, shapes, business, marketing.
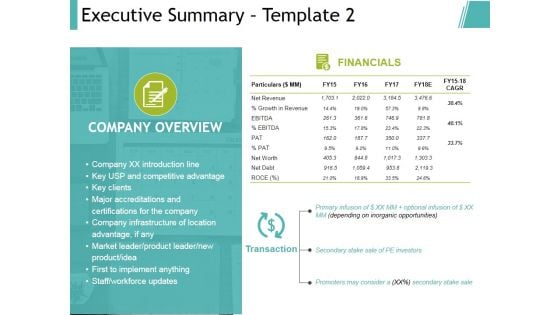
Executive Summary Template 2 Ppt PowerPoint Presentation Model Objects
This is a executive summary template 2 ppt powerpoint presentation model objects. This is a four stage process. The stages in this process are business, management, analysis, strategy, marketing.
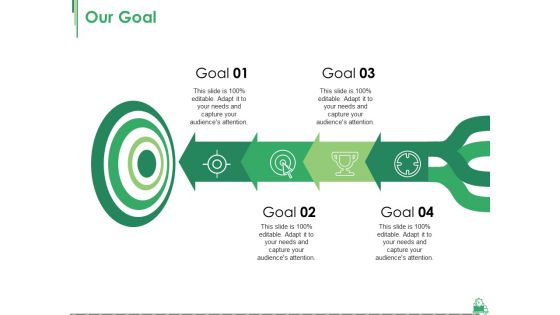
Our Goal Ppt PowerPoint Presentation Summary Graphic Tips
This is a our goal ppt powerpoint presentation summary graphic tips. This is a four stage process. The stages in this process are our goals, target, success, business, achievement.
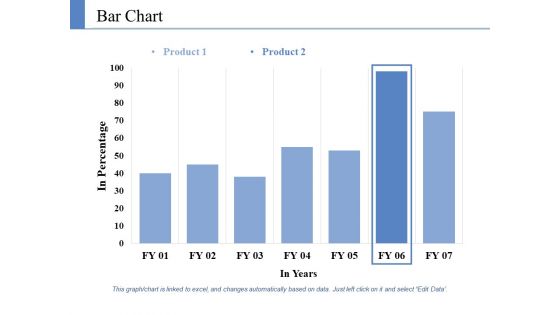
Bar Chart Ppt PowerPoint Presentation Ideas Deck
This is a bar chart ppt powerpoint presentation ideas deck. This is a two stage process. The stages in this process are product, in percentage, in years, financial, business.
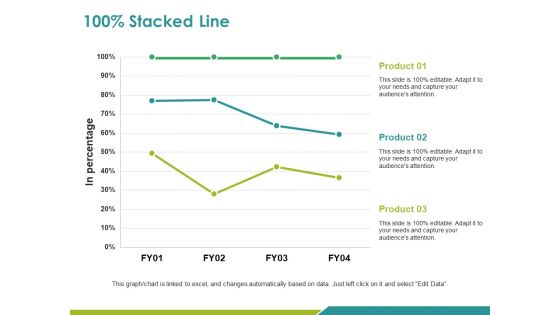
Stacked Line Ppt PowerPoint Presentation Pictures Example Topics
This is a stacked line ppt powerpoint presentation pictures example topics. This is a three stage process. The stages in this process are product, in percentage, stacked line, business, marketing.
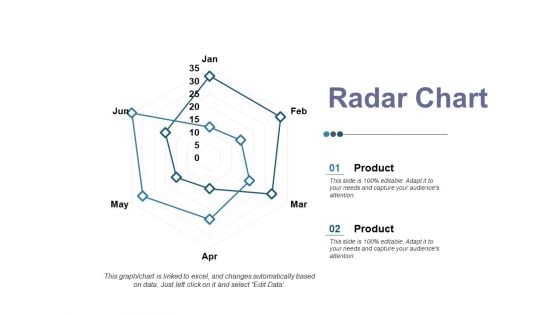
Radar Chart Ppt PowerPoint Presentation Professional Master Slide
This is a radar chart ppt powerpoint presentation professional master slide. This is a two stage process. The stages in this process are product, radar chart, financial, business, shape.

Brand Equity Ppt PowerPoint Presentation Complete Deck With Slides
This is a brand equity ppt powerpoint presentation complete deck with slides. This is a one stage process. The stages in this process are brand, equity, business, financial, technology.
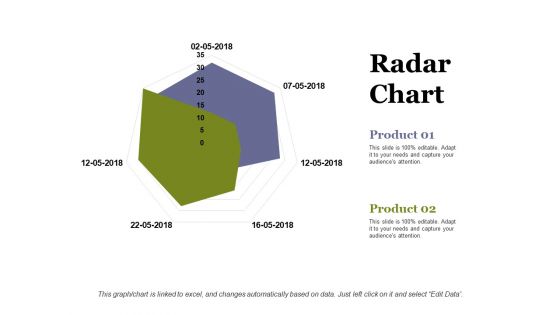
Radar Chart Ppt PowerPoint Presentation Infographic Template Information
This is a radar chart ppt powerpoint presentation infographic template information. This is a two stage process. The stages in this process are radar chart, product, business, marketing, shape.
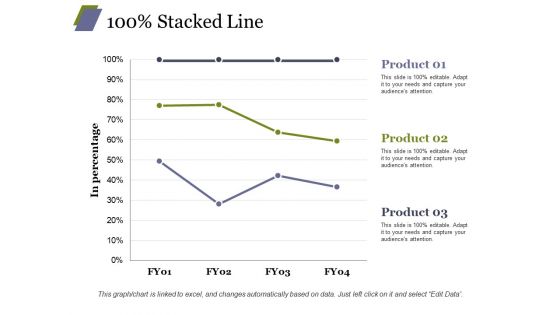
Stacked Line Ppt PowerPoint Presentation Infographics Vector
This is a stacked line ppt powerpoint presentation infographics vector. This is a three stage process. The stages in this process are product, stacked line, business, marketing, in percentage.
Our Target Ppt PowerPoint Presentation Icon Graphic Tips
This is a our target ppt powerpoint presentation icon graphic tips. This is a four stage process. The stages in this process are our goals, target, success, business, achievement.
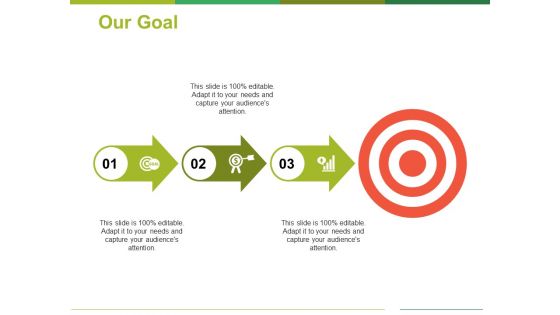
Our Goal Ppt PowerPoint Presentation Portfolio Example Introduction
This is a our goal ppt powerpoint presentation portfolio example introduction. This is a three stage process. The stages in this process are our goals, target, success, business, achievement.
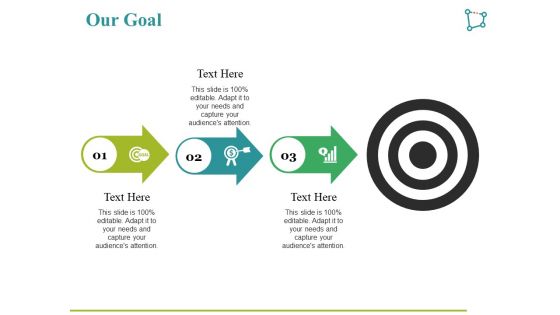
Our Goal Ppt PowerPoint Presentation Layouts Graphic Images
This is a our goal ppt powerpoint presentation layouts graphic images. This is a three stage process. The stages in this process are our goals, target, success, business, achievement.
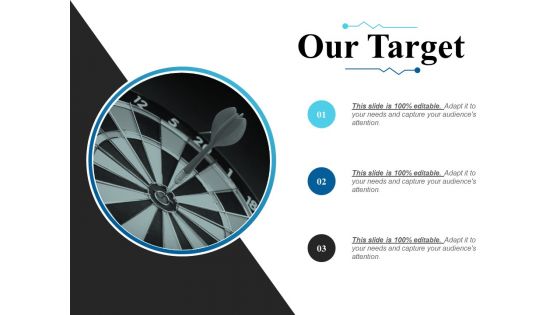
Our Target Ppt PowerPoint Presentation Outline Graphics Tutorials
This is a our target ppt powerpoint presentation outline graphics tutorials. This is a three stage process. The stages in this process are our goals, target, success, business, achievement.

Our Goal Ppt PowerPoint Presentation Infographic Template Background Image
This is a our goal ppt powerpoint presentation infographic template background image. This is a three stage process. The stages in this process are our goals, target, success, business, achievement.
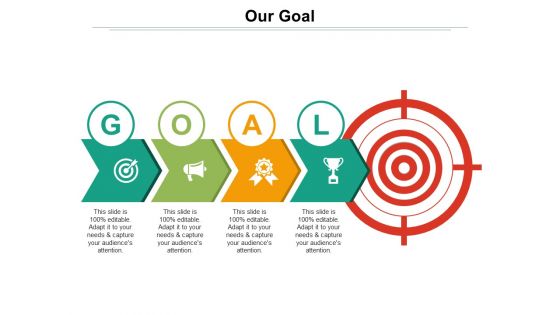
Our Goal Ppt PowerPoint Presentation Professional Graphic Tips
This is a our goal ppt powerpoint presentation professional graphic tips. This is a four stage process. The stages in this process are our goals, target, success, business, achievement.

Strategic Management Ppt PowerPoint Presentation Complete Deck With Slides
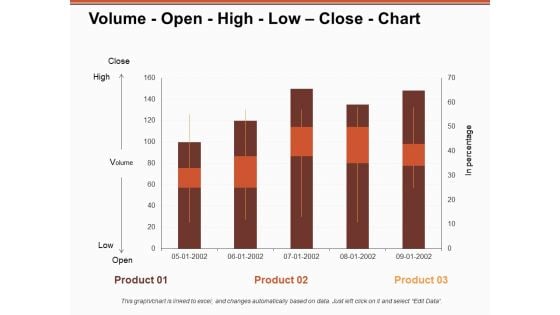
Volume Open High Low Close Chart Ppt PowerPoint Presentation Model Inspiration
This is a volume open high low close chart ppt powerpoint presentation model inspiration. This is a three stage process. The stages in this process are business, management, strategy, marketing, sales.
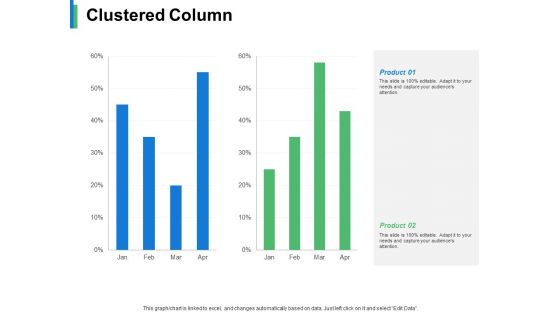
Clustered Column Product Ppt PowerPoint Presentation Inspiration Infographic Template
This is a clustered column product ppt powerpoint presentation inspiration infographic template. This is a two stage process. The stages in this process are business, management, marketing, strategy, sales.
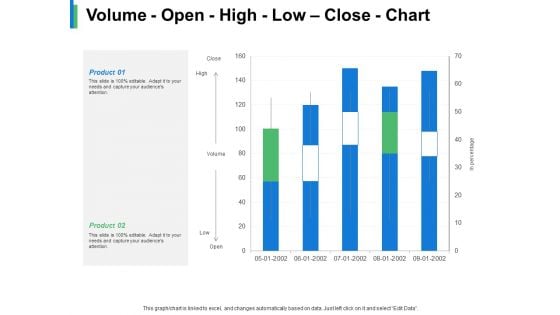
Volume Open High Low Close Chart Product Ppt PowerPoint Presentation Gallery Example
This is a volume open high low close chart product ppt powerpoint presentation gallery example. This is a two stage process. The stages in this process are business, management, strategy, marketing, sales.
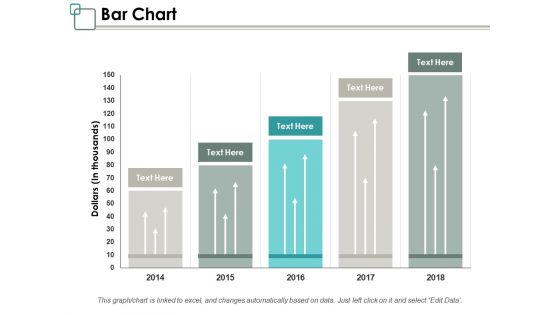
Bar Chart Ppt PowerPoint Presentation Infographic Template Graphics Design
This is a bar chart ppt powerpoint presentation infographic template graphics design. This is a five stage process. The stages in this process are management, marketing, business, percentage, product.
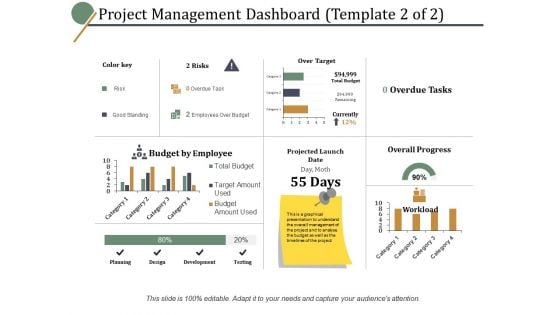
Project Management Dashboard Planning Ppt PowerPoint Presentation Ideas Graphics Design
This is a project management dashboard planning ppt powerpoint presentation ideas graphics design. This is a four stage process. The stages in this process are business, management, marketing, percentage.
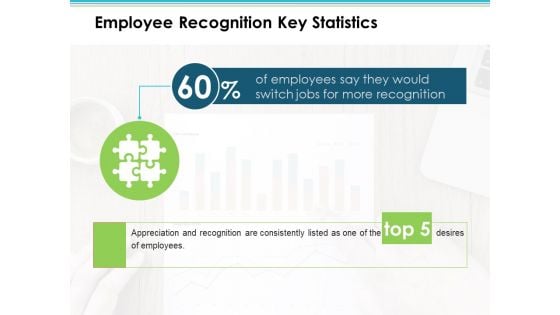
Employee Recognition Key Statistics Employee Value Proposition Ppt PowerPoint Presentation Layouts Mockup
This is a employee recognition key statistics employee value proposition ppt powerpoint presentation layouts mockup. This is a one stage process. The stages in this process are business, management, strategy, analysis, marketing.


 Continue with Email

 Home
Home


