Corporate Finance

Four Segments Human Body Chart Powerpoint Slides
Create dynamic presentations with our creative template of human body chart with four segments. This diagram may be used to present information in visual manner. Download this template to leave permanent impression on your audience.
Market Trends Chart With Percentage And Icons Powerpoint Slides
This PowerPoint template has been designed with graphics of chart with percentage values and icons. This PowerPoint template may be used to market trends and financial analysis. Prove the viability of your ideas using this impressive slide.

Three Options Tags For Financial Management Powerpoint Slides
Create dynamic presentations with our professional template containing three options tags. Use this diagram to exhibit financial management. Download this template to leave permanent impression on your audience.
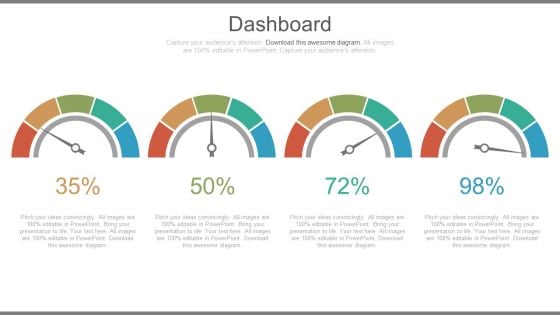
Dashboards For Profit Growth Analysis Powerpoint Slides
This PowerPoint template has been designed with graphics of dashboard. You may use this dashboard slide design to exhibit profit growth analysis. This PPT slide is powerful tool to describe your ideas.
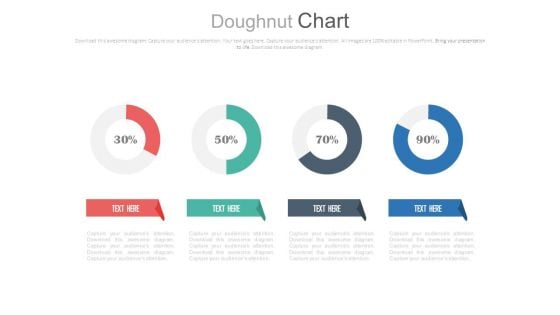
Four Circle Chart With Percentage Ratios Powerpoint Slides
This PowerPoint template has been designed with graphics of four circles and percentage ratios. You may use this dashboard slide design for topics like profit growth and financial planning. This PPT slide is powerful tool to describe your ideas.
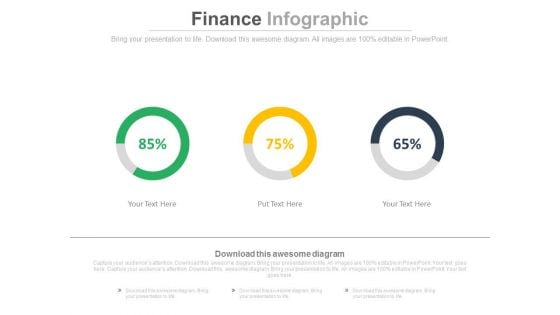
Linear Circles Percentage Analysis Charts Powerpoint Slides
This PowerPoint template has been designed with graphics of three circles and percentage ratios. You may use this dashboard slide design for topics like profit growth and financial planning. This PPT slide is powerful tool to describe your ideas.
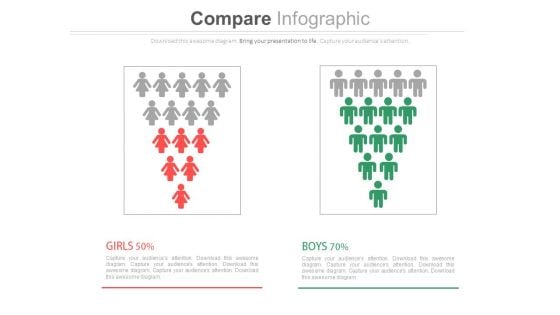
Male Female Gender Ratio Analysis Comparison Chart Powerpoint Slides
This PowerPoint template has been designed with graphics of male and female icons. Download this PPT slide to depict gender ratio analysis. Grab the attention of your team with this eye catching template.

Pyramid Design For Employees Performance Powerpoint Slides
This PPT slide contains graphics of pyramid diagram. Download this PowerPoint template to depict employee?s performance and analysis. Deliver amazing presentations to mesmerize your audience by using this slide design.
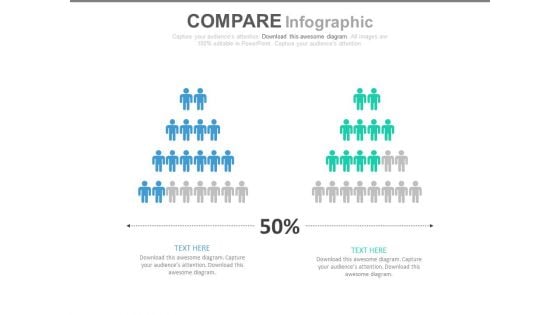
Two Teams Performance Analysis Chart Powerpoint Slides
This PowerPoint template has been designed with icons of two teams with percentage values. Download this PPT slide to depict team?s performance analysis. Deliver amazing presentations to mesmerize your audience by using this PPT slide design.
Bar Graph With Financial Ratio And Icons Powerpoint Template
Visually support your presentation with our above template containing bar graph with icons. This diagram slide helps to exhibit financial ratio analysis. Etch your views in the brains of your audience with this diagram slide.
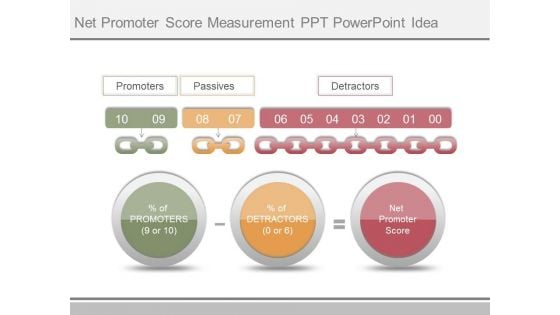
Net Promoter Score Measurement Ppt Powerpoint Idea
This is a net promoter score measurement ppt powerpoint idea. This is a three stage process. The stages in this process are promoters, passives, detractors, promoters, net promoter score.
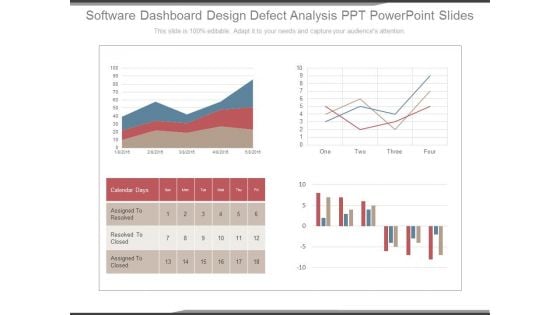
Software Dashboard Design Defect Analysis Ppt Powerpoint Slides
This is a software dashboard design defect analysis ppt powerpoint slides. This is a four stage process. The stages in this process are calendar days, assigned to resolved, resolved to closed, assigned to closed.
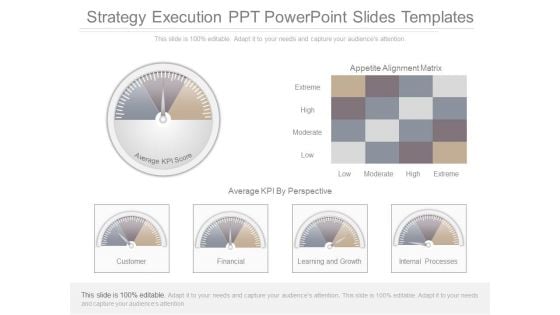
Strategy Execution Ppt Powerpoint Slides Templates
This is a strategy execution ppt powerpoint slides templates. This is a six stage process. The stages in this process are appetite alignment matrix, extreme, high, moderate, low, average kpi by prospective, customer, financial, learning and growth, internal processes, average kpi score.
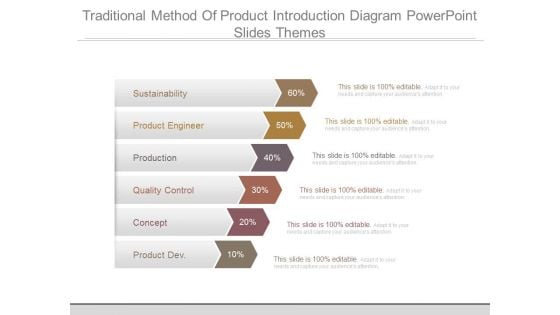
Traditional Method Of Product Introduction Diagram Powerpoint Slides Themes
This is a traditional method of product introduction diagram powerpoint slides themes. This is a six stage process. The stages in this process are sustainability, product engineer, production, quality control, concept, product dev.
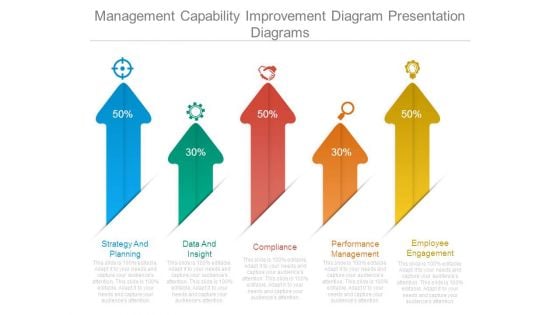
Management Capability Improvement Diagram Presentation Diagrams
This is a management capability improvement diagram presentation diagrams. This is a five stage process. The stages in this process are strategy and planning, data and insight, compliance, performance management, employee engagement.
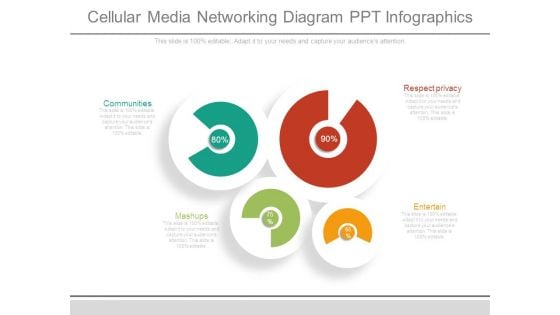
Cellular Media Networking Diagram Ppt Infographics
This is a cellular media networking diagram ppt infographics. This is a four stage process. The stages in this process are communities, mashups, respect privacy, entertain.
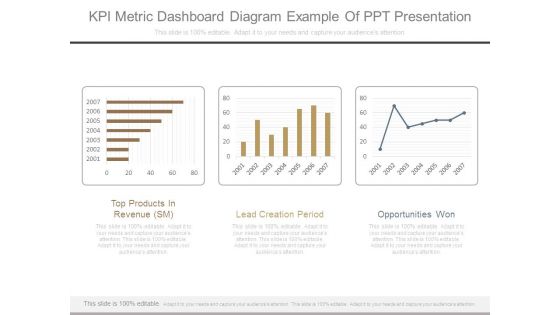
Kpi Metric Dashboard Diagram Example Of Ppt Presentation
This is a kpi metric dashboard diagram example of ppt presentation. This is a three stage process. The stages in this process are top products in revenue sm, lead creation period, opportunities won.
Human Performance Improvement Technologies Ppt Icon
This is a human performance improvement technologies ppt icon. This is a four stage process. The stages in this process are score, overall territory performance, weight.
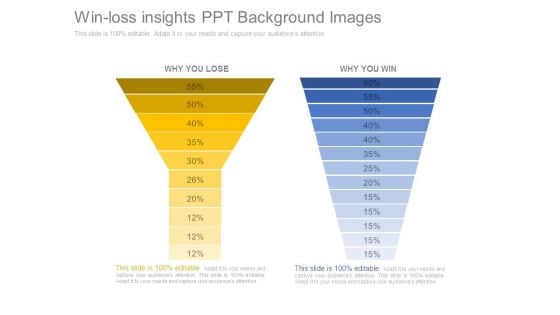
Win Loss Insights Ppt Background Images
This is a win loss insights ppt background image. This is a two stage process. The stages in this process are why you lose, why you win.
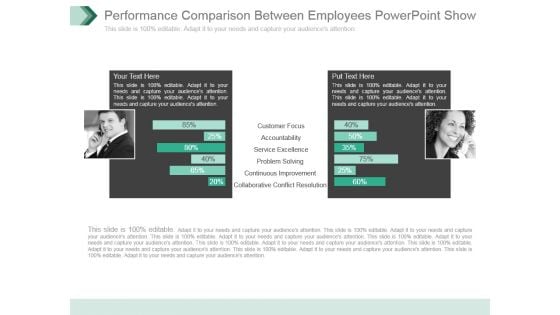
Performance Comparison Between Employees Powerpoint Show
This is a performance comparison between employees powerpoint show. This is a two stage process. The stages in this process are customer focus, accountability, service excellence, problem solving, continuous improvement, collaborative conflict resolution.
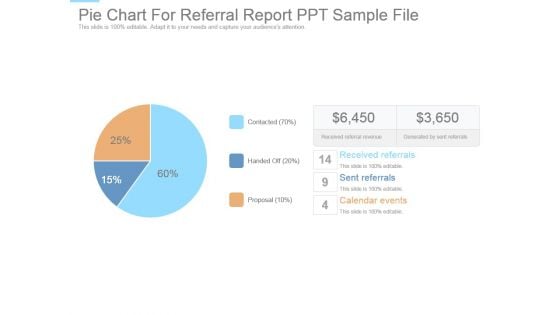
Pie Chart For Referral Report Ppt Sample File
This is a pie chart for referral report ppt sample file. This is a three stage process. The stages in this process are received referrals, sent referrals, calendar events, proposal, handed off, contacted, received referral revenue, generated by sent referrals.
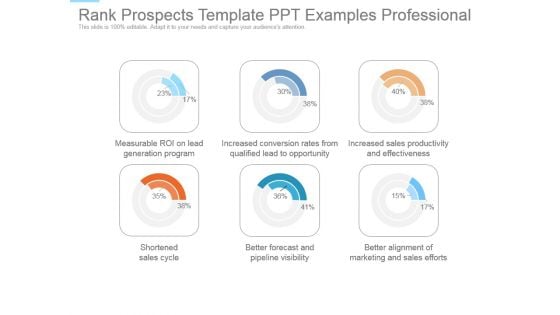
Rank Prospects Template Ppt Examples Professional
This is a rank prospects template ppt examples professional. This is a six stage process. The stages in this process are measurable roi on lead generation program, increased conversion rates from qualified lead to opportunity, increased sales productivity and effectiveness, shortened sales cycle, better forecast and pipeline visibility, better alignment of marketing and sales efforts.
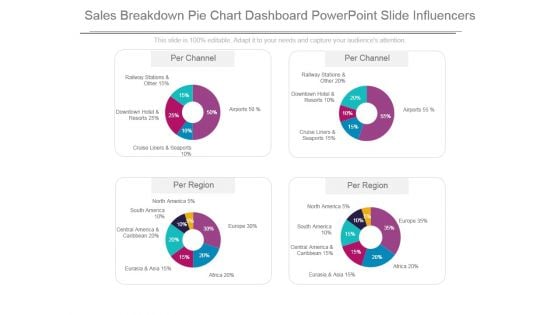
Sales Breakdown Pie Chart Dashboard Powerpoint Slide Influencers
This is a sales breakdown pie chart dashboard powerpoint slide influencers. This is a four stage process. The stages in this process are railway stations and other, downtown hotel and resorts, cruise liners and seaports, airports, north america, south america, central america and caribbean, eurasia and asia, africa, europe.
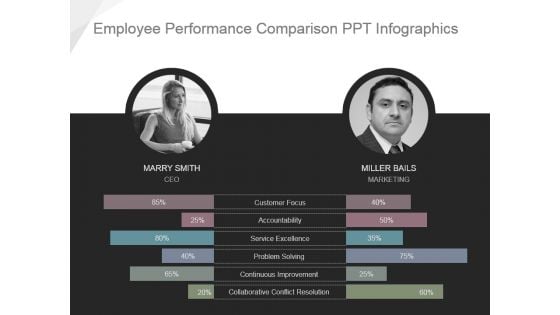
Employee Performance Comparison Ppt Infographics
This is a employee performance comparison ppt infographics. This is a two stage process. The stages in this process are customer focus, accountability, service excellence, problem solving, continuous improvement, collaborative conflict resolution.
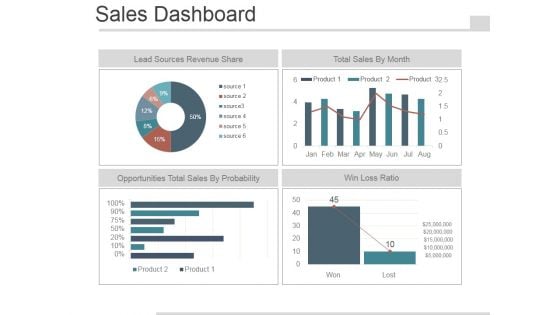
Sales Dashboard Slide Template 2 Ppt PowerPoint Presentation Images
This is a sales dashboard slide template 2 ppt powerpoint presentation images. This is a four stage process. The stages in this process are lead sources revenue share, total sales by month, opportunities total sales by probability, win loss ratio.
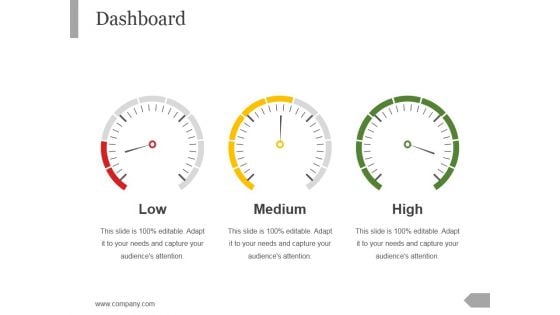
Dashboard Ppt PowerPoint Presentation Layouts Good
This is a dashboard ppt powerpoint presentation layouts good. This is a three stage process. The stages in this process are low, medium, high.
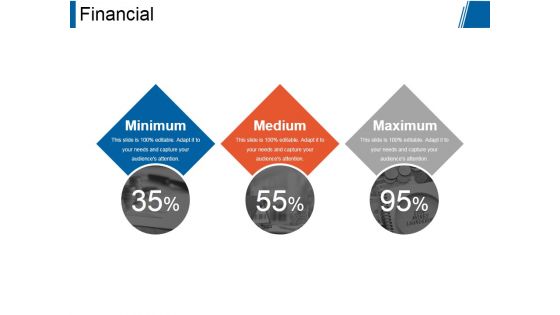
Financial Ppt PowerPoint Presentation Outline Slide Download
This is a financial ppt powerpoint presentation outline slide download. This is a three stage process. The stages in this process are minimum, medium, maximum.
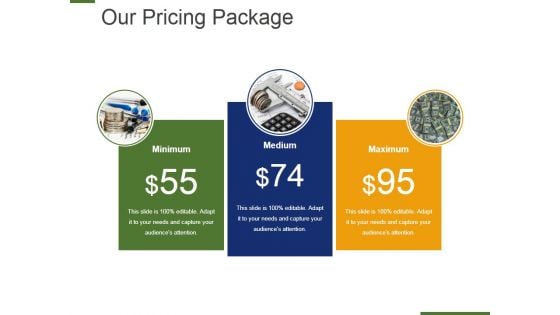
Our Pricing Package Ppt PowerPoint Presentation Layouts Sample
This is a our pricing package ppt powerpoint presentation layouts sample. This is a three stage process. The stages in this minimum, medium, maximum.
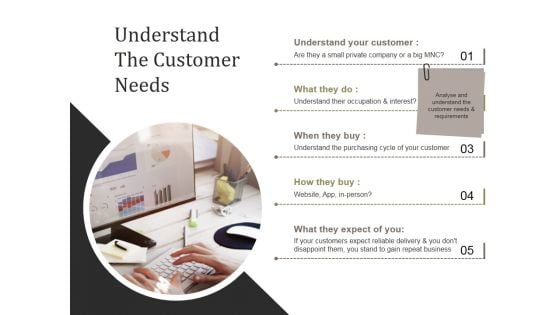
Understand The Customer Needs Template 1 Ppt PowerPoint Presentation Themes
This is a understand the customer needs template 1 ppt powerpoint presentation themes. This is a five stage process. The stages in this process are understand your customer , what they do, when they buy , how they buy , what they expect of you.
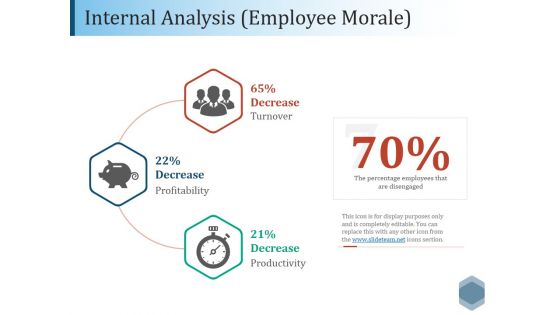
Internal Analysis Employee Morale Ppt PowerPoint Presentation Model Template
This is a internal analysis employee morale ppt powerpoint presentation model template. This is a three stage process. The stages in this process are decrease, profitability, turnover, productivity.
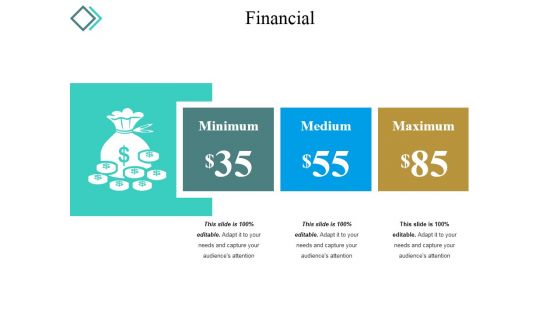
Financial Ppt PowerPoint Presentation Gallery Aids
This is a financial ppt powerpoint presentation gallery aids. This is a three stage process. The stages in this process are minimum, medium, maximum.
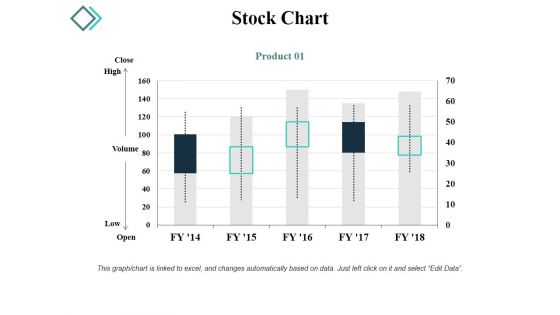
Stock Chart Ppt PowerPoint Presentation Gallery Graphic Images
This is a stock chart ppt powerpoint presentation gallery graphic images. This is a five stage process. The stages in this process are close, high, volume, low, open.
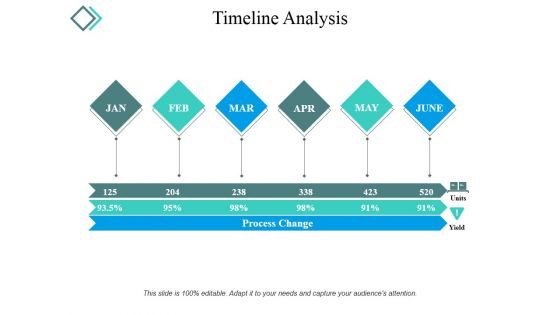
Timeline Analysis Ppt PowerPoint Presentation Outline Clipart
This is a timeline analysis ppt powerpoint presentation outline clipart. This is a six stage process. The stages in this process are process change, units, yield, months, percentage.
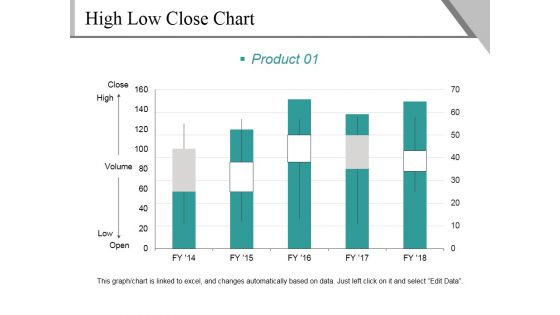
High Low Close Chart Template 1 Ppt PowerPoint Presentation Infographics Graphics Design
This is a high low close chart template 1 ppt powerpoint presentation infographics graphics design. This is a five stage process. The stages in this process are close, high, volume, low, open, product.
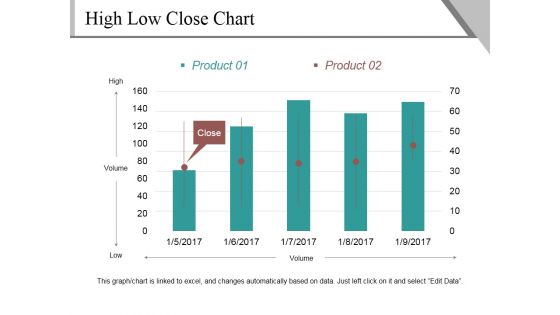
High Low Close Chart Template 2 Ppt PowerPoint Presentation Outline Show
This is a high low close chart template 2 ppt powerpoint presentation outline show. This is a five stage process. The stages in this process are high, volume, low, close, product.
Bar Chart Ppt PowerPoint Presentation Icon Demonstration
This is a bar chart ppt powerpoint presentation icon demonstration. This is a seven stage process. The stages in this process are product, sales in percentage, financial year, graph.
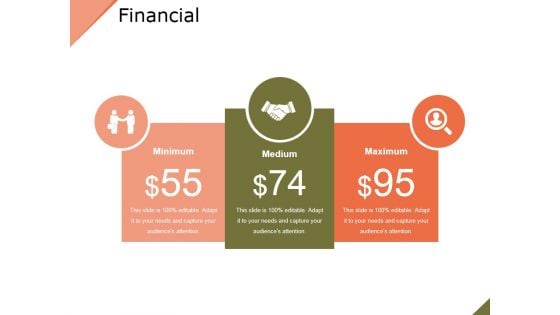
Financial Ppt PowerPoint Presentation Gallery Background Images
This is a financial ppt powerpoint presentation gallery background images. This is a three stage process. The stages in this process are minimum, medium, maximum, dollar, symbol.
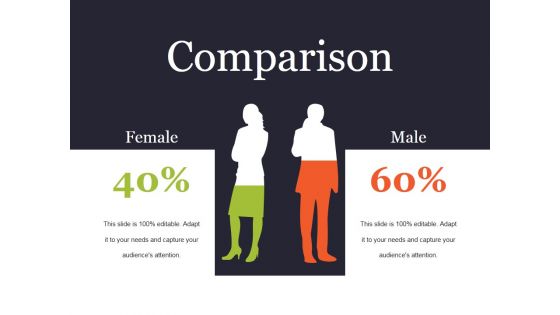
Comparison Ppt PowerPoint Presentation Slides Slideshow
This is a comparison ppt powerpoint presentation slides slideshow. This is a two stage process. The stages in this process are female, male, percentage, compare.
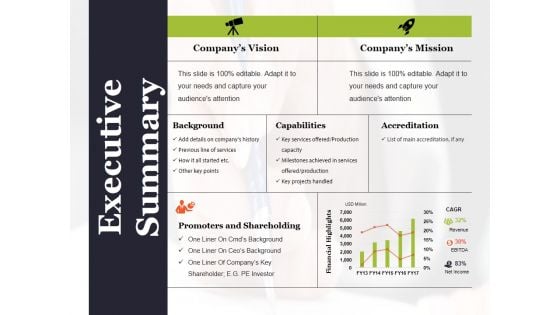
Executive Summary Ppt PowerPoint Presentation Summary Good
This is a executive summary ppt powerpoint presentation summary good. This is a seven stage process. The stages in this process are companys vision, companys mission, background, capabilities, accreditation.
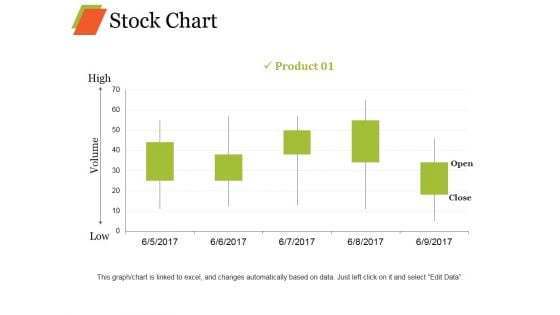
Stock Chart Ppt PowerPoint Presentation Professional Objects
This is a stock chart ppt powerpoint presentation professional objects. This is a five stage process. The stages in this process are product, high, volume, low, open, close.
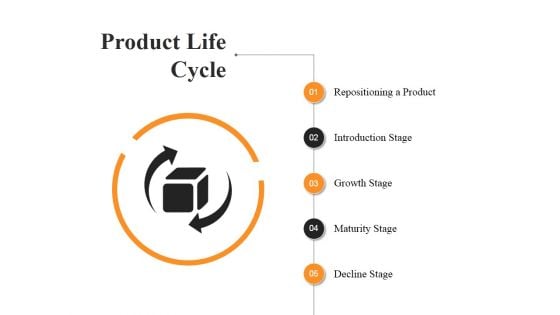
Product Life Cycle Ppt PowerPoint Presentation Summary Deck
This is a product life cycle ppt powerpoint presentation summary deck. This is a four stage process. The stages in this process are introduction, growth, maturity, decline.
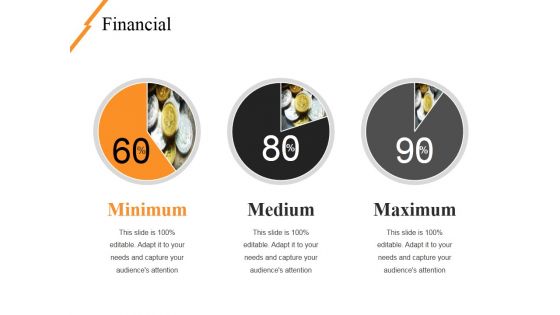
Financial Ppt PowerPoint Presentation Professional Infographic Template
This is a financial ppt powerpoint presentation professional infographic template. This is a three stage process. The stages in this process are minimum, medium, maximum, financial.
Financials Ppt PowerPoint Presentation Icon Deck
This is a financials ppt powerpoint presentation icon deck. This is a two stage process. The stages in this process are minimum, maximum, financial, percentage, icons.
Brand Tracking Info Graphics Ppt PowerPoint Presentation Infographics Slides
This is a brand tracking info graphics ppt powerpoint presentation infographics slides. This is a four stage process. The stages in this process are of consumers read, trust online reviews, user generated, look to online.
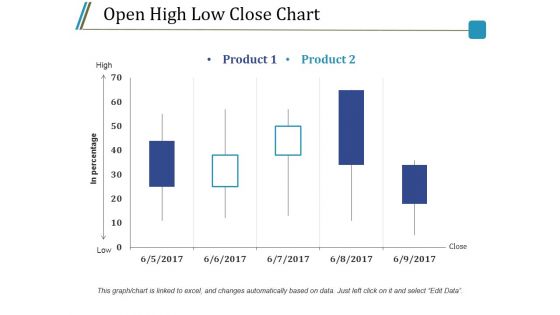
Open High Low Close Chart Ppt PowerPoint Presentation Styles Model
This is a open high low close chart ppt powerpoint presentation styles model. This is a five stage process. The stages in this process are product, high, low, in percentage, close.
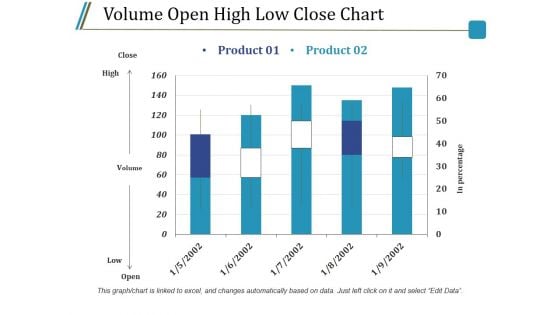
Volume Open High Low Close Chart Ppt PowerPoint Presentation Infographics Guide
This is a volume open high low close chart ppt powerpoint presentation infographics guide. This is a two stage process. The stages in this process are close, high, volume, low, open, product.
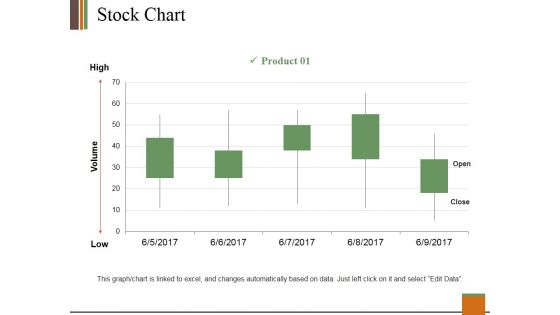
Stock Chart Ppt PowerPoint Presentation Slides Clipart
This is a stock chart ppt powerpoint presentation slides clipart. This is a one stage process. The stages in this process are product, high, volume, low, open, close.
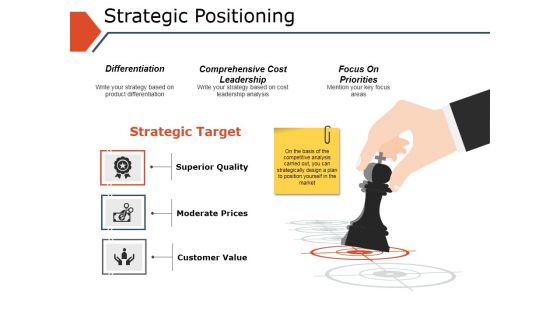
Strategic Positioning Ppt PowerPoint Presentation Model Portfolio
This is a strategic positioning ppt powerpoint presentation model portfolio. This is a three stage process. The stages in this process are superior quality, moderate prices, customer value, strategic target, differentiation.
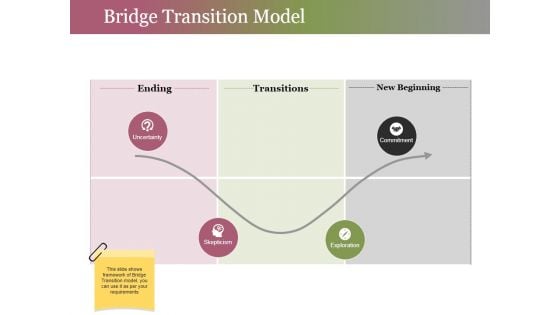
Bridge Transition Model Ppt PowerPoint Presentation Gallery Infographics
This is a bridge transition model ppt powerpoint presentation gallery infographics. This is a four stage process. The stages in this process are ending, transitions, new beginning, commitment, exploration.
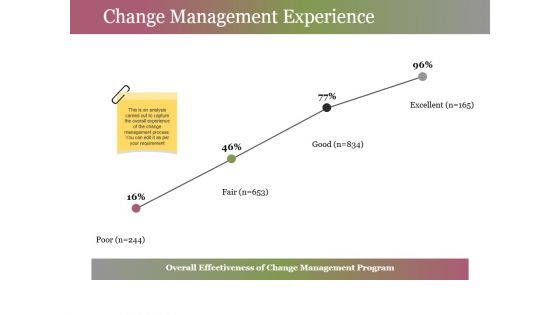
Change Management Experience Ppt PowerPoint Presentation Gallery Styles
This is a change management experience ppt powerpoint presentation gallery styles. This is a four stage process. The stages in this process are poor, fair, good, excellent, percentage.
Financial Ppt PowerPoint Presentation Icon Smartart
This is a financial ppt powerpoint presentation icon smartart. This is a two stage process. The stages in this process are silver, gold, dollar, symbol, feature.
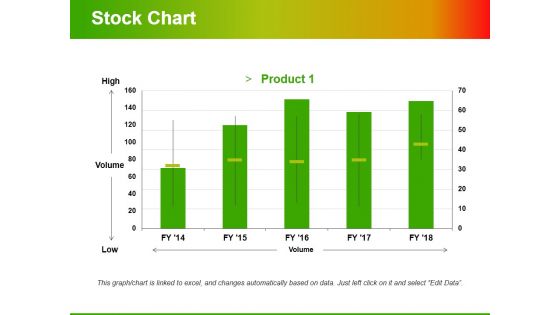
Stock Chart Template 2 Ppt PowerPoint Presentation Infographic Template Styles
This is a stock chart template 2 ppt powerpoint presentation infographic template styles. This is a one stage process. The stages in this process are high, volume, low, product, volume.

Key Metrics Ppt PowerPoint Presentation Professional Slideshow
This is a key metrics ppt powerpoint presentation professional slideshow. This is a five stage process. The stages in this process are new customers per month, on time delivery, customer satisfaction, lead conversion rate, customer retention rate.
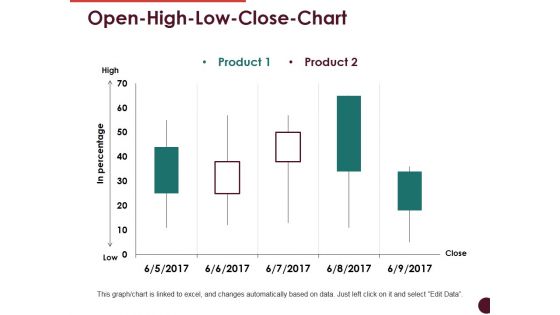
Open High Low Close Chart Ppt PowerPoint Presentation Professional Visuals
This is a open high low close chart ppt powerpoint presentation professional visuals. This is a two stage process. The stages in this process are high, low, in percentage, product, close.
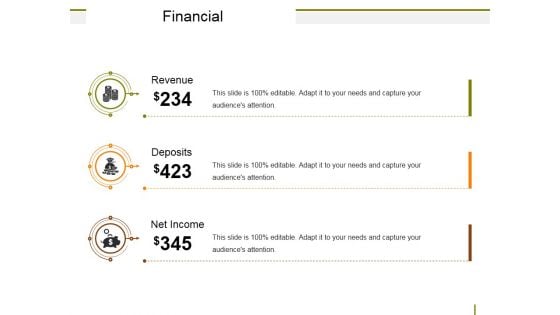
Financial Ppt PowerPoint Presentation Ideas Guide
This is a financial ppt powerpoint presentation ideas guide. This is a three stage process. The stages in this process are revenue, deposits, net income.
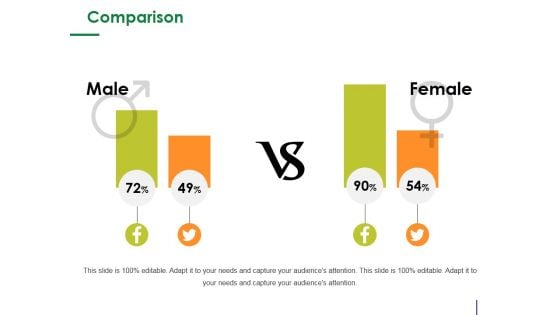
Comparison Ppt PowerPoint Presentation Model Clipart Images
This is a comparison ppt powerpoint presentation model clipart images. This is a two stage process. The stages in this process are male, female, comparison, percentage, icons.
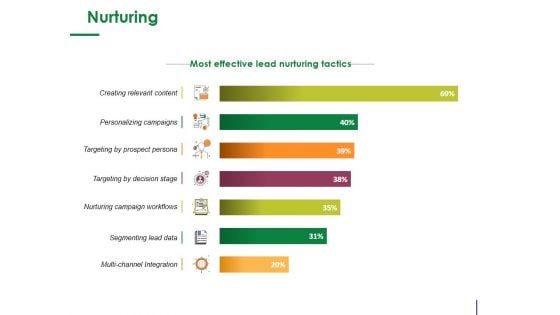
Nurturing Ppt PowerPoint Presentation Summary Images
This is a nurturing ppt powerpoint presentation summary images. This is a seven stage process. The stages in this process are segmenting lead data, creating relevant content, personalizing campaigns.
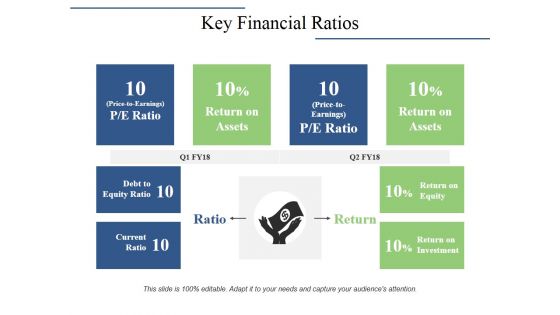
Key Financial Ratios Ppt PowerPoint Presentation Portfolio Background Image
This is a key financial ratios ppt powerpoint presentation portfolio background image. This is a four stage process. The stages in this process are debt to equity ratio, current ratio, return on assets, ratio, return.
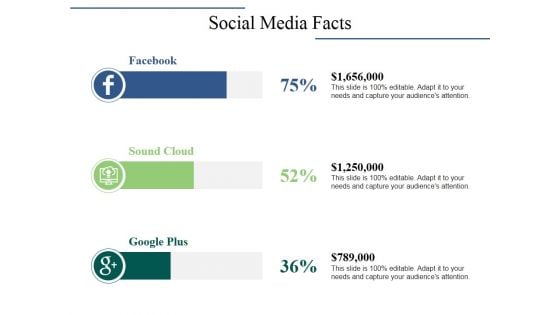
Social Media Facts Ppt PowerPoint Presentation Design Templates
This is a social media facts ppt powerpoint presentation design templates. This is a three stage process. The stages in this process are facebook, sound cloud, google plus.
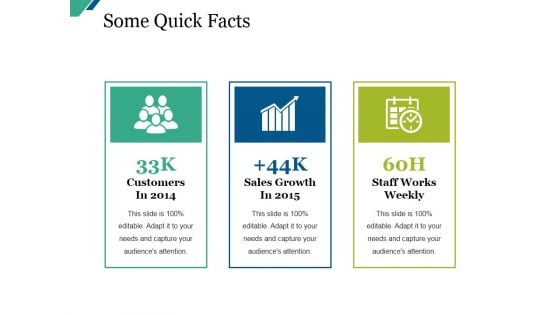
Some Quick Facts Ppt PowerPoint Presentation Summary Example
This is a some quick facts ppt powerpoint presentation summary example. This is a three stage process. The stages in this process are customers, sales growth, staff works weekly.


 Continue with Email

 Home
Home


