Corporate Planning
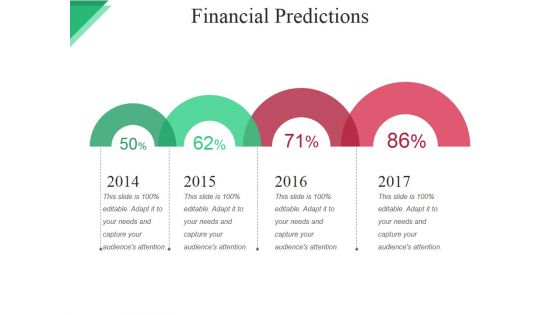
Financial Predictions Ppt PowerPoint Presentation File Clipart Images
This is a financial predictions ppt powerpoint presentation file clipart images. This is a three stage process. The stages in this process are revenue, expense, aggregate net income, monthly breakeven, aggregate breakeven.
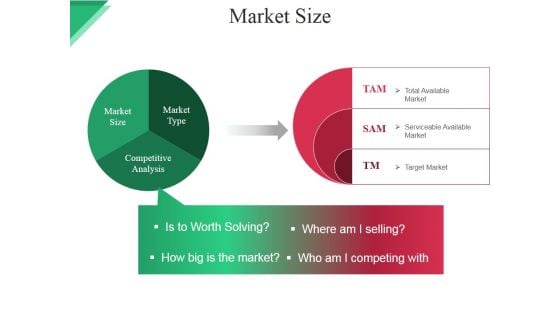
Market Size Ppt PowerPoint Presentation Microsoft
This is a market size ppt powerpoint presentation microsoft. This is a three stage process. The stages in this process are market size, market type, competitive analysis, where am i selling, total available market.
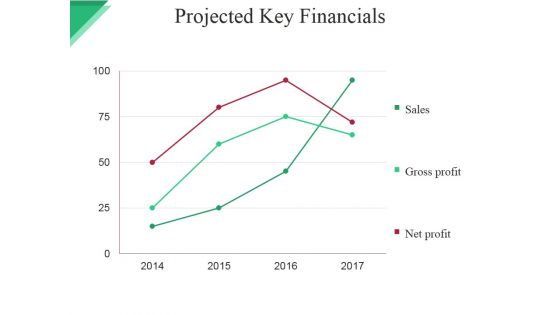
Projected Key Financials Template Ppt PowerPoint Presentation File Graphic Images
This is a projected key financials template ppt powerpoint presentation file graphic images. This is a four stage process. The stages in this process are sales, gross profit, net profit.
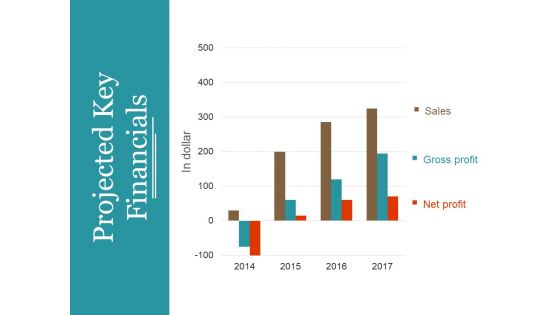
Projected Key Financials Template 1 Ppt PowerPoint Presentation Summary Professional
This is a projected key financials template 1 ppt powerpoint presentation summary professional. This is a three stage process. The stages in this process are in dollar, sales, gross profit, net profit, graph, year.
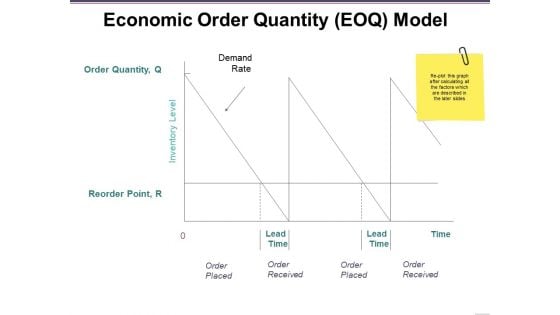
Economic Order Quantity Eoq Model Ppt PowerPoint Presentation Ideas Deck
This is a economic order quantity eoq model ppt powerpoint presentation ideas deck. This is a three stage process. The stages in this process are demand rate, order placed, order received, lead time, time, inventory level.
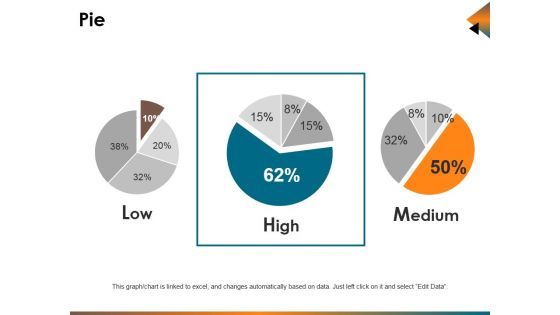
Pie Ppt PowerPoint Presentation Deck
This is a pie ppt powerpoint presentation deck. This is a three stage process. The stages in this process are low, high, medium.
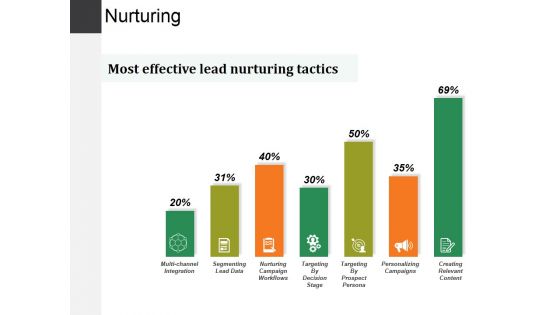
Nurturing Ppt PowerPoint Presentation Summary Brochure
This is a nurturing ppt powerpoint presentation summary brochure. This is a seven stage process. The stages in this process are segmenting lead data, nurturing campaign workflows, targeting by prospect persona, personalizing campaigns, creating relevant content.
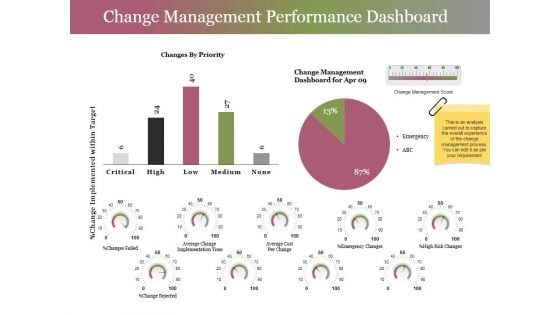
Change Management Performance Dashboard Ppt PowerPoint Presentation Layouts Master Slide
This is a change management performance dashboard ppt powerpoint presentation layouts master slide. This is a three stage process. The stages in this process are critical, high, low, medium, none.
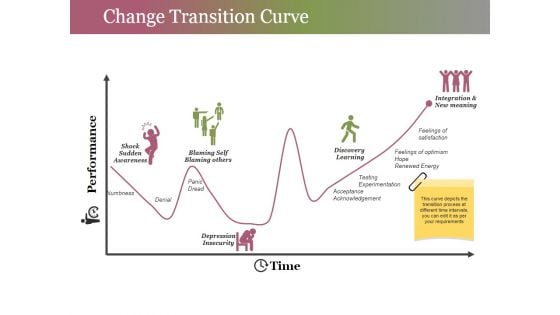
Change Transition Curve Ppt PowerPoint Presentation Gallery Graphics
This is a change transition curve ppt powerpoint presentation gallery graphics. This is a one stage process. The stages in this process are numbness, denial, panic, dread, time, performance.
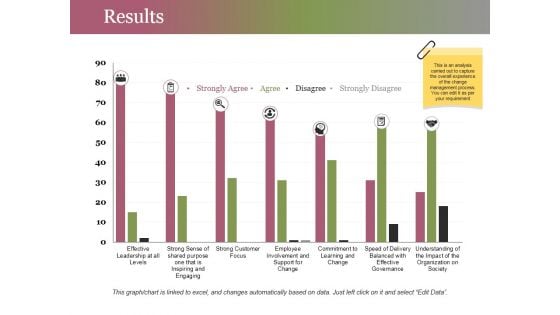
Results Ppt PowerPoint Presentation Summary Inspiration
This is a results ppt powerpoint presentation summary inspiration. This is a seven stage process. The stages in this process are effective leadership at all levels, strong customer focus, commitment to learning and change.
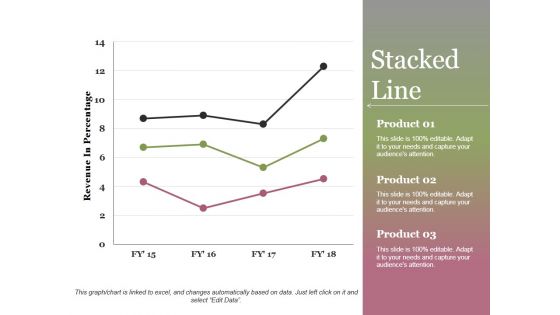
Stacked Line Ppt PowerPoint Presentation Show
This is a stacked line ppt powerpoint presentation show. This is a three stage process. The stages in this process are revenue in percentage, product, stacked line, growth, success.
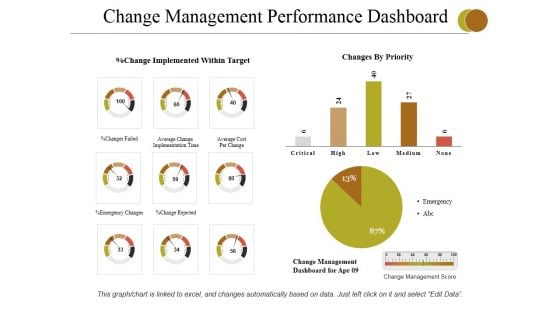
Change Management Performance Dashboard Ppt PowerPoint Presentation Infographics Topics
This is a change management performance dashboard ppt powerpoint presentation infographics topics. This is a Three stage process. The stages in this process are emergency changes, change rejected, changes failed, average cost per change, emergency.
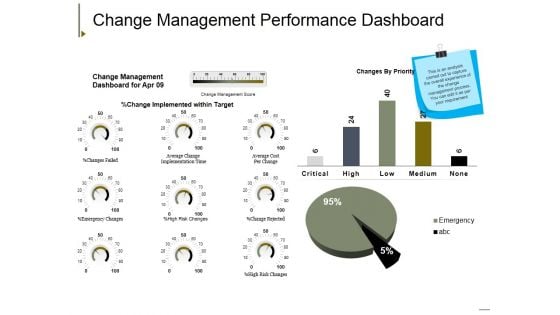
Change Management Performance Dashboard Ppt PowerPoint Presentation Summary Background Image
This is a change management performance dashboard ppt powerpoint presentation summary background image. This is a three stage process. The stages in this process are high risk changes, average change, implementation time, emergency changes, average cost per change, change rejected.
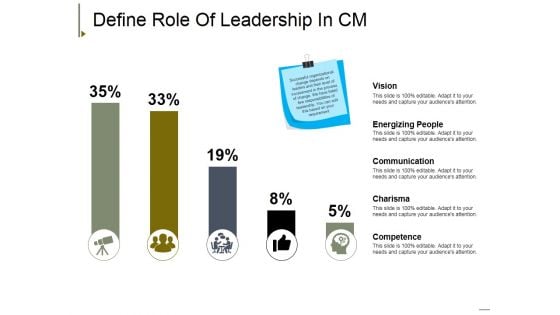
Define Role Of Leadership In Cm Ppt PowerPoint Presentation Model Example Introduction
This is a define role of leadership in cm ppt powerpoint presentation model example introduction. This is a five stage process. The stages in this process are vision, energizing people, communication, charisma, competence.
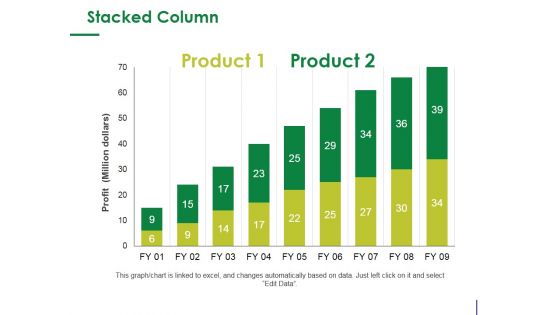
Stacked Column Ppt PowerPoint Presentation Infographic Template Design Ideas
This is a stacked column ppt powerpoint presentation infographic template design ideas. This is a two stage process. The stages in this process are product, profit, bar graph, growth, success.
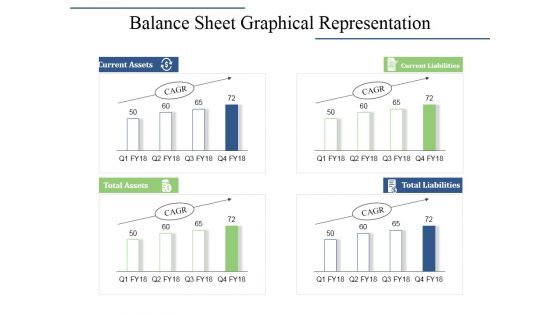
Balance Sheet Graphical Representation Ppt PowerPoint Presentation Inspiration Design Inspiration
This is a balance sheet graphical representation ppt powerpoint presentation inspiration design inspiration. This is a four stage process. The stages in this process are current assets, current liabilities, total assets, total liabilities.
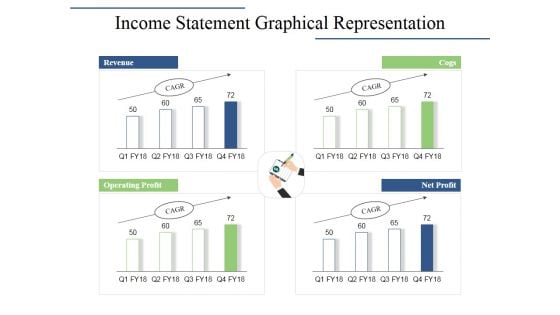
Income Statement Graphical Representation Ppt PowerPoint Presentation Infographics Layouts
This is a income statement graphical representation ppt powerpoint presentation infographics layouts. This is a four stage process. The stages in this process are revenue, cogs, operating profit, net profit.
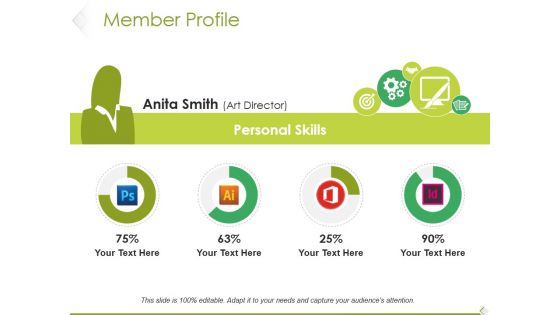
Member Profile Ppt PowerPoint Presentation Layouts Styles
This is a member profile ppt powerpoint presentation layouts styles. This is a four stage process. The stages in this process are art director, personal skills, percentage, finance, icons.
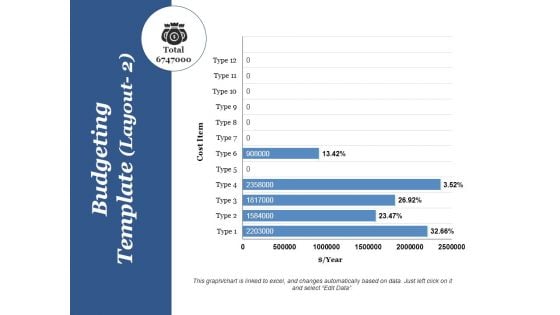
Budgeting Template 2 Ppt PowerPoint Presentation Pictures Model
This is a budgeting template 2 ppt powerpoint presentation pictures model. This is a five stage process. The stages in this process are cost item, year, budgeting template, cost, total.
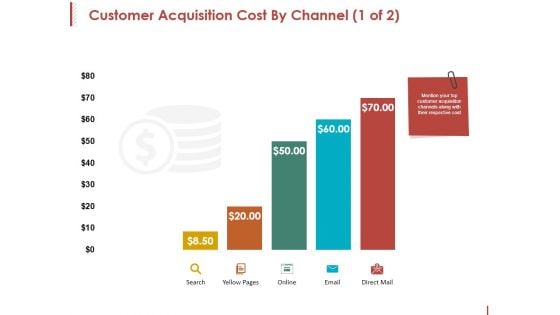
Customer Acquisition Cost By Channel Template 1 Ppt PowerPoint Presentation File Aids
This is a customer acquisition cost by channel template 1 ppt powerpoint presentation file aids. This is a five stage process. The stages in this process are search, yellow pages, online, email, direct mail.
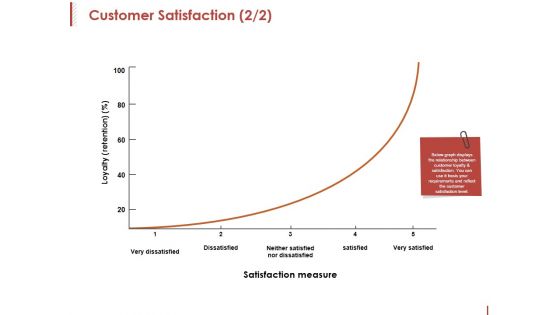
Customer Satisfaction Template 2 Ppt PowerPoint Presentation Slides Ideas
This is a customer satisfaction template 2 ppt powerpoint presentation slides ideas. This is a one stage process. The stages in this process are loyalty, satisfaction measure, dissatisfied, satisfied, very satisfied.
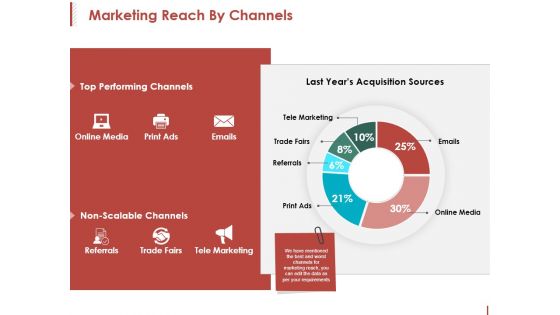
Marketing Reach By Channels Ppt PowerPoint Presentation Pictures Inspiration
This is a marketing reach by channels ppt powerpoint presentation pictures inspiration. This is a six stage process. The stages in this process are tele marketing, trade fairs, referrals, print ads, emails.
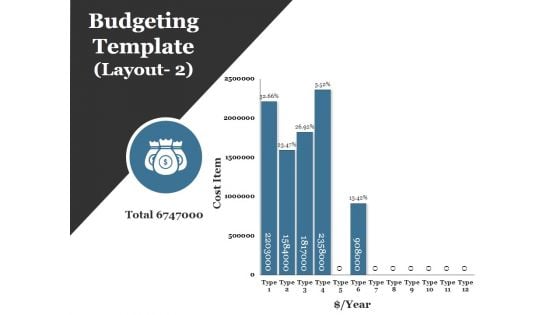
Budgeting Template 3 Ppt PowerPoint Presentation Ideas Graphics Tutorials
This is a budgeting template 3 ppt powerpoint presentation ideas graphics tutorials. This is a five stage process. The stages in this process are cost item, year, total, type, budgeting template.
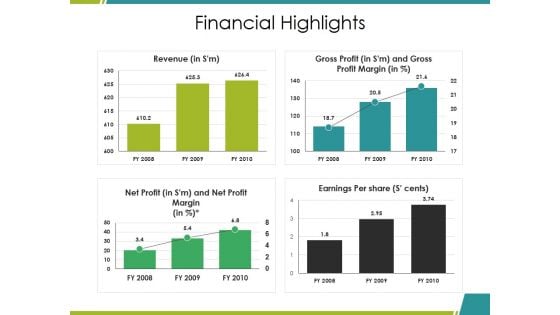
Financial Highlights Ppt PowerPoint Presentation Ideas Graphics Download
This is a financial highlights ppt powerpoint presentation ideas graphics download. This is a four stage process. The stages in this process are revenue, gross profit, net profit, earnings per share, bar graph.
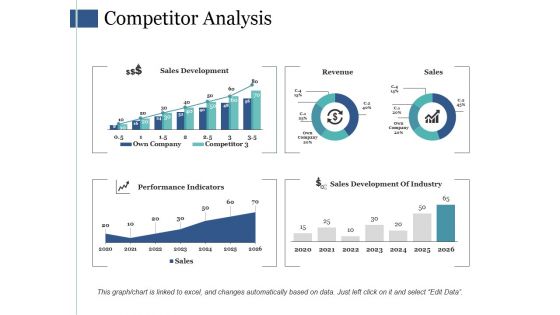
Competitor Analysis Ppt PowerPoint Presentation Slides Visuals
This is a competitor analysis ppt powerpoint presentation slides visuals. This is a four stage process. The stages in this process are sales development, revenue, sales, performance, indicators.

Sales Activities Dashboard Ppt PowerPoint Presentation Ideas Themes
This is a sales activities dashboard ppt powerpoint presentation ideas themes. This is a two stage process. The stages in this process are total activities, closed activities, activities per won deal, open activities.
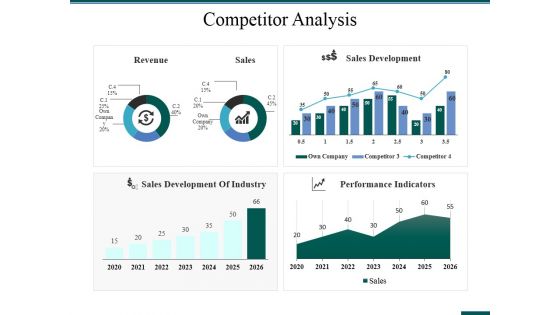
Competitor Analysis Ppt PowerPoint Presentation Model Visual Aids
This is a competitor analysis ppt powerpoint presentation model visual aids. This is a four stage process. The stages in this process are competitor analysis, revenue, sales, sales development, performance indicators.
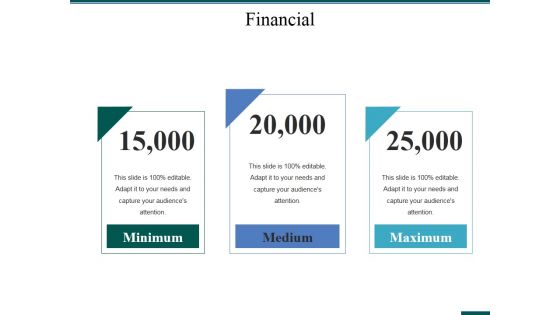
Financial Ppt PowerPoint Presentation Gallery Graphic Tips
This is a financial ppt powerpoint presentation gallery graphic tips. This is a three stage process. The stages in this process are minimum, medium, maximum, finance.

Sales Kpi Performance Summary Ppt PowerPoint Presentation Ideas Graphics Template
This is a sales kpi performance summary ppt powerpoint presentation ideas graphics template. This is a seven stage process. The stages in this process are revenue comparison, quantity comparison, product sales mix, regional sales mix.
Sales Kpi Tracker Ppt PowerPoint Presentation Pictures Designs
This is a sales kpi tracker ppt powerpoint presentation pictures designs. This is a two stage process. The stages in this process are leads created, sales ratio, opportunities won, top products in revenue, win ratio vs last yr.
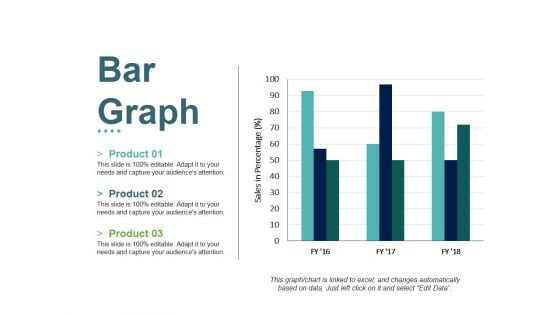
Bar Graph Ppt PowerPoint Presentation File Slides
This is a bar graph ppt powerpoint presentation file slides. This is a three stage process. The stages in this process are product, sales in percentage, bar graph, growth, success.
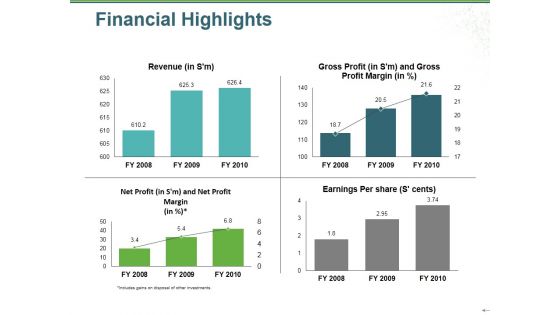
Financial Highlights Ppt PowerPoint Presentation Gallery Graphics Example
This is a financial highlights ppt powerpoint presentation gallery graphics example. This is a four stage process. The stages in this process are revenue, gross profit, net profit, earnings per share, bar graph.
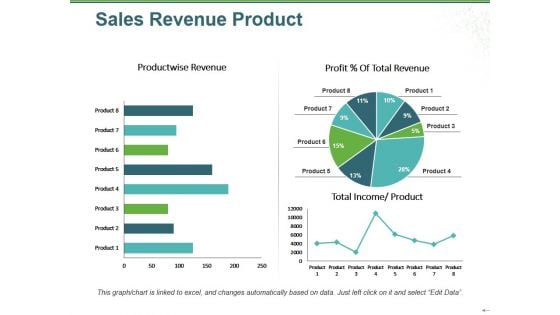
Sales Revenue Product Ppt PowerPoint Presentation Infographic Template Infographic Template
This is a sales revenue product ppt powerpoint presentation infographic template infographic template. This is a three stage process. The stages in this process are product wise revenue, total income, product, profit total revenue, pie.
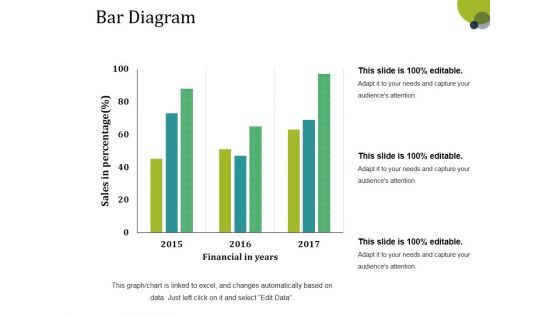
Bar Diagram Ppt PowerPoint Presentation Gallery Structure
This is a bar diagram ppt powerpoint presentation gallery structure. This is a three stage process. The stages in this process are financial in years, sales in percentage, bar graph, growth, success.
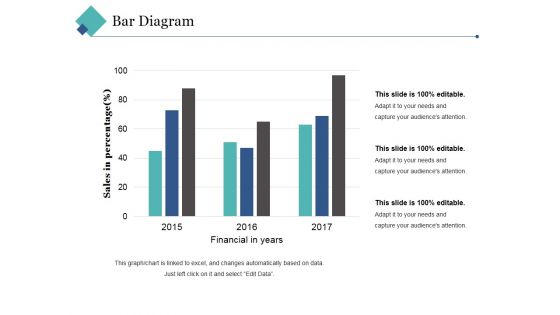
Bar Diagram Ppt PowerPoint Presentation Pictures Background Image
This is a bar diagram ppt powerpoint presentation pictures background image. This is a three stage process. The stages in this process are financial in years, sales in percentage, bar graph, growth, success.
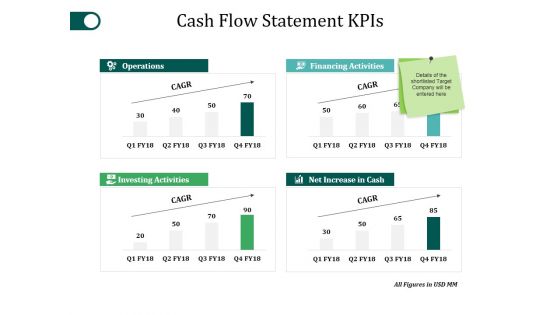
Cash Flow Statement Kpis Template 2 Ppt PowerPoint Presentation Summary Guidelines
This is a cash flow statement kpis template 2 ppt powerpoint presentation summary guidelines. This is a four stage process. The stages in this process are operations, investing activities, net increase in cash, financing activities.
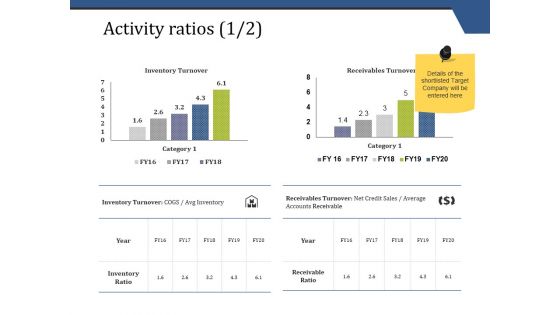
Activity Ratios Template 1 Ppt PowerPoint Presentation Show Graphics
This is a activity ratios template 1 ppt powerpoint presentation show graphics. This is a two stage process. The stages in this process are inventory turnover, receivables turnover, inventory ratio, receivable ratio.
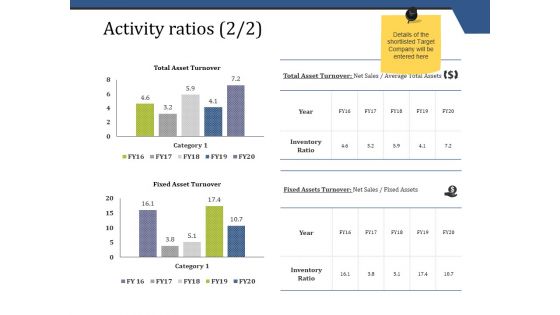
Activity Ratios Template 2 Ppt PowerPoint Presentation Pictures Template
This is a activity ratios template 2 ppt powerpoint presentation pictures template. This is a two stage process. The stages in this process are total asset turnover, fixed asset turnover.
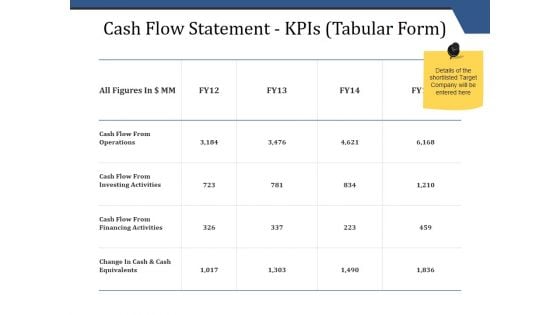
Cash Flow Statement Kpis Tabular Form Ppt PowerPoint Presentation Inspiration Master Slide
This is a cash flow statement kpis tabular form ppt powerpoint presentation inspiration master slide. This is a four stage process. The stages in this process are operations, financing activities, investing activities, net increase in cash.
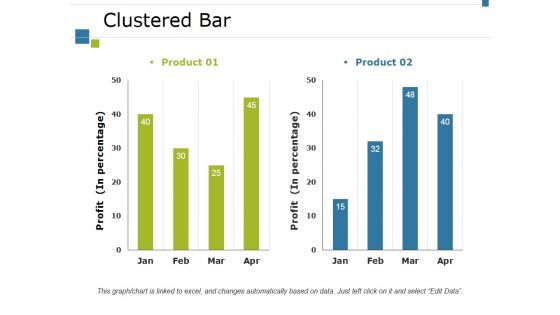
Clustered Bar Ppt PowerPoint Presentation Styles Portfolio
This is a clustered bar ppt powerpoint presentation styles portfolio. This is a two stage process. The stages in this process are product, profit, bar graph, growth, success.
Case Study Ppt PowerPoint Presentation Slides Layouts
This is a case study ppt powerpoint presentation slides layouts. This is a three stage process. The stages in this process are Challenge, Solution, Results.
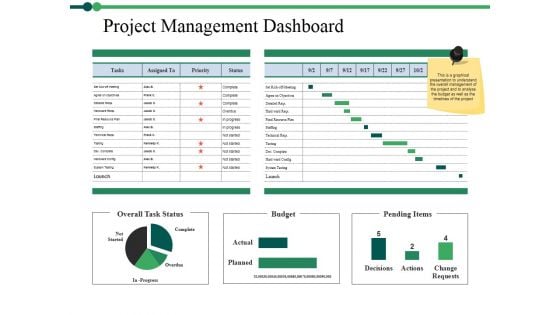
Project Management Dashboard Ppt PowerPoint Presentation Portfolio Objects
This is a project management dashboard ppt powerpoint presentation portfolio objects. This is a three stage process. The stages in this process are complete, overdue, overall task status, budget, pending items.
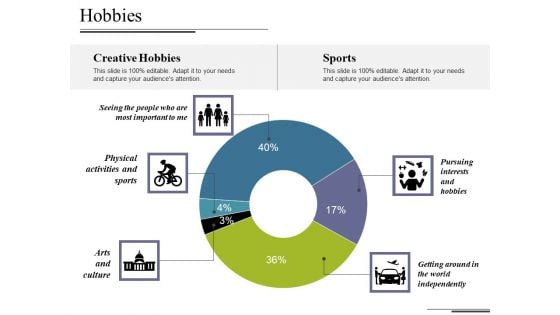
Hobbies Ppt PowerPoint Presentation Pictures Graphics Template
This is a hobbies ppt powerpoint presentation pictures graphics template. This is a five stage process. The stages in this process are seeing the people who are most important to me, physical activities and sports, arts and culture, pursuing interests and hobbies, getting around in the world independently.
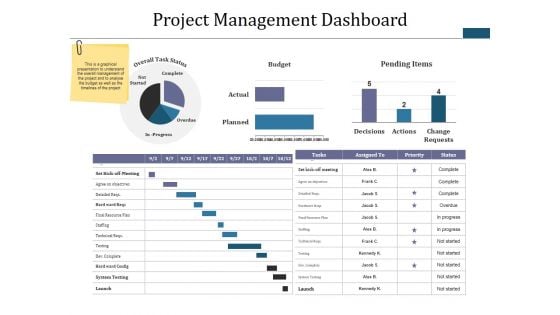
Project Management Dashboard Ppt PowerPoint Presentation Infographic Template Diagrams
This is a project management dashboard ppt powerpoint presentation infographic template diagrams. This is a three stage process. The stages in this process are budget, pending items, complete, overdue, not started.
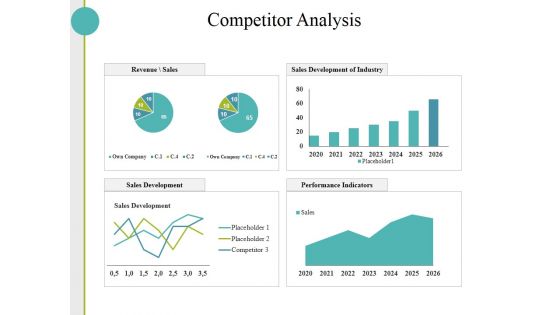
Competitor Analysis Ppt PowerPoint Presentation Layouts Slides
This is a competitor analysis ppt powerpoint presentation layouts slides. This is a four stage process. The stages in this process are sales development, performance indicators, sales development of industry, revenue sales.
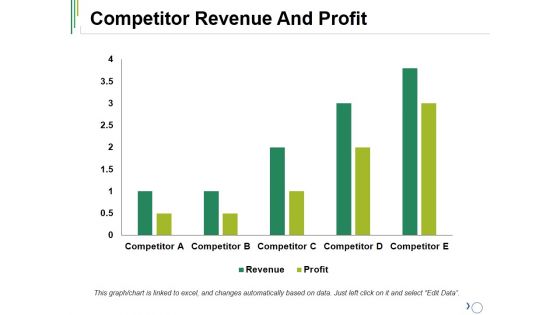
Competitor Revenue And Profit Ppt PowerPoint Presentation Layouts Vector
This is a competitor revenue and profit ppt powerpoint presentation layouts vector. This is a five stage process. The stages in this process are competitor, profit, revenue, bar graph, success.
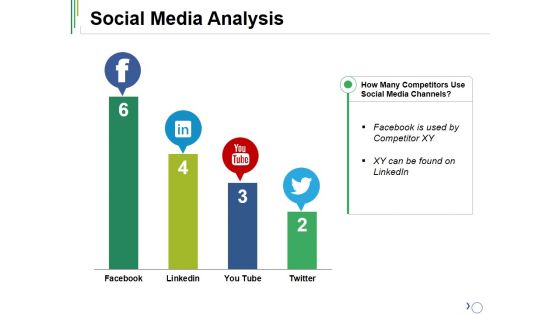
Social Media Analysis Ppt PowerPoint Presentation Visual Aids Layouts
This is a social media analysis ppt powerpoint presentation visual aids layouts. This is a four stage process. The stages in this process are facebook, linked in, you tube, twitter.
Stacked Column Ppt PowerPoint Presentation Layouts Example
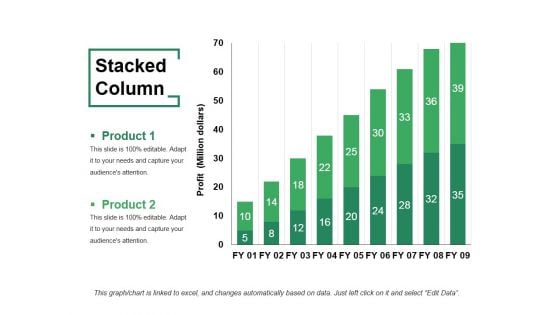
This is a stacked column ppt powerpoint presentation layouts example. This is a two stage process. The stages in this process are product, stacked column, bar graph, growth, success.
Competitor Analysis Ppt PowerPoint Presentation Model Show
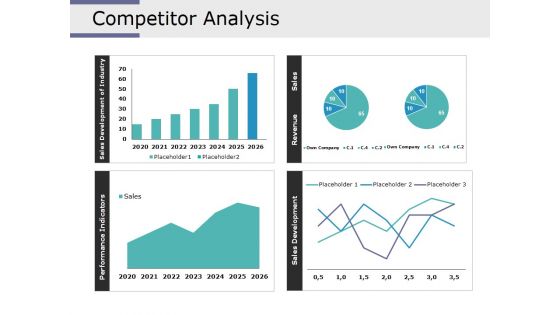
This is a competitor analysis ppt powerpoint presentation model show. This is a four stage process. The stages in this process are performance indicators, sales development of industry, sales development, revenue, sales.
Competitor Analysis Ppt PowerPoint Presentation Samples
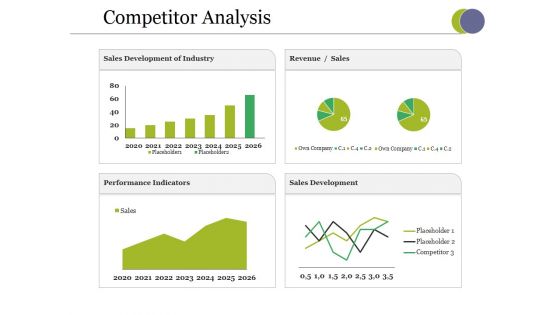
This is a competitor analysis ppt powerpoint presentation samples. This is a four stage process. The stages in this process are sales development of industry, performance indicators, sales development, sales.
Balance Sheet Kpis Template 2 Ppt PowerPoint Presentation Ideas Show
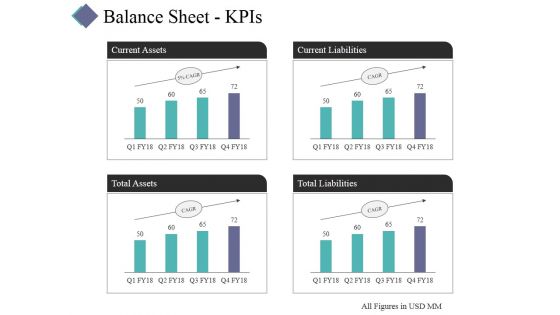
This is a balance sheet kpis template 2 ppt powerpoint presentation ideas show. This is a four stage process. The stages in this process are current assets, total assets, total liabilities, current liabilities.
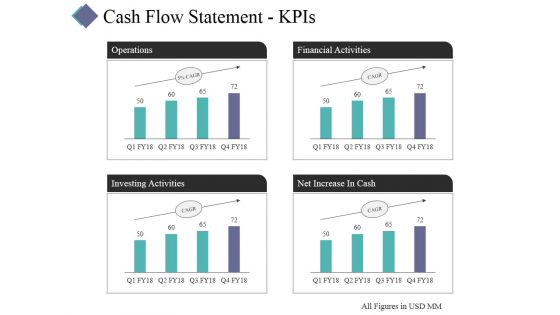
Cash Flow Statement Kpis Template 2 Ppt PowerPoint Presentation Layouts Visuals
This is a cash flow statement kpis template 2 ppt powerpoint presentation layouts visuals. This is a four stage process. The stages in this process are operations, financial activities, investing activities, net increase in cash.
P And L Kpis Template 2 Ppt PowerPoint Presentation Summary Icon
This is a p and l kpis template 2 ppt powerpoint presentation summary icon. This is a four stage process. The stages in this process are revenue, cogs, operating profit, net profit.
Balance Sheet Kpis Tabular Form Ppt PowerPoint Presentation Show Icons
This is a balance sheet kpis tabular form ppt powerpoint presentation show icons. This is a four stage process. The stages in this process are current assets, total assets, total liabilities, current liabilities.
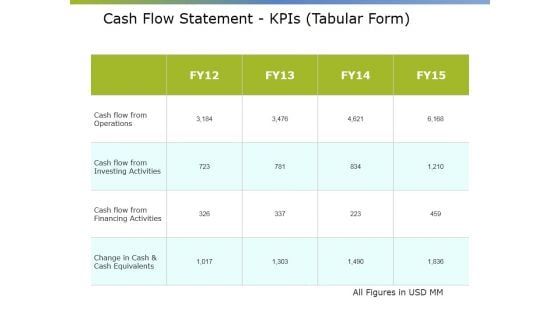
Cash Flow Statement Kpis Tabular Form Ppt PowerPoint Presentation Summary Elements
This is a cash flow statement kpis tabular form ppt powerpoint presentation summary elements. This is a four stage process. The stages in this process are net increase cash, financial activities, operations, investing activities.
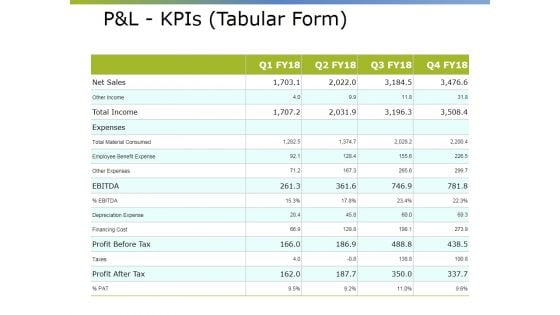
Pandl Kpis Tabular Form Ppt PowerPoint Presentation Pictures Visual Aids
This is a pandl kpis tabular form ppt powerpoint presentation pictures visual aids. This is a four stage process. The stages in this process are revenue, operating profit, cogs, net profit.
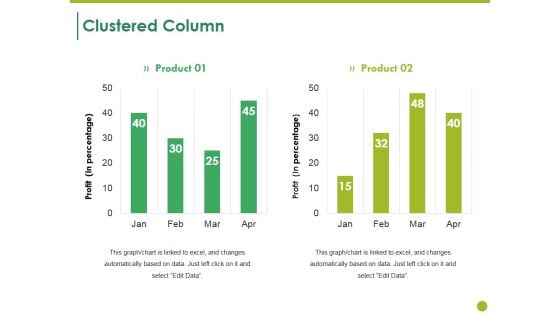
Clustered Column Ppt PowerPoint Presentation Layouts Ideas
This is a clustered column ppt powerpoint presentation layouts ideas. This is a two stage process. The stages in this process are product, profit, bar graph, growth, finance.
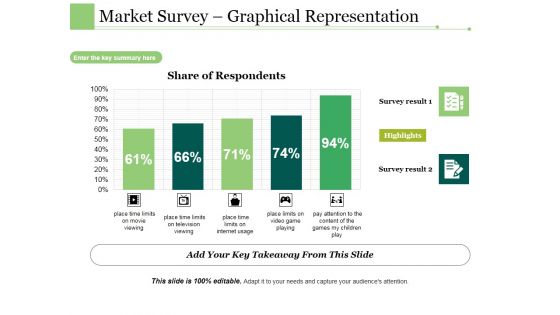
Market Survey Graphical Representation Ppt PowerPoint Presentation Ideas Show
This is a market survey graphical representation ppt powerpoint presentation ideas show. This is a five stage process. The stages in this process are place time limits on movie viewing, place time limits on television viewing, place time limits on internet usage, place limits on video game playing, pay attention to the content of the games my children play.
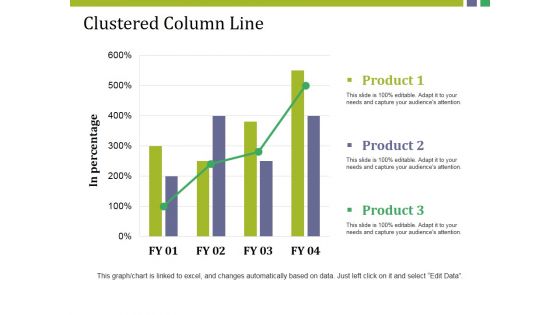
Clustered Column Line Ppt PowerPoint Presentation Pictures Example
This is a clustered column line ppt powerpoint presentation pictures example. This is a three stage process. The stages in this process are product, in percentage, bar graph, growth, success.
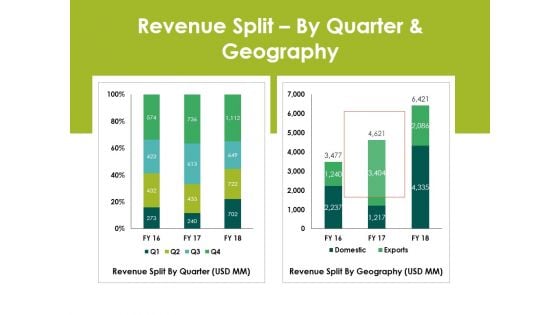
Revenue Splitby Quarter And Geography Ppt PowerPoint Presentation Layout
This is a revenue splitby quarter and geography ppt powerpoint presentation layout. This is a two stage process. The stages in this process are revenue split by quarter, revenue split by geography.


 Continue with Email

 Home
Home


