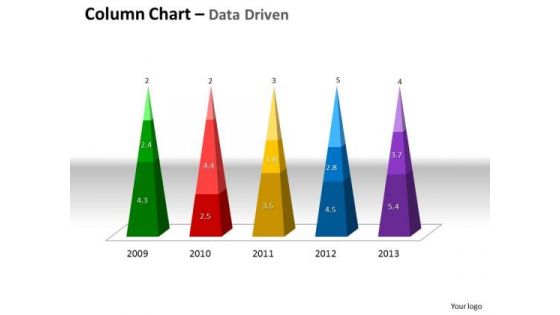
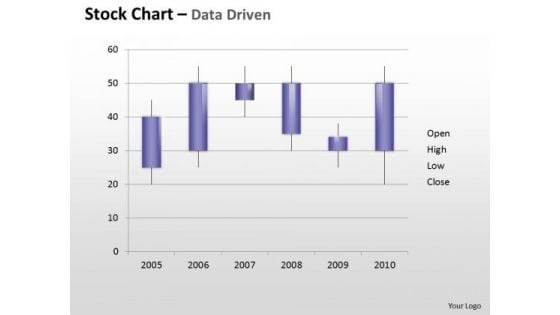
Cost Analysis Dashboard
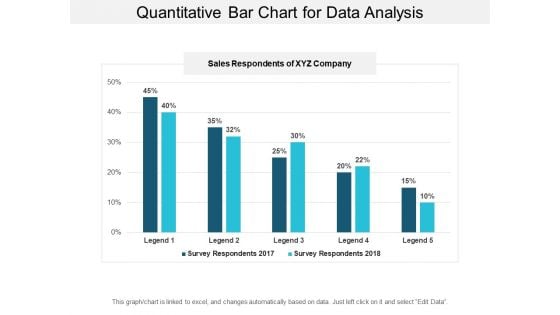
Quantitative Bar Chart For Data Analysis Ppt PowerPoint Presentation Model Graphic Tips
This is a quantitative bar chart for data analysis ppt powerpoint presentation model graphic tips. This is a two stage process. The stages in this process are financial analysis, quantitative, statistical modelling.
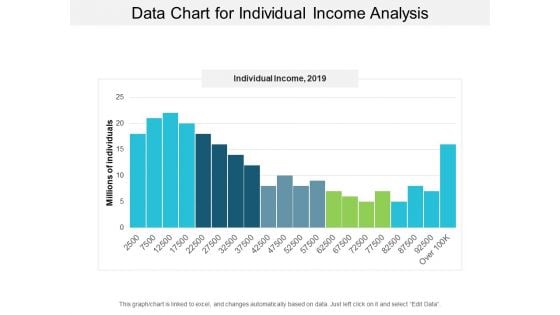
Data Chart For Individual Income Analysis Ppt PowerPoint Presentation Layouts Visual Aids
This is a data chart for individual income analysis ppt powerpoint presentation layouts visual aids. This is a five stage process. The stages in this process are financial analysis, quantitative, statistical modelling.
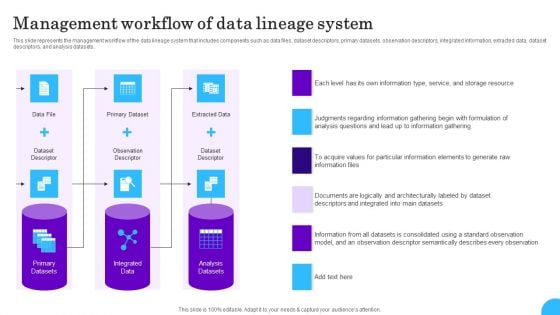
Comprehensive Analysis Of Different Data Lineage Classification Management Workflow Of Data Lineage Introduction PDF
This slide represents the management workflow of the data lineage system that includes components such as data files, dataset descriptors, primary datasets, observation descriptors, integrated information, extracted data, dataset descriptors, and analysis datasets. Boost your pitch with our creative Comprehensive Analysis Of Different Data Lineage Classification Management Workflow Of Data Lineage Introduction PDF. Deliver an awe inspiring pitch that will mesmerize everyone. Using these presentation templates you will surely catch everyones attention. You can browse the ppts collection on our website. We have researchers who are experts at creating the right content for the templates. So you do not have to invest time in any additional work. Just grab the template now and use them.
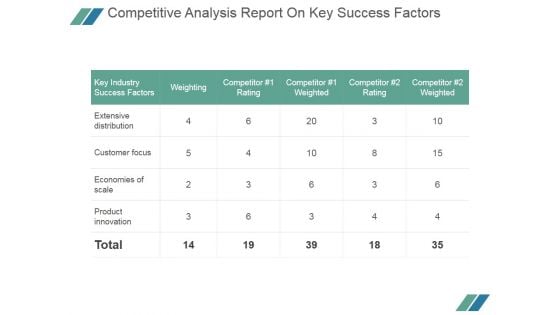
Competitive Analysis Report On Key Success Factors Ppt PowerPoint Presentation Infographic Template
This is a competitive analysis report on key success factors ppt powerpoint presentation infographic template. This is a five stage process. The stages in this process are key industry success factors, extensive distribution, customer focus, economies of scale, product innovation.
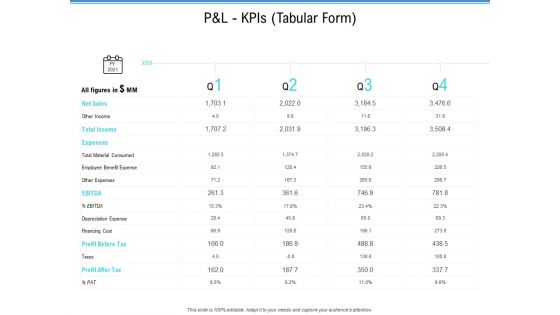
Enterprise Analysis P And L Kpis Tabular Form Ppt Slides Graphics Download PDF
Deliver and pitch your topic in the best possible manner with this enterprise analysis p and l kpis tabular form ppt slides graphics download pdf. Use them to share invaluable insights on operating profit, net profit, cogs, revenue and impress your audience. This template can be altered and modified as per your expectations. So, grab it now.
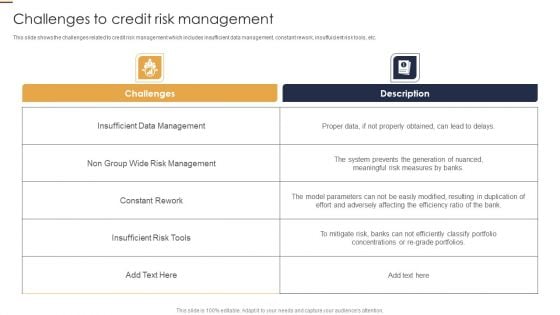
Challenges To Credit Risk Management Credit Risk Analysis Model For Banking Institutions Structure PDF
This slide shows the challenges related to credit risk management which includes insufficient data management, constant rework, insuffuicient risk tools, etc.Here you can discover an assortment of the finest PowerPoint and Google Slides templates. With these templates, you can create presentations for a variety of purposes while simultaneously providing your audience with an eye-catching visual experience. Download Challenges To Credit Risk Management Credit Risk Analysis Model For Banking Institutions Structure PDF to deliver an impeccable presentation. These templates will make your job of preparing presentations much quicker, yet still, maintain a high level of quality. Slidegeeks has experienced researchers who prepare these templates and write high-quality content for you. Later on, you can personalize the content by editing the Challenges To Credit Risk Management Credit Risk Analysis Model For Banking Institutions Structure PDF.
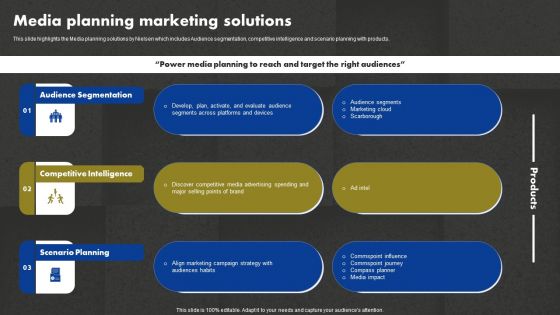
Data And Customer Analysis Company Outline Media Planning Marketing Solutions Demonstration PDF
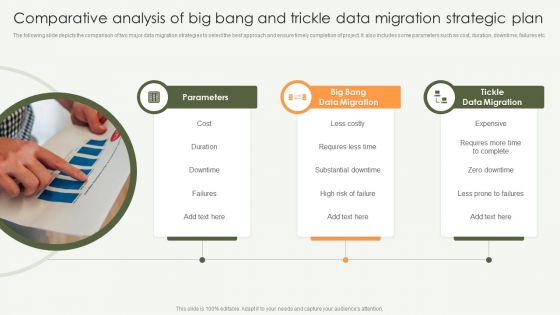
Comparative Analysis Of Big Bang And Trickle Data Migration Strategic Plan Designs PDF
The following slide depicts the comparison of two major data migration strategies to select the best approach and ensure timely completion of project. It also includes some parameters such as cost, duration, downtime, failures etc. Persuade your audience using this Comparative Analysis Of Big Bang And Trickle Data Migration Strategic Plan Designs PDF. This PPT design covers three stages, thus making it a great tool to use. It also caters to a variety of topics including Big Bang Data Migration, Tickle Data Migration, Cost. Download this PPT design now to present a convincing pitch that not only emphasizes the topic but also showcases your presentation skills.
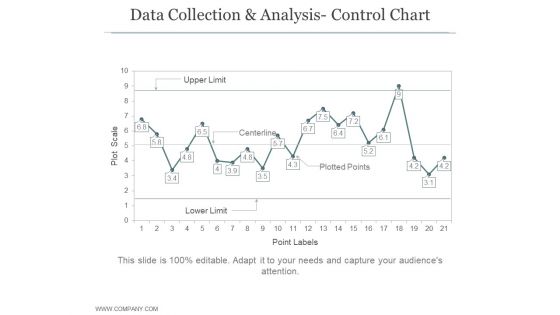
Data Collection And Analysis Control Chart Ppt PowerPoint Presentation Example File
This is a data collection and analysis control chart ppt powerpoint presentation example file. This is a four stage process. The stages in this process are business, strategy, marketing, bar graph, growth strategy.
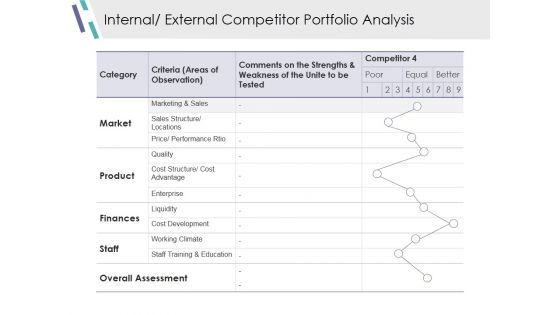
Internal External Competitor Portfolio Analysis Ppt PowerPoint Presentation Model Infographic Template
This is a internal external competitor portfolio analysis ppt powerpoint presentation model infographic template. This is a five stage process. The stages in this process are market, product, finances, staff, overall assessment.
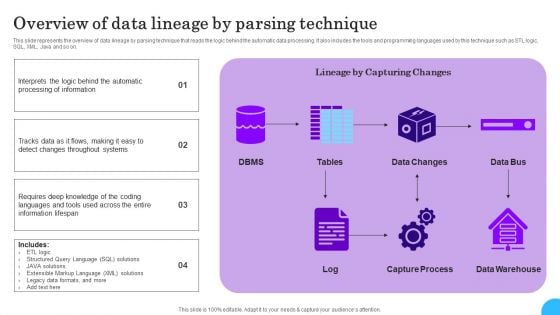
Comprehensive Analysis Of Different Data Lineage Classification Overview Of Data Lineage By Parsing Diagrams PDF
This slide represents the overview of data lineage by parsing technique that reads the logic behind the automatic data processing. It also includes the tools and programming languages used by this technique such as STL logic, SQL, XML, Java and so on. Slidegeeks is one of the best resources for PowerPoint templates. You can download easily and regulate Comprehensive Analysis Of Different Data Lineage Classification Overview Of Data Lineage By Parsing Diagrams PDF for your personal presentations from our wonderful collection. A few clicks is all it takes to discover and get the most relevant and appropriate templates. Use our Templates to add a unique zing and appeal to your presentation and meetings. All the slides are easy to edit and you can use them even for advertisement purposes.

Business Diagram Data Driven Bar Graph And Pie Chart For Analysis PowerPoint Slide
This PowerPoint template displays technology gadgets with various business charts. Use this diagram slide, in your presentations to make business reports for statistical analysis. You may use this diagram to impart professional appearance to your presentations.
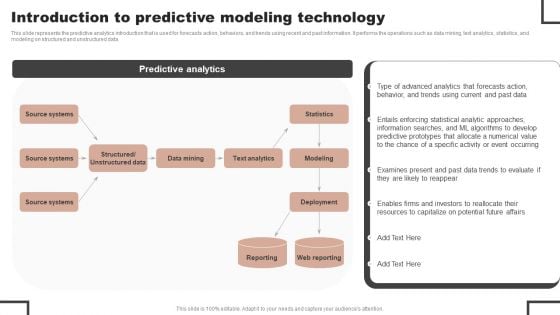
Forecast Analysis Technique IT Introduction To Predictive Modeling Technology Portrait PDF
This slide represents the predictive analytics introduction that is used for forecasts action, behaviors, and trends using recent and past information. It performs the operations such as data mining, text analytics, statistics, and modeling on structured and unstructured data. Boost your pitch with our creative Forecast Analysis Technique IT Introduction To Predictive Modeling Technology Portrait PDF. Deliver an awe inspiring pitch that will mesmerize everyone. Using these presentation templates you will surely catch everyones attention. You can browse the ppts collection on our website. We have researchers who are experts at creating the right content for the templates. So you do not have to invest time in any additional work. Just grab the template now and use them.
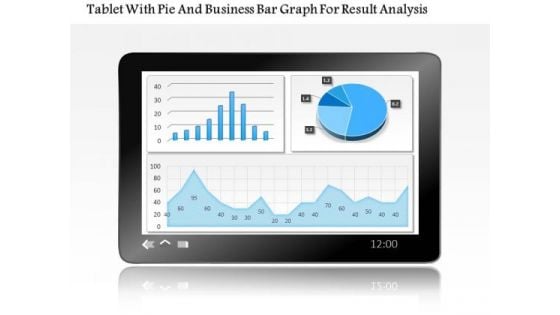
Business Diagram Tablet With Pie And Business Bar Graph For Result Analysis PowerPoint Slide
This PowerPoint template displays technology gadgets with various business charts. Use this diagram slide, in your presentations to make business reports for statistical analysis. You may use this diagram to impart professional appearance to your presentations.

Global Data Security Industry Report Pestle Analysis Of Global Cybersecurity Industry IR SS V
The slide depicts PESTLE analysis which companies can use to evaluate the external factors that impact the industrys growth and profitability. It enables companies to make informed decisions and strategic planning in a dynamic business environment. Key components include political, legal, economic, social, technological and environmental aspects. This Global Data Security Industry Report Pestle Analysis Of Global Cybersecurity Industry IR SS V is perfect for any presentation, be it in front of clients or colleagues. It is a versatile and stylish solution for organizing your meetings. The Global Data Security Industry Report Pestle Analysis Of Global Cybersecurity Industry IR SS V features a modern design for your presentation meetings. The adjustable and customizable slides provide unlimited possibilities for acing up your presentation. Slidegeeks has done all the homework before launching the product for you. So, do not wait, grab the presentation templates today The slide depicts PESTLE analysis which companies can use to evaluate the external factors that impact the industrys growth and profitability. It enables companies to make informed decisions and strategic planning in a dynamic business environment. Key components include political, legal, economic, social, technological and environmental aspects.
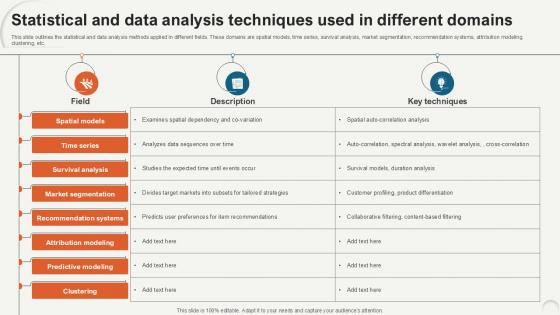
Statistical And Data Analysis Techniques Data Analytics For Informed Decision Ppt Sample
This slide outlines the statistical and data analysis methods applied in different fields. These domains are spatial models, time series, survival analysis, market segmentation, recommendation systems, attribution modeling, clustering, etc. Boost your pitch with our creative Statistical And Data Analysis Techniques Data Analytics For Informed Decision Ppt Sample. Deliver an awe-inspiring pitch that will mesmerize everyone. Using these presentation templates you will surely catch everyones attention. You can browse the ppts collection on our website. We have researchers who are experts at creating the right content for the templates. So you do not have to invest time in any additional work. Just grab the template now and use them. This slide outlines the statistical and data analysis methods applied in different fields. These domains are spatial models, time series, survival analysis, market segmentation, recommendation systems, attribution modeling, clustering, etc.
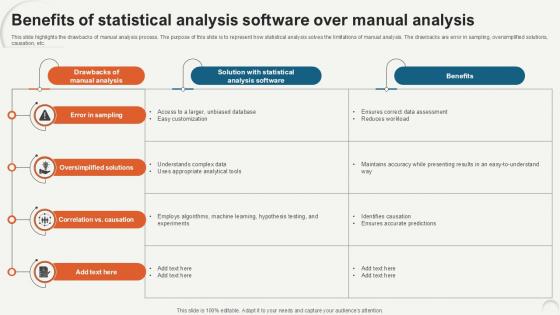
Benefits Of Statistical Analysis Data Analytics For Informed Decision Ppt Slide
This slide highlights the drawbacks of manual analysis process. The purpose of this slide is to represent how statistical analysis solves the limitations of manual analysis. The drawbacks are error in sampling, oversimplified solutions, causation, etc. Slidegeeks is one of the best resources for PowerPoint templates. You can download easily and regulate Benefits Of Statistical Analysis Data Analytics For Informed Decision Ppt Slide for your personal presentations from our wonderful collection. A few clicks is all it takes to discover and get the most relevant and appropriate templates. Use our Templates to add a unique zing and appeal to your presentation and meetings. All the slides are easy to edit and you can use them even for advertisement purposes. This slide highlights the drawbacks of manual analysis process. The purpose of this slide is to represent how statistical analysis solves the limitations of manual analysis. The drawbacks are error in sampling, oversimplified solutions, causation, etc.
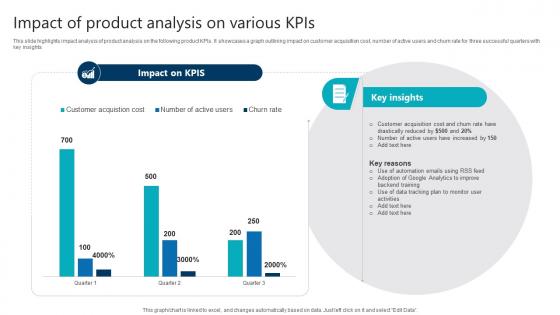
Impact Of Product Analysis On Various Kpis Product Analytics Implementation Data Analytics V
This slide highlights impact analysis of product analysis on the following product KPIs. It showcases a graph outlining impact on customer acquisition cost, number of active users and churn rate for three successful quarters with key insights Are you searching for a Impact Of Product Analysis On Various Kpis Product Analytics Implementation Data Analytics V that is uncluttered, straightforward, and original Its easy to edit, and you can change the colors to suit your personal or business branding. For a presentation that expresses how much effort you have put in, this template is ideal With all of its features, including tables, diagrams, statistics, and lists, its perfect for a business plan presentation. Make your ideas more appealing with these professional slides. Download Impact Of Product Analysis On Various Kpis Product Analytics Implementation Data Analytics V from Slidegeeks today. This slide highlights impact analysis of product analysis on the following product KPIs. It showcases a graph outlining impact on customer acquisition cost, number of active users and churn rate for three successful quarters with key insights

Application Of Artificial Intelligence In Data Analysis Data Analytics SS V
This slide outlines applications of AI in data analysis aimed at helping businesses save time and effort. It covers application areas such as generate code or debug errors, explain analysis, create reports and automated data entry .Slidegeeks is one of the best resources for PowerPoint templates. You can download easily and regulate Application Of Artificial Intelligence In Data Analysis Data Analytics SS V for your personal presentations from our wonderful collection. A few clicks is all it takes to discover and get the most relevant and appropriate templates. Use our Templates to add a unique zing and appeal to your presentation and meetings. All the slides are easy to edit and you can use them even for advertisement purposes. This slide outlines applications of AI in data analysis aimed at helping businesses save time and effort. It covers application areas such as generate code or debug errors, explain analysis, create reports and automated data entry .
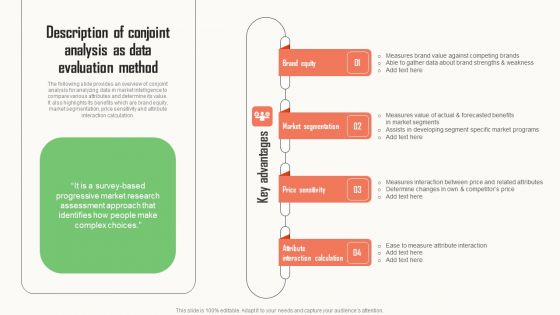
Strategic Market Insight Implementation Guide Description Of Conjoint Analysis As Data Evaluation Method Graphics PDF
The following slide provides an overview of conjoint analysis for analyzing data in market intelligence to compare various attributes and determine its value. It also highlights its benefits which are brand equity, market segmentation, price sensitivity and attribute interaction calculation. Whether you have daily or monthly meetings, a brilliant presentation is necessary. Strategic Market Insight Implementation Guide Description Of Conjoint Analysis As Data Evaluation Method Graphics PDF can be your best option for delivering a presentation. Represent everything in detail using Strategic Market Insight Implementation Guide Description Of Conjoint Analysis As Data Evaluation Method Graphics PDF and make yourself stand out in meetings. The template is versatile and follows a structure that will cater to your requirements. All the templates prepared by Slidegeeks are easy to download and edit. Our research experts have taken care of the corporate themes as well. So, give it a try and see the results.
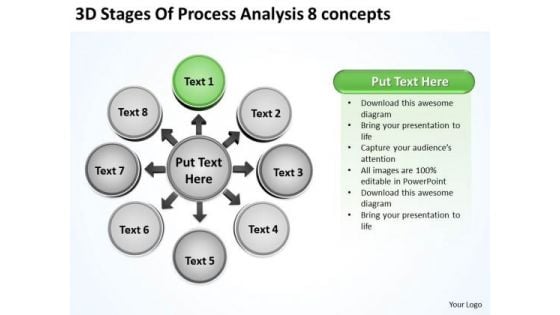
3d Stages Of Process Analysis 8 Concepts Cycle Spoke Chart PowerPoint Templates
We present our 3d stages of process analysis 8 concepts Cycle Spoke Chart PowerPoint templates.Present our Business PowerPoint Templates because infrastructure growth is an obvious requirement of today.inform your group on how exactly this potential is tailor made for you. Download and present our Circle Charts PowerPoint Templates because you can Unravel the desired and essential elements of your overall strategy. Present our Shapes PowerPoint Templates because Our PowerPoint Templates and Slides are specially created by a professional team with vast experience. They diligently strive to come up with the right vehicle for your brilliant Ideas. Download our Process and Flows PowerPoint Templates because you can Break it all down to Key Result Areas. Download and present our Success PowerPoint Templates because your quest has taken you well onto the path of success.Use these PowerPoint slides for presentations relating to Achieve, act, actions, around, arrows,assess, assessment, business, circle,concept, cycle, decide, decision,direction, illustration, isolated, plan,process, steps, strategy, succeed,symbol, isolated, isometric, market,motion, movement, organization, p perspective, presentation,process, processchart, recycle, report,ring, sign, step, stock. The prominent colors used in the PowerPoint template are Green dark , Gray, White. The feedback we get is that our 3d stages of process analysis 8 concepts Cycle Spoke Chart PowerPoint templates are designed by professionals The feedback we get is that our assessment PowerPoint templates and PPT Slides are Pretty. Presenters tell us our 3d stages of process analysis 8 concepts Cycle Spoke Chart PowerPoint templates are Royal. The feedback we get is that our actions PowerPoint templates and PPT Slides are Chic. PowerPoint presentation experts tell us our 3d stages of process analysis 8 concepts Cycle Spoke Chart PowerPoint templates are Nice. Customers tell us our arrows PowerPoint templates and PPT Slides are Nice. Import ideas with our 3d Stages Of Process Analysis 8 Concepts Cycle Spoke Chart PowerPoint Templates. Download without worries with our money back guaranteee.
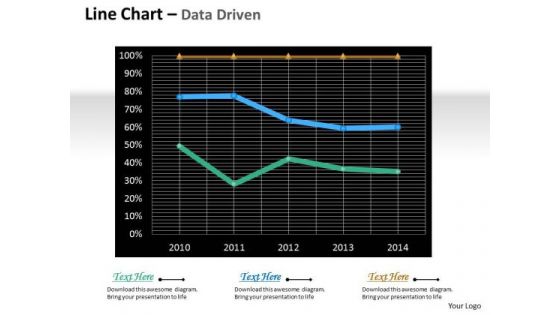
Multivariate Data Analysis Driven Line Chart For Market Survey PowerPoint Slides Templates
Rake In The Dough With
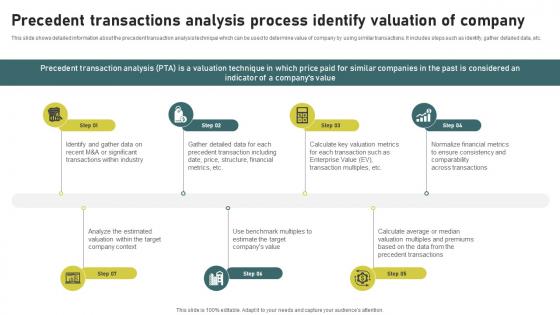
Precedent Transactions Analysis Process Investment Banking Simplified Functions Fin SS V
This slide shows detailed information about the precedent transaction analysis technique which can be used to determine value of company by using similar transactions. It includes steps such as identify, gather detailed data, etc. Slidegeeks is one of the best resources for PowerPoint templates. You can download easily and regulate Precedent Transactions Analysis Process Investment Banking Simplified Functions Fin SS V for your personal presentations from our wonderful collection. A few clicks is all it takes to discover and get the most relevant and appropriate templates. Use our Templates to add a unique zing and appeal to your presentation and meetings. All the slides are easy to edit and you can use them even for advertisement purposes. This slide shows detailed information about the precedent transaction analysis technique which can be used to determine value of company by using similar transactions. It includes steps such as identify, gather detailed data, etc.

Global Data Security Industry Report Geographical Analysis For Cybersecurity Industry IR SS V
The slide highlights the geographical summary of current state of cybersecurity industry. The purpose of the slide is to provide insights on cybersecurity landscape, trends, development at regional levels. It helps stakeholders in understanding the market dynamics, regulatory environments and potential growth opportunities. If your project calls for a presentation, then Slidegeeks is your go-to partner because we have professionally designed, easy-to-edit templates that are perfect for any presentation. After downloading, you can easily edit Global Data Security Industry Report Geographical Analysis For Cybersecurity Industry IR SS V and make the changes accordingly. You can rearrange slides or fill them with different images. Check out all the handy templates The slide highlights the geographical summary of current state of cybersecurity industry. The purpose of the slide is to provide insights on cybersecurity landscape, trends, development at regional levels. It helps stakeholders in understanding the market dynamics, regulatory environments and potential growth opportunities.
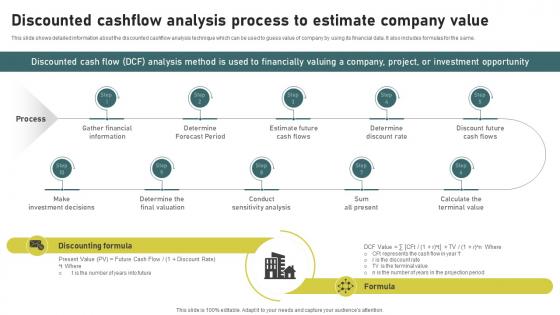
Discounted Cashflow Analysis Process To Investment Banking Simplified Functions Fin SS V
This slide shows detailed information about the discounted cashflow analysis technique which can be used to guess value of company by using its financial data. It also includes formulas for the same. Make sure to capture your audiences attention in your business displays with our gratis customizable Discounted Cashflow Analysis Process To Investment Banking Simplified Functions Fin SS V. These are great for business strategies, office conferences, capital raising or task suggestions. If you desire to acquire more customers for your tech business and ensure they stay satisfied, create your own sales presentation with these plain slides. This slide shows detailed information about the discounted cashflow analysis technique which can be used to guess value of company by using its financial data. It also includes formulas for the same.
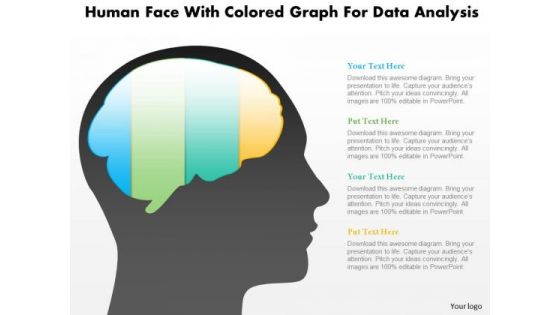
Business Diagram Human Face With Colored Graph For Data Analysis PowerPoint Slide
This diagram displays human face graphic with colored graph. This diagram can be used to represent strategy, planning, thinking of business plan. Display business options in your presentations by using this creative diagram.
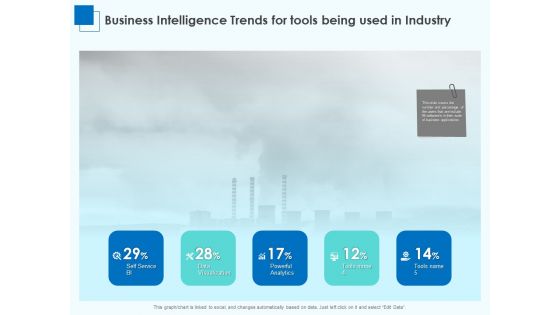
Corporate Intelligence Business Analysis Business Intelligence Trends For Tools Being Used In Industry Topics PDF
This is a corporate intelligence business analysis business intelligence trends for tools being used in industry topics pdf template with various stages. Focus and dispense information on five stages using this creative set, that comes with editable features. It contains large content boxes to add your information on topics like data visualization, powerful analytics, self service. You can also showcase facts, figures, and other relevant content using this PPT layout. Grab it now.

Comparable Company Analysis To Investment Banking Simplified Functions Fin SS V
This slide shows detailed process of comparable company analysis technique which can be used to estimate value of company by using data of similar company. It includes steps such as identify, gather data, etc. Do you have to make sure that everyone on your team knows about any specific topic I yes, then you should give Comparable Company Analysis To Investment Banking Simplified Functions Fin SS V a try. Our experts have put a lot of knowledge and effort into creating this impeccable Comparable Company Analysis To Investment Banking Simplified Functions Fin SS V. You can use this template for your upcoming presentations, as the slides are perfect to represent even the tiniest detail. You can download these templates from the Slidegeeks website and these are easy to edit. So grab these today This slide shows detailed process of comparable company analysis technique which can be used to estimate value of company by using data of similar company. It includes steps such as identify, gather data, etc.
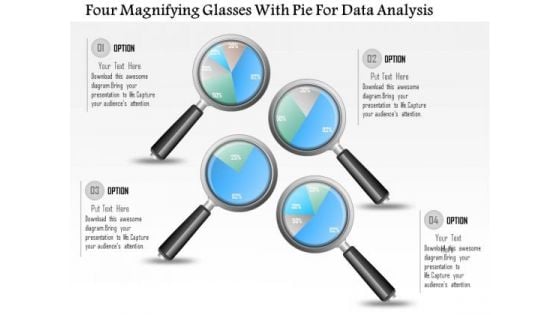
Business Diagram Four Magnifying Glasses With Pie For Data Analysis PowerPoint Slide
This business diagram displays graphic of pie charts in shape of magnifying glasses This business slide is suitable to present and compare business data. Use this diagram to build professional presentations for your viewers.

Business Diagram Four Pie Chart For Data Driven Result Analysis Of Business PowerPoint Slide
This business diagram displays graphic of pie charts in shape of flasks. This business slide is suitable to present and compare business data. Use this diagram to build professional presentations for your viewers.

Data Analysis In Excel 3d Column Chart To Represent Information PowerPoint Templates
Rake In The Dough With
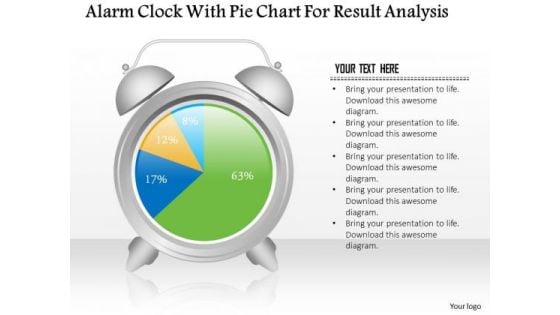
Business Diagram Alarm Clock With Pie Chart For Result Analysis PowerPoint Slide
This business slide displays alarm clock with pie chart. This diagram is a data visualization tool that gives you a simple way to present statistical information. This slide helps your audience examine and interpret the data you present.
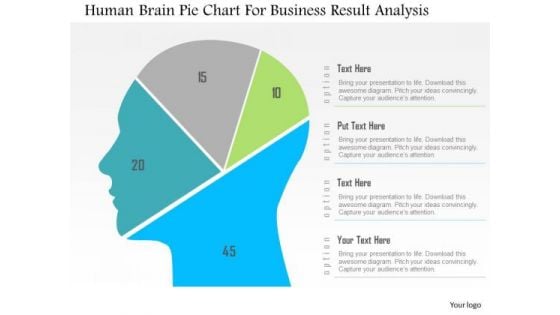
Business Diagram Human Brain Pie Chart For Business Result Analysis PowerPoint Slide
This diagram displays human face graphic divided into sections. This section can be used for data display. Use this diagram to build professional presentations for your viewers.
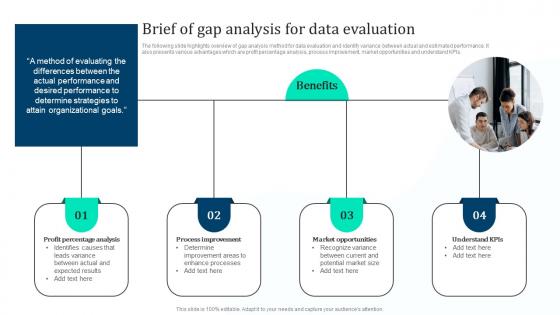
Brief Of Gap Analysis Data Marketing Intelligence Guide Data Gathering Clipart Pdf
The following slide highlights overview of gap analysis method for data evaluation and identify variance between actual and estimated performance. It also presents various advantages which are profit percentage analysis, process improvement, market opportunities and understand KPIs. Slidegeeks is one of the best resources for PowerPoint templates. You can download easily and regulate Brief Of Gap Analysis Data Marketing Intelligence Guide Data Gathering Clipart Pdf for your personal presentations from our wonderful collection. A few clicks is all it takes to discover and get the most relevant and appropriate templates. Use our Templates to add a unique zing and appeal to your presentation and meetings. All the slides are easy to edit and you can use them even for advertisement purposes. The following slide highlights overview of gap analysis method for data evaluation and identify variance between actual and estimated performance. It also presents various advantages which are profit percentage analysis, process improvement, market opportunities and understand KPIs.
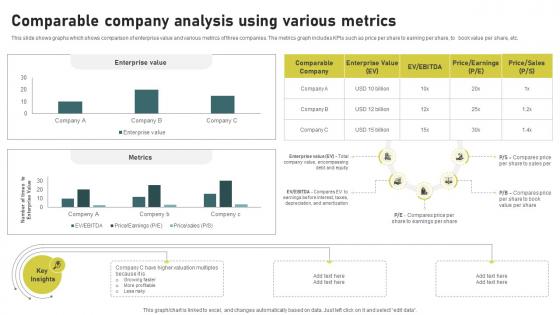
Comparable Company Analysis Using Investment Banking Simplified Functions Fin SS V
This slide shows graphs which shows comparison of enterprise value and various metrics of three companies. The metrics graph includes KPIs such as price per share to earning per share, to book value per share, etc. Get a simple yet stunning designed Comparable Company Analysis Using Investment Banking Simplified Functions Fin SS V. It is the best one to establish the tone in your meetings. It is an excellent way to make your presentations highly effective. So, download this PPT today from Slidegeeks and see the positive impacts. Our easy-to-edit Comparable Company Analysis Using Investment Banking Simplified Functions Fin SS V can be your go-to option for all upcoming conferences and meetings. So, what are you waiting for Grab this template today. This slide shows graphs which shows comparison of enterprise value and various metrics of three companies. The metrics graph includes KPIs such as price per share to earning per share, to book value per share, etc.
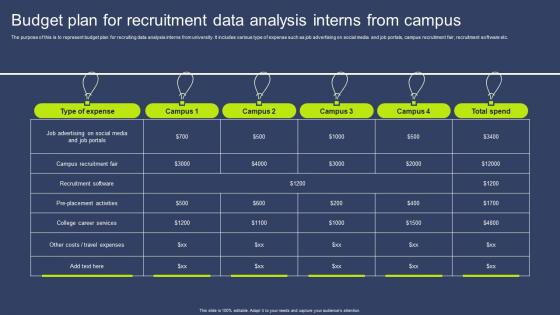
Budget Plan For Recruitment Data Analysis Interns From Campus Mockup Pdf
The purpose of this is to represent budget plan for recruiting data analysis interns from university. It includes various type of expense such as job advertising on social media and job portals, campus recruitment fair, recruitment software etc. Pitch your topic with ease and precision using this Budget Plan For Recruitment Data Analysis Interns From Campus Mockup Pdf. This layout presents information on Type Expense, Campus Recruitment Fair, Recruitment Software. It is also available for immediate download and adjustment. So, changes can be made in the color, design, graphics or any other component to create a unique layout. The purpose of this is to represent budget plan for recruiting data analysis interns from university. It includes various type of expense such as job advertising on social media and job portals, campus recruitment fair, recruitment software etc.
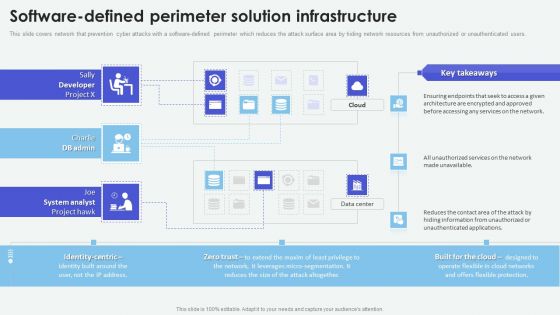
Cloud Based Computing Analysis Software Defined Perimeter Solution Infrastructure Summary PDF
This slide covers network that prevention cyber attacks with a software-defined perimeter which reduces the attack surface area by hiding network resources from unauthorized or unauthenticated users. Take your projects to the next level with our ultimate collection of Cloud Based Computing Analysis Software Defined Perimeter Solution Infrastructure Summary PDF. Slidegeeks has designed a range of layouts that are perfect for representing task or activity duration, keeping track of all your deadlines at a glance. Tailor these designs to your exact needs and give them a truly corporate look with your own brand colors theyll make your projects stand out from the rest
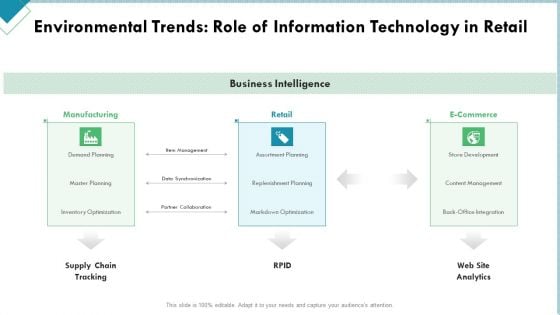
Market Analysis Of Retail Sector Environmental Trends Role Of Information Technology In Retail Microsoft PDF
Presenting market analysis of retail sector environmental trends role of information technology in retail microsoft pdf to provide visual cues and insights. Share and navigate important information on three stages that need your due attention. This template can be used to pitch topics like manufacturing, retail, e commerce. In addtion, this PPT design contains high resolution images, graphics, etc, that are easily editable and available for immediate download.
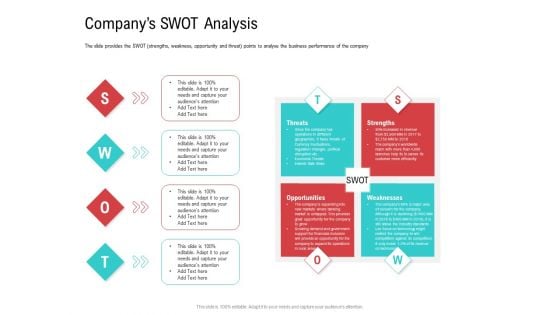
Investor Pitch Deck Collect Funding Spot Market Companys Swot Analysis Infographics PDF
The slide provides the SWOT strengths, weakness, opportunity and threat points to analyse the business performance of the company. Presenting investor pitch deck collect funding spot market companys swot analysis infographics pdf to provide visual cues and insights. Share and navigate important information on four stages that need your due attention. This template can be used to pitch topics like threats, strengths, weaknesses, opportunities. In addition, this PPT design contains high-resolution images, graphics, etc, that are easily editable and available for immediate download.
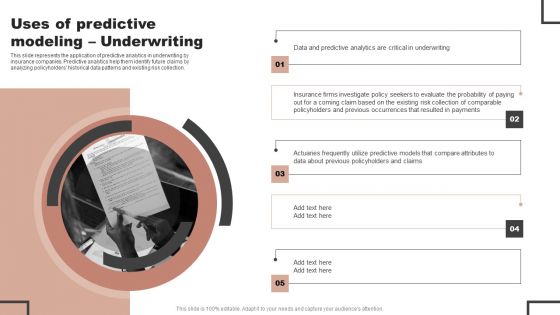
Forecast Analysis Technique IT Uses Of Predictive Modeling Underwriting Portrait PDF
This slide represents the application of predictive analytics in underwriting by insurance companies. Predictive analytics help them identify future claims by analyzing policyholders historical data patterns and existing risk collection. The best PPT templates are a great way to save time, energy, and resources. Slidegeeks have 100 percent editable powerpoint slides making them incredibly versatile. With these quality presentation templates, you can create a captivating and memorable presentation by combining visually appealing slides and effectively communicating your message. Download Forecast Analysis Technique IT Uses Of Predictive Modeling Underwriting Portrait PDF from Slidegeeks and deliver a wonderful presentation.
Recruitment Report Sheet Analysis Icon To Identify Resource Gaps Clipart PDF
Persuade your audience using this Recruitment Report Sheet Analysis Icon To Identify Resource Gaps Clipart PDF. This PPT design covers Three stages, thus making it a great tool to use. It also caters to a variety of topics including Recruitment Report, Sheet Analysis, Identify Resource Gaps. Download this PPT design now to present a convincing pitch that not only emphasizes the topic but also showcases your presentation skills.
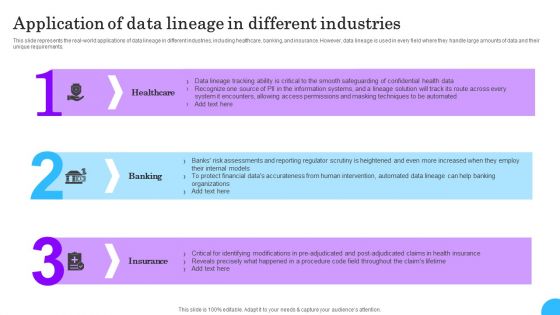
Comprehensive Analysis Of Different Data Lineage Classification Application Of Data Lineage Different Microsoft PDF
This slide represents the real world applications of data lineage in different industries, including healthcare, banking, and insurance. However, data lineage is used in every field where they handle large amounts of data and their unique requirements. Slidegeeks is one of the best resources for PowerPoint templates. You can download easily and regulate Comprehensive Analysis Of Different Data Lineage Classification Application Of Data Lineage Different Microsoft PDF for your personal presentations from our wonderful collection. A few clicks is all it takes to discover and get the most relevant and appropriate templates. Use our Templates to add a unique zing and appeal to your presentation and meetings. All the slides are easy to edit and you can use them even for advertisement purposes.
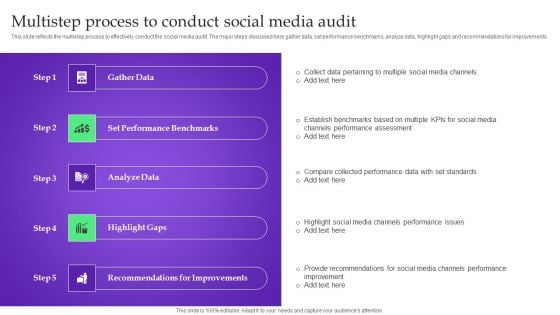
Analysis Plan For E Commerce Promotion Tactics Multistep Process To Conduct Social Media Audit Themes PDF
This slide reflects the multistep process to effectively conduct the social media audit. The major steps discussed here gather data, set performance benchmarks, analyze data, highlight gaps and recommendations for improvements. This slide reflects the multistep process to effectively conduct the social media audit. The major steps discussed here gather data, set performance benchmarks, analyze data, highlight gaps and recommendations for improvements. Want to ace your presentation in front of a live audience Our Analysis Plan For E Commerce Promotion Tactics Multistep Process To Conduct Social Media Audit Themes PDF can help you do that by engaging all the users towards you. Slidegeeks experts have put their efforts and expertise into creating these impeccable powerpoint presentations so that you can communicate your ideas clearly. Moreover, all the templates are customizable, and easy to edit and downloadable. Use these for both personal and commercial use.
Data Analysis Reports Under Magnifying Glass Ppt Powerpoint Presentation Summary Slideshow
This is a data analysis reports under magnifying glass ppt powerpoint presentation summary slideshow. This is a three stage process. The stages in this process are data visualization icon, data management icon.
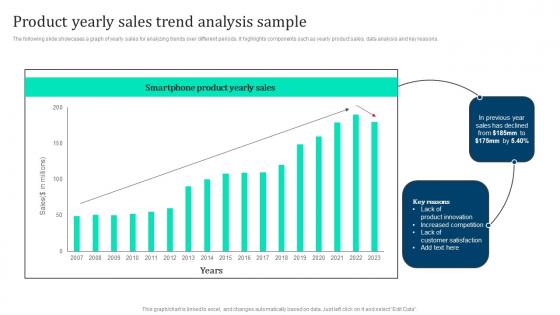
Product Yearly Sales Trend Analysis Marketing Intelligence Guide Data Gathering Introduction Pdf
The following slide showcases a graph of yearly sales for analyzing trends over different periods. It highlights components such as yearly product sales, data analysis and key reasons. Create an editable Product Yearly Sales Trend Analysis Marketing Intelligence Guide Data Gathering Introduction Pdf that communicates your idea and engages your audience. Whether you are presenting a business or an educational presentation, pre designed presentation templates help save time. Product Yearly Sales Trend Analysis Marketing Intelligence Guide Data Gathering Introduction Pdf is highly customizable and very easy to edit, covering many different styles from creative to business presentations. Slidegeeks has creative team members who have crafted amazing templates. So, go and get them without any delay. The following slide showcases a graph of yearly sales for analyzing trends over different periods. It highlights components such as yearly product sales, data analysis and key reasons.
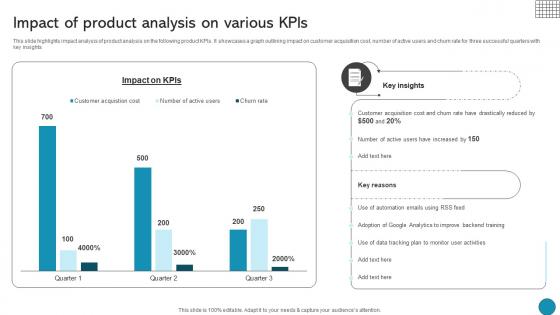
Impact Of Product Analysis On Various Kpis Driving Business Success Integrating Product
This slide highlights impact analysis of product analysis on the following product KPIs. It showcases a graph outlining impact on customer acquisition cost, number of active users and churn rate for three successful quarters with key insights Retrieve professionally designed Impact Of Product Analysis On Various Kpis Driving Business Success Integrating Product to effectively convey your message and captivate your listeners. Save time by selecting pre-made slideshows that are appropriate for various topics, from business to educational purposes. These themes come in many different styles, from creative to corporate, and all of them are easily adjustable and can be edited quickly. Access them as PowerPoint templates or as Google Slides themes. You do not have to go on a hunt for the perfect presentation because Slidegeeks got you covered from everywhere. This slide highlights impact analysis of product analysis on the following product KPIs. It showcases a graph outlining impact on customer acquisition cost, number of active users and churn rate for three successful quarters with key insights
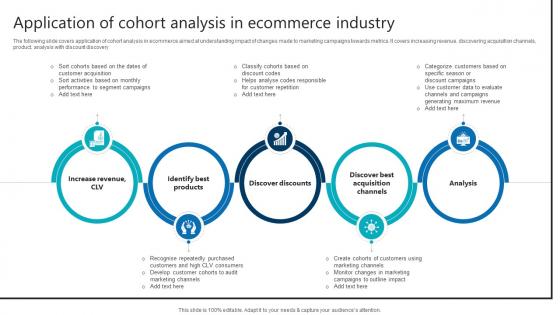
Application Of Cohort Analysis In Ecommerce Industry Product Analytics Implementation Data Analytics V
The following slide covers application of cohort analysis in ecommerce aimed at understanding impact of changes made to marketing campaigns towards metrics. It covers increasing revenue, discovering acquisition channels, product, analysis with discount discovery Boost your pitch with our creative Application Of Cohort Analysis In Ecommerce Industry Product Analytics Implementation Data Analytics V. Deliver an awe-inspiring pitch that will mesmerize everyone. Using these presentation templates you will surely catch everyones attention. You can browse the ppts collection on our website. We have researchers who are experts at creating the right content for the templates. So you do not have to invest time in any additional work. Just grab the template now and use them. The following slide covers application of cohort analysis in ecommerce aimed at understanding impact of changes made to marketing campaigns towards metrics. It covers increasing revenue, discovering acquisition channels, product, analysis with discount discovery

Global Cybersecurity Industry Segmentation Analysis Global Data Security Industry Report IR SS V
The slide showcases the cyber security industry segmentation based on attributes such as component, security type, deployment, organization size, end-user and region. This slide aims to identify, analyze and categorize the market to serve clients demands and meet their expectations. Boost your pitch with our creative Global Cybersecurity Industry Segmentation Analysis Global Data Security Industry Report IR SS V. Deliver an awe-inspiring pitch that will mesmerize everyone. Using these presentation templates you will surely catch everyones attention. You can browse the ppts collection on our website. We have researchers who are experts at creating the right content for the templates. So you do not have to invest time in any additional work. Just grab the template now and use them. The slide showcases the cyber security industry segmentation based on attributes such as component, security type, deployment, organization size, end-user and region. This slide aims to identify, analyze and categorize the market to serve clients demands and meet their expectations.

Attribution Analysis For Facebook Ad Campaign Product Analytics Implementation Data Analytics V
This slide highlights attribution analysis conducted to optimize ad campaigns of Facebook platform. It covers details on channels, expenses, number of visists, conversions and revenue generated Create an editable Attribution Analysis For Facebook Ad Campaign Product Analytics Implementation Data Analytics V that communicates your idea and engages your audience. Whether you are presenting a business or an educational presentation, pre-designed presentation templates help save time. Attribution Analysis For Facebook Ad Campaign Product Analytics Implementation Data Analytics V is highly customizable and very easy to edit, covering many different styles from creative to business presentations. Slidegeeks has creative team members who have crafted amazing templates. So, go and get them without any delay. This slide highlights attribution analysis conducted to optimize ad campaigns of Facebook platform. It covers details on channels, expenses, number of visists, conversions and revenue generated

Data Mining Tools Comparative Analysis Using Data Mining Tools To Optimize Processes AI SS V
This slide showcases comparative analysis of top 5 data mining tools available in the latter market. It provides details about cloud, on premise, Mac, Windows, Linux, pricing, etc. This Data Mining Tools Comparative Analysis Using Data Mining Tools To Optimize Processes AI SS V from Slidegeeks makes it easy to present information on your topic with precision. It provides customization options, so you can make changes to the colors, design, graphics, or any other component to create a unique layout. It is also available for immediate download, so you can begin using it right away. Slidegeeks has done good research to ensure that you have everything you need to make your presentation stand out. Make a name out there for a brilliant performance. This slide showcases comparative analysis of top 5 data mining tools available in the latter market. It provides details about cloud, on premise, Mac, Windows, Linux, pricing, etc.
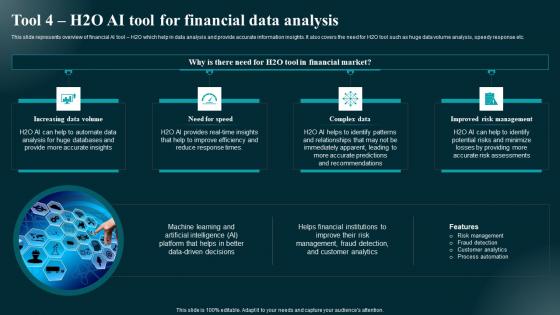
Tool 4 H2o AI Tool For Financial Data Analysis Applications And Impact Structure Pdf
This slide represents overview of financial AI tool H2O which help in data analysis and provide accurate information insights. It also covers the need for H2O tool such as huge data volume analysis, speedy response etc. Are you searching for a Tool 4 H2o AI Tool For Financial Data Analysis Applications And Impact Structure Pdf that is uncluttered, straightforward, and original Its easy to edit, and you can change the colors to suit your personal or business branding. For a presentation that expresses how much effort you have put in, this template is ideal With all of its features, including tables, diagrams, statistics, and lists, its perfect for a business plan presentation. Make your ideas more appealing with these professional slides. Download Tool 4 H2o AI Tool For Financial Data Analysis Applications And Impact Structure Pdf from Slidegeeks today. This slide represents overview of financial AI tool H2O which help in data analysis and provide accurate information insights. It also covers the need for H2O tool such as huge data volume analysis, speedy response etc.
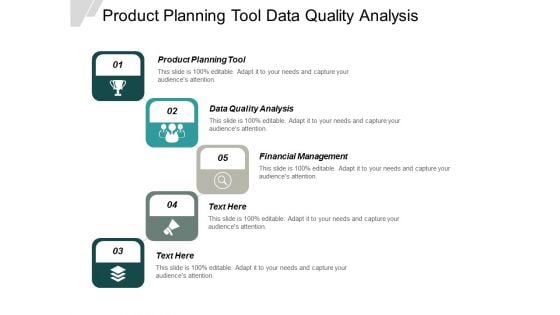
Product Planning Tool Data Quality Analysis Financial Management Ppt PowerPoint Presentation Styles Graphics Template
This is a product planning tool data quality analysis financial management ppt powerpoint presentation styles graphics template. This is a five stage process. The stages in this process are product planning tool, data quality analysis, financial management.
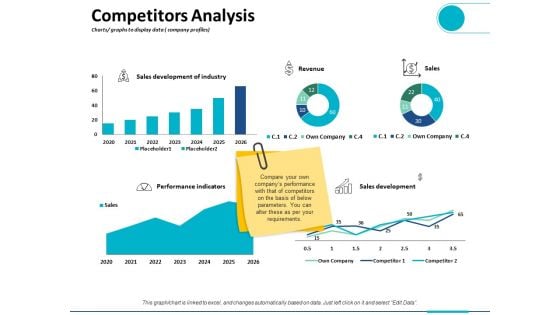
Competitors Analysis Charts Graphs To Display Data Company Profiles Ppt PowerPoint Presentation Outline Visual Aids
This is a competitors analysis charts graphs to display data company profiles ppt powerpoint presentation outline visual aids. This is a five stage process. The stages in this process are finance, analysis, business, investment, marketing.

Introduction To Text Analytics Process For Data Analysis PPT Example SS
This slide gives an overview of the text analytics process used to generate meaningful information from unstructured text documents. The best PPT templates are a great way to save time, energy, and resources. Slidegeeks have 100 percent editable powerpoint slides making them incredibly versatile. With these quality presentation templates, you can create a captivating and memorable presentation by combining visually appealing slides and effectively communicating your message. Download Introduction To Text Analytics Process For Data Analysis PPT Example SS from Slidegeeks and deliver a wonderful presentation. This slide gives an overview of the text analytics process used to generate meaningful information from unstructured text documents.
Description Conjoint Analysis Data Marketing Intelligence Guide Data Gathering Microsoft Pdf
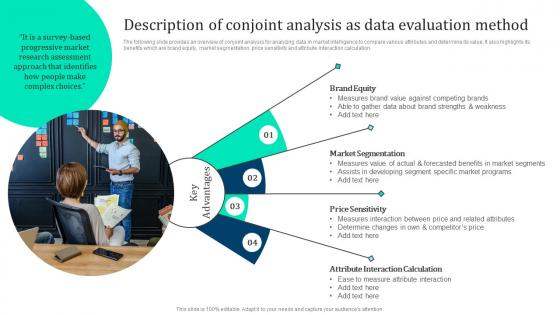
The following slide provides an overview of conjoint analysis for analyzing data in market intelligence to compare various attributes and determine its value. It also highlights its benefits which are brand equity, market segmentation, price sensitivity and attribute interaction calculation. Do you have an important presentation coming up Are you looking for something that will make your presentation stand out from the rest Look no further than Description Conjoint Analysis Data Marketing Intelligence Guide Data Gathering Microsoft Pdf. With our professional designs, you can trust that your presentation will pop and make delivering it a smooth process. And with Slidegeeks, you can trust that your presentation will be unique and memorable. So why wait Grab Description Conjoint Analysis Data Marketing Intelligence Guide Data Gathering Microsoft Pdf today and make your presentation stand out from the rest The following slide provides an overview of conjoint analysis for analyzing data in market intelligence to compare various attributes and determine its value. It also highlights its benefits which are brand equity, market segmentation, price sensitivity and attribute interaction calculation.
Analysis Of Marketing Campaign Before Integrating Mis MDSS For Enhanced Slides Pdf
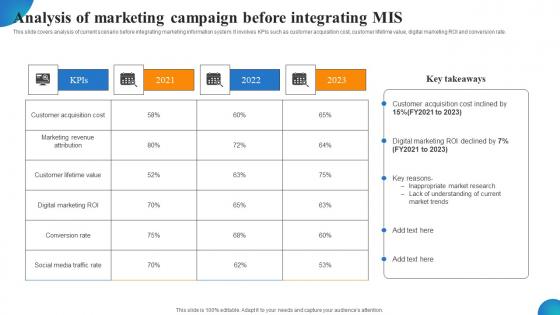
This slide covers analysis of current scenario before integrating marketing information system. It involves KPIs such as customer acquisition cost, customer lifetime value, digital marketing ROI and conversion rate. Boost your pitch with our creative Analysis Of Marketing Campaign Before Integrating Mis MDSS For Enhanced Slides Pdf Deliver an awe-inspiring pitch that will mesmerize everyone. Using these presentation templates you will surely catch everyones attention. You can browse the ppts collection on our website. We have researchers who are experts at creating the right content for the templates. So you do not have to invest time in any additional work. Just grab the template now and use them. This slide covers analysis of current scenario before integrating marketing information system. It involves KPIs such as customer acquisition cost, customer lifetime value, digital marketing ROI and conversion rate.
Impact Analysis Of Facility Comprehensive Guide For Building Management Template Pdf
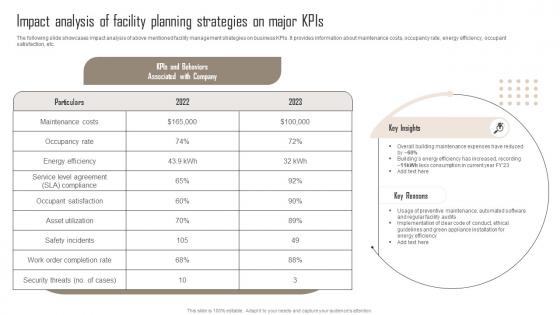
The following slide showcases impact analysis of above mentioned facility management strategies on business KPIs. It provides information about maintenance costs, occupancy rate, energy efficiency, occupant satisfaction, etc. Coming up with a presentation necessitates that the majority of the effort goes into the content and the message you intend to convey. The visuals of a PowerPoint presentation can only be effective if it supplements and supports the story that is being told. Keeping this in mind our experts created Impact Analysis Of Facility Comprehensive Guide For Building Management Template Pdf to reduce the time that goes into designing the presentation. This way, you can concentrate on the message while our designers take care of providing you with the right template for the situation. The following slide showcases impact analysis of above mentioned facility management strategies on business KPIs. It provides information about maintenance costs, occupancy rate, energy efficiency, occupant satisfaction, etc.
Competitive Comparative Analysis Based On Sales Metrics Ppt File Designs Pdf
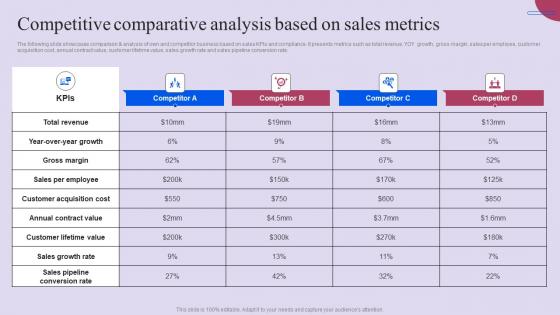
The following slide showcases comparison and analysis of own and competitor business based on sales KPIs and compliance. It presents metrics such as total revenue, YOY growth, gross margin, sales per employee, customer acquisition cost, annual contract value, customer lifetime value, sales growth rate and sales pipeline conversion rate. There are so many reasons you need a Competitive Comparative Analysis Based On Sales Metrics Ppt File Designs Pdf. The first reason is you can not spend time making everything from scratch, Thus, Slidegeeks has made presentation templates for you too. You can easily download these templates from our website easily. The following slide showcases comparison and analysis of own and competitor business based on sales KPIs and compliance. It presents metrics such as total revenue, YOY growth, gross margin, sales per employee, customer acquisition cost, annual contract value, customer lifetime value, sales growth rate and sales pipeline conversion rate.


 Continue with Email

 Home
Home


