Cost Analysis Dashboard
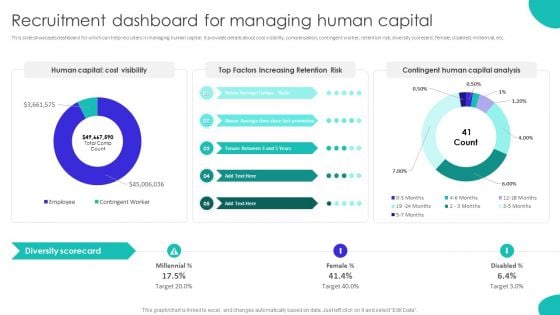
Improving Technology Based Recruitment Dashboard For Managing Human Capital Summary PDF
This slide showcases dashboard for which can help recruiters in managing human capital. It provides details about cost visibility, compensation, contingent worker, retention risk, diversity scorecard, female, disabled, millennial, etc. The Improving Technology Based Recruitment Dashboard For Managing Human Capital Summary PDF is a compilation of the most recent design trends as a series of slides. It is suitable for any subject or industry presentation, containing attractive visuals and photo spots for businesses to clearly express their messages. This template contains a variety of slides for the user to input data, such as structures to contrast two elements, bullet points, and slides for written information. Slidegeeks is prepared to create an impression.
Dashboard Showing Various Techniques For Business Card Marketing Ppt Icon Visual Aids PDF
This slide showcases the dashboard of business card marketing with three different campaigns. The campaign used in this template are business card marketing campaign, online marketing campaign and CTR by campaign. Deliver and pitch your topic in the best possible manner with this dashboard showing various techniques for business card marketing ppt icon visual aids pdf. Use them to share invaluable insights on cost per acquisitions, online marketing campaign, business marketing campaign and impress your audience. This template can be altered and modified as per your expectations. So, grab it now.
New Hires Data Tracker Dashboard Employee Attraction And Competency Ppt Slide
This slide shows dashboard including date related to new hires for recruitment. It include data related to new hires per month, new hires for various departments and by sources, etc. Coming up with a presentation necessitates that the majority of the effort goes into the content and the message you intend to convey. The visuals of a PowerPoint presentation can only be effective if it supplements and supports the story that is being told. Keeping this in mind our experts created New Hires Data Tracker Dashboard Employee Attraction And Competency Ppt Slide to reduce the time that goes into designing the presentation. This way, you can concentrate on the message while our designers take care of providing you with the right template for the situation. This slide shows dashboard including date related to new hires for recruitment. It include data related to new hires per month, new hires for various departments and by sources, etc.
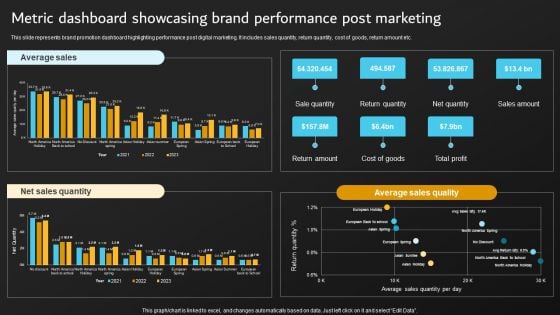
Implementation Of Digital Marketing Metric Dashboard Showcasing Brand Performance Diagrams PDF
This slide represents brand promotion dashboard highlighting performance post digital marketing. It includes sales quantity, return quantity, cost of goods, return amount etc. Slidegeeks has constructed Implementation Of Digital Marketing Metric Dashboard Showcasing Brand Performance Diagrams PDF after conducting extensive research and examination. These presentation templates are constantly being generated and modified based on user preferences and critiques from editors. Here, you will find the most attractive templates for a range of purposes while taking into account ratings and remarks from users regarding the content. This is an excellent jumping-off point to explore our content and will give new users an insight into our top-notch PowerPoint Templates.
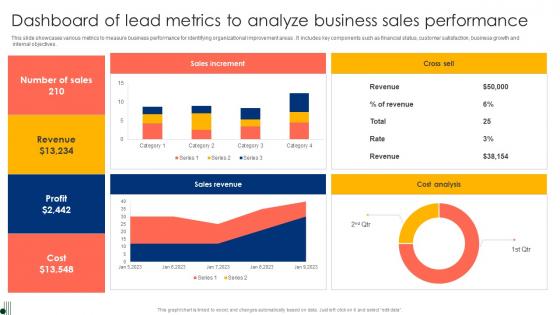
Dashboard Of Lead Metrics To Analyze Business Sales Performance Ppt Summary Graphics Pdf
This slide showcases various metrics to measure business performance for identifying organizational improvement areas. It includes key components such as financial status, customer satisfaction, business growth and internal objectives. Showcasing this set of slides titled Dashboard Of Lead Metrics To Analyze Business Sales Performance Ppt Summary Graphics Pdf. The topics addressed in these templates are Sales Increment, Cross Sell, Cost Analysis. All the content presented in this PPT design is completely editable. Download it and make adjustments in color, background, font etc. as per your unique business setting. This slide showcases various metrics to measure business performance for identifying organizational improvement areas. It includes key components such as financial status, customer satisfaction, business growth and internal objectives.
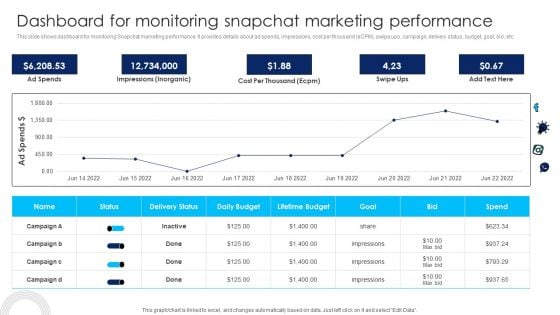
Using Social Media Platforms To Enhance Dashboard For Monitoring Snapchat Marketing Introduction PDF
This slide shows dashboard for monitoring Snapchat marketing performance. It provides details about ad spends, impressions, cost per thousand eCPM, swipe ups, campaign, delivery status, budget, goal, bid, etc. If your project calls for a presentation, then Slidegeeks is your go-to partner because we have professionally designed, easy-to-edit templates that are perfect for any presentation. After downloading, you can easily edit Using Social Media Platforms To Enhance Dashboard For Monitoring Snapchat Marketing Introduction PDF and make the changes accordingly. You can rearrange slides or fill them with different images. Check out all the handy templates
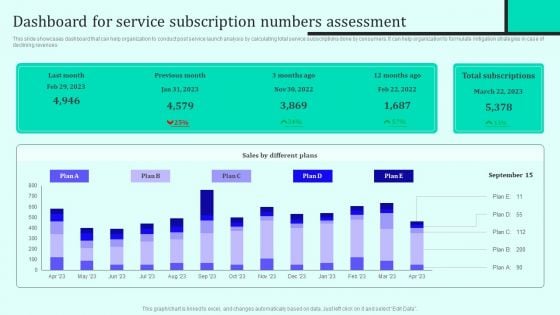
Implementing New Sales And Marketing Process For Services Dashboard For Service Subscription Diagrams PDF
This slide showcases dashboard that can help organization to conduct post service launch analysis by calculating total service subscriptions done by consumers. It can help organization to formulate mitigation strategies in case of declining revenues. Boost your pitch with our creative Implementing New Sales And Marketing Process For Services Dashboard For Service Subscription Diagrams PDF. Deliver an awe inspiring pitch that will mesmerize everyone. Using these presentation templates you will surely catch everyones attention. You can browse the ppts collection on our website. We have researchers who are experts at creating the right content for the templates. So you do not have to invest time in any additional work. Just grab the template now and use them.
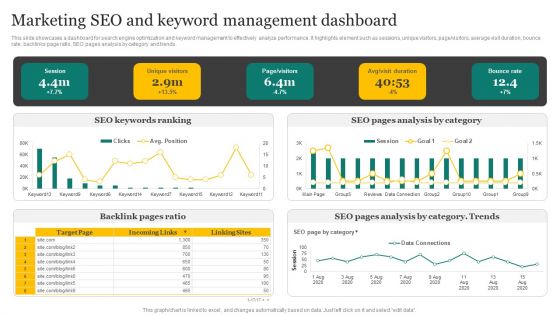
Strategic Promotion Plan Development Stages Marketing SEO And Keyword Management Dashboard Pictures PDF
This slide showcases a dashboard for search engine optimization and keyword management to effectively analyze performance. It highlights element such as sessions, unique visitors, page visitors, average visit duration, bounce rate, backlinks page ratio, SEO pages analysis by category and trends. Coming up with a presentation necessitates that the majority of the effort goes into the content and the message you intend to convey. The visuals of a PowerPoint presentation can only be effective if it supplements and supports the story that is being told. Keeping this in mind our experts created Strategic Promotion Plan Development Stages Marketing SEO And Keyword Management Dashboard Pictures PDF to reduce the time that goes into designing the presentation. This way, you can concentrate on the message while our designers take care of providing you with the right template for the situation.
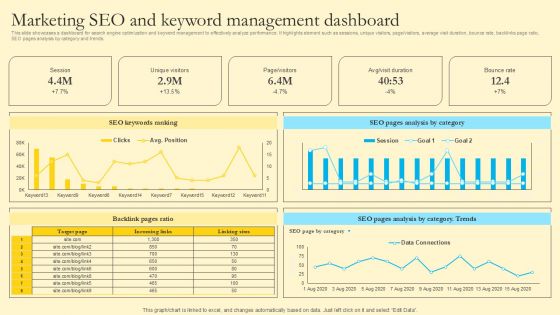
Comprehensive Guide For Sales And Advertising Processes Marketing SEO And Keyword Management Dashboard Pictures PDF
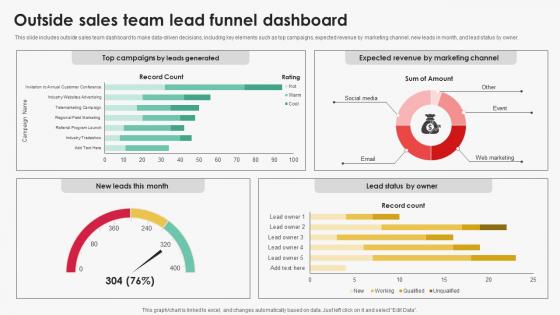
Outside Sales Team Lead Funnel Dashboard Efficient Sales Territory Management To Build SA SS V
This slide includes outside sales team dashboard to make data-driven decisions, including key elements such as top campaigns, expected revenue by marketing channel, new leads in month, and lead status by owner. Retrieve professionally designed Outside Sales Team Lead Funnel Dashboard Efficient Sales Territory Management To Build SA SS V to effectively convey your message and captivate your listeners. Save time by selecting pre-made slideshows that are appropriate for various topics, from business to educational purposes. These themes come in many different styles, from creative to corporate, and all of them are easily adjustable and can be edited quickly. Access them as PowerPoint templates or as Google Slides themes. You do not have to go on a hunt for the perfect presentation because Slidegeeks got you covered from everywhere. This slide includes outside sales team dashboard to make data-driven decisions, including key elements such as top campaigns, expected revenue by marketing channel, new leads in month, and lead status by owner.
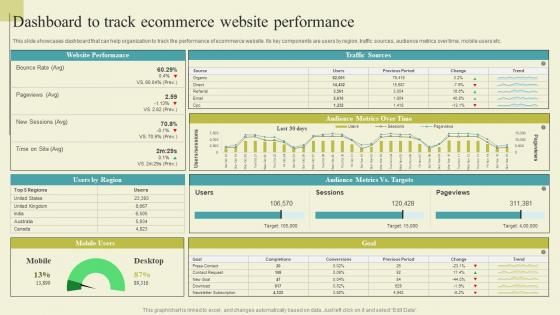
Successful Guide For Ecommerce Promotion Dashboard To Track Ecommerce Website Download Pdf
This slide showcases dashboard that can help organization to track the performance of ecommerce website. Its key components are users by region, traffic sources, audience metrics over time, mobile users etc. If you are looking for a format to display your unique thoughts, then the professionally designed Successful Guide For Ecommerce Promotion Dashboard To Track Ecommerce Website Download Pdf is the one for you. You can use it as a Google Slides template or a PowerPoint template. Incorporate impressive visuals, symbols, images, and other charts. Modify or reorganize the text boxes as you desire. Experiment with shade schemes and font pairings. Alter, share or cooperate with other people on your work. Download Successful Guide For Ecommerce Promotion Dashboard To Track Ecommerce Website Download Pdf and find out how to give a successful presentation. Present a perfect display to your team and make your presentation unforgettable. This slide showcases dashboard that can help organization to track the performance of ecommerce website. Its key components are users by region, traffic sources, audience metrics over time, mobile users etc.
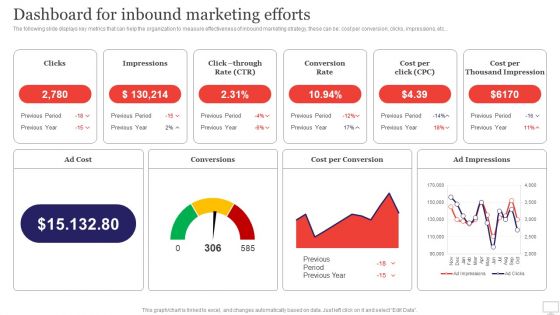
Target Audience Strategy For B2B And B2C Business Dashboard For Inbound Marketing Efforts Graphics PDF
The following slide displays key metrics that can help the organization to measure effectiveness of inbound marketing strategy, these can be cost per conversion, clicks, impressions, etc. If your project calls for a presentation, then Slidegeeks is your go-to partner because we have professionally designed, easy-to-edit templates that are perfect for any presentation. After downloading, you can easily edit Target Audience Strategy For B2B And B2C Business Dashboard For Inbound Marketing Efforts Graphics PDF and make the changes accordingly. You can rearrange slides or fill them with different images. Check out all the handy templates
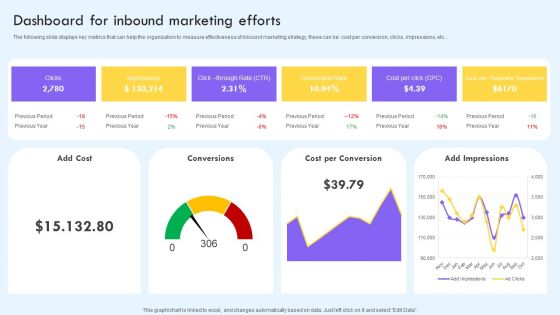
Dashboard For Inbound Marketing Efforts Ppt PowerPoint Presentation File Infographic Template PDF
The following slide displays key metrics that can help the organization to measure effectiveness of inbound marketing strategy, these can be cost per conversion, clicks, impressions, etc. If your project calls for a presentation, then Slidegeeks is your go to partner because we have professionally designed, easy to edit templates that are perfect for any presentation. After downloading, you can easily edit Dashboard For Inbound Marketing Efforts Ppt PowerPoint Presentation File Infographic Template PDF and make the changes accordingly. You can rearrange slides or fill them with different images. Check out all the handy templates.

Firm KPI Dashboard With Schedule Performance Index Ppt Visual Aids PDF
This graph or chart is linked to excel, and changes automatically based on data. Just left click on it and select Edit Data. Pitch your topic with ease and precision using this Firm KPI Dashboard With Schedule Performance Index Ppt Visual Aids PDF. This layout presents information on Project Cost Performance, Project Planning Stage, Monitor And Control. It is also available for immediate download and adjustment. So, changes can be made in the color, design, graphics or any other component to create a unique layout.
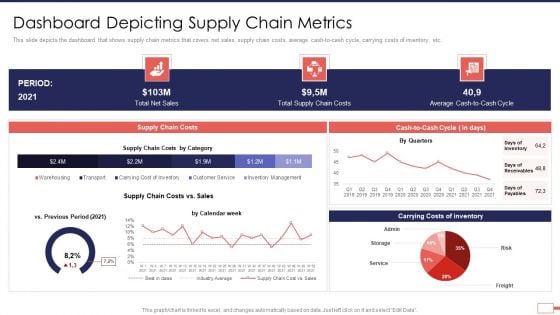
Iot Digital Twin Technology Post Covid Expenditure Management Dashboard Depicting Supply Chain Metrics Sample PDF
This slide depicts the dashboard that shows supply chain metrics that covers net sales, supply chain costs, average cash-to-cash cycle, carrying costs of inventory, etc. Deliver an awe inspiring pitch with this creative iot digital twin technology post covid expenditure management dashboard depicting supply chain metrics sample pdf bundle. Topics like dashboard depicting supply chain metrics can be discussed with this completely editable template. It is available for immediate download depending on the needs and requirements of the user.
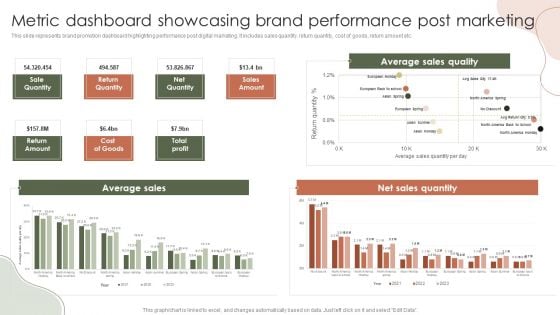
Digital Marketing Approach For Brand Awareness Metric Dashboard Showcasing Brand Performance Post Marketing Mockup PDF
Presenting this PowerPoint presentation, titled Digital Marketing Approach For Brand Awareness Metric Dashboard Showcasing Brand Performance Post Marketing Mockup This slide represents brand promotion dashboard highlighting performance post digital marketing. It includes sales quantity, return quantity, cost of goods, return amount etc. PDF, with topics curated by our researchers after extensive research. This editable presentation is available for immediate download and provides attractive features when used. Download now and captivate your audience. Presenting this Digital Marketing Approach For Brand Awareness Metric Dashboard Showcasing Brand Performance Post Marketing Mockup PDF. Our researchers have carefully researched and created these slides with all aspects taken into consideration. This is a completely customizable Digital Marketing Approach For Brand Awareness Metric Dashboard Showcasing Brand Performance Post Marketing Mockup PDF that is available for immediate downloading. Download now and make an impact on your audience. Highlight the attractive features available with our PPTs.
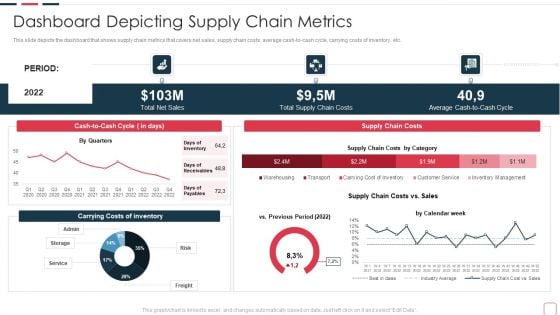
Price Benefit Internet Things Digital Twins Execution After Covid Dashboard Depicting Designs PDF
This slide depicts the dashboard that shows supply chain metrics that covers net sales, supply chain costs, average cash to cash cycle, carrying costs of inventory, etc. Deliver an awe inspiring pitch with this creative price benefit internet things digital twins execution after covid dashboard depicting designs pdf bundle. Topics like barriers for investing in iot technology can be discussed with this completely editable template. It is available for immediate download depending on the needs and requirements of the user.
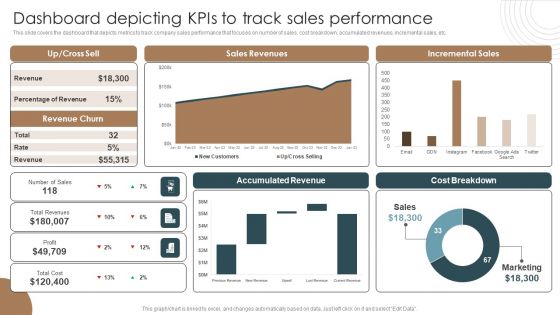
Dashboard Depicting Kpis To Track Sales Performance Integrating Technology To Transform Change Portrait PDF
This slide covers the dashboard that depicts metrics to track company sales performance that focuses on number of sales, cost breakdown, accumulated revenues, incremental sales, etc.If you are looking for a format to display your unique thoughts, then the professionally designed Dashboard Depicting Kpis To Track Sales Performance Integrating Technology To Transform Change Portrait PDF is the one for you. You can use it as a Google Slides template or a PowerPoint template. Incorporate impressive visuals, symbols, images, and other charts. Modify or reorganize the text boxes as you desire. Experiment with shade schemes and font pairings. Alter, share or cooperate with other people on your work. Download Dashboard Depicting Kpis To Track Sales Performance Integrating Technology To Transform Change Portrait PDF and find out how to give a successful presentation. Present a perfect display to your team and make your presentation unforgettable.
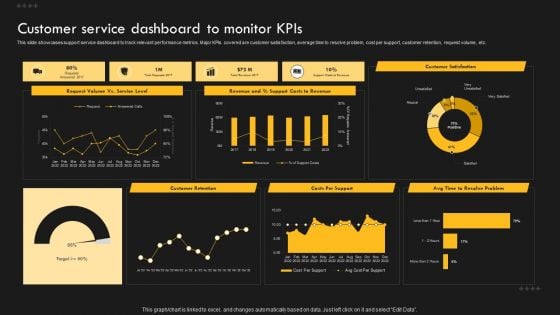
Service Improvement Techniques For Client Retention Customer Service Dashboard To Monitor Kpis Clipart PDF
This slide showcases support service dashboard to track relevant performance metrics. Major KPIs covered are customer satisfaction, average time to resolve problem, cost per support, customer retention, request volume, etc. Do you have an important presentation coming up. Are you looking for something that will make your presentation stand out from the rest. Look no further than Service Improvement Techniques For Client Retention Customer Service Dashboard To Monitor Kpis Clipart PDF. With our professional designs, you can trust that your presentation will pop and make delivering it a smooth process. And with Slidegeeks, you can trust that your presentation will be unique and memorable. So why wait. Grab Service Improvement Techniques For Client Retention Customer Service Dashboard To Monitor Kpis Clipart PDF today and make your presentation stand out from the rest.
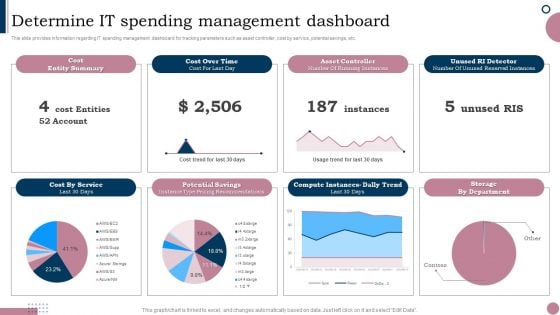
Cios Guide To Optimize Determine IT Spending Management Dashboard Portrait PDF
This slide provides information regarding IT spending management dashboard for tracking parameters such as asset controller, cost by service, potential savings, etc. If you are looking for a format to display your unique thoughts, then the professionally designed Cios Guide To Optimize Determine IT Spending Management Dashboard Portrait PDF is the one for you. You can use it as a Google Slides template or a PowerPoint template. Incorporate impressive visuals, symbols, images, and other charts. Modify or reorganize the text boxes as you desire. Experiment with shade schemes and font pairings. Alter, share or cooperate with other people on your work. Download Cios Guide To Optimize Determine IT Spending Management Dashboard Portrait PDF and find out how to give a successful presentation. Present a perfect display to your team and make your presentation unforgettable.
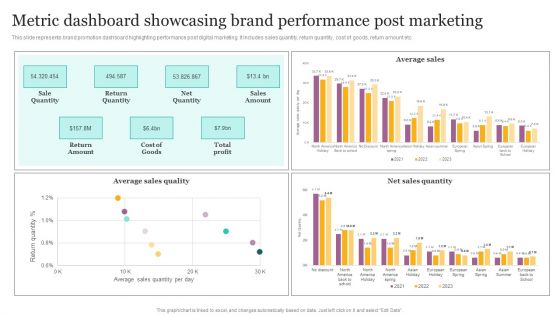
Metric Dashboard Showcasing Brand Performance Post Marketing Ppt Layouts Microsoft PDF
This slide represents brand promotion dashboard highlighting performance post digital marketing. It includes sales quantity, return quantity, cost of goods, return amount etc. Explore a selection of the finest Metric Dashboard Showcasing Brand Performance Post Marketing Ppt Layouts Microsoft PDF here. With a plethora of professionally designed and pre made slide templates, you can quickly and easily find the right one for your upcoming presentation. You can use our Metric Dashboard Showcasing Brand Performance Post Marketing Ppt Layouts Microsoft PDF to effectively convey your message to a wider audience. Slidegeeks has done a lot of research before preparing these presentation templates. The content can be personalized and the slides are highly editable. Grab templates today from Slidegeeks.
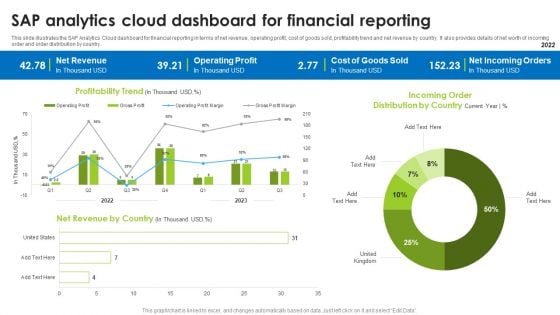
BI Technique For Data Informed Decisions Sap Analytics Cloud Dashboard For Financial Reporting Portrait PDF
This slide illustrates the SAP Analytics Cloud dashboard for financial reporting in terms of net revenue, operating profit, cost of goods sold, profitability trend and net revenue by country. It also provides details of net worth of incoming order and order distribution by country. Coming up with a presentation necessitates that the majority of the effort goes into the content and the message you intend to convey. The visuals of a PowerPoint presentation can only be effective if it supplements and supports the story that is being told. Keeping this in mind our experts created BI Technique For Data Informed Decisions Sap Analytics Cloud Dashboard For Financial Reporting Portrait PDF to reduce the time that goes into designing the presentation. This way, you can concentrate on the message while our designers take care of providing you with the right template for the situation.
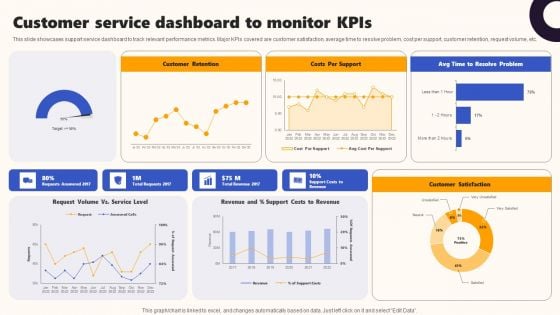
Techniques To Optimize UX Customer Service Dashboard To Monitor Kpis Template PDF
This slide showcases support service dashboard to track relevant performance metrics. Major KPIs covered are customer satisfaction, average time to resolve problem, cost per support, customer retention, request volume, etc. Present like a pro with Techniques To Optimize UX Customer Service Dashboard To Monitor Kpis Template PDF Create beautiful presentations together with your team, using our easy-to-use presentation slides. Share your ideas in real-time and make changes on the fly by downloading our templates. So whether youre in the office, on the go, or in a remote location, you can stay in sync with your team and present your ideas with confidence. With Slidegeeks presentation got a whole lot easier. Grab these presentations today.
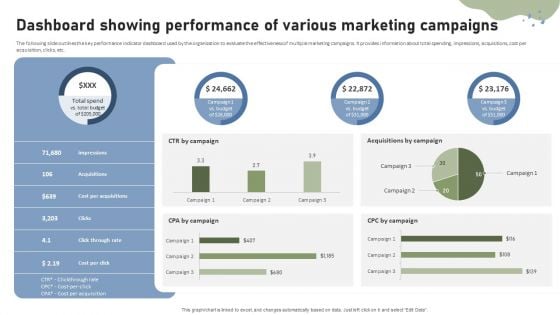
Brand Building Techniques Enhance Customer Engagement Loyalty Dashboard Showing Performance Rules PDF
The following slide outlines the key performance indicator dashboard used by the organization to evaluate the effectiveness of multiple marketing campaigns. It provides information about total spending, impressions, acquisitions, cost per acquisition, clicks, etc. Slidegeeks is one of the best resources for PowerPoint templates. You can download easily and regulate Brand Building Techniques Enhance Customer Engagement Loyalty Dashboard Showing Performance Rules PDF for your personal presentations from our wonderful collection. A few clicks is all it takes to discover and get the most relevant and appropriate templates. Use our Templates to add a unique zing and appeal to your presentation and meetings. All the slides are easy to edit and you can use them even for advertisement purposes.
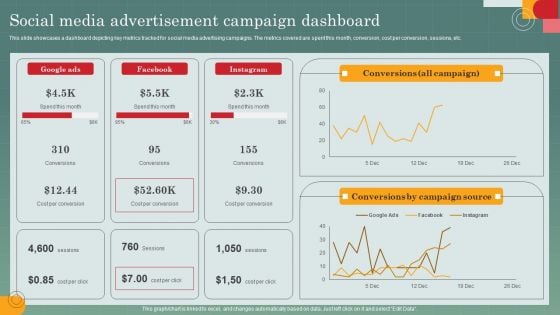
Advertising Programs Management Techniques Social Media Advertisement Campaign Dashboard Diagrams PDF
This slide showcases a dashboard depicting key metrics tracked for social media advertising campaigns. The metrics covered are spent this month, conversion, cost per conversion, sessions, etc. This modern and well arranged Advertising Programs Management Techniques Social Media Advertisement Campaign Dashboard Diagrams PDF provides lots of creative possibilities. It is very simple to customize and edit with the Powerpoint Software. Just drag and drop your pictures into the shapes. All facets of this template can be edited with Powerpoint no extra software is necessary. Add your own material, put your images in the places assigned for them, adjust the colors, and then you can show your slides to the world, with an animated slide included.
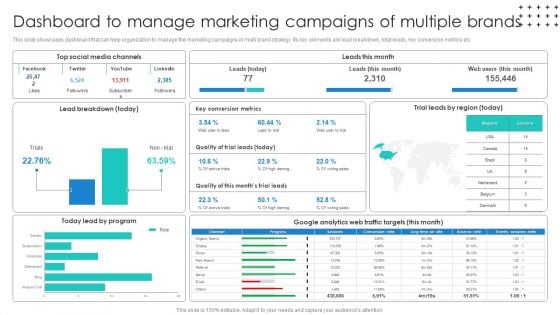
Promotional Techniques To Market Several Brands Among Target Groups Dashboard To Manage Background PDF
This slide showcases dashboard that can help organization to track the visitors on landing pages of different brands. Its key elements are forecast purchasers, customer acquisition cost and visitors count by landing pages. Slidegeeks is one of the best resources for PowerPoint templates. You can download easily and regulate Promotional Techniques To Market Several Brands Among Target Groups Dashboard To Manage Background PDF for your personal presentations from our wonderful collection. A few clicks is all it takes to discover and get the most relevant and appropriate templates. Use our Templates to add a unique zing and appeal to your presentation and meetings. All the slides are easy to edit and you can use them even for advertisement purposes.
Techniques To Boost Brand Awareness Dashboard For Tracking Brand Awareness Advertisement Rules PDF
This slide showcases dashboard that can help organization to track results of online advertisement components are ad Its key components are ad impressions, click through rate, cost per conversion, revenue per click, impressions, new users and sessions. Present like a pro with Techniques To Boost Brand Awareness Dashboard For Tracking Brand Awareness Advertisement Rules PDF Create beautiful presentations together with your team, using our easy-to-use presentation slides. Share your ideas in real-time and make changes on the fly by downloading our templates. So whether youre in the office, on the go, or in a remote location, you can stay in sync with your team and present your ideas with confidence. With Slidegeeks presentation got a whole lot easier. Grab these presentations today.
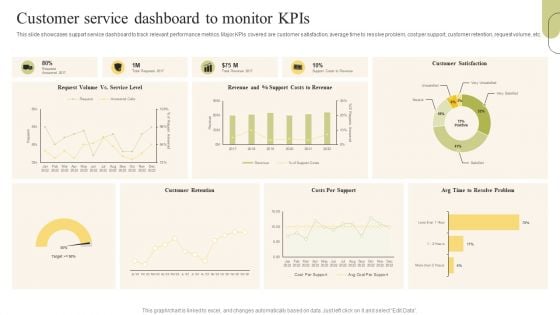
Customer Support Services Customer Service Dashboard To Monitor Kpis Microsoft PDF
This slide showcases support service dashboard to track relevant performance metrics. Major KPIs covered are customer satisfaction, average time to resolve problem, cost per support, customer retention, request volume, etc. Slidegeeks is here to make your presentations a breeze with Customer Support Services Customer Service Dashboard To Monitor Kpis Microsoft PDF With our easy-to-use and customizable templates, you can focus on delivering your ideas rather than worrying about formatting. With a variety of designs to choose from, youre sure to find one that suits your needs. And with animations and unique photos, illustrations, and fonts, you can make your presentation pop. So whether youre giving a sales pitch or presenting to the board, make sure to check out Slidegeeks first.
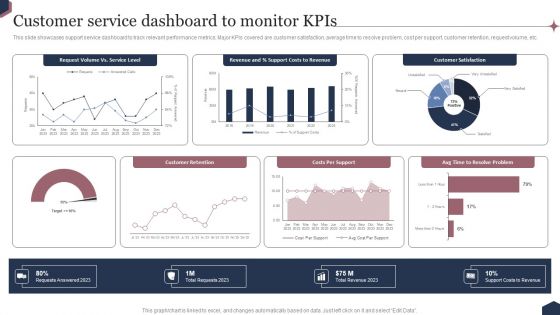
Enhance Customer Engagement Through After Sales Activities Customer Service Dashboard To Monitor Kpis Introduction PDF
This slide showcases support service dashboard to track relevant performance metrics. Major KPIs covered are customer satisfaction, average time to resolve problem, cost per support, customer retention, request volume, etc. Slidegeeks is here to make your presentations a breeze with Enhance Customer Engagement Through After Sales Activities Customer Service Dashboard To Monitor Kpis Introduction PDF With our easy to use and customizable templates, you can focus on delivering your ideas rather than worrying about formatting. With a variety of designs to choose from, you are sure to find one that suits your needs. And with animations and unique photos, illustrations, and fonts, you can make your presentation pop. So whether you are giving a sales pitch or presenting to the board, make sure to check out Slidegeeks first.
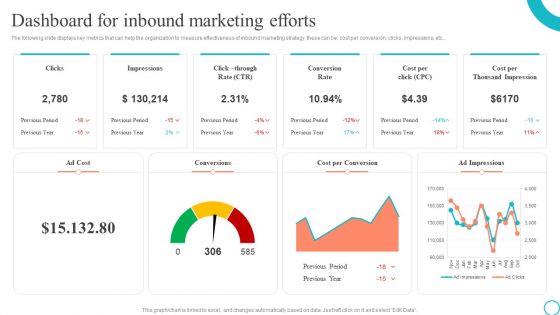
Dashboard For Inbound Marketing Efforts Marketing Tactics To Enhance Business Graphics PDF
The following slide displays key metrics that can help the organization to measure effectiveness of inbound marketing strategy, these can be cost per conversion, clicks, impressions, etc. If you are looking for a format to display your unique thoughts, then the professionally designed Dashboard For Inbound Marketing Efforts Marketing Tactics To Enhance Business Graphics PDF is the one for you. You can use it as a Google Slides template or a PowerPoint template. Incorporate impressive visuals, symbols, images, and other charts. Modify or reorganize the text boxes as you desire. Experiment with shade schemes and font pairings. Alter, share or cooperate with other people on your work. Download Dashboard For Inbound Marketing Efforts Marketing Tactics To Enhance Business Graphics PDF and find out how to give a successful presentation. Present a perfect display to your team and make your presentation unforgettable.
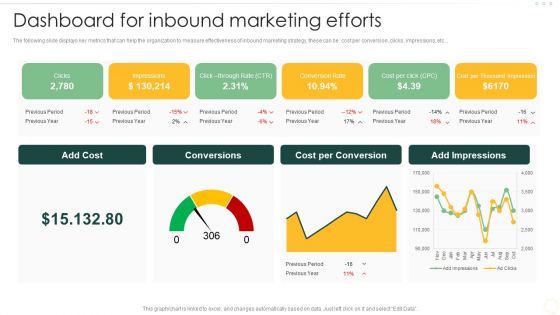
Effective Organizational B2B And B2C Dashboard For Inbound Marketing Efforts Introduction PDF
The following slide displays key metrics that can help the organization to measure effectiveness of inbound marketing strategy, these can be cost per conversion, clicks, impressions, etc. Explore a selection of the finest Effective Organizational B2B And B2C Dashboard For Inbound Marketing Efforts Introduction PDF here. With a plethora of professionally designed and pre-made slide templates, you can quickly and easily find the right one for your upcoming presentation. You can use our Effective Organizational B2B And B2C Dashboard For Inbound Marketing Efforts Introduction PDF to effectively convey your message to a wider audience. Slidegeeks has done a lot of research before preparing these presentation templates. The content can be personalized and the slides are highly editable. Grab templates today from Slidegeeks.
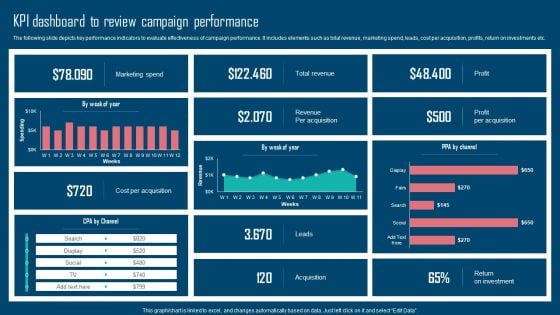
Adopting IMC Technique To Boost Brand Recognition Kpi Dashboard To Review Campaign Performance Pictures PDF
The following slide depicts key performance indicators to evaluate effectiveness of campaign performance. It includes elements such as total revenue, marketing spend, leads, cost per acquisition, profits, return on investments etc. This modern and well arranged Adopting IMC Technique To Boost Brand Recognition Kpi Dashboard To Review Campaign Performance Pictures PDF provides lots of creative possibilities. It is very simple to customize and edit with the Powerpoint Software. Just drag and drop your pictures into the shapes. All facets of this template can be edited with Powerpoint no extra software is necessary. Add your own material, put your images in the places assigned for them, adjust the colors, and then you can show your slides to the world, with an animated slide included.
Managing It Services Spending Tracking Dashboard Playbook For Managing Us Inspiration Pdf
This slide provides information regarding the management of the digital services performance and IT spending tracking dashboard in terms of ROI, spend vs. budget, IT costs software, hardware, personnel and goals, IT spending in terms of revenues, etc. If your project calls for a presentation, then Slidegeeks is your go-to partner because we have professionally designed, easy-to-edit templates that are perfect for any presentation. After downloading, you can easily edit Managing It Services Spending Tracking Dashboard Playbook For Managing Us Inspiration Pdf and make the changes accordingly. You can rearrange slides or fill them with different images. Check out all the handy templates This slide provides information regarding the management of the digital services performance and IT spending tracking dashboard in terms of ROI, spend vs. budget, IT costs software, hardware, personnel and goals, IT spending in terms of revenues, etc.
Managing It Services Spending Tracking Dashboard Gen Tech Stack Playbook Inspiration Pdf
This slide provides information regarding the management of the digital services performance and IT spending tracking dashboard in terms of ROI, spend vs. budget, IT costs software, hardware, personnel and goals, IT spending in terms of revenues, etc. If your project calls for a presentation, then Slidegeeks is your go-to partner because we have professionally designed, easy-to-edit templates that are perfect for any presentation. After downloading, you can easily edit Managing It Services Spending Tracking Dashboard Gen Tech Stack Playbook Inspiration Pdf and make the changes accordingly. You can rearrange slides or fill them with different images. Check out all the handy templates This slide provides information regarding the management of the digital services performance and IT spending tracking dashboard in terms of ROI, spend vs. budget, IT costs software, hardware, personnel and goals, IT spending in terms of revenues, etc.
Managing It Services Spending Tracking Dashboard Technological Innovation Playbook Designs Pdf
This slide provides information regarding the management of the digital services performance and IT spending tracking dashboard in terms of ROI, spend vs. budget, IT costs software, hardware, personnel and goals, IT spending in terms of revenues, etc. Do you have an important presentation coming up Are you looking for something that will make your presentation stand out from the rest Look no further than Managing It Services Spending Tracking Dashboard Technological Innovation Playbook Designs Pdf. With our professional designs, you can trust that your presentation will pop and make delivering it a smooth process. And with Slidegeeks, you can trust that your presentation will be unique and memorable. So why wait Grab Managing It Services Spending Tracking Dashboard Technological Innovation Playbook Designs Pdf today and make your presentation stand out from the rest This slide provides information regarding the management of the digital services performance and IT spending tracking dashboard in terms of ROI, spend vs. budget, IT costs software, hardware, personnel and goals, IT spending in terms of revenues, etc.
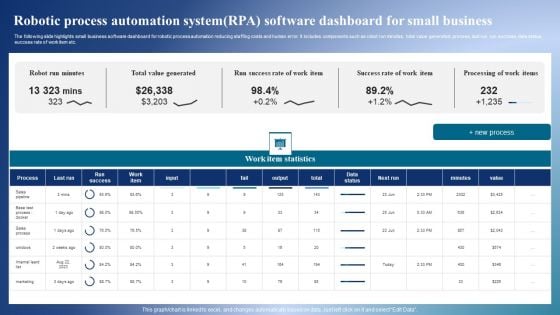
Robotic Process Automation Systemrpa Software Dashboard For Small Business Sample PDF
The following slide highlights small business software dashboard for robotic process automation reducing staffing costs and human error. It includes components such as robot run minutes, total value generated, process, last run, run success, data status, success rate of work item etc. Pitch your topic with ease and precision using this Robotic Process Automation Systemrpa Software Dashboard For Small Business Sample PDF. This layout presents information on Work Item Statistics, Business, Total Value Generated. It is also available for immediate download and adjustment. So, changes can be made in the color, design, graphics or any other component to create a unique layout.
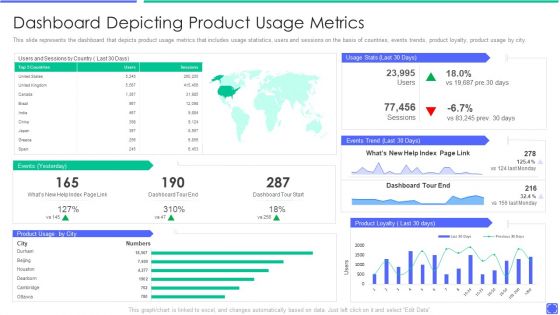
Best Techniques To Enhance New Product Management Efficiency Dashboard Depicting Product Rules PDF
This slide represents the dashboard that depicts product usage metrics that includes usage statistics, users and sessions on the basis of countries, events trends, product loyalty, product usage by city. Deliver and pitch your topic in the best possible manner with this best techniques to enhance new product management efficiency comparing product metrics themes pdf. Use them to share invaluable insights on costs associated with product development stages and impress your audience. This template can be altered and modified as per your expectations. So, grab it now.
Playbook For Advancing Technology Managing It Services Spending Tracking Dashboard Clipart PDF
This slide provides information regarding the management of the digital services performance and IT spending tracking dashboard in terms of ROI, spend vs. budget, IT costs software, hardware, personnel and goals, IT spending in terms of revenues, etc. Are you in need of a template that can accommodate all of your creative concepts This one is crafted professionally and can be altered to fit any style. Use it with Google Slides or PowerPoint. Include striking photographs, symbols, depictions, and other visuals. Fill, move around, or remove text boxes as desired. Test out color palettes and font mixtures. Edit and save your work, or work with colleagues. Download Playbook For Advancing Technology Managing It Services Spending Tracking Dashboard Clipart PDF and observe how to make your presentation outstanding. Give an impeccable presentation to your group and make your presentation unforgettable.
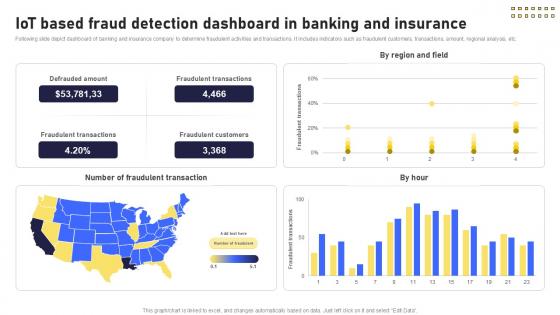
IoT Based Fraud Detection Dashboard Banking Future With IoT Ppt Example IoT SS V
Following slide depict dashboard of banking and insurance company to determine fraudulent activities and transactions. It includes indicators such as fraudulent customers, transactions, amount, regional analysis, etc. Present like a pro with IoT Based Fraud Detection Dashboard Banking Future With IoT Ppt Example IoT SS V. Create beautiful presentations together with your team, using our easy-to-use presentation slides. Share your ideas in real-time and make changes on the fly by downloading our templates. So whether you are in the office, on the go, or in a remote location, you can stay in sync with your team and present your ideas with confidence. With Slidegeeks presentation got a whole lot easier. Grab these presentations today. Following slide depict dashboard of banking and insurance company to determine fraudulent activities and transactions. It includes indicators such as fraudulent customers, transactions, amount, regional analysis, etc.
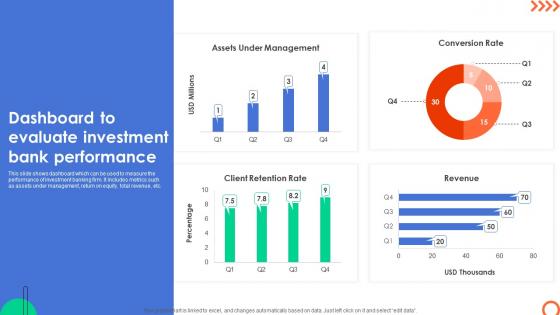
Dashboard To Evaluate Investment Bank Understanding Investment Banking Framework Fin SS V
This slide shows dashboard which can be used to measure the performance of investment banking firm. It includes metrics such as assets under management, return on equity, total revenue, etc. Find highly impressive Dashboard To Evaluate Investment Bank Understanding Investment Banking Framework Fin SS V on Slidegeeks to deliver a meaningful presentation. You can save an ample amount of time using these presentation templates. No need to worry to prepare everything from scratch because Slidegeeks experts have already done a huge research and work for you. You need to download Dashboard To Evaluate Investment Bank Understanding Investment Banking Framework Fin SS V for your upcoming presentation. All the presentation templates are 100 percent editable and you can change the color and personalize the content accordingly. Download now This slide shows dashboard which can be used to measure the performance of investment banking firm. It includes metrics such as assets under management, return on equity, total revenue, etc.
Risk Management For Organization Essential Assets Financial Performance Tracking Dashboard Designs PDF
This slide presents the dashboard which will help firm in tracking the fiscal performance. This dashboard displays revenues and expenses trends and payment received analysis. Deliver an awe inspiring pitch with this creative risk management for organization essential assets financial performance tracking dashboard designs pdf bundle. Topics like receivables analysis, revenue and expense trends can be discussed with this completely editable template. It is available for immediate download depending on the needs and requirements of the user.
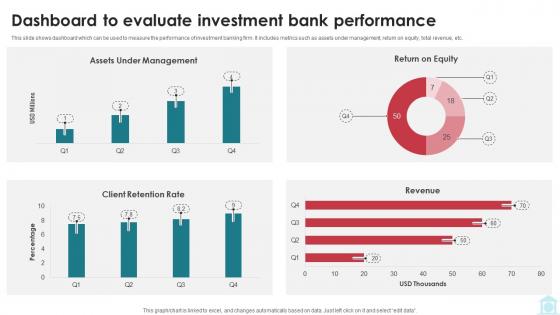
Dashboard To Evaluate Investment Bank Performance Mastering Investment Banking Fin SS V
This slide shows dashboard which can be used to measure the performance of investment banking firm. It includes metrics such as assets under management, return on equity, total revenue, etc. Find highly impressive Dashboard To Evaluate Investment Bank Performance Mastering Investment Banking Fin SS V on Slidegeeks to deliver a meaningful presentation. You can save an ample amount of time using these presentation templates. No need to worry to prepare everything from scratch because Slidegeeks experts have already done a huge research and work for you. You need to download Dashboard To Evaluate Investment Bank Performance Mastering Investment Banking Fin SS V for your upcoming presentation. All the presentation templates are 100 percent editable and you can change the color and personalize the content accordingly. Download now This slide shows dashboard which can be used to measure the performance of investment banking firm. It includes metrics such as assets under management, return on equity, total revenue, etc.
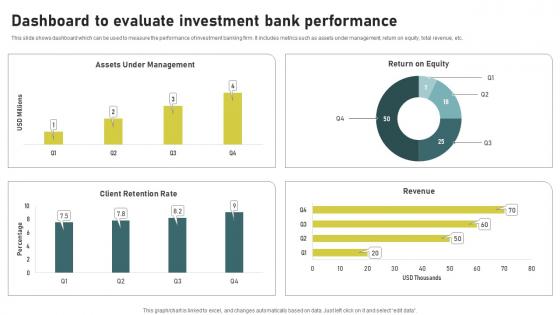
Dashboard To Evaluate Investment Bank Investment Banking Simplified Functions Fin SS V
This slide shows dashboard which can be used to measure the performance of investment banking firm. It includes metrics such as assets under management, return on equity, total revenue, etc. Find highly impressive Dashboard To Evaluate Investment Bank Investment Banking Simplified Functions Fin SS V on Slidegeeks to deliver a meaningful presentation. You can save an ample amount of time using these presentation templates. No need to worry to prepare everything from scratch because Slidegeeks experts have already done a huge research and work for you. You need to download Dashboard To Evaluate Investment Bank Investment Banking Simplified Functions Fin SS V for your upcoming presentation. All the presentation templates are 100 percent editable and you can change the color and personalize the content accordingly. Download now This slide shows dashboard which can be used to measure the performance of investment banking firm. It includes metrics such as assets under management, return on equity, total revenue, etc.
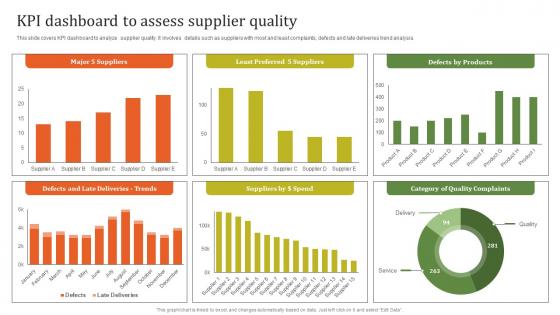
KPI Dashboard To Assess Supplier Executing Effective Quality Enhancement Structure Pdf
This slide covers KPI dashboard to analyze supplier quality. It involves details such as suppliers with most and least complaints, defects and late deliveries trend analysis. Create an editable KPI Dashboard To Assess Supplier Executing Effective Quality Enhancement Structure Pdf that communicates your idea and engages your audience. Whether you are presenting a business or an educational presentation, pre designed presentation templates help save time. KPI Dashboard To Assess Supplier Executing Effective Quality Enhancement Structure Pdf is highly customizable and very easy to edit, covering many different styles from creative to business presentations. Slidegeeks has creative team members who have crafted amazing templates. So, go and get them without any delay. This slide covers KPI dashboard to analyze supplier quality. It involves details such as suppliers with most and least complaints, defects and late deliveries trend analysis.
Cyber Security Administration In Organization Financial Performance Tracking Dashboard Microsoft PDF
This slide presents the dashboard which will help firm in tracking the fiscal performance. This dashboard displays revenues and expenses trends and payment received analysis. Deliver and pitch your topic in the best possible manner with this cyber security administration in organization financial performance tracking dashboard microsoft pdf. Use them to share invaluable insights on financial performance tracking dashboard and impress your audience. This template can be altered and modified as per your expectations. So, grab it now.
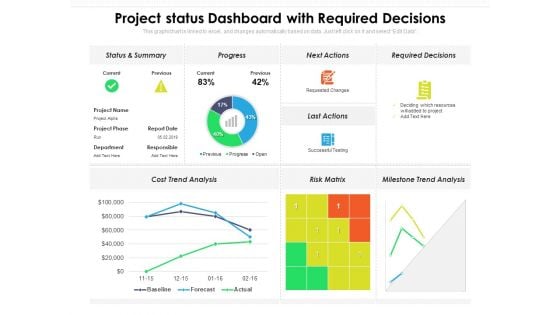
Project Status Dashboard With Required Decisions Ppt PowerPoint Presentation File Model PDF
Presenting this set of slides with name project status dashboard with required decisions ppt powerpoint presentation file model pdf. The topics discussed in these slides are cost, analysis, risk matrix. This is a completely editable PowerPoint presentation and is available for immediate download. Download now and impress your audience.
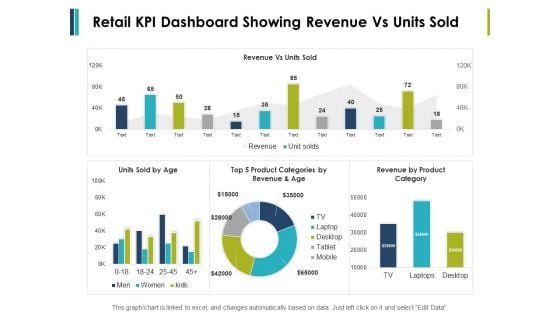
Retail Kpi Dashboard Showing Revenue Vs Units Sold Ppt PowerPoint Presentation File Formats
This is a retail kpi dashboard showing revenue vs units sold ppt powerpoint presentation file formats. This is a three stage process. The stages in this process are finance, marketing, management, investment, analysis.
Dashboard Low Medium Ppt Powerpoint Presentation Infographics Icons Ppt Powerpoint Presentation Layouts Format
This is a dashboard low medium ppt powerpoint presentation infographics icons ppt powerpoint presentation layouts format. This is a three stage process. The stages in this process are finance, marketing, management, investment, analysis.

Retail KPI Dashboard Showing Revenue Vs Units Sold Ppt PowerPoint Presentation Professional Smartart
This is a retail kpi dashboard showing revenue vs units sold ppt powerpoint presentation professional smartart. This is a four stage process. The stages in this process are finance, analysis, business, investment, marketing.
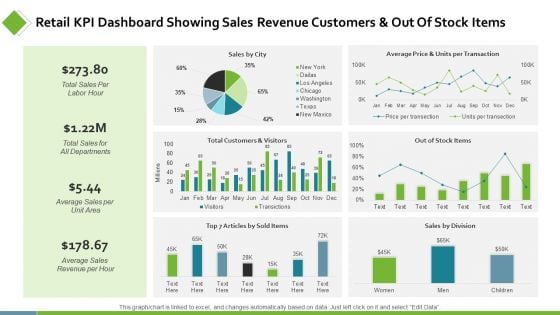
Retail KPI Dashboard Showing Sales Revenue Customers Ppt PowerPoint Presentation Show Background Designs
This is a retail kpi dashboard showing sales revenue customers ppt powerpoint presentation show background designs. This is a six stage process. The stages in this process are finance, analysis, business, investment, marketing.
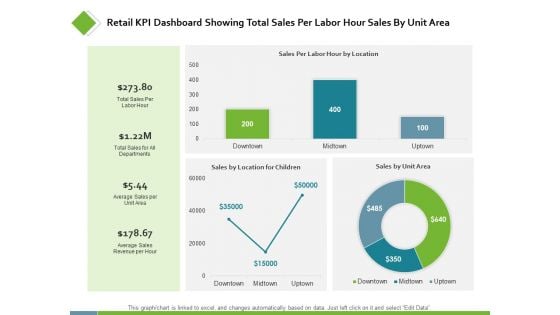
Retail KPI Dashboard Showing Total Sales Per Labor Ppt PowerPoint Presentation Styles Examples
This is a retail kpi dashboard showing total sales per labor ppt powerpoint presentation styles examples. This is a three stage process. The stages in this process are finance, analysis, business, investment, marketing.
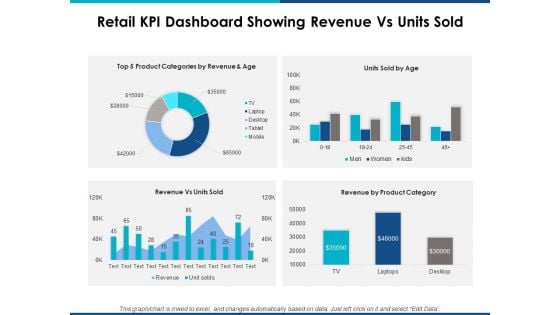
Retail Kpi Dashboard Showing Revenue Vs Units Sold Ppt Powerpoint Presentation Layouts Show
This is a retail kpi dashboard showing revenue vs units sold ppt powerpoint presentation layouts show. This is a four stage process. The stages in this process are finance, marketing, management, investment, analysis.

Project Management Monthly Growth Dashboard Marketing Ppt PowerPoint Presentation Model Slide Download
This is a project management monthly growth dashboard marketing ppt powerpoint presentation model slide download. This is a four stage process. The stages in this process are finance, marketing, management, investment, analysis.
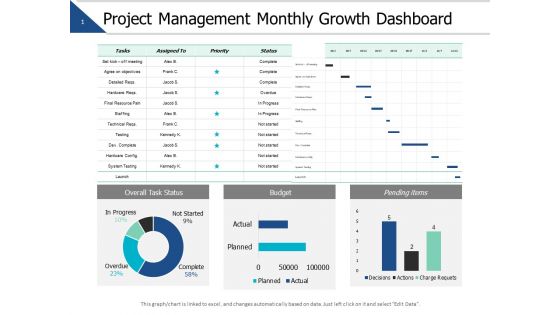
Project Management Monthly Growth Dashboard Ppt PowerPoint Presentation Slides Master Slide
This is a project management monthly growth dashboard ppt powerpoint presentation slides master slide. This is a three stage process. The stages in this process are finance, marketing, management, investment, analysis.
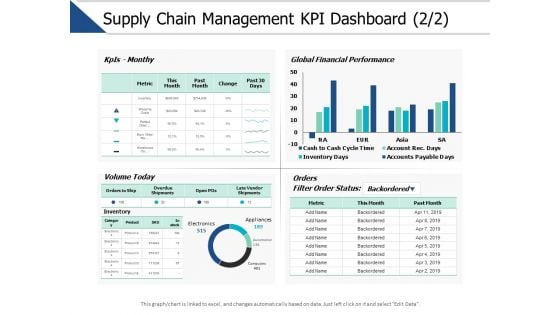
Supply Chain Management Kpi Dashboard Marketing Ppt PowerPoint Presentation File Tips
This is a supply chain management kpi dashboard marketing ppt powerpoint presentation file tips. This is a three stage process. The stages in this process are finance, marketing, management, investment, analysis.
Techniques To Optimize Business Performance Dashboard To Measure Display Advertising Icons Pdf
This slide provides a dashboard to monitor the display advertising campaign performance in order to reduce overall marketing cost. It incorporates advertising cost, average number of clicks and impressions, clicks per day, revenue by campaign, etc. If your project calls for a presentation, then Slidegeeks is your go-to partner because we have professionally designed, easy-to-edit templates that are perfect for any presentation. After downloading, you can easily edit Techniques To Optimize Business Performance Dashboard To Measure Display Advertising Icons Pdf and make the changes accordingly. You can rearrange slides or fill them with different images. Check out all the handy templates This slide provides a dashboard to monitor the display advertising campaign performance in order to reduce overall marketing cost. It incorporates advertising cost, average number of clicks and impressions, clicks per day, revenue by campaign, etc.
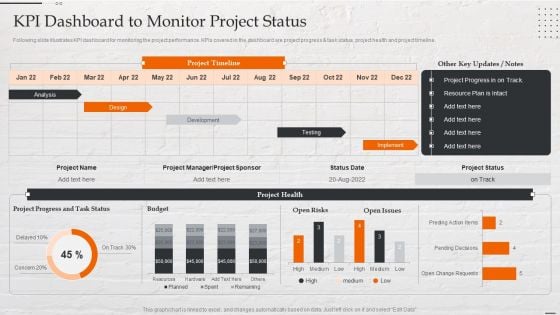
Capital Investment Options KPI Dashboard To Monitor Project Status Summary PDF
Following slide illustrates KPI dashboard for monitoring the project performance. KPIs covered in the dashboard are project progress and task status, project health and project timeline. Deliver an awe inspiring pitch with this creative Capital Investment Options KPI Dashboard To Monitor Project Status Summary PDF bundle. Topics like Analysis, Development, Testing, Implement can be discussed with this completely editable template. It is available for immediate download depending on the needs and requirements of the user.
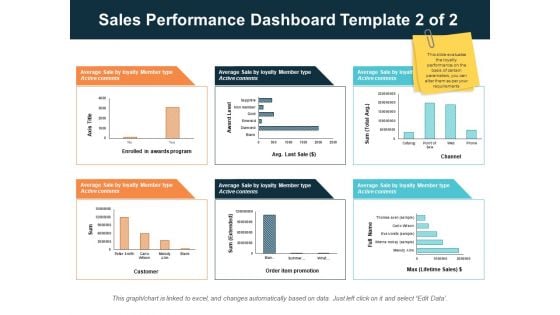
Sales Performance Dashboard Template 2 Of 2 Ppt PowerPoint Presentation Infographics Design Inspiration
This is a sales performance dashboard template 2 of 2 ppt powerpoint presentation infographics design inspiration. This is a three stage process. The stages in this process are finance, management, strategy, analysis, marketing.
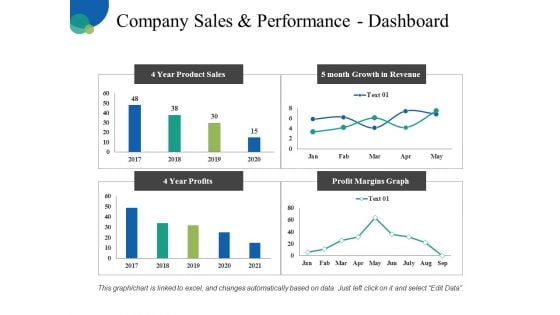
Company Sales And Performance Dashboard Ppt PowerPoint Presentation Pictures Infographic Template
This is a company sales and performance dashboard ppt powerpoint presentation pictures infographic template. This is a four stage process. The stages in this process are business, finance, analysis, management, marketing.
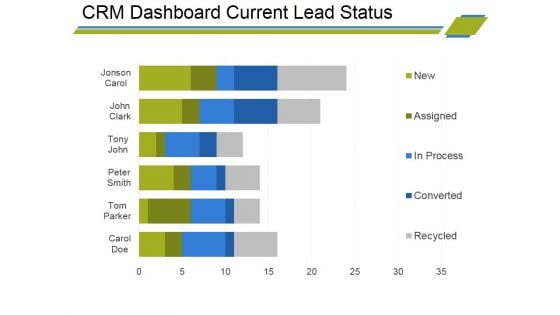
Crm Dashboard Current Lead Status Ppt PowerPoint Presentation Infographic Template Visual Aids
This is a crm dashboard current lead status ppt powerpoint presentation infographic template visual aids. This is a six stage process. The stages in this process are bar graph, finance, marketing, strategy, business, analysis.


 Continue with Email

 Home
Home


