Cost Analysis
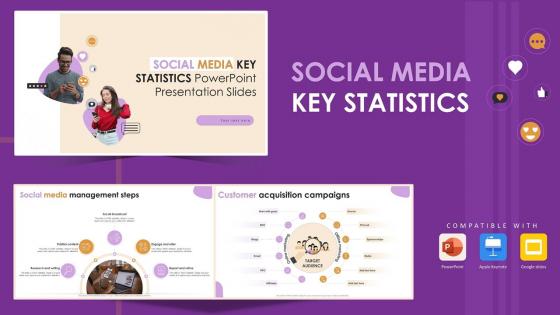
Social Media Key Statistics Powerpoint Presentation Slides
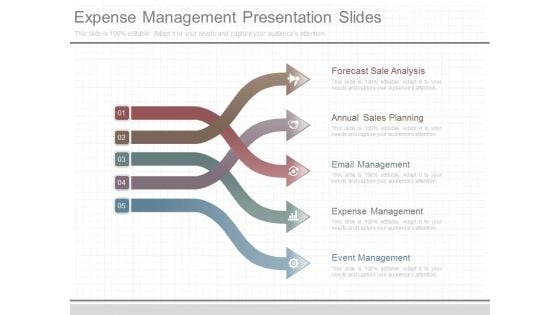
Expense Management Presentation Slides
This is a expense management presentation slides. This is a five stage process. The stages in this process are forecast sale analysis, annual sales planning, email management, expense management, event management.
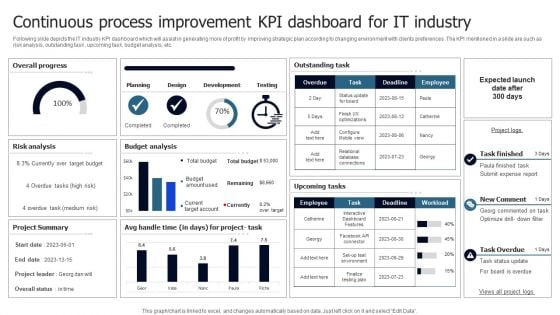
Continuous Process Improvement KPI Dashboard For IT Industry Clipart PDF
Following slide depicts the IT industry KPI dashboard which will assist in generating more of profit by improving strategic plan according to changing environment with clients preferences .The KPI mentioned in a slide are such as risk analysis, outstanding task , upcoming task, budget analysis, etc. Pitch your topic with ease and precision using this Continuous Process Improvement KPI Dashboard For IT Industry Clipart PDF. This layout presents information on Overall Progress, Risk Analysis, Budget Analysis. It is also available for immediate download and adjustment. So, changes can be made in the color, design, graphics or any other component to create a unique layout.
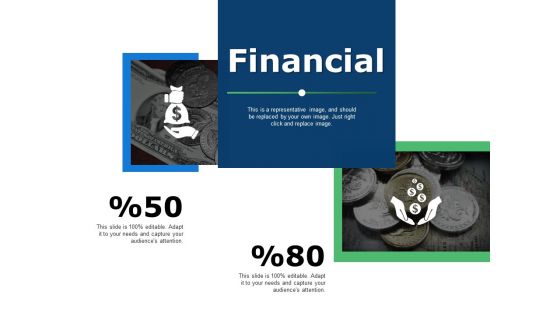
Financial Marketing Ppt Powerpoint Presentation Slides Layout
This is a financial marketing ppt powerpoint presentation slides layout. This is a two stage process. The stages in this process are financial, marketing, analysis, investment, business.
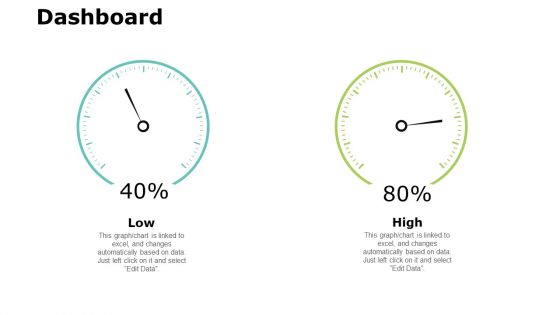
Dashboard Measurement Ppt PowerPoint Presentation Ideas Infographic Template
This is a dashboard measurement ppt powerpoint presentation ideas infographic template. This is a two stage process. The stages in this process are dashboard, marketing, management, investment, analysis.
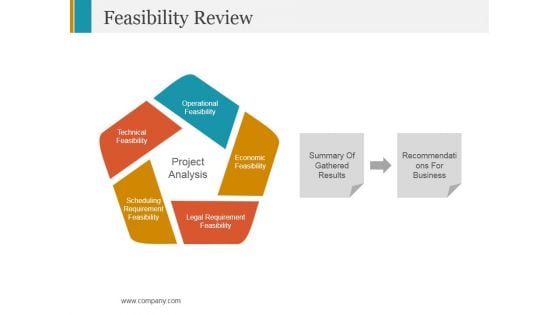
Feasibility Review Ppt PowerPoint Presentation Pictures Ideas
This is a feasibility review ppt powerpoint presentation pictures ideas. This is a five stage process. The stages in this process are operational feasibility, project analysis, economic feasibility.

Hedge Fund Investment Portfolio Ppt Powerpoint Presentation Styles Pictures
This is a hedge fund investment portfolio ppt powerpoint presentation styles pictures. This is a nine stage process. The stages in this process are pie chart, percentage, marketing, business, analysis.

Unlocking The Potential Of Blockchain Game Investment Checklist For Investors BCT SS V
This slide provides a checklist that can be used by potential investors before investing in a blockchain enabled game. Key areas evaluated include concept, team expertise, whitepaper analysis, token utility etc. Present like a pro with Unlocking The Potential Of Blockchain Game Investment Checklist For Investors BCT SS V. Create beautiful presentations together with your team, using our easy-to-use presentation slides. Share your ideas in real-time and make changes on the fly by downloading our templates. So whether you are in the office, on the go, or in a remote location, you can stay in sync with your team and present your ideas with confidence. With Slidegeeks presentation got a whole lot easier. Grab these presentations today. This slide provides a checklist that can be used by potential investors before investing in a blockchain enabled game. Key areas evaluated include concept, team expertise, whitepaper analysis, token utility etc.
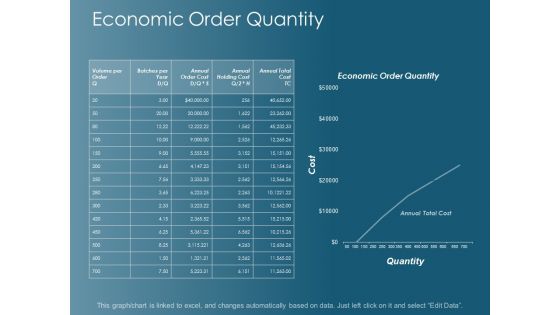
Economic Order Quantity Ppt Powerpoint Presentation Visual Aids Example 2015
This is a economic order quantity ppt powerpoint presentation visual aids example 2015. This is a five stage process. The stages in this process are inance, marketing, management, investment, analysis.
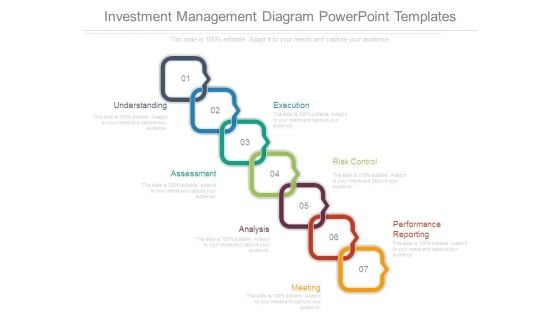
Investment Management Diagram Powerpoint Templates
This is a investment management diagram powerpoint templates. This is a seven stage process. The stages in this process are understanding, execution, risk control, performance reporting, meeting, analysis, assessment.
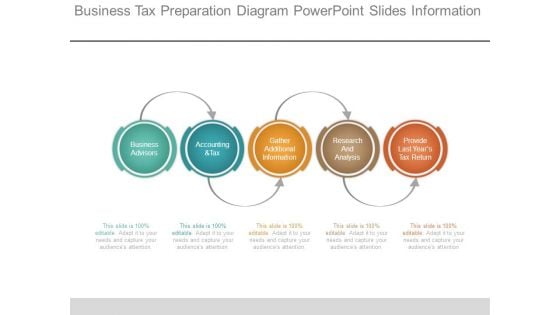
Business Tax Preparation Diagram Powerpoint Slides Information
This is a business tax preparation diagram powerpoint slides information. This is a five stage process. The stages in this process are business advisors, accounting and tax, gather additional information, research and analysis, provide last years tax return.
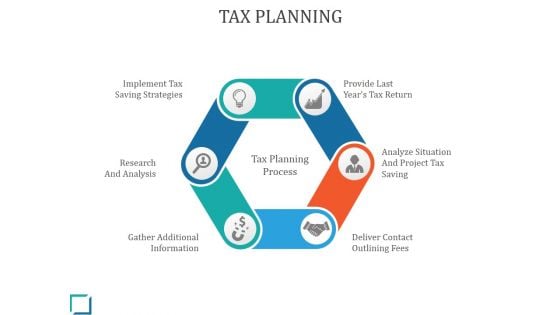
Tax Planning Ppt PowerPoint Presentation Styles
This is a tax planning ppt powerpoint presentation styles. This is a six stage process. The stages in this process are tax planning process, research and analysis, provide last years tax return.
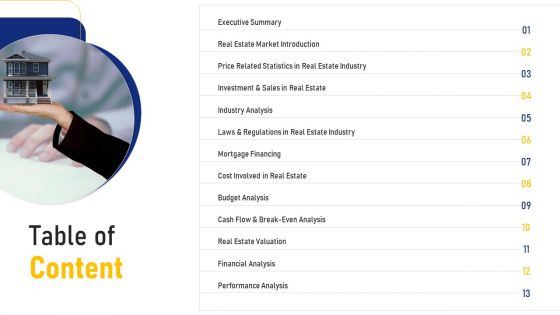
Real Estate Business Table Of Content Ppt Professional Diagrams PDF
Presenting real estate business table of content ppt professional diagrams pdf. to provide visual cues and insights. Share and navigate important information on thirteen stages that need your due attention. This template can be used to pitch topics like financial analysis, budget analysis, mortgage financing, industry analysis. In addtion, this PPT design contains high resolution images, graphics, etc, that are easily editable and available for immediate download.
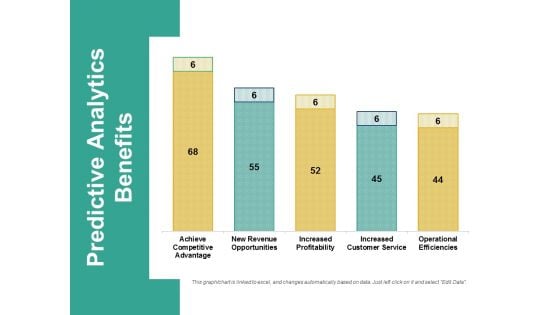
Predictive Analytics Benefits Ppt PowerPoint Presentation Professional Samples
This is a predictive analytics benefits ppt powerpoint presentation professional samples. This is a five stage process. The stages in this process are business, finance, marketing, strategy, analysis.
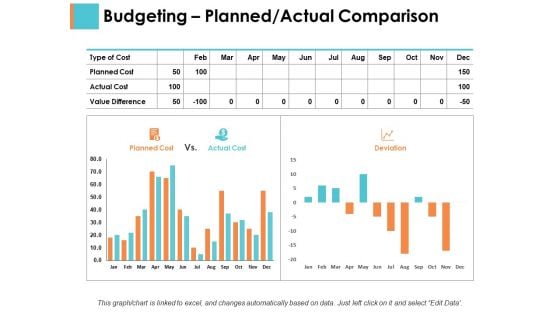
Budgeting Planned Actual Comparison Sample Budget Ppt Ppt PowerPoint Presentation Portfolio Inspiration
This is a budgeting planned actual comparison sample budget ppt ppt powerpoint presentation portfolio inspiration. This is a two stage process. The stages in this process are business, management, strategy, analysis, marketing.
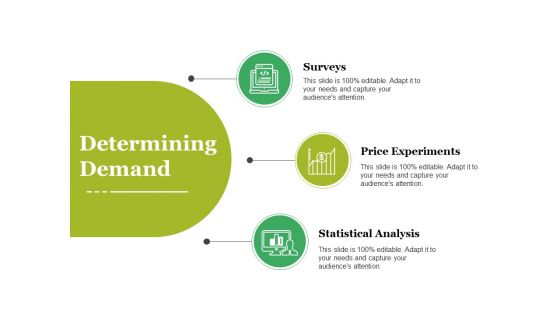
Determining Demand Ppt PowerPoint Presentation Layouts
This is a determining demand ppt powerpoint presentation layouts. This is a three stage process. The stages in this process are business, marketing, surveys, price experiments, statistical analysis.
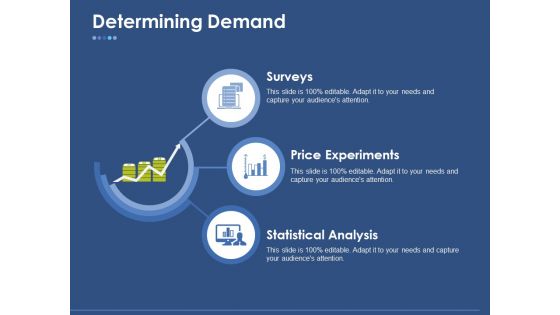
Determining Demand Ppt PowerPoint Presentation Slides Templates
This is a determining demand ppt powerpoint presentation slides templates. This is a three stage process. The stages in this process are surveys, price experiments, statistical analysis.
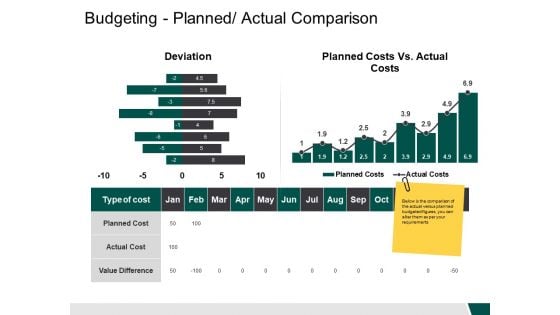
Budgeting Planned Actual Comparison Deviation Ppt PowerPoint Presentation File Gallery
This is a budgeting planned actual comparison deviation ppt powerpoint presentation file gallery. This is a two stage process. The stages in this process are business, finance, strategy, analysis, marketing.
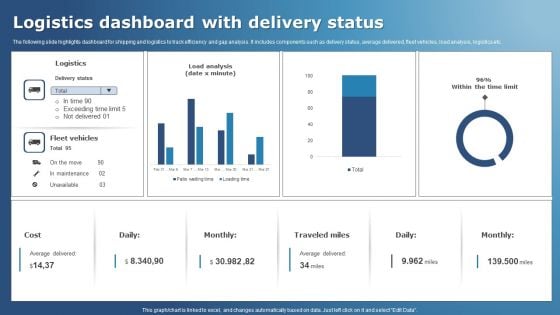
Logistics Dashboard With Delivery Status Structure PDF
The following slide highlights dashboard for shipping and logistics to track efficiency and gap analysis. It includes components such as delivery status, average delivered, fleet vehicles, load analysis, logistics etc. Pitch your topic with ease and precision using this Logistics Dashboard With Delivery Status Structure PDF. This layout presents information on Logistics, Vehicles, Analysis. It is also available for immediate download and adjustment. So, changes can be made in the color, design, graphics or any other component to create a unique layout.
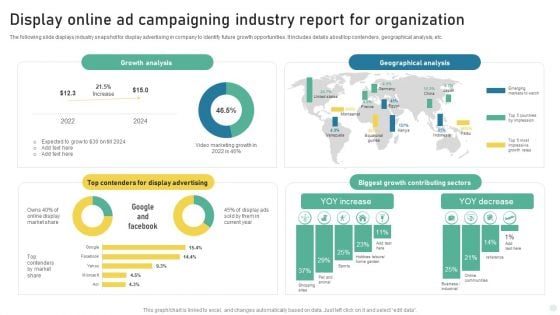
Display Online Ad Campaigning Industry Report For Organization Structure PDF
The following slide displays industry snapshot for display advertising in company to identify future growth opportunities. It includes details about top contenders, geographical analysis, etc. Showcasing this set of slides titled Display Online Ad Campaigning Industry Report For Organization Structure PDF. The topics addressed in these templates are Growth Analysis, Geographical Analysis, Biggest Growth Contributing. All the content presented in this PPT design is completely editable. Download it and make adjustments in color, background, font etc. as per your unique business setting.
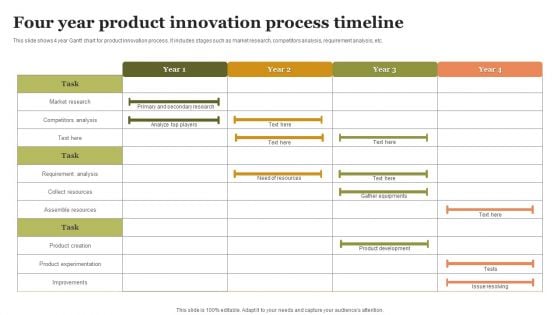
Four Year Product Innovation Process Timeline Slides PDF
This slide shows 4 year Gantt chart for product innovation process. It includes stages such as market research, competitors analysis, requirement analysis, etc. Showcasing this set of slides titled Four Year Product Innovation Process Timeline Slides PDF. The topics addressed in these templates are Requirement Analysis, Assemble Resources, Collect Resources. All the content presented in this PPT design is completely editable. Download it and make adjustments in color, background, font etc. as per your unique business setting.
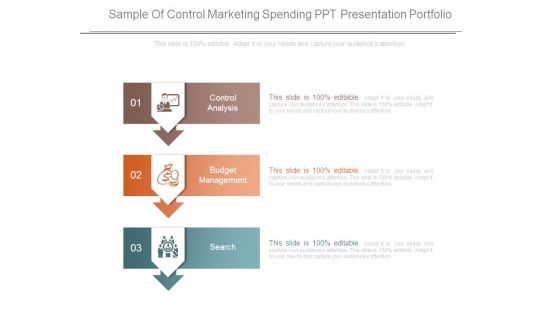
Sample Of Control Marketing Spending Ppt Presentation Portfolio
This is a sample of control marketing spending ppt presentation portfolio. This is a three stage process. The stages in this process are control analysis, budget management, search.
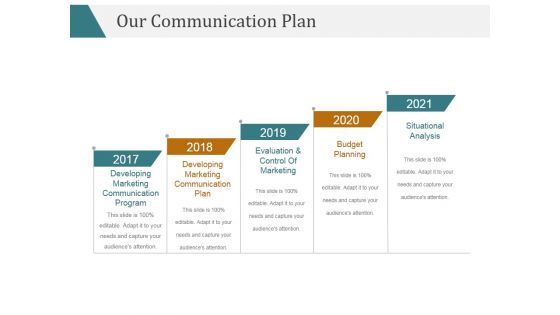
Our Communication Plan Ppt PowerPoint Presentation Ideas
This is a our communication plan ppt powerpoint presentation ideas. This is a five stage process. The stages in this process are budget planning, situational analysis.
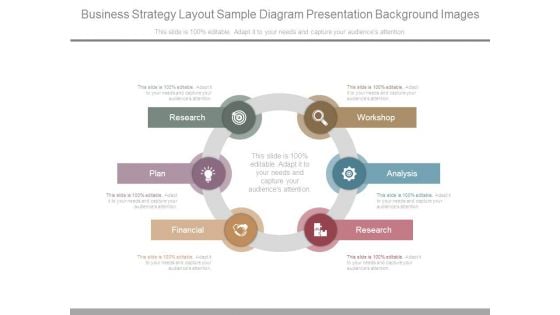
Business Strategy Layout Sample Diagram Presentation Background Images
This is a business strategy layout sample diagram presentation background images. This is a six stage process. The stages in this process are research, plan, financial, workshop, analysis.
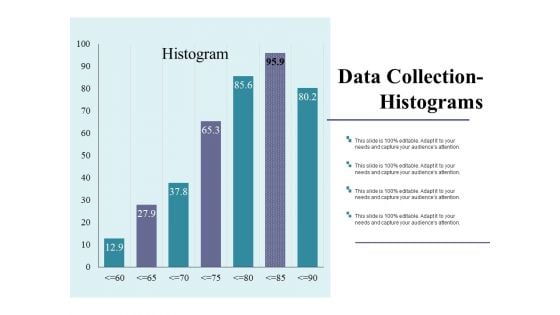
Data Collection Histograms Ppt PowerPoint Presentation Outline Show
This is a data collection histograms ppt powerpoint presentation outline show. This is a seven stage process. The stages in this process are business, marketing, strategy, finance, analysis.
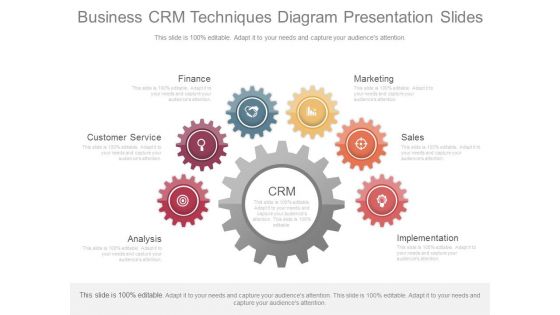
Business Crm Techniques Diagram Presentation Slides
This is a business crm techniques diagram presentation slides. This is a six stage process. The stages in this process are analysis, customer service, finance, marketing, sales, implementation.
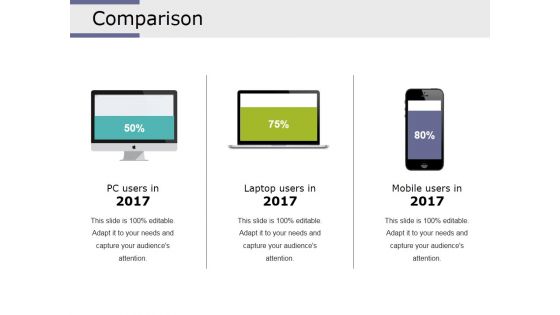
Comparison Ppt PowerPoint Presentation Layouts Styles
This is a comparison ppt powerpoint presentation layouts styles. This is a three stage process. The stages in this process are comparison, technology, marketing, finance, analysis, business.
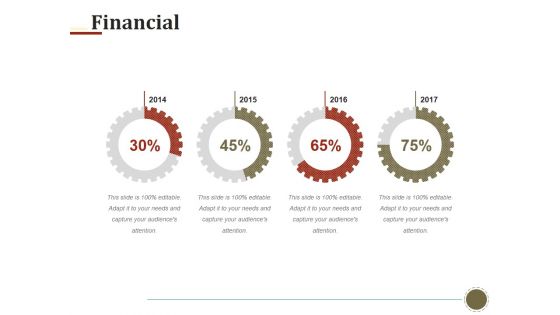
Financial Ppt PowerPoint Presentation Summary Themes
This is a financial ppt powerpoint presentation summary themes. This is a four stage process. The stages in this process are business, finance, marketing, analysis, gears, strategy.

Product Development And Testing Ppt Images Gallery
This is a product development and testing ppt images gallery. This is a five stage process. The stages in this process are business, strategy, finance, management, analysis.
Results Ppt Powerpoint Presentation Infographics File Formats
This is a results ppt powerpoint presentation infographics file formats. This is a three stage process. The stages in this process are analysis, icon, business, marketing, strategy, finance.

Title Slide Ppt Powerpoint Presentation Inspiration Graphics Example
This is a title slide ppt powerpoint presentation inspiration graphics example. This is a two stage process. The stages in this process are business, analysis, marketing, strategy, finance.

Financial Ppt PowerPoint Presentation Model Backgrounds
This is a financial ppt powerpoint presentation model backgrounds. This is a two stage process. The stages in this process are business, finance, marketing, analysis, strategy.
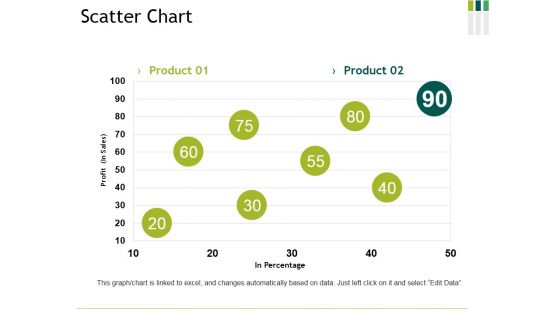
Scatter Chart Ppt PowerPoint Presentation Ideas Summary
This is a scatter chart ppt powerpoint presentation ideas summary. This is a two stage process. The stages in this process are scatter chart, finance, analysis, business, management.
Bonds Contribution Ppt PowerPoint Presentation Gallery Themes
This is a bonds contribution ppt powerpoint presentation gallery themes. This is a two stage process. The stages in this process are finance, business, management, strategy, analysis.
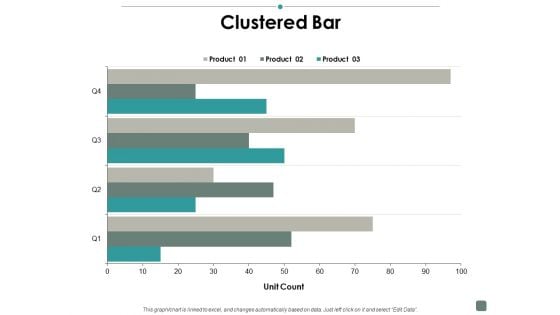
Clustered Bar Contribution Ppt PowerPoint Presentation Slides Example
This is a clustered bar contribution ppt powerpoint presentation slides example. This is a three stage process. The stages in this process are finance, business, management, strategy, analysis.
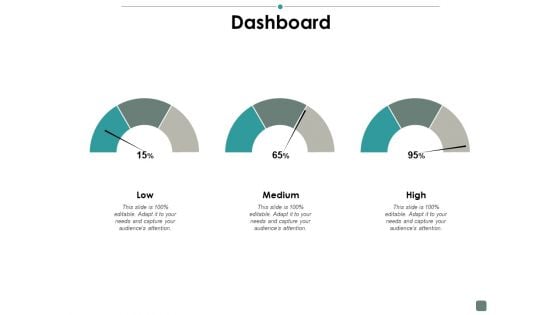
Dashboard Contribution Ppt PowerPoint Presentation Summary Ideas
This is a dashboard contribution ppt powerpoint presentation summary ideas. This is a three stage process. The stages in this process are finance, business, management, strategy, analysis.
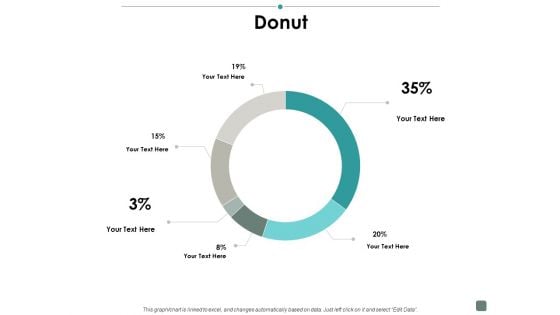
Donut Contribution Ppt PowerPoint Presentation Infographic Template Backgrounds
This is a donut contribution ppt powerpoint presentation infographic template backgrounds. This is a six stage process. The stages in this process are finance, business, management, strategy, analysis.

Financial Contribution Ppt PowerPoint Presentation Ideas Samples
This is a financial contribution ppt powerpoint presentation ideas samples. This is a three stage process. The stages in this process are finance, business, management, strategy, analysis.
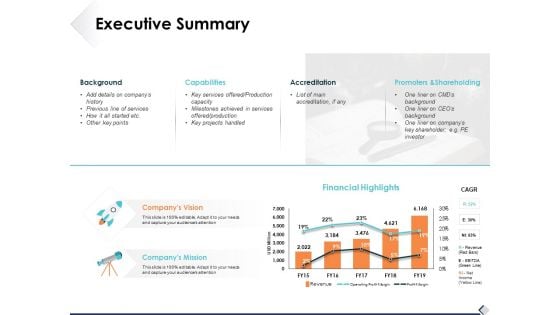
Executive Summary Ppt PowerPoint Presentation Outline Example Introduction
This is a executive summary ppt powerpoint presentation outline example introduction. This is a two stage process. The stages in this process are icons, finance, strategy, analysis, marketing.
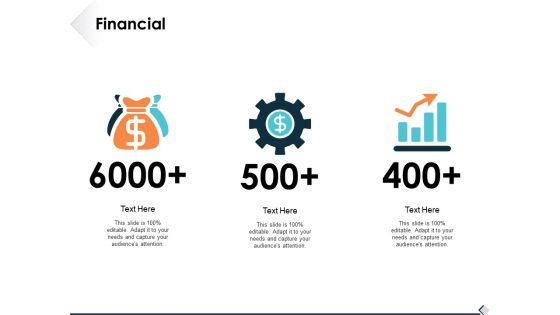
Financial Percentage Ppt PowerPoint Presentation File Gallery
This is a financial percentage ppt powerpoint presentation file gallery. This is a two stage process. The stages in this process are icons, finance, strategy, analysis, marketing.
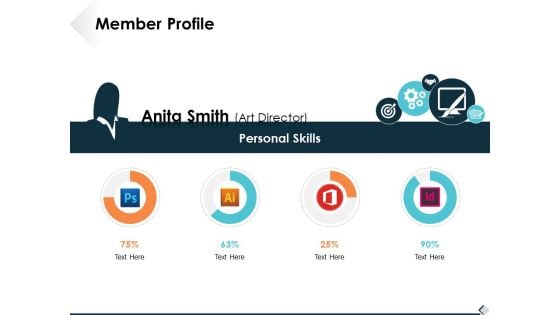
Member Profile Ppt PowerPoint Presentation Slides Portrait
This is a member profile ppt powerpoint presentation slides portrait. This is a four stage process. The stages in this process are icons, finance, strategy, analysis, marketing.
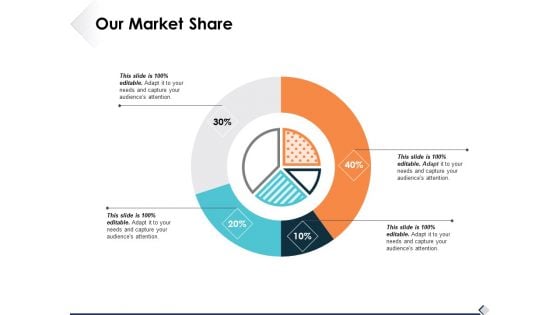
Our Market Share Ppt PowerPoint Presentation Infographics Inspiration
This is a our market share ppt powerpoint presentation infographics inspiration. This is a four stage process. The stages in this process are business, finance, strategy, analysis, marketing.
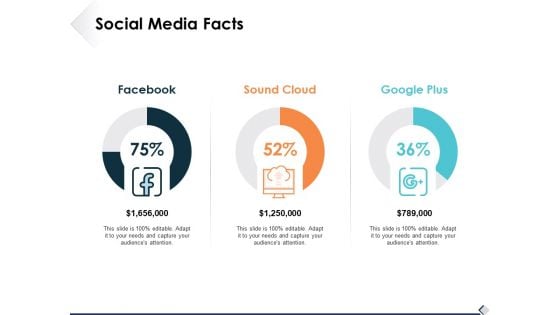
Social Media Facts Ppt PowerPoint Presentation Model Mockup
This is a social media facts ppt powerpoint presentation model mockup. This is a three stage process. The stages in this process are analysis, marketing, icons, finance, strategy.
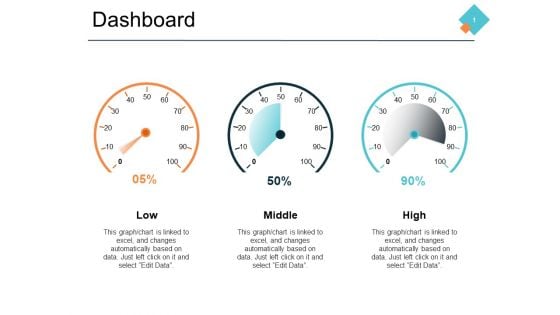
Dashboard Marketing Ppt PowerPoint Presentation Ideas Inspiration
This is a dashboard marketing ppt powerpoint presentation ideas inspiration. This is a three stage process. The stages in this process are finance, management, strategy, analysis, marketing.
Financial Icon Marketing Ppt PowerPoint Presentation Styles Inspiration
This is a financial icon marketing ppt powerpoint presentation styles inspiration. This is a two stage process. The stages in this process are finance, management, strategy, analysis, marketing.
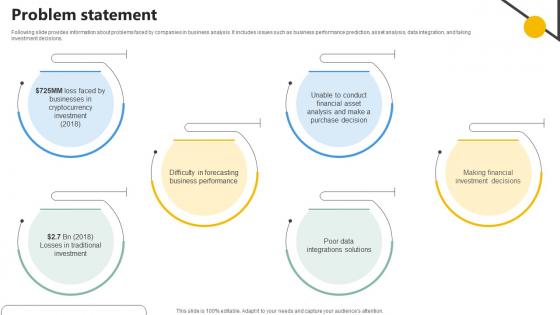
Problem Statement Analytics Company Investor Funding Elevator
Following slide provides information about problems faced by companies in business analysis. It includes issues such as business performance prediction, asset analysis, data integration, and taking investment decisions.Are you in need of a template that can accommodate all of your creative concepts This one is crafted professionally and can be altered to fit any style. Use it with Google Slides or PowerPoint. Include striking photographs, symbols, depictions, and other visuals. Fill, move around, or remove text boxes as desired. Test out color palettes and font mixtures. Edit and save your work, or work with colleagues. Download Problem Statement Analytics Company Investor Funding Elevator and observe how to make your presentation outstanding. Give an impeccable presentation to your group and make your presentation unforgettable. Following slide provides information about problems faced by companies in business analysis. It includes issues such as business performance prediction, asset analysis, data integration, and taking investment decisions.
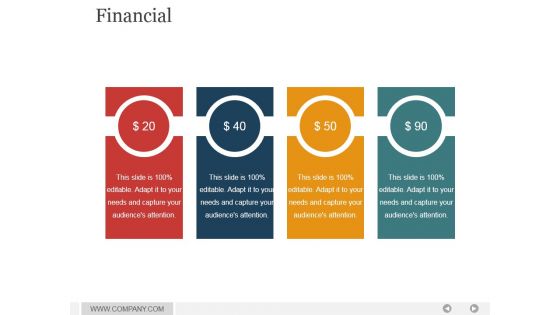
Financial Ppt PowerPoint Presentation Graphics
This is a financial ppt powerpoint presentation graphics. This is a four stage process. The stages in this process are business, finance, marketing, management, analysis.
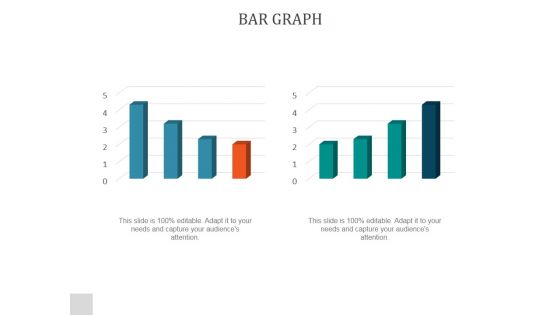
Bar Graph Ppt PowerPoint Presentation Example 2015
This is a bar graph ppt powerpoint presentation example 2015. This is a two stage process. The stages in this process are bar graph, finance, marketing, analysis, business.

Performance Attribution Ppt PowerPoint Presentation Graphics
This is a performance attribution ppt powerpoint presentation graphics. This is a six stage process. The stages in this process are business, strategy, marketing, analysis, success, finance.
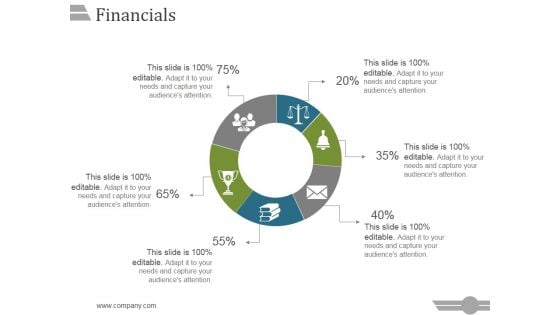
Financials Ppt PowerPoint Presentation Slide
This is a financials ppt powerpoint presentation slide. This is a three stage process. The stages in this process are business, strategy, marketing, analysis, success, finance.
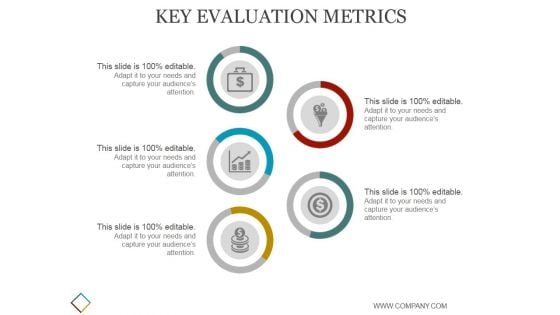
Key Evaluation Metrics Ppt PowerPoint Presentation Deck
This is a key evaluation metrics ppt powerpoint presentation deck. This is a five stage process. The stages in this process are business, strategy, marketing, analysis, finance, compare.
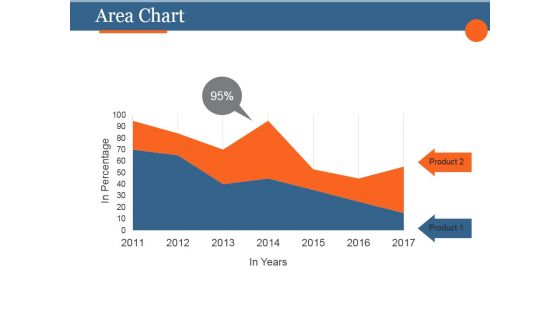
Area Chart Ppt PowerPoint Presentation Images
This is a area chart ppt powerpoint presentation images. This is a two stage process. The stages in this process are business, strategy, marketing, analysis, finance.
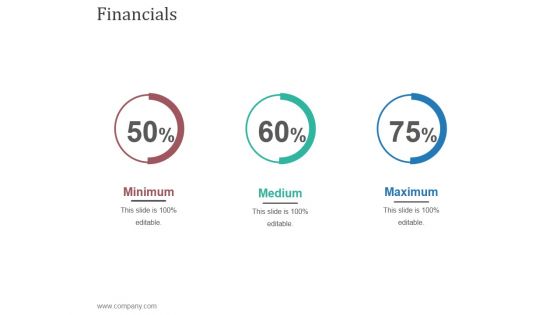
Financials Ppt PowerPoint Presentation Show
This is a financials ppt powerpoint presentation show. This is a three stage process. The stages in this process are business, strategy, analysis, marketing, finance.
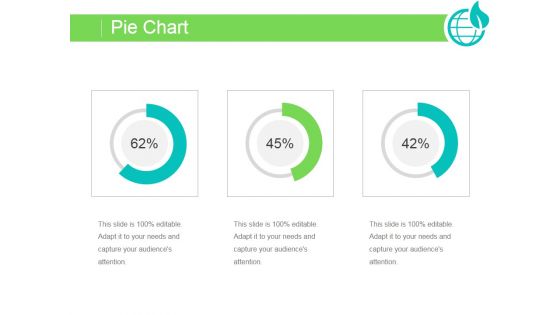
Pie Chart Ppt PowerPoint Presentation Template
This is a pie chart ppt powerpoint presentation template. This is a three stage process. The stages in this process are business, strategy, marketing, analysis, finance.
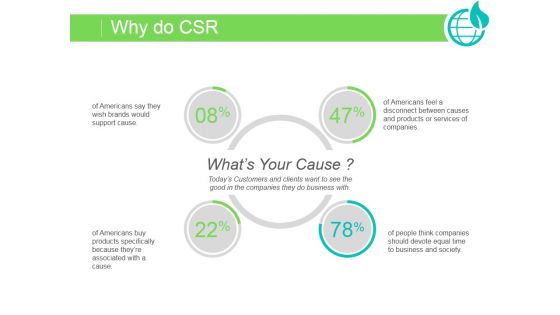
Why Do Csr Ppt PowerPoint Presentation Good
This is a why do csr ppt powerpoint presentation good. This is a four stage process. The stages in this process are business, strategy, marketing, analysis, finance.
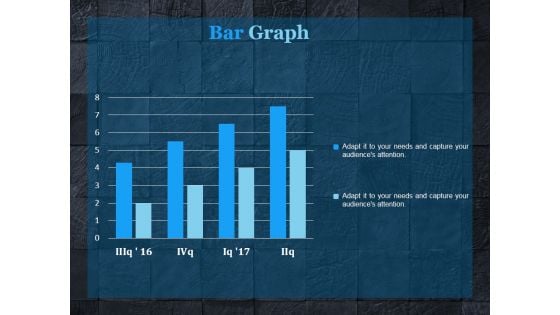
Bar Graph Ppt PowerPoint Presentation Sample
This is a bar graph ppt powerpoint presentation sample. This is a four stage process. The stages in this process are bar graph, finance, marketing, strategy, analysis, business.
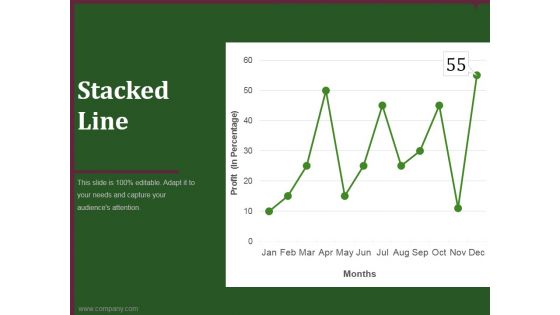
Stacked Line Ppt PowerPoint Presentation Professional
This is a stacked line ppt powerpoint presentation professional. This is a twelve stage process. The stages in this process are business, marketing, analysis, finance, growth strategy.
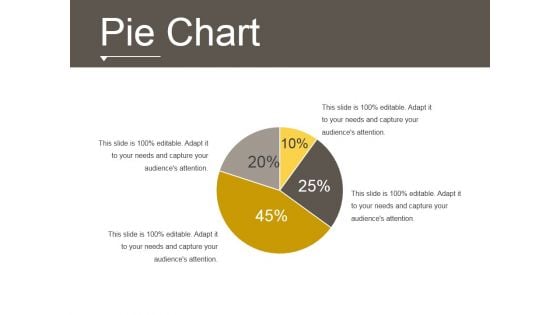
Pie Chart Ppt PowerPoint Presentation Images
This is a pie chart ppt powerpoint presentation images. This is a four stage process. The stages in this process are business, strategy, analysis, marketing, finance, pie chart.
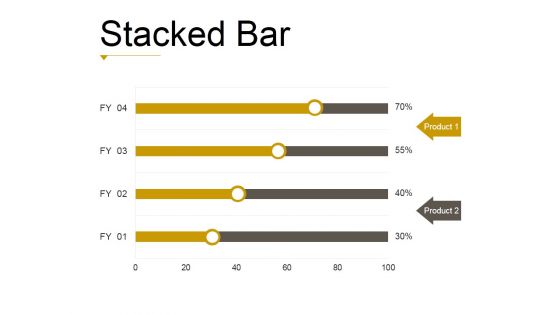
Stacked Bar Template 1 Ppt PowerPoint Presentation Gallery
This is a stacked bar template 1 ppt powerpoint presentation gallery. This is a four stage process. The stages in this process are business, strategy, analysis, marketing, finance.
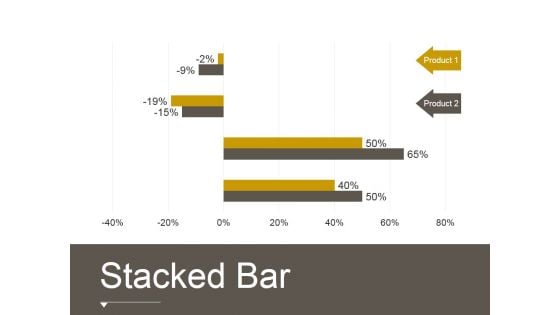
Stacked Bar Template 2 Ppt PowerPoint Presentation Deck
This is a stacked bar template 2 ppt powerpoint presentation deck. This is a two stage process. The stages in this process are business, strategy, analysis, marketing, finance.


 Continue with Email

 Home
Home


